Abstract
Unlike healthy adult tissues, cancers produce energy mainly by aerobic glycolysis instead of oxidative phosphorylation1. This adaptation, called the Warburg effect, may be a feature of all dividing cells, both normal and cancerous2, or it may be specific to cancers3. Whether in a normally growing tissue during development, proliferating and postmitotic cells produce energy in fundamentally different ways is not known. Here we show in the embryonic Xenopus retina in vivo, that dividing progenitor cells depend less on oxidative phosphorylation for ATP production than non-dividing differentiated cells, and instead use glycogen to fuel aerobic glycolysis. The transition from glycolysis to oxidative phosphorylation is connected to the cell differentiation process. Glycolysis is indispensable for progenitor proliferation and biosynthesis, even when it is not used for ATP production. These results suggest that the Warburg effect can be a feature of normal proliferation in vivo, and that the regulation of glycolysis and oxidative phosphorylation is critical for normal development.
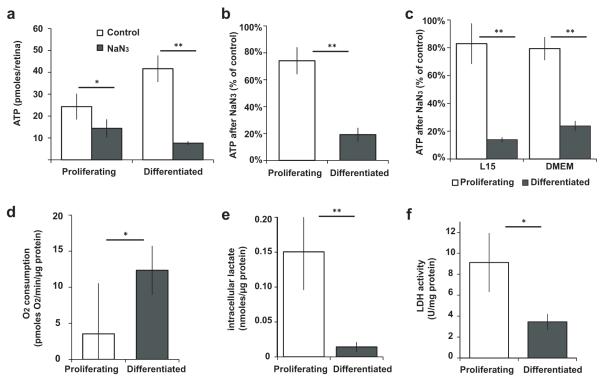
We investigated the metabolic properties of a growing embryonic tissue, the retina of the frog Xenopus laevis, whose cells contain their own nutrient supply4, allowing metabolic measurements of cells feeding on their intrinsic physiological nutrients. Retinal cells are all proliferative until stage 25, when differentiation begins, and by stage 41 cell cycle exit in the central retina is complete5. To test whether proliferating and differentiated cells produce ATP in different ways, we inhibited oxidative phosphorylation by incubating embryos for 15 minutes with NaN3, which inhibits Complex IV of the electron transport chain. ATP levels in the retina fell by 41% at stage 25, compared to 82% at stages 42-44 (Fig. 1a). The smaller drop in proliferating cells was not simply due to a slower ATP burn rate, because incubation with NaN3 for 1 hour did not further decrease ATP (Supplementary Fig. 1a). To test whether this metabolic difference was intrinsic to retinal cells, we dissected retinas in Modified Barth’s Solution (MBS), a salt buffer without nutrients. ATP levels in proliferating explants fell by significantly less than in differentiated explants after NaN3 (Fig. 1b and Supplementary Fig. 1b). Similar results followed inhibition of Complex III with Antimycin A or of ATP synthase with Oligomycin (Supplementary Fig. 1c-d). Differentiated cells might appear more oxidative because they rely more on external nutrients, however in galactose-containing L15 medium or glucose-containing DMEM, ATP in differentiated but not proliferating explants was still severely depleted after NaN3 (Fig. 1c). Therefore proliferating cells rely less on oxidative phosphorylation for ATP than differentiated cells in vivo or ex vivo, irrespectively of external nutrients. Proliferating cells from freshly explanted retinas consumed less O2 in oxidative phosphorylation than differentiated cells (Fig. 1d). Intracellular lactate (Fig. 1e) and lactate dehydrogenase activity (LDH) (Fig. 1f) in vivo were elevated in proliferating compared to differentiated cells, suggesting increased glycolysis.
Figure 1.
Proliferating cells rely less than differentiated cells on oxidative phosphorylation for ATP, and have higher glycolysis. (a-c) ATP in proliferating (P) or differentiated (D) retinas after inhibition of oxidative phosphorylation with NaN3 (a) for 15 minutes in vivo, showing ATP per retina (P, n=5, p=0.03; D, n=5, p=5×10⁻⁶); (b) for 10 minutes in explants in MBS, showing % ATP compared to controls (P, n=13, p=0.002; D, n=11, p=3×10⁻⁵ compared to controls; P-D comparison, p=4×10⁻⁸); (c) in explants in L15 (P, n=5, p=0.3; D, n=5, p=0.0009 compared to controls; P-D comparison, p=4×10⁻⁷) or DMEM (P, n=4, p=0.06; D, n=5, p=5×10⁻⁷ compared to controls; P-D comparison, p=10−5). (d) Rate of oxygen consumption in fresh retinal explants in L15 (n=6, p=0.03). (e) Intracellular lactate of proliferating and differentiated retinas in vivo (P, n=5; D, n=7; p=10−4). (f) LDH activity of proliferating and differentiated retinas (n=7, p=0.003). Error bars in all figures show 95% confidence intervals; * 0.001 < p < 0.05; ** p < 0.001
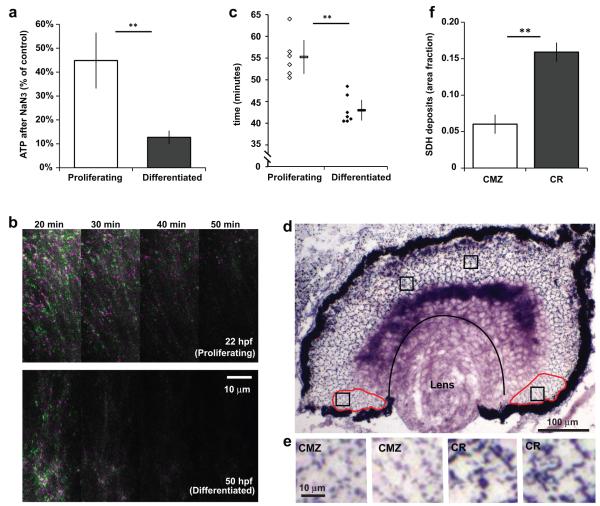
Is a reduced dependence on oxidative phosphorylation peculiar to the embryonic Xenopus retina with its store of intracellular nutrients? To answer this question, we looked at the embryonic zebrafish retina, where nutrients are delivered by the circulation. In these animals, differentiated cells in freshly explanted 78 hours post fertilization (hpf) retinas lost significantly more of their ATP after NaN3 than 26 hpf proliferating cells (Fig. 2a). We took advantage of the transparency of zebrafish embryos to image in vivo an energy consuming process, microtubule polymerization, using EB3-GFP6, which moves with the plus end of polymerizing microtubules. After Antimycin A treatment, retinal progenitors kept up EB3 motion for significantly longer than differentiated neurons (Fig. 2b-c and Supplementary Movie). These results suggest that in the zebrafish retina, as in Xenopus, differentiated cells are more reliant on oxidative phosphorylation compared to proliferating cells.
Figure 2.
Metabolic differences between progenitors and differentiated cells are also present in the postembryonic retinal stem cell niche, and in the zebrafish retina. (a) ATP levels in freshly explanted zebrafish retinas in L15 after inhibition of oxidative phosphorylation with NaN3 for 10 minutes (P, n=14, p=0.0002; D, n=15, p=4×10⁻⁸; P-D comparison, p=8×10⁻⁷). (b) EB3-GFP imaging in the zebrafish retina. Each panel is the merged image of two frames 20 seconds apart, coloured green or magenta, at the indicated time after Antimycin A. Dots that moved between frames should be green or magenta. Proliferating cells (top) keep up EB3-GFP motion for longer than differentiated cells (bottom). (c) Time taken after Antimycin A for the EB3-GFP motion to stop in differentiated 50-54 hpf retinas (n=7 movies) and proliferating 22-26 hpf retinas (n=6). Averages shown next to individual data points (p=0.0002). (d) Dark deposits as a result of SDH activity in a retinal section that includes proliferating ciliary margin zone cells (CMZ, circumscribed in red) and differentiated central retina cells (CR, region between the pigmented epithelium, lens and CMZ). (e) Magnification of the boxes in (d) showing that deposits in the CMZ are both fainter and less dense than in the CR. (f) Quantification of the area fraction covered by deposits (n=43, p<10−10).
Do proliferating cells in a stem cell niche also depend less on oxidative phosphorylation? The frog retina continues to grow through life by addition of cells from the ciliary margin7. Activity of succinate dehydrogenase (SDH), a citric acid cycle and electron transport chain enzyme, often indicates oxidative activity, and is used to distinguish aerobic from glycolytic muscle fibers8. SDH activity was lower in the ciliary margin than in the differentiated central retina in vivo (Fig. 2d-f), consistent with the idea that dividing cells respire less than differentiated cells even when they are neighbours in the same tissue.
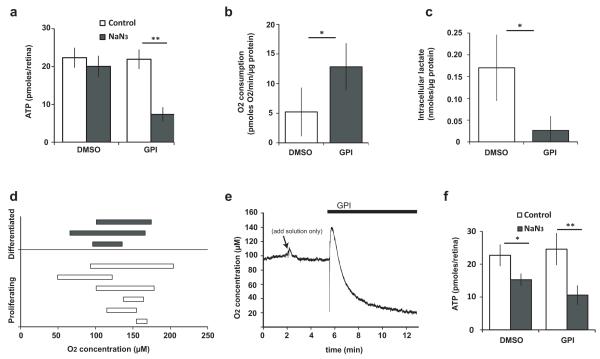
To test if proliferating cells produce ATP by glycolysis, stage 25 retinal explants were incubated with 2-deoxy-D-glucose (2DG), which inhibits glycolysis by blocking the ability of hexokinase to phosphorylate glucose to glucose-6-phosphate. 2DG, however, had no effect on ATP in the presence or absence of NaN3, or on intracellular lactate (Supplementary Fig. 1e-f). We wondered, therefore, if there were another entry into the glycolytic pathway in these embryonic Xenopus cells, which, for example, have abundant intracellular glycogen9, 10. Glycogen is broken down to glucose-1-phosphate, which is converted to glucose-6-phosphate and enters glycolysis, bypassing hexokinase. Incubation of stage 25 retinas with a Glycogen Phosphorylase inhibitor (GPI)11 did not affect ATP levels. However, ATP now became sensitive to NaN3 (Fig. 3a). GPI-treated proliferating retinal explants used more oxygen in oxidative phosphorylation than controls (Fig. 3b), and produced less lactate (Fig. 3c). Addition of extracellular carbohydrate was insufficient to support non-oxidative ATP generation in the presence of GPI (Supplementary Fig. 1g). Access to glycogen stores is therefore required for aerobic glycolysis in these proliferating cells, and in its absence, they shift to oxidation of other endogenous substrates4. High glycogen levels have been reported in some cancers12, and glycogen phosphorylase inhibition can reduce growth in cancer cell lines13. In conjunction with upregulated glucose transport, glycogen deposition may therefore also promote glycolysis in some proliferating cells that feed externally, similarly to its proposed function in astrocytes15, particularly when the nutrient supply is developing or fluctuating.
Figure 3.
Inhibition of glycogen breakdown shifts energy production from glycolysis to oxidative phosphorylation. (a) ATP levels in freshly explanted proliferating retinas in MBS pre-incubated with GPI for 20 minutes, followed by 10 minutes of NaN3 (DMSO, n=22, p>0.05; GPI, n=27, p=5×10⁻¹²). (b) Rate of oxygen consumption in fresh retinal explants incubated with GPI in L15 (n=9, p<0.05). (c) Intracellular lactate in retinal explants incubated for 3 hours with GPI (n=4, p=0.01). (d) Each bar represents the range of [O2] sampled from various points in the retina of a live embryo at stage 25 (proliferating) or stage 41 (differentiated). (e) Addition of GPI in the medium while recording from a specific point in the proliferating retinas lowers [O2] (4/4 experiments, decrease ranging from 8-73 μM O2, depending on the depth sampled from the surface; no decrease observed with control solutions; the momentary upward spike is a response to adding more solution). (f) Inhibition of oxidative phosphorylation with NaN3 at stage 25 in vivo reduced ATP in the retina to a greater extent in GPI treated embryos (57% drop, n=8, p=0.0004) compared to controls (33% drop, n=9, p=0.005).
Despite the ability of proliferating cells to become facultatively aerobic in explants, we wondered whether they might be obligatorily glycolytic in vivo because of a hypoxic environment compared to differentiated cells, as has been suggested for some adult stem cells14. We therefore recorded oxygen concentrations in vivo using an oxygen electrode. Oxygen levels were similar in proliferating and differentiated retinas (Fig. 3d). Incubation of embryos with GPI decreased local [O2] in proliferating retinas (Fig. 3e), consistent with increased oxygen consumption15 and retinas became more dependent on oxidative phosphorylation for ATP (Fig. 3f). Therefore, the glycolytic metabolism of progenitors in explants or in vivo is not due to restricted access to oxygen, or to impairment of the respiratory machinery, and is also not due to insufficiency of oxidative phosphorylation to serve energetic demands. Rather, it appears that these cells choose to be glycolytic.
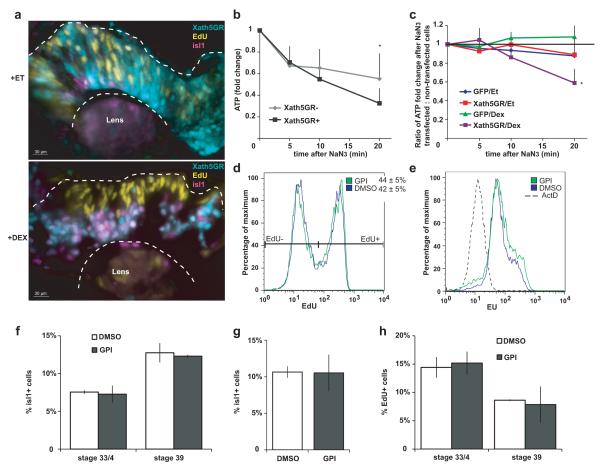
To investigate if metabolism is regulated by the cellular differentiation program, we forced progenitors to exit the cell cycle prematurely and to differentiate into the first-born retinal neurons, retinal ganglion cells (RGCs). Xath5GR, an inducible version of the transcription factor Xath516, was expressed by injection of RNA in vivo and activated by Dexamethasone at the beginning of neurogenesis at stage 25. This led to rapid cell cycle exit and precocious isl1 expression, which marks RGCs and other differentiated cells (Fig. 4a, Supplementary Fig. 2). Xath5GR-positive cells sorted from stage 37/8 retinas were more dependent on oxidative phosphorylation for ATP compared to Xath5GR-negative cells from the same retinas (Fig. 4b-c). This indicates that the metabolic shift to oxidation can be influenced by the same transcription factors that control cell differentiation.
Figure 4.
Cell differentiation can affect energy metabolism, while shifting energy metabolism to oxidative phosphorylation does not influence aspects of proliferation and differentiation. (a) Activation of Xath5GR (expressed in cyan cells) by dexamethasone (bottom panel) promotes cell cycle exit, migration to the basal layer where ganglion cells normally reside, and expression of isl1, compared to non-expressing cells in the same retina, or to Xath5GR-expressing cells receiving ethanol solvent (top panel). (b) Sorted Xath5GR-positive cells lose ATP faster after NaN3 addition compared to Xath5GR-negative cells in the same retina (n=4, p<0.05 at t=20). (c) The ratio of ATP remaining after NaN3 in construct-expressing : non-expressing cells from the same retinas is <1 at t=20 in the Xath5GR+Dex condition and not when dexamethasone is omitted or when GFP mRNA is injected with or without dexamethasone (n=4, p=0.04). (d) GPI does not change the proportion of cells incorporating the nucleotide analogue ethynyl deoxyuridine (EdU) in DNA after a brief pulse, nor the amount of EdU per cell (n=9). (e) GPI for 8-10 hours in explants in MBS does not change the amount of the nucleotide analogue 5-ethynyl uridine (EU) incorporated into RNA (n=6). The dashed histogram shows the background fluorescence after inhibition of RNA synthesis with Actinomycin D. Quantification is shown in Fig. 5h. (f) Incubation of stage 25 embryos for 1 or 2 days with GPI in vivo does not change the proportion of isl1+ differentiated cells present by stages 33/4 or 39 (n=9, p>0.05). (g) Incubation of stage 25 explants for 1 day with GPI in 1x MBS does not change the proportion of isl1+ differentiated cells present by stage 35/6 (n=4, p>0.05). (h) Incubation of stage 25 embryos for 1 or 2 days with GPI in vivo does not change the proportion of cells that are labelled by a pulse of EdU and therefore have not exited the cell cycle by stages 33/4 or 39 (n=5, p>0.05).
The metabolic switch after GPI presented the opportunity to test the proposed role of the Warburg effect in proliferation in our system. Surprisingly, treatment of stage 25 retinal explants for 5-10 hours (Supplementary Fig. 3a) with GPI did not affect proliferation, or rates of RNA and protein synthesis (Fig. 4d-e, Supplementary Fig. 3b-c). Nor did the proportion of cells that exited the cell cycle and differentiated into isl1-positive cells change after 1 or 2 days of GPI in vivo or in explants (Fig. 4f-h). These results suggest that the use of glycolysis for energy production may not be absolutely required for normal proliferation or aspects of differentiation in the progenitors.
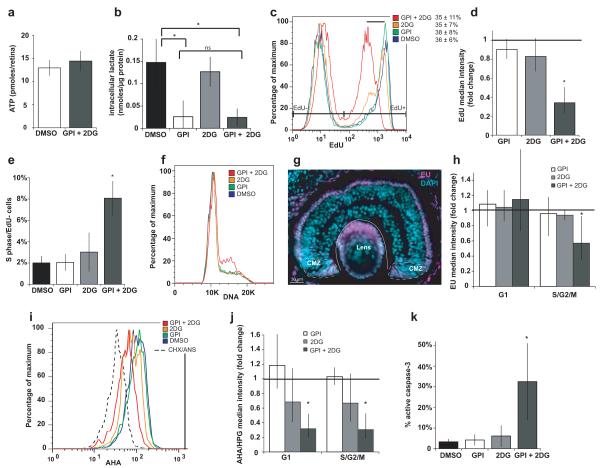
Since glycolysis via glycogen is not required for proliferation, perhaps cells may use other endogenous nutrients to run glycolysis when glycogen is cut off. We therefore blocked both glycolytic entry points with a combination of GPI and 2DG. Cells maintained their ATP (Fig. 5a), and lactate did not decrease further than with GPI alone (Fig. 5b). But after 8-10 hours of this complete block in explants in MBS, the rate of EdU incorporation diminished (Fig. 5c-d) and cells slowed down or arrested in S phase (Fig. 5e-f, Supplementary Fig. 3d) without overt changes in the proportion of new G1 cells entering S phase, or the proportion of G2/M cells that remained EdU negative after a short EdU pulse17 (Supplementary Fig. 3e-g). These results suggest that the rate of S phase is compromised when glycolysis is blocked. We found that progenitors have high levels of RNA synthesis compared to most differentiated cells (Fig. 5g), particularly in S/G2 (Supplementary Fig. 3h) and blocking glycolysis reduced RNA synthesis in S/G2 phase (Fig. 5h). Protein synthesis was reduced throughout the cell cycle (Fig 5i-j,) and progenitors went into apoptosis (Fig. 5k). Therefore some amount of glycolysis is required for normal rates of proliferation, RNA and protein synthesis and survival of retinal progenitors, even if energy levels can be maintained by oxidative phosphorylation.
Figure 5.
Complete glycolytic block inhibits progenitor proliferation, biosynthesis and survival. (a) ATP in explants in MBS does not change after 30 minutes of GPI+2DG (n=20). (b) Intracellular lactate after 3 hours of GPI and/or 2DG (data from the same set of experiments as Fig. 3c and Supplementary Fig. 1f; GPI + 2DG, n=6, p=0.003 compared to control, p>0.05 compared to GPI). (c-f) GPI+2DG but not either drug alone, for 8-10 hours in MBS in explants: (c-d) reduces EdU incorporation per cell after a short pulse (n=4, p=0.006) (black bar indicates shift in histogram) but not % EdU+ cells, (e) increases the proportion of S phase cells which do not incorporate EdU (n=3, p=0.02), (f) causes cells to accumulate in S phase (observed in 10/11 experiments for GPI+2DG; 3/13 for GPI and 1/11 for 2DG). (g) The nucleotide analogue 5-ethynyl-uridine (EU) is incorporated in RNA at much higher levels in CMZ proliferating cells and in photoreceptors compared to other retinal differentiated cells in vivo (stage 41). (h-k) GPI + 2DG but not either drug alone (h) reduces incorporation of EU into RNA in S/G2 (n=4, p=0.03), (i-j) reduces incorporation of the methionine analogues AHA or HPG into proteins in G1 (n=4, p=0.02) and S/G2 (n=4, p=0.02) (dashed histogram is background fluorescence when the protein synthesis inhibitors cycloheximide + anisomycin are used with AHA), and (k) increases the proportion of active-caspase-3+ apoptotic cells (n=5, p=0.03).
Previous work found proliferating lymphocytes18 and thymocytes19 to be glycolytic, while embryonic stem cells showed either increased20 or decreased oxidative phosphorylation compared to more differentiated cells21, 22. A major limitation of these studies of cultured cells is that metabolism in vitro may depend on the experimentally defined nutrient or oxygen conditions23. Our results argue that the Warburg effect can be a feature of physiological cell proliferation in vivo, and that it is connected to the differentiation process. We find that using glycolysis for energy may not be the only way to promote high biosynthesis, and speculate that when forced to turn to oxidative phosphorylation for energy, cells may operate gluconeogenic-glycolytic cycles, starting from their abundant intracellular protein and lipid stores4, in order to sustain high glycolytic rates. Additionally, carbohydrate from glycosylated protein stores, including mannose, galactose and glucosamine24, could be an alternative source for glycolysis. Xenopus retinal progenitors required glycolysis even when they did not use it for energy, indicating that, unlike some other cells, they cannot substitute glycolysis with alternative pathways such as glutaminolysis25. In yeast26 and mammalian cell lines27, energy metabolism varies with cell cycle phase, and it will be interesting to examine the connections between energy metabolism and cell cycle progression in development. Previously reported changes in metabolic enzyme expression28, reactive oxygen species29 and other aspects of energy metabolism30 during differentiation, indicate that regulation of the core metabolic strategies we report here is likely to play a role in diverse developmental contexts.
Methods
ATP assays
For in vivo measurements, drugs were added in the embryo medium, retinas dissected into 1% perchloric acid and ATP measured using the ATP bioluminescence kit CLS II (Roche). For measurements in explants, retinas were dissected in 1x MBS or L15 or DMEM (Invitrogen) and drugs immediately added for the duration indicated in the text.
Oxygen consumption
Retinas were dissected in either 1x MBS or L15 and oxygen consumption was immediately measured using Clark-type oxygen electrodes with fast-responding FEP membranes in respiration chambers (Strathkelvin Instruments, Strathkelvin, UK). The rate of oxygen consumption due to oxidative phosphorylation was the difference before and after 5 μM Antimycin + 4 mM NaN3. Soluble protein content for normalisation was measured using the BCA assay kit (Thermo Scientific).
LDH activity
Freshly dissected retinas of stage 25-28 and stage 44-45 embryos were sonicated in 0.1x MBS. 48 mM pH=7.4 Tris buffer, 0.4 mM NADH (Sigma) and 0.9 mM sodium pyruvate (Sigma) were added, and the rate of NADH consumption measured31. Total soluble protein for normalisation was extracted using the same procedure.
Lactate assays
Dissected retinas were immediately frozen on dry ice, intracellular lactate was extracted by sonication in 1x MBS and measured using a Fluorometric Lactate assay kit (Abcam) in accordance with manufacturer’s instructions. Lactate values were normalized to soluble protein content. For drug tests, fresh retinal explants were incubated at room temperature with 2DG or GPI for 3 hours before analysis.
EB3-GFP imaging
Embryos were injected with EB3-GFP mRNA6, and grown until 22-26 hpf or 50-54 hpf. Embryos from both stages were mounted on the same dish and imaged simultaneously by spinning disk confocal microscopy every 20 seconds.
SDH histochemistry
Fresh unfixed cryostat sections were incubated at room temperature for 2 hours with 50 mM sodium succinate, 1 mM 1-methoxy phenazine methosulphate, 0.5 mM sodium azide, 1.3 mM nitroblue tetrazolium (NBT) in 100 mM phosphate buffer (all from Sigma). Oxidation of succinate by the endogenous SDH reduces NBT to give a dark cytoplasmic stain. Omission of succinate from the mixture resulted in negligible staining showing that the staining was due to specific SDH activity (data not shown). The fraction of the retinal area covered by the deposits was measured automatically using CellProfiler32.
[O2] measurements in vivo
[O2] was measured using a probe with a tip < 10 μm (Unisense, Aarhus, Denmark), which was calibrated by immersion in N2-bubbled water, containing negligible O2, and air-equilibrated water, containing 210 μM O215. Experiments were performed in a chamber containing 1x MBS and drugs were added directly to the chamber during the recording period. The embryo was immobilised under a harp, with one eye (skin removed) facing upwards. The O2 probe was lowered directly into the eye in a stepwise fashion, to maximum depths of 200 μm. Stepping deeper in the retina incrementally lowered the recorded [O2] (Supplementary Fig. 4a). Adding NaN3 rapidly increased local [O2], showing that O2 consumption during respiration is responsible for lowering [O2] inside the embryo (Supplementary Fig. 4b).
Xath5GR experiments
150 pg of Xath5GR mRNA was coinjected with 70 pg of GFP mRNA in the 2 dorsal blastomeres of the 8 cell stage blastula, and 4 μg/ml dexamethasone was added at stage 25. Freshly dissected retinas were dissociated, cells on ice were sorted based on GFP intensity into GFP+ and GFP− tubes in 1x MBS + 0.5% BSA using a MoFlo (Dako), and each tube was split into 4 microplate wells, for timepoints t=0, 5, 10, 20 minutes in the ATP/NaN3 assay. For flow cytometric analysis, after in vivo dexamethasone induction at stage 25, retinas were dissected at the indicated stage and dissociated, fixed and stained for isl1. For EdU, explants were incubated for 1 hour in EdU before fixation. For staining on sections, EdU was injected in the embryo for 1-2 hours, and the embryo was fixed and sectioned.
Flow cytometry, DNA, RNA and protein synthesis assays
The following reagents (Click-iT assay kits, Invitrogen) were used on retinal explants in 1x MBS, in the time immediately before dissociation and fixation: 0.5 mM EdU (DNA) for 1-2 hours, 2-5 mM EU (RNA) for 2-5 hours, 1 mM AHA or HPG (protein) for 2-4 hours. Cells were dissociated using trypsin digestion for 10 minutes, fixed in 2% formaldehyde for 30 minutes on ice, stained with antibodies (anti-active caspase 3 (rabbit, BD Biosciences), anti-GFP (rabbit, Roche), anti-isl1 (mouse, DSHB)) and/or the Click-iT assay kits according to manufacturer’s instructions and with DAPI (1 μg/ml), and analysed on a Cyan-ADP (Dako). Results were analysed using FlowJo (TreeStar). To calculate fold changes in median fluorescent intensity (MFI) in EU or AHA/HPG incorporation, for each experiment the background MFI (when actinomycin D or cycloheximide + anisomycin were used to inhibit RNA and protein synthesis respectively) was deducted from the MFI of the other conditions. For in vivo DNA or RNA synthesis, EdU or EU were injected in embryos 2 hours (EdU) or 5 hours (EU) before fixation and embryos were fixed, cryosectioned, and slides stained using standard procedures.
Drugs
20mM NaN3 (Sigma); 36μM Antimycin A (Sigma); 25 μM Glycogen Phosphorylase Inhibitor (GPI), 1-(3-(3-(2-Chloro-4,5-difluorobenzoyl)ureido)-4-methoxyphenyl)-3-methylurea (Calbiochem); 20 mM 2DG (Sigma); 20μM Oligomycin (Sigma). In experiments with GPI in vivo, the skin in the anterior embryo was removed to allow drug penetration.
Statistics
Results were analysed with a two-tailed t-test and error bars shown are 95% confidence intervals.
Supplementary Material
Acknowledgements
We are grateful to Ferdia Gallagher and Helen Sladen for help with the LDH assays, Nigel Miller for cell sorting and David Attwell for advice on the oxygen concentration measurements. We thank John Bixby, Christine Holt, Sean Morrison, Shenghui He and Randall Johnson for comments on the manuscript. We thank the Wellcome Trust (W.A.H.) and Gonville and Caius College and the Royal Commission for the Exhibition of 1851 (M.A.) for funding.
Footnotes
Author Information The authors declare no competing financial interests.
References
- 1.Warburg O. On the origin of cancer cells. Science. 1956;123:309–314. doi: 10.1126/science.123.3191.309. [DOI] [PubMed] [Google Scholar]
- 2.Vander Heiden MG, Cantley LC, Thompson CB. Understanding the Warburg effect: the metabolic requirements of cell proliferation. Science. 2009;324:1029–1033. doi: 10.1126/science.1160809. [DOI] [PMC free article] [PubMed] [Google Scholar]
- 3.Gatenby RA, Gillies RJ. Why do cancers have high aerobic glycolysis? Nat Rev Cancer. 2004;4:891–899. doi: 10.1038/nrc1478. [DOI] [PubMed] [Google Scholar]
- 4.Jorgensen P, Steen JAJ, Steen H, Kirschner MW. The mechanism and pattern of yolk consumption provide insight into embryonic nutrition in Xenopus. Development. 2009;136:1539–1548. doi: 10.1242/dev.032425. [DOI] [PMC free article] [PubMed] [Google Scholar]
- 5.Holt CE, Bertsch TW, Ellis HM, Harris WA. Cellular determination in the Xenopus retina is independent of lineage and birth date. Neuron. 1988;1:15–26. doi: 10.1016/0896-6273(88)90205-x. [DOI] [PubMed] [Google Scholar]
- 6.Norden C, Young S, Link BA, Harris WA. Actomyosin is the main driver of interkinetic nuclear migration in the retina. Cell. 2009;138:1195–1208. doi: 10.1016/j.cell.2009.06.032. [DOI] [PMC free article] [PubMed] [Google Scholar]
- 7.Agathocleous M, Harris WA. From progenitors to differentiated cells in the vertebrate retina. Annu Rev Cell Dev Biol. 2009;25:45–69. doi: 10.1146/annurev.cellbio.042308.113259. [DOI] [PubMed] [Google Scholar]
- 8.Burke RE, Levine DN, Zajac FE., 3rd Mammalian motor units: physiological-histochemical correlation in three types in cat gastrocnemius. Science. 1971;174:709–712. doi: 10.1126/science.174.4010.709. [DOI] [PubMed] [Google Scholar]
- 9.Perry MM. Identification of glycogen in thin sections of amphibian embryos. J Cell Sci. 1967;2:257–264. doi: 10.1242/jcs.2.2.257. [DOI] [PubMed] [Google Scholar]
- 10.Rodriguez IR, Fliesler SJ. Glycogenesis in the amphibian retina: in vitro conversion of [2-3H]mannose to [3H]glucose and subsequent incorporation into glycogen. Exp Eye Res. 1990;51:71–77. doi: 10.1016/0014-4835(90)90172-q. [DOI] [PubMed] [Google Scholar]
- 11.Klabunde T, et al. Acyl ureas as human liver glycogen phosphorylase inhibitors for the treatment of type 2 diabetes. J Med Chem. 2005;48:6178–6193. doi: 10.1021/jm049034y. [DOI] [PubMed] [Google Scholar]
- 12.Takahashi S, et al. Estimation of glycogen levels in human colorectal cancer tissue: relationship with cell cycle and tumor outgrowth. J Gastroenterol. 1999;34:474–480. doi: 10.1007/s005350050299. [DOI] [PubMed] [Google Scholar]
- 13.Schnier JB, Nishi K, Monks A, Gorin FA, Bradbury EM. Inhibition of glycogen phosphorylase (GP) by CP-91,149 induces growth inhibition correlating with brain GP expression. Biochem Biophys Res Commun. 2003;309:126–134. doi: 10.1016/s0006-291x(03)01542-0. [DOI] [PubMed] [Google Scholar]
- 14.Nakada D, Levi BP, Morrison SJ. Integrating physiological regulation with stem cell and tissue homeostasis. Neuron. 2011;70:703–718. doi: 10.1016/j.neuron.2011.05.011. [DOI] [PMC free article] [PubMed] [Google Scholar]
- 15.Hall CN, Attwell D. Assessing the physiological concentration and targets of nitric oxide in brain tissue. J Physiol. 2008;586:3597–3615. doi: 10.1113/jphysiol.2008.154724. [DOI] [PMC free article] [PubMed] [Google Scholar]
- 16.Hutcheson DA, Vetter ML. The bHLH factors Xath5 and XNeuroD can upregulate the expression of XBrn3d, a POU-homeodomain transcription factor. Dev Biol. 2001;232:327–338. doi: 10.1006/dbio.2001.0178. [DOI] [PubMed] [Google Scholar]
- 17.Locker M, et al. Hedgehog signaling and the retina: insights into the mechanisms controlling the proliferative properties of neural precursors. Genes Dev. 2006;20:3036–3048. doi: 10.1101/gad.391106. [DOI] [PMC free article] [PubMed] [Google Scholar]
- 18.Wang T, Marquardt C, Foker J. Aerobic glycolysis during lymphocyte proliferation. Nature. 1976;261:702–705. doi: 10.1038/261702a0. [DOI] [PubMed] [Google Scholar]
- 19.Brand K, Hermfisse U. Aerobic glycolysis by proliferating cells: a protective strategy against reactive oxygen species. The FASEB Journal. 1997;11:388. doi: 10.1096/fasebj.11.5.9141507. [DOI] [PubMed] [Google Scholar]
- 20.Birket MJ, et al. A reduction in ATP demand and mitochondrial activity with neural differentiation of human embryonic stem cells. Journal of Cell Science. 2011;124:348–358. doi: 10.1242/jcs.072272. [DOI] [PMC free article] [PubMed] [Google Scholar]
- 21.Chung S, et al. Mitochondrial oxidative metabolism is required for the cardiac differentiation of stem cells. Nat Clin Pract Cardiovasc Med. 2007;4:S60. doi: 10.1038/ncpcardio0766. [DOI] [PMC free article] [PubMed] [Google Scholar]
- 22.Facucho-Oliveira JM, St John JC. The relationship between pluripotency and mitochondrial DNA proliferation during early embryo development and embryonic stem cell differentiation. Stem Cell Rev Rep. 2009;5:140–158. doi: 10.1007/s12015-009-9058-0. [DOI] [PubMed] [Google Scholar]
- 23.Cairns RA, Harris IS, Mak TW. Regulation of cancer cell metabolism. Nat Rev Cancer. 2011;11:85. doi: 10.1038/nrc2981. [DOI] [PubMed] [Google Scholar]
- 24.Gottlieb TA, Wallace RA. Intracellular glycosylation of vitellogenin in the liver of estrogen-stimulated Xenopus laevis. J Biol Chem. 1982;257:95–103. [PubMed] [Google Scholar]
- 25.Yang C, et al. Glioblastoma cells require glutamate dehydrogenase to survive impairments of glucose metabolism or Akt signaling. Cancer Res. 2009;69:7986–7993. doi: 10.1158/0008-5472.CAN-09-2266. [DOI] [PMC free article] [PubMed] [Google Scholar]
- 26.Tu BP, Kudlicki A, Rowicka M, McKnight SL. Logic of the yeast metabolic cycle: temporal compartmentalization of cellular processes. Science. 2005;310:1152–1158. doi: 10.1126/science.1120499. [DOI] [PubMed] [Google Scholar]
- 27.Almeida A, Bolanos JP, Moncada S. E3 ubiquitin ligase APC/C-Cdh1 accounts for the Warburg effect by linking glycolysis to cell proliferation. Proc Natl Acad Sci U S A. 2010;107:738–741. doi: 10.1073/pnas.0913668107. [DOI] [PMC free article] [PubMed] [Google Scholar]
- 28.Ozbudak EM, Tassy O, Pourquie O. Spatiotemporal compartmentalization of key physiological processes during muscle precursor differentiation. Proc Natl Acad Sci U S A. 2010;107:4224–4229. doi: 10.1073/pnas.0909375107. [DOI] [PMC free article] [PubMed] [Google Scholar]
- 29.Owusu-Ansah E, Banerjee U. Reactive oxygen species prime Drosophila haematopoietic progenitors for differentiation. Nature. 2009;461:537–541. doi: 10.1038/nature08313. [DOI] [PMC free article] [PubMed] [Google Scholar]
- 30.Lopaschuk GD, Jaswal JS. Energy metabolic phenotype of the cardiomyocyte during development, differentiation, and postnatal maturation. J Cardiovasc Pharmacol. 2010;56:130–140. doi: 10.1097/FJC.0b013e3181e74a14. [DOI] [PubMed] [Google Scholar]
- 31.Moran JH, Schnellmann RG. A rapid beta-NADH-linked fluorescence assay for lactate dehydrogenase in cellular death. J Pharmacol Toxicol Methods. 1996;36:41–44. doi: 10.1016/1056-8719(96)00071-8. [DOI] [PubMed] [Google Scholar]
- 32.Carpenter AE, et al. CellProfiler: image analysis software for identifying and quantifying cell phenotypes. Genome Biol. 2006;7:R100. doi: 10.1186/gb-2006-7-10-r100. [DOI] [PMC free article] [PubMed] [Google Scholar]
Associated Data
This section collects any data citations, data availability statements, or supplementary materials included in this article.


