

Abstract
Heterogeneity of estrogen receptor (ER) expression may be an important predictor of breast cancer therapeutic response. 18F-fluoroestradiol PET produces in vivo quantitative measurements of regional estrogen binding in breast cancer tumors. We describe within-patient (site-to-site) and between-patient heterogeneity of lesions in patients scheduled to receive endocrine therapy.
Methods
In 91 patients with a prior ER-positive biopsy, 505 lesions were analyzed for both 18F-fluoroestradiol and 18F-FDG uptake and the 18F-fluoroestradiol/18F-FDG uptake ratio. Standardized uptake values (SUVs) were recorded for up to 16 lesions per patient, of 1.5 cm or more and visible on 18F-FDG PET or conventional staging. Linear mixed-effects regression models examined associations between PET parameters and patient or lesion characteristics and estimated variance components. A reader study of SUV measurements for 9 scans further examined sources of within-patient variability.
Results
Average 18F-fluoroestradiol uptake and 18F-fluoroestradiol/18F-FDG ratio varied greatly across these patients, despite a history of ER-positive disease: about 37% had low or absent 18F-fluoroestradiol uptake even with marked 18F-FDG uptake. 18F-fluoroestradiol SUV and 18F-fluoroestradiol/18F-FDG ratio measurements within patients with multiple lesions were clustered around the patient’s average value in most cases. Summarizing these findings, the intraclass correlation coefficient (proportion of total variation that is between-patient) was 0.60 (95% confidence interval, 0.50–0.69) for 18F-fluoroestradiol SUV and 0.65 (95% confidence interval, 0.56–0.73) for the 18F-fluoroestradiol/18F-FDG ratio. Some within-patient variation in PET measures (22%–44%) was attributable to interobserver variability as measured by the reader study. A subset of patients had mixed uptake, with widely disparate 18F-fluoroestradiol SUV or 18F-fluoroestradiol/18F-FDG ratio for lesions in the same scan.
Conclusion
18F-fluoroestradiol uptake and the 18F-fluoroestradiol/18F-FDG ratio varied greatly between patients but were usually consistent across lesions in the same scan. The average 18F-fluoroestradiol SUV and 18F-fluoroestradiol/18F-FDG ratio for a limited sample of lesions appear to provide a reasonable summary of synchronous ER expression for most patients. However, imaging the entire disease burden remains important to identify the subset of patients with mixed uptake, who may be at a critical point in their disease evolution.
Keywords: estrogen receptor imaging, 18F-FES PET, heterogeneity, breast cancer
More than 70% of breast cancers are estrogen receptor–positive (ER+), and ER-directed adjuvant therapy is credited as a key factor in declines in breast cancer mortality. However, not all patients respond to endocrine therapy, and most initial responders later become refractory: the objective response rate to second-line endocrine therapy is less than 20% (1). One factor hypothesized to underlie unpredictable response and acquired resistance to endocrine therapy is heterogeneity of ER expression. Because levels of ER expression may be heterogeneous within the same patient (2-4), biopsy of a single tumor site may not be representative. ER expression may also change over time in the same patient, caused either by genetic or epigenetic loss of the receptor expression as the tumor grows and metastasizes or as the selective pressure of endocrine therapy allows the emergence of clones with low or absent ER expression (5,6). Alternatively, ER expression may be stable, but other proliferative or antiapoptotic pathways (such as HER2) may emerge to drive resistance (7). Clarifying the extent of within-patient heterogeneity of ER expression could help to identify successful strategies for overcoming endocrine resistance.
Few studies have been conducted with multiple concurrent biopsies to examine lesion-level heterogeneity in ER expression. Published assessments of concurrent ER assays are generally designed for quality control or to compare techniques and tend to attribute variation to measurement or sampling error, rather than within-patient heterogeneity (8,9). Several studies have used biopsy assay to compare ER expression in the primary tumor with later recurrences. Loss of ER expression is considered to be more common than gain of ER expression (2,10,11), but this finding has been disputed (12,13). Comparing archived primary tumor tissue and metastatic lesions sampled at rapid autopsy, Wu et al. (14) found that patients who showed substantial downregulation of ER expression in metastases (2–10 y after primary diagnosis) tended to show downregulation in all sampled lesions.
In vivo imaging using 18F-fluoroestradiol PET produces quantitative measurements of regional estrogen binding in breast cancer tumors (15). Within-patient heterogeneity in ER expression has been observed using 18F-fluoroestradiol PET (16), for 4 of 17 patients with multiple lesions scanned. 18F-fluoroestradiol PET also has potential for evaluating ER activity in bone-dominant metastatic breast cancer, a common manifestation of ER+ metastatic breast cancer that is difficult to biopsy, prone to false-negative ER by immunohistochemistry (10), and often features multiple lesions. Studies evaluating 18F-fluoroestradiol PET to predict response to ER-targeted therapy (17,18) have summarized ER expression at the patient level, as the average 18F-fluoroestradiol standardized uptake value (SUV) of target lesions. In 5 patients with 2 or more lesions analyzed, investigators at Washington University found within-patient heterogeneity in SUVs but little heterogeneity in change scores, justifying the use of averages in analysis (19). In the current study, we analyzed a larger collection of 18F-fluoroestradiol PET images to describe within-patient and between-patient heterogeneity of ER expression between tumor sites. If within-patient variation is substantial, lesion level differences in ER expression may be an important factor in endocrine therapy resistance. Characterizing the variability of ER expression between patients and within patients may also provide insight regarding the development of metastatic lesions. 18F-fluoroestradiol PET has shown promise as a predictive assay for response to endocrine therapy; this analysis addresses whether sufficient within-patient heterogeneity exists to examine response at the lesion level, as well as the patient level.
MATERIALS AND METHODS
Patient Selection
18F-fluoroestradiol PET scans for breast cancer patients scheduled to initiate, resume, or change endocrine therapy were selected for this retrospective analysis. Concomitant bisphosphonate therapy or trastuzumab was not an exclusionary criterion, but concurrent or planned cytotoxic therapy was. Additional technical requirements for inclusion were performance of a whole-body survey to evaluate all disease sites and access to an 18F-FDG PET scan conducted within 30 d of 18F-fluoroestradiol PET to assist in locating lesions. Patients were enrolled, and provided consent for, 1 of 3 18F-fluoroestradiol PET research studies. Study protocols were approved by the University of Washington Institutional Review Board and the University of Washington Radioactive Drug Research Committee.
18F-Fluoroestradiol PET
18F-fluoroestradiol was prepared according to published methods (20), as reported in our prior studies (18,21). 18F was produced using either a Siemens Eclipse or a Scanditronix MC-50 cyclotron, with quality control tests performed immediately after each synthesis to evaluate radiochemical and chemical purity and to measure specific activity. Specific activity was recorded as GBq/mmol at the time of injection (mean, 184,038 GBq/mmol; range, 7,992–1,414,917 GBq/mmol). All scans were performed on an Advance PET tomograph (GE Healthcare). After an attenuation scan of 20–25 min, an average dose of 185 MBq of 18F-fluoroestradiol was injected over 2 min (range, 117–232 MBq). Sixty minutes of dynamic imaging over a single axial field of view (not used for data analysis in this study) was followed by a 5 field-of-view torso survey from neck to pelvis, with 5 min of static imaging for each axial field of view.
Lesions in 18F-fluoroestradiol PET scans were identified using paired 18F-FDG PET images, with anatomic localization and correlation (bone scan, ultrasound, MRI, or CT) for reference. Images from patients with extensive disease or ER-negative (ER−) lesions were coregistered with 18F-FDG or CT images using the PMOD (PMOD Technologies Ltd.) fusion module to accurately locate each tumor. Regions of interest (ROIs) could then be drawn on the 18F-FDG or CT image set and applied to the 18F-fluoroestradiol image set for ER− lesions, or ROIs could be drawn on the 18F-fluoroestradiol image set for extensive disease and matched to the 18F-FDG images. Separate ROIs were drawn on nonmanipulated 18F-FDG images to report 18F-FDG data. Square ROIs, approximately 1.3 cm3 (16 pixels in the ROI), were placed over the areas of highest uptake in the tumor site on 3 adjacent imaging planes, so that the total volume for each lesion was 3.8 cm3. Up to 16 lesions were identified for each patient. Lesions with diameters smaller than 1.5 cm were excluded because of partial-volume limitations. In patients with widespread bone disease, up to 3 of the largest 18F-fluoroestradiol PET lesions corresponding to the most 18F-FDG–avid lesions were tabulated for each of 3 areas: long bones, spine, and pelvis.
The SUV was calculated using the mean or maximum uptake within the ROIs defined and corrected for total weight or lean body mass (LBM):
LBM, calculated using the James method (22), was used to mitigate discrepancies between distribution volume and weight (21). The average LBM was 49 kg (range, 39–64 kg), and the average total weight was 77 kg (range, 52–127 kg). The primary analysis was conducted with LBM adjustment of SUVs, but measures using total patient weight are also reported. Similarly, the mean SUV was the primary 18F-fluoroestradiol measure, as for earlier studies, but the maximum SUV is reported as well. 18F-fluoroestradiol maximum SUV is also used for the 18F-fluoroestradiol/18F-FDG ratio because only maximum SUV measures were available for 18F-FDG PET.
Other Study Measures
18F-FDG was produced for clinical use according to standard operating procedures (23) and was supplied either by University of Washington Medical Center Radiochemistry or by PETNET Solutions. 18F-FDG PET started 45–60 min after injection of 267–402 MBq of 18F-FDG in patients who had fasted for 4 h or more. Images were reconstructed using filtered backprojection, using the same matrix size and filter as for the 18F-fluoroestradiol images. For both 18F-FDG and 18F-fluoroestradiol PET scans, the maximum SUV was based on the pixel within an ROI with maximum tracer uptake. Clinical information such as menopausal status, primary tumor histology, and treatment history was ascertained by chart review.
The ratio of 18F-fluoroestradiol and 18F-FDG maximum SUVs was calculated to identify tumors with relatively high 18F-fluoroestradiol uptake and relatively low 18F-FDG uptake, which would be susceptible to endocrine therapy (24). Conversely, lesions with a low 18F-fluoroestradiol/18F-FDG ratio suggest the presence of highly proliferative, ER poorly functional disease that may be better suited to cytotoxic chemotherapy or agents targeted at growth factor pathways. The 18F-fluoroestradiol/18F-FDG ratio may also control for partial-volume effects and for effects of different adjustments for distribution volume. 18F-fluoroestradiol/18F-FDG ratio values are the same for weight and LBM-adjusted PET measures. A draw–redraw reader study (different from test–retest, because patients were scanned only once) was conducted to estimate the role of ROI placement in measurement error. When comparing uptake measures for 2 readers of the same lesion from the same scan, discrepancies in uptake would be due to differences in lesion identification or ROI placement within the lesion and not to instrumentation error or true site-to-site differences. Nine scans (10%) were selected at random. The primary reader provided information about the number of lesions and their anatomic location (i.e., T12) but not slice number or other scan-specific characteristics. With this information, the second reader located the lesions, drew ROIs, and recorded 18F-fluoroestradiol and 18F-FDG SUVs independently of the first reader. Both readers were highly experienced in data analysis, and each had access to a different board-certified nuclear medicine physician to assist with ROI placement.
Statistical Analysis
Linear mixed-effects regression models were fitted to examine associations between independent variables (patient and lesion characteristics) and dependent variables (18F-fluoroestradiol SUV, 18F-FDG SUV, and 18F-fluoroestradiol/18F-FDG ratio). These models are similar to linear regression but estimate a random intercept to account for similarity between measures in the same patient, beyond the fixed-effects model (effect of covariates). SUVs were log-transformed to satisfy linear model assumptions (25), and the 18F-fluoroestradiol/18F-FDG ratio underwent a square root transformation for the same purpose. The patient-level characteristics considered were the number of breast cancer lesions identified, progesterone receptor status, HER2, patient age, aromatase inhibitor therapy at the time of the 18F-fluoroestradiol PET scan, and tumor histology. Each lesion site was categorized as soft-tissue/lymph node, bone, or lung. A compound symmetry covariance structure was assumed, fitting restricted maximum likelihood estimates of between-patient variation ( ) and within-patient variation ( ) not already explained by the fixed-effects model. The proportion of variation due to between-patient variability was assessed by the intraclass correlation coefficient (ICC), also known as reliability:
A high ICC value would indicate that most variability was between patients: neither measurement error nor within-patient variability in true PET measures would likely be important in using PET as a quantitative biomarker. A lower ICC could be due to either measurement error or true variability, as would occur if metastatic lesions within a patient had different molecular characteristics. If measurement error were the cause of a low ICC, the problem could be addressed by averaging data from multiple lesions, using the Spearman–Brown equation to estimate the ICC of the averaged values:
True within-patient variation in 18F-fluoroestradiol uptake could require evaluation of all lesions to identify the best course of therapy.
The confidence interval (CI) for the intraclass correlation was estimated by applying the delta method to restricted maximum likelihood estimates of variance component SEs (26). The suitability of linear mixed-effects modeling assumptions was evaluated through graphical residual diagnostics and analysis of parameter estimate sensitivity to cluster-level deletion. Draw–redraw analysis covariate estimates were estimated using a linear mixed model with random effects for patient and for rater within patient. Statistical analyses were conducted using SAS/STAT (version 9.2; SAS Institute, Inc.) and R software (version 2.11.1; R Foundation for Statistical Computing).
RESULTS
Of 391 scans of 283 patients who participated in 18F-fluoroestradiol PET studies between 1996 and 2006, 93 scans for 93 separate patients met the study criteria. Two scans were not available for lesion-level reanalysis because of technical difficulties. Table 1 summarizes patient characteristics for the remaining 91. One patient had a history of ER− disease but had an ER+ biopsy of metastatic disease. Twelve patients had HER2-positive disease; 6 were on trastuzumab when scanned using 18F-fluoroestradiol PET. More than half of patients were known to be undergoing aromatase inhibitor therapy at the time of the scan, underscoring that many of these patients were starting or changing endocrine therapy as nth line salvage therapy. Most patients had bone lesions (67/91, 74%). Soft tissue lesions were also prevalent (54/91, 59%), with 31 of 91 patients (34%) having both bone and soft-tissue lesions.
TABLE 1.
Patient and Disease Characteristics (n = 91) as Recorded at Time of 18F-Fluoroestradiol PET Scan
| Characteristic | n |
|---|---|
| Patient population | |
| Female | 89 (98) |
| Premenopausal (women only, n = 89) | 15 (17) |
| Weight | |
| Normal (body mass index ≤ 25) | 30 (33) |
| Overweight | 32 (35) |
| Obese (body mass index > 30) | 29 (32) |
|
| |
| Primary tumor immunohistochemistry and histology | |
| ER+ | 90 (99) |
| Progesterone receptor–positive (n = 88) | 74 (84) |
| HER2/neu–positive | 12 (13) |
|
| |
| Histology | |
| Ductal | 67 (73) |
| Lobular | 18 (20) |
| Ductal and lobular | 6 (7) |
|
| |
| Breast cancer and treatment history | |
| Advanced disease | 86 (95) |
| Chemotherapy for metastatic breast cancer (n = 82)* | 21 (26) |
| Endocrine therapy for metastatic breast cancer (n = 82)* | 38 (46) |
| Radiation therapy for metastatic breast cancer (n = 82)* | 28 (34) |
| Aromatase inhibitor therapy at time of scan (n = 90) | 55 (61) |
|
| |
| Tumor characteristics† | |
| Bone lesions present | 67 (74) |
| Soft-tissue lesions present | 54 (59) |
| Both bone and soft-tissue lesions present | 31 (34) |
|
| |
| Endocrine therapy after 18F-fluoroestradiol PET | |
| Tamoxifen | 6 (7) |
| Aromatase inhibitor | 60 (66) |
| Aromatase inhibitor and fulvestrant | 18 (20) |
| Other or unknown‡ | 7 (7) |
Patients without advanced disease (n = 5) excluded, history unknown for n = 4.
Lesions in 18F-fluoroestradiol PET analysis.
Fulvestrant alone, leuprolide acetate, diethylstilbestrol, 4 unknown.
Data in parentheses are percentages. Mean age (±SD) of patient population was 56 ± 11 y (median, 55 y; range, 28–79 y). Mean years since breast cancer diagnosis was 7 ± 6 y (median, 5 y; range, 0–31 y). Mean years since first cancer recurrence (advanced disease only, n = 86) was 2 ± 3 (median, 0.3 y; range, 0–17 y). Mean number of lesions was 5.6 ± 4.0 (median, 4; range, 1–16).
Table 2 describes lesion-level characteristics for the 505 lesions in 91 patients. Most lesions (378/505, 75%) were bone lesions, and the remaining lesions (127/505, 25%) were located in soft tissue, lymph node, or lung. Liver lesions and lesions directly adjacent to the liver were not detectable by 18F-fluoroestradiol PET because of tracer metabolism in the liver and were therefore excluded from the analysis. For the 5 early-stage patients, 7 of 10 lesions were breast lesions, and 3 were in nodes. For advanced-stage patients, 14 of the 103 soft-tissue and lymph node lesions were located in the breast. The 18F-fluoroestradiol mean SUVLBM for individual lesions ranged from 0.0 to 10.2, with a mean value of 1.9. 18F-FDG maximum SUVLBM also showed a broad range of values for observed lesions (0.8–16.5), as did the 18F-fluoroestradiol/18F-FDG ratio (0.1–5.6). Two patients’ 18F-FDG PET scans were from outside centers and were used to identify 13 lesions but not to provide 18F-FDG SUVs for analysis. Supplemental Figure 1 (supplemental materials are available online only at http://jnm.snmjournals.org) is an example to illustrate analysis of 18F-fluoroestradiol and 18F-FDG PET image data. Although 18F-fluoroestradiol and 18F-FDG uptake were not uniform across all lesions, the overall impression is that the patient had aggressive (highly glycolytic) and 18F-fluoroestradiol–avid disease.
TABLE 2.
Lesion Characteristics
| Characteristic | n | Mean ± SD | Median | Range |
|---|---|---|---|---|
| Tumor site | ||||
| Soft tissue or lymph node | 113 (22) | |||
| Lung | 14 (3) | |||
| Axial skeleton or spine | 225 (45) | |||
| Long bone or pelvis | 153 (30) | |||
|
| ||||
| PET measures (LBM-adjusted) | ||||
| 18F-fluoroestradiol mean SUVLBM | 1.9 ± 1.5 | 1.5 | 0.0–10.2 | |
| 18F-fluoroestradiol maximum SUVLBM | 2.9 ± 1.9 | 2.3 | 0.2–13.0 | |
| 18F-FDG maximum SUVLBM (n = 492) | 3.2 ± 2.2 | 2.5 | 0.8–16.5 | |
| 18F-fluoroestradiol maximum/18F-FDG maximum ratio (n = 492) | 1.1 ± 0.9 | 0.9 | 0.1–5.6 | |
|
| ||||
| PET measures (total mass-adjusted) | ||||
| 18F-fluoroestradiol mean SUV | 3.0 ± 2.4 | 2.3 | 0.0–14.7 | |
| 18F-fluoroestradiol maximum SUV | 4.5 ± 3.1 | 3.6 | 0.3–18.7 | |
| 18F-FDG maximum SUV (n = 492) | 5.0 ± 3.4 | 3.8 | 1.2–25.0 | |
n = 505 lesions in 91 patients. Data in parentheses are percentages.
Figure 1 illustrates the within-patient and between-patient variation in 18F-fluoroestradiol SUVLBM. The horizontal axis is an index for each of the 91 patients, with increasing average 18F-fluoroestradiol SUVLBM from left to right. The vertical axis is 18F-fluoroestradiol SUVLBM on a log scale (base 2). Between-patient variation was observed: the average 18F-fluoroestradiol SUVLBM for each patient ranged from 0.2 (upper left corner of Fig. 1) to 6.7 (lower right corner of Fig. 1). A horizontal line shows an 18F-fluoroestradiol mean SUVLBM of 1.0, which roughly corresponds to the 18F-fluoroestradiol mean SUV threshold of 1.5 examined in an earlier study (18). Thirty-four of 91 patients (37%) had an average 18F-fluoroestradiol uptake below this hypothesized threshold for response to endocrine therapy, using the average of logged values, despite the fact that all patients had ER+ primary or metastatic disease by immunohistochemistry. Some patients had uniformly high 18F-fluoroestradiol uptake (such as index 85, Fig. 2A), whereas others had uniformly low 18F-fluoroestradiol uptake (such as index 13, Fig. 2B). A few patients showed patterns such as index 55 and 44, with gaps between SUVLBM of lesions (index 55) or clusters of lesions (index 44). Mixed 18F-fluoroestradiol uptake between lesions is shown in Figure 2C (index 32). Of 11 recorded bone lesions, 9 had relatively high 18F-fluoroestradiol uptake, but lesions on the sternum and right humerus had an 18F-fluoroestradiol mean SUVLBM of less than 0.3.
FIGURE 1.
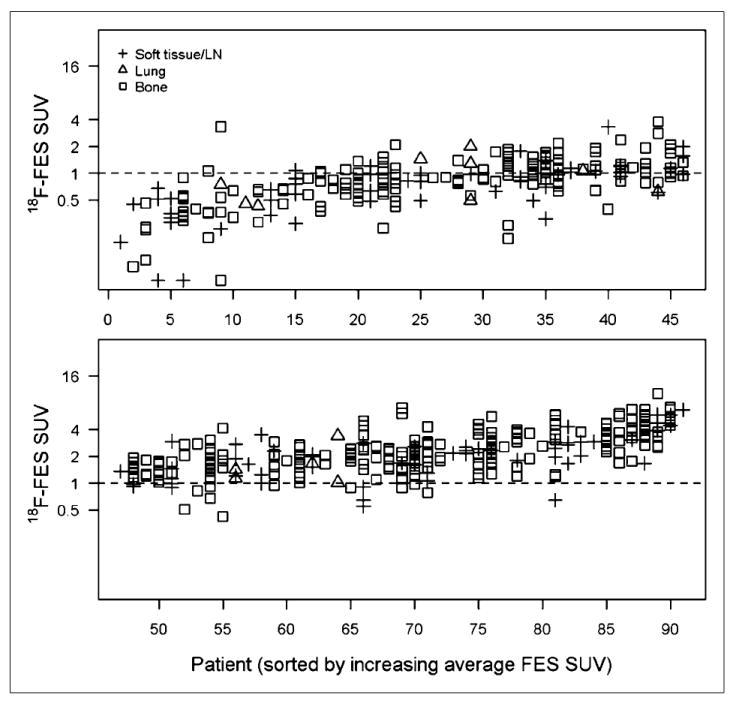
LBM-adjusted 18F-fluoroestradiol mean SUV (y-axis, log2 scale) for 505 lesions in each of 91 patients (x-axis, sorted by average 18F-fluoroestradiol SUV). Vertical points show within-patient heterogeneity. Horizontal line shows threshold of SUV = 1. FES = fluoroestradiol; LN = lymph node.
FIGURE 2.
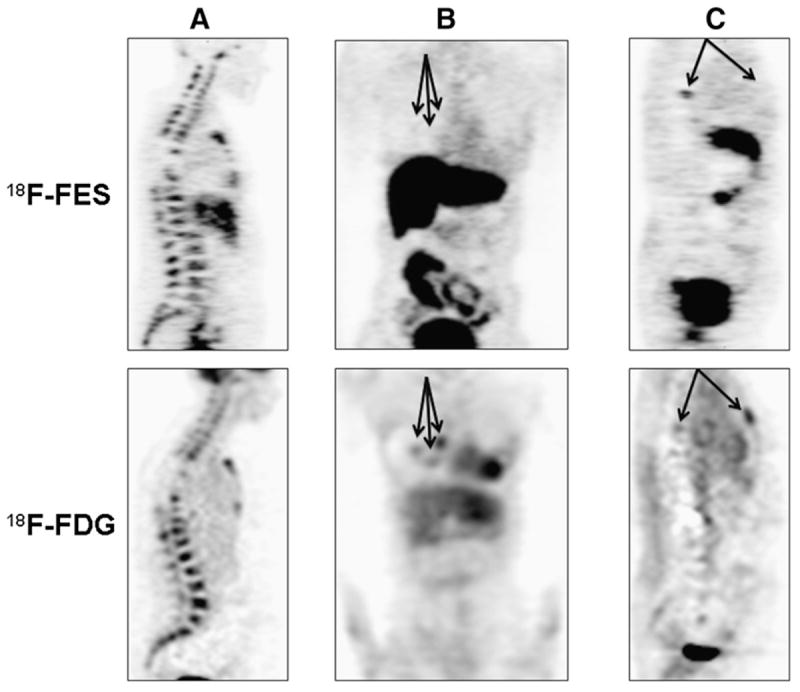
Torso survey images from 3 female patients with metastatic breast cancer from ER+/HER2-negative primary histology (patient in A had PgR-negative primary tumor histology; patients in B and C had PgR-positive). (A) (sagittal view; index 85 in Figs. 1, 3, and 4): 48-y-old with bone-dominant disease with high 18F-fluoroestradiol uptake and high 18F-FDG uptake. (B) (coronal view; index 13 in Figs. 1, 3, and 4): 62-y-old with uniformly low 18F-fluoroestradiol uptake on 18F-fluoroestradiol PET. Three soft-tissue lesions (18F-fluoroestradiol mean SUVLBM of 0.3, 0.5, and 0.7) are identified by arrows. (C) (sagittal view; index 32 in Figs. 1, 3, and 4): 52-y-old with spinal lesion visible on both 18F-fluoroestradiol PET images and 18F-FDG PET images and sternal lesion with visible 18F-FDG but negative 18F-fluoroestradiol PET. FES = fluoroestradiol.
Figure 3 shows within-patient and between-patient variation in 18F-FDG SUVLBM values, with the horizontal index sorted by ascending average 18F-fluoroestradiol SUVLBM, so that index numbers are the same as for Figure 1. As for 18F-fluoroestradiol SUVLBM, there was considerable between-patient variation, but SUVs for multiple lesions in the same patient were generally clustered close to the mean value. Figure 4 displays the 18F-fluoroestradiol/18F-FDG ratio (with the vertical axis on a square root scale). The index 32 lesions with the lowest 18F-fluoroestradiol SUVLBM (Fig. 2C) also had notably low 18F-fluoroestradiol/18F-FDG ratios (Fig. 4). These observations used tabulated data, because the bone lesions cannot be tracked between figures. In contrast to index 32, for index 44 the gap between clusters of lesions for 18F-fluoroestradiol SUVLBM (Fig. 1) was not notable in the 18F-fluoroestradiol/18F-FDG ratio (Fig. 4), suggesting that the ratio may have controlled for between-lesion differences in size or cellularity.
FIGURE 3.
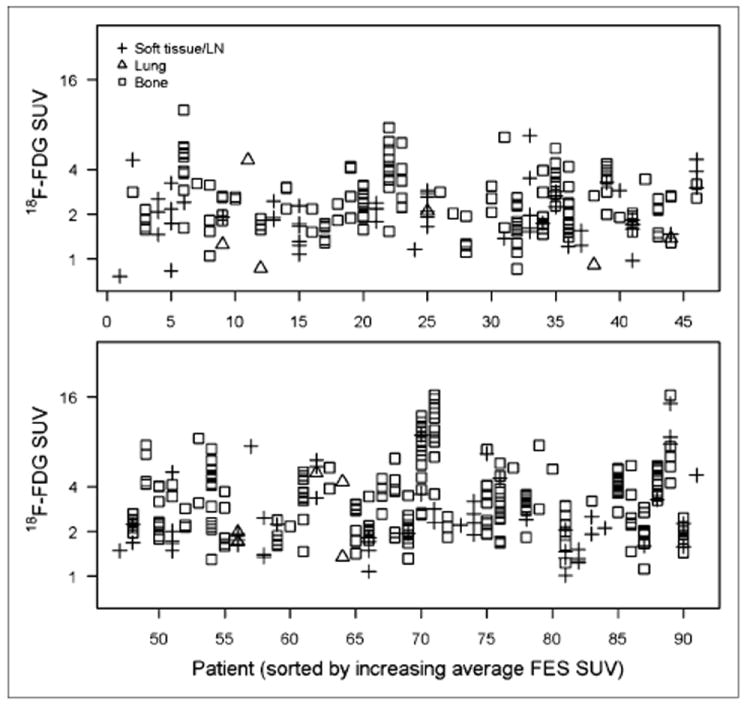
LBM-adjusted 18F-FDG maximum SUV (y-axis, log2 scale) for 492 lesions in each of 89 patients (x-axis, sorted by average 18F-FDG SUV). FES = fluoroestradiol; LN = lymph node.
FIGURE 4.
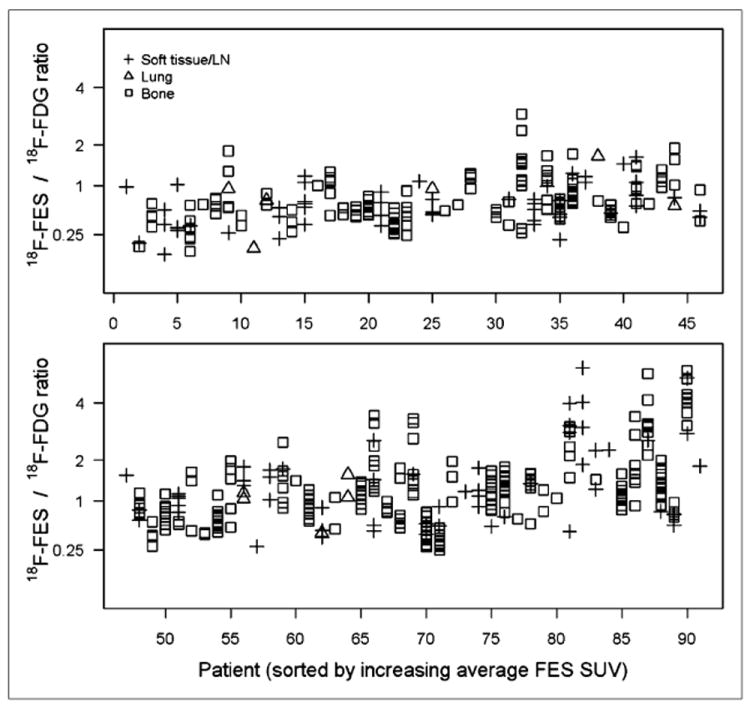
Ratio of 18F-fluoroestradiol maximum SUV and 18F-FDG maximum SUV (y-axis, square root scale) for 492 lesions in each of 89 patients (x-axis, sorted by average 18F-fluoroestradiol SUV). FES = fluoroestradiol; LN = lymph node.
Linear mixed models were used to explore predictors of variation in PET parameters. Both 18F-fluoroestradiol and 18F-FDG uptake tended to be higher in bone than in soft tissue (Table 3, P < 0.001, Wald test). However, the 18F-fluoroestradiol/18F-FDG ratio was not associated with tumor site (P = 0.41), suggesting that the associations of tumor site with 18F-fluoroestradiol SUV and 18F-FDG SUV were artifacts related to tumor size, cellularity, and contrast to surrounding tissue. In contrast, associations with the number of lesions per patient support the 18F-fluoroestradiol avidity of high-volume, bone-dominant disease. According to a univariate linear mixed model, 18F-fluoroestradiol SUVLBM was predicted to be 27% higher for each 5 additional lesions (P = 0.01), but the number of lesions was not associated with 18F-FDG uptake or the 18F-fluoroestradiol/18F-FDG ratio in other models (P > 0.20). Holding lesion site (bone, lung, or soft tissue) constant, progesterone receptor status, HER2 overexpression, patient age, aromatase inhibitor therapy at the time of the 18F-fluoroestradiol PET scan, and primary tumor histology did not explain variation in 18F-fluoroestradiol SUV, 18F-FDG SUV, or the 18F-fluoroestradiol/18F-FDG ratio (P > 0.20). The 5 patients with early-stage disease tended to have lesions with higher 18F-fluoroestradiol SUVLBM (P = 0.005; average 18F-fluoroestradiol SUVLBM for bone: 3.4 for early-stage disease, 1.3 for advanced) and higher 18F-fluoroestradiol/18F-FDG ratio (P < 0.001; average: 2.3 for early-stage disease, 0.9 for advanced) but did not differ in 18F-FDG SUVLBM (P = 0.49). In summary, fixed-effects models suggest that lesion-level differences in 18F-fluoroestradiol and 18F-FDG SUV may be artifacts of size and cellularity. Early-stage disease tended to have higher 18F-fluoroestradiol uptake than advanced disease, as might be expected because many patients with advanced disease were endocrine-refractory.
TABLE 3.
Linear Mixed Models with PET Measures as Outcome and Lesion Site, Disease Stage, and Number of Lesions (1–3, 4–6, or 7+) as Fixed Effects, with Random Patient Effects
| Analysis | n | Estimate*
|
(between-patient variance)† | (within- patient variance)† | (ICC) † | ||
|---|---|---|---|---|---|---|---|
| Bone | Lung | Soft tissue or lymph node | |||||
| Analysis | |||||||
| 18F-fluoroestradiol mean SUVLBM | 505 | 1.07 (0.83–1.38) | 0.95 (0.64–1.41) | 0.79 (0.61–1.04) | 0.73 | 0.49 | 0.60 (0.50–0.69) |
| 18F-FDG maximum SUVLBM | 492 | 2.88 (2.43–3.40) | 2.01 (1.50–2.70) | 2.32 (1.94–2.78) | 0.30 | 0.25 | 0.54 (0.44–0.64) |
| 18F-fluoroestradiol maximum /18F-FDG maximum ratio | 492 | 0.74 (0.57–0.93) | 0.69 (0.43–0.99) | 0.66 (0.49–0.86) | 0.06 | 0.03 | 0.65 (0.56–0.73) |
|
| |||||||
| With alternate PET measures | |||||||
| 18F-fluoroestradiol maximum SUVLBM | 505 | 1.92 (1.57–2.34) | 1.38 (1.00–1.90) | 1.42 (1.15–1.75) | 0.43 | 0.33 | 0.57 (0.47–0.66) |
| 18F-fluoroestradiol mean SUV | 505 | 1.60 (1.23–2.08) | 1.39 (0.92–2.10) | 1.16 (0.88–1.54) | 0.80 | 0.51 | 0.61 (0.51–0.70) |
| 18F-fluoroestradiol maximum SUV | 505 | 2.88 (2.33–3.55) | 2.02 (1.45–2.80) | 2.11 (1.69–2.63) | 0.50 | 0.33 | 0.60 (0.51–0.69) |
| 18F-FDG maximum SUV | 492 | 4.31 (3.62–5.13) | 2.92 (2.17–3.94) | 3.44 (2.86–4.14) | 0.33 | 0.25 | 0.56 (0.46–0.66) |
Transformed from log2 (18F-fluoroestradiol, 18F-FDG) or square root (ratio) scale used in model.
Log2 (18F-fluoroestradiol, 18F-FDG) or square root (ratio) scale.
Data in parentheses are 95% CIs. Estimates shown are for patients with advanced disease and 1–3 lesions.
Controlling for variability in PET parameters explained by covariates in the fixed-effects model, remaining variance is accounted for by between-patient and within-patient variance components. The linear mixed models in Table 3 controlled for lesion site, disease stage, and the number of lesions, to account for the effects described. The proportion of variance explained by between-patient factors was measured by the ICC (Table 3). The ICC was 0.60 for 18F-fluoroestradiol SUV, 0.54 for 18F-FDG SUV, and 0.65 for the 18F-fluoroestradiol/18F-FDG ratio. In each case, more than half of the variation in PET parameters was explained by differences in average uptake between different patients.
The importance of remaining, within-patient, variation depends on whether the variation reflected true unmeasured differences between lesions or measurement error. We examined variability introduced by image analysts by conducting a draw–redraw study of 38 lesions in 9 patients. For most patients and most lesions, concordance on SUVs was near-perfect: the proportion of variance explained by factors other than variation between raters was 94%, 92%, and 90%, respectively, for 18F-fluoroestradiol SUV, 18F-FDG SUV, and the 18F-fluoroestradiol/18F-FDG ratio. When lack of agreement occurred, multiple lesions per patient tended to be discrepant (Supplemental Fig. 2). To estimate the proportion of within-patient variation attributed to variation between raters, we excluded between-patient variation from the proportion and found 29% of 18F-fluoroestradiol SUV within-patient variation attributable to raters (22% for 18F-FDG SUV, 44% for the 18F-fluoroestradiol/18F-FDG ratio).
The reliability (ICC) for 18F-fluoroestradiol measures when averaging values for 2 lesions per patient was 0.75 using the Spearman–Brown equation and the 18F-fluoroestradiol SUV ICC of 0.60 from Table 3. Averaging 3 lesions would raise the expected reliability to 0.82, and averages of 4 and 5 lesions would be expected to have reliability of 0.86 and 0.88, respectively. Our prior strategy of averaging values for up to 3 lesions appeared to be appropriate: averaging results for several lesions improved the precision of estimates of 18F-fluoroestradiol uptake. Improving precision is particularly useful when using a cutoff value such as an 18F-fluoroestradiol SUVLBM of 1.0 to identify ER+ disease and guide choice of therapy.
DISCUSSION
This study summarized ER expression measured by 18F-fluoroestradiol PET and tumor glucose metabolism measured by 18F-FDG PET in 505 lesions scanned in 91 breast cancer patients. The ICC was 0.60 (95% CI, 0.50–0.69) for 18F-fluoroestradiol. Uptake patterns for individual patients (Fig. 1) showed that 18F-fluoroestradiol SUVs clustered around the within-patient average in most patients, suggesting that these patients’ contemporaneous lesions had similar ER expression. Averaging up to three 18F-fluoroestradiol SUV measurements from each patient should improve precision, increasing the ICC to 0.82. The 18F-fluoroestradiol/18F-FDG ratio appeared to mitigate variability attributable to partial-volume effects and variable lesion size, providing support (in addition to the biologic rationale) for exploration of the 18F-fluoroestradiol/18F-FDG ratio as a predictive biomarker for response to endocrine therapy.
The observed ICC of 0.60 may seem modest, compared with the 0.94 measure of intratumoral heterogeneity observed by Barry et al. (9), using gene expression data. However, the cohort described in this article would be expected to have less between-patient variation ( ) and more within-patient variation ( ). All were deemed candidates for endocrine therapy by the treating clinician, restricting between-patient variation in contrast to the mix of ER+ and ER− patients in the gene expression study. Within-patient variation would be expected to be higher for measures on multiple tumors in different tissue types than for repeated sampling of a single tumor.
This analysis examined quantitative 18F-fluoroestradiol results for multiple tumor sites at 1 time point per patient. All but 1 patient had ER-expressing primary tumors at diagnosis. However, a substantial fraction of patients had uniformly low or absent 18F-fluoroestradiol uptake when scanned, typically after one or more endocrine-targeted therapy regimens. This broad between-patient variation in average 18F-fluoroestradiol uptake and 18F-fluoroestradiol/18F-FDG ratio supports the hypothesis that recurrent breast cancer may not share the phenotype of the primary tumor (10).
We found a small number of patients with highly discordant 18F-fluoroestradiol uptake across tumor sites, suggesting that this phenomenon is relatively rare. These patients appeared to have both ER+ and ER− lesions at the same time, demonstrated by discordant findings on 18F-fluoroestradiol and 18F-FDG PET. This observation suggests that low or absent ER expression may emerge relatively quickly in the course of breast cancer progression, perhaps under the selective pressure of endocrine therapy. The examination of molecular features in patients with extreme site-to-site heterogeneity, with tissue sampling directed by imaging, may therefore yield important clues as to the nature of the emergence of breast cancer with low ER expression. Future work will include analysis of the disease history, treatment history, and prognosis of patients with mixed 18F-fluoroestradiol uptake, such as the patient in Figure 2C.
A limitation of this study is the lack of concurrent biopsy tissue, to compare 18F-fluoroestradiol PET results with immunohistochemistry or gene expression assessment of ER. However, the impracticality of serial and multiple biopsies in metastatic breast cancer patients is one of the rationales for this study, and other work has demonstrated the association between 18F-fluoroestradiol SUV and ER by immunohistochemistry (15). 18F-fluoroestradiol PET was performed only at 1 time point for each patient, so within-patient changes in ER expression over time could not be addressed. Another limitation is that the PET studies were conducted on a heterogeneous group of patients, with different treatment histories and prognoses. Prospective studies for using 18F-fluoroestradiol PET to guide endocrine therapy are planned, and this retrospective evaluation helps to resolve design questions (i.e., how many lesions to assess) in the conduct of those studies.
CONCLUSION
Currently, selection of patients for endocrine therapy is based on ER expression as determined from biopsy material, often from a temporally distant primary tumor. Improved identification of ER expression in advanced breast cancer can better select patients who are likely to benefit from hormone therapy and may identify targets for the development of future therapies. Imaging ER function by PET can be exploited to identify, characterize, and follow treatment response for multiple lesions in the same patient. 18F-fluoroestradiol PET is particularly promising in the metastatic setting, in which patients have many lesions in areas (such as bone) that are difficult to biopsy. Future work will examine patients with highly discordant 18F-fluoroestradiol uptake across tumor sites and will evaluate the role of between-patient and within-patient variability in 18F-fluoroestradiol SUV and the 18F-fluoroestradiol/18F-FDG ratio in predicting clinical response to endocrine therapy.
Supplementary Material
Acknowledgments
We thank Svetlana Stekhova, Gina Massimino, Xiaoyu Chai, Mark Muzi, the study participants, the referring physicians, and the nuclear medicine team in the Department of Radiology. We gratefully acknowledge financial support from a Breast Cancer Research Program Pilot grant (Safeway) and NIH grants CA42045, CA72064, CA148131, CA138293, and DOD W81XWH-04-01-0675.
Footnotes
No other potential conflict of interest relevant to this article was reported.
References
- 1.Buzdar A, Jonat W, Howell A, et al. Anastrozole, a potent and selective aromatase inhibitor, versus megestrol acetate in postmenopausal women with advanced breast cancer: results of overview analysis of two phase III trials. Arimidex Study Group. J Clin Oncol. 1996;14:2000–2011. doi: 10.1200/JCO.1996.14.7.2000. [DOI] [PubMed] [Google Scholar]
- 2.Kuukasjärvi T, Kononen J, Helin H, Holli K, Isola J. Loss of estrogen receptor in recurrent breast cancer is associated with poor response to endocrine therapy. J Clin Oncol. 1996;14:2584–2589. doi: 10.1200/JCO.1996.14.9.2584. [DOI] [PubMed] [Google Scholar]
- 3.Fisher B, Redmond CK, Fisher ER. Evolution of knowledge related to breast cancer heterogeneity: a 25-year retrospective. J Clin Oncol. 2008;26:2068–2071. doi: 10.1200/JCO.2007.14.1804. [DOI] [PubMed] [Google Scholar]
- 4.Aitken SJ, Thomas JS, Langdon SP, Harrison DJ, Faratian D. Quantitative analysis of changes in ER, PR and HER2 expression in primary breast cancer and paired nodal metastases. Ann Oncol. 2010;21:1254–1261. doi: 10.1093/annonc/mdp427. [DOI] [PubMed] [Google Scholar]
- 5.Allegra JC, Barlock A, Huff KK, Lippman ME. Changes in multiple or sequential estrogen receptor determinations in breast cancer. Cancer. 1980;45:792–794. doi: 10.1002/1097-0142(19800215)45:4<792::aid-cncr2820450430>3.0.co;2-x. [DOI] [PubMed] [Google Scholar]
- 6.Yoshida T, Eguchi H, Nakachi K, et al. Distinct mechanisms of loss of estrogen receptor alpha gene expression in human breast cancer: methylation of the gene and alteration of trans-acting factors. Carcinogenesis. 2000;21:2193–2201. doi: 10.1093/carcin/21.12.2193. [DOI] [PubMed] [Google Scholar]
- 7.Ellis MJ, Tao Y, Young O, et al. Estrogen-independent proliferation is present in estrogen-receptor HER2-positive primary breast cancer after neoadjuvant letrozole. J Clin Oncol. 2006;24:3019–3025. doi: 10.1200/JCO.2005.04.3034. [DOI] [PubMed] [Google Scholar]
- 8.Douglas-Jones AG, Collett N, Morgan JM, Jasani B. Comparison of core oestrogen receptor (ER) assay with excised tumour: intratumoral distribution of ER in breast carcinoma. J Clin Pathol. 2001;54:951–955. doi: 10.1136/jcp.54.12.951. [DOI] [PMC free article] [PubMed] [Google Scholar]
- 9.Barry WT, Kernagis DN, Dressman HK, et al. Intratumor heterogeneity and precision of microarray-based predictors of breast cancer biology and clinical outcome. J Clin Oncol. 2010;28:2198–2206. doi: 10.1200/JCO.2009.26.7245. [DOI] [PMC free article] [PubMed] [Google Scholar]
- 10.Hoefnagel LD, van de Vijver MJ, van Slooten HJ, et al. Receptor conversion in distant breast cancer metastases. Breast Cancer Res. 2010;12:R75. doi: 10.1186/bcr2645. [DOI] [PMC free article] [PubMed] [Google Scholar]
- 11.Thompson AM, Jordan LB, Quinlan P, et al. Prospective comparison of switches in biomarker status between primary and recurrent breast cancer: the Breast Recurrence in Tissues Study (BRITS) Breast Cancer Res. 2010;12:R92. doi: 10.1186/bcr2771. [DOI] [PMC free article] [PubMed] [Google Scholar]
- 12.Robertson JF. Oestrogen receptor: a stable phenotype in breast cancer. Br J Cancer. 1996;73:5–12. doi: 10.1038/bjc.1996.2. [DOI] [PMC free article] [PubMed] [Google Scholar]
- 13.Gomez-Fernandez C, Daneshbod Y, Nassiri M, Milikowski C, Alvarez C, Nadji M. Immunohistochemically determined estrogen receptor phenotype remains stable in recurrent and metastatic breast cancer. Am J Clin Pathol. 2008;130:879–882. doi: 10.1309/AJCPD1AO3YSYQYNW. [DOI] [PubMed] [Google Scholar]
- 14.Wu JM, Fackler MJ, Halushka MK, et al. Heterogeneity of breast cancer metastases: comparison of therapeutic target expression and promoter methylation between primary tumors and their multifocal metastases. Clin Cancer Res. 2008;14:1938–1946. doi: 10.1158/1078-0432.CCR-07-4082. [DOI] [PMC free article] [PubMed] [Google Scholar]
- 15.Mintun MA, Welch MJ, Siegel BA, et al. Breast cancer: PET imaging of estrogen receptors. Radiology. 1988;169:45–48. doi: 10.1148/radiology.169.1.3262228. [DOI] [PubMed] [Google Scholar]
- 16.Mortimer JE, Dehdashti F, Siegel BA, Katzenellenbogen JA, Fracasso P, Welch MJ. Positron emission tomography with 2-[18F]Fluoro-2-deoxy-d-glucose and 16alpha-[18F]fluoro-17beta-estradiol in breast cancer: correlation with estrogen receptor status and response to systemic therapy. Clin Cancer Res. 1996;2:933–939. [PubMed] [Google Scholar]
- 17.Mortimer JE, Dehdashti F, Siegel BA, Trinkaus K, Katzenellenbogen JA, Welch MJ. Metabolic flare: indicator of hormone responsiveness in advanced breast cancer. J Clin Oncol. 2001;19:2797–2803. doi: 10.1200/JCO.2001.19.11.2797. [DOI] [PubMed] [Google Scholar]
- 18.Linden HM, Stekhova SA, Link JM, et al. Quantitative fluoroestradiol positron emission tomography imaging predicts response to endocrine treatment in breast cancer. J Clin Oncol. 2006;24:2793–2799. doi: 10.1200/JCO.2005.04.3810. [DOI] [PubMed] [Google Scholar]
- 19.Dehdashti F, Flanagan FL, Mortimer JE, Katzenellenbogen JA, Welch MJ, Siegel BA. Positron emission tomographic assessment of “metabolic flare” to predict response of metastatic breast cancer to antiestrogen therapy. Eur J Nucl Med. 1999;26:51–56. doi: 10.1007/s002590050359. [DOI] [PubMed] [Google Scholar]
- 20.Römer J, Fuchtner F, Steinbach J, Johannsen B. Automated production of 16alpha-[18F]fluoroestradiol for breast cancer imaging. Nucl Med Biol. 1999;26:473–479. doi: 10.1016/s0969-8051(98)00098-5. [DOI] [PubMed] [Google Scholar]
- 21.Peterson LM, Kurland BF, Link JM, et al. Factors influencing the uptake of 18F-Fluoroestradiol (FES) in patients with estrogen receptor positive (ER+) breast cancer. Nucl Med Biol. doi: 10.1016/j.nucmedbio.2011.03.002. In press. [DOI] [PMC free article] [PubMed] [Google Scholar]
- 22.Hallynck TH, Soep HH, Thomis JA, Boelaert J, Daneels R, Dettli L. Should clearance be normalised to body surface or to lean body mass? Br J Clin Pharmacol. 1981;11:523–526. doi: 10.1111/j.1365-2125.1981.tb01163.x. [DOI] [PMC free article] [PubMed] [Google Scholar]
- 23.Hamacher K, Coenen HH, Stocklin G. Efficient stereospecific synthesis of no-carrier-added 2-[18F]-fluoro-2-deoxy-d-glucose using aminopolyether supported nucleophilic substitution. J Nucl Med. 1986;27:235–238. [PubMed] [Google Scholar]
- 24.Mankoff DA, Dehdashti F. Imaging tumor phenotype: 1 plus 1 is more than 2. J Nucl Med. 2009;50:1567–1569. doi: 10.2967/jnumed.108.061044. [DOI] [PubMed] [Google Scholar]
- 25.Thie JA, Hubner KF, Smith GT. The diagnostic utility of the lognormal behavior of PET standardized uptake values in tumors. J Nucl Med. 2000;41:1664–1672. [PubMed] [Google Scholar]
- 26.Wolfinger RD, Tobias R, Sall J. Computing Gaussian likelihoods and their derivatives for general linear mixed models. SIAM J Sci Comput. 1994;15:1294–1310. [Google Scholar]
Associated Data
This section collects any data citations, data availability statements, or supplementary materials included in this article.