

Abstract
Understanding protein-protein association is crucial in revealing the molecular basis of many biological processes. Here, we describe a theoretical simulation pipeline to study protein-protein association from an energy landscape perspective. First, a coarse-grained model is implemented and its applications are demonstrated via molecular dynamics simulations for several protein complexes. Second, an enhanced search method is used to efficiently sample a broad range of protein conformations. Third, multiple conformations are identified and clustered from simulation data and further projected on a three-dimensional globe specifying protein orientations and interacting energies. Results from several complexes indicate that the crystal-like conformation is favorable on the energy landscape even if the landscape is relatively rugged with metastable conformations. A closer examination on molecular forces shows that the formation of associated protein complexes can be primarily electrostatics-driven, hydrophobics-driven, or a combination of both in stabilizing specific binding interfaces. Taken together, these results suggest that the coarse-grained simulations and analyses provide an alternative toolset to study protein-protein association occurring in functional biomolecular complexes.
Introduction
How proteins interact and associate into large functional complexes is one of the key aspects of many biological processes. The use of computational methods to understand molecular details of such protein-protein interactions has provided a powerful alternative to experimental structural characterization, especially for those who form transient but critical metastable conformational states (1,2). Picturing the landscape of protein-protein association is of importance in uncovering the hidden areas of a high-dimensional configurational space, as well as identifying new targets, e.g., using these metastable conformers, for therapeutic designs.
Two prevailing views of protein-protein association are the mechanisms of lock-and-key and induced-fit (3,4). In the former scenario, proteins are treated as rigid bodies, whereas protein flexibility due to the intrinsic dynamics is taken into account in the latter (and its generalizations). The general docking approach, driven by the lock-and-key mechanism, significantly simplifies the search in the conformational space occurring in protein-protein association (5–7). The search is typically based on atomistic representations, but has also been successfully simplified by coarse-grained (CG) models (8,9) that can accelerate energy calculations. However, the rigid body treatment cannot meaningfully account for the intrinsic protein flexibility. Although this problem can be alleviated to some extent by an after search relaxation, flexibility is inherently required for biomolecules to function, as recognized by the induced-fit mechanism. Such flexibility can be achieved computationally using a wide range of methods including molecular dynamics (MD) simulations (10). Although the restriction to a short timescale is a bottleneck for brute-force atomistic simulations, MD simulations combined with efficient search methods have provided fruitful insights into protein folding and dynamics (10–16).
Here, we explore this general concept of the induced-fit mechanism by employing a combination of MD simulations and a simplified CG protein model with an emphasis on the energy landscape aspects of protein-protein association. This method adopts a widely used structure-based approach to model individual protein components (17–22). It also incorporates the recent implementation introduced by Kim and Hummer (8) accounting for nonnative protein-protein interactions, which would otherwise be lacking without knowing the structure of the entire complex. Furthermore, to avoid trapping due to local stable complex-forming conformations, an efficient search method is introduced with a focus on facilitating protein dissociation and reassociation.
The outline of this work is as follows. First, details of the CGMD method, with a straightforward push-pull-release (PPR) sampling strategy, are described and tested on several model systems. To organize the large amount of simulation data, a structure clustering scheme is applied. The resulting conformations are then projected on a three-dimensional energy globe for visualizing the energetics of relevant stable conformations. Finally, molecular forces stabilizing each identified conformation are briefly described.
Models and Methods
Details of the CG model
We used a CG model where each amino acid is represented by a single bead positioned at its Cα atom. The CG energy function for two interacting proteins/domains (marked as 1 and 2) is formulated as follows: . E1 and E2 are the energy functions for each protein, similar to the structure-based Gō-type potential (23–28), whereas E12 is for the interactions between proteins. In a nutshell, this CG model can be viewed as two Gō-like proteins interacting with each other in a non-Gō-like fashion.
Following Yang et al. (29), E1 and E2 were modeled on the basis of their corresponding crystal structures. These energy functions include the interactions for bond , angle , dihedral , and native-like contacts modeled by Lennard-Jones (LJ)-type potentials. Specifically, , where , , . r, θ, and φ are the instantaneous bond distances, angles, and dihedral angles, respectively; , , and are the corresponding values in the reference structure. We note that the concept of dihedral angle among four residues was used mainly for the convenience of modeling. Force constants kcal/(mol·Å2), kcal/(mol·rad2), kcal/(mol·rad2), and kcal/(mo· rad2) were used. The LJ-type interactions for native contacts were used between resides i and j , where kcal/mol, is the residue-residue distance, and is the corresponding distance in the reference structure. The definition of a native contact-forming pair was based on atomically detailed calculations using the CSU software (30).
The energy function E12 is designed for nonnative interactions between two proteins, which were extended from the Kim-Hummer model (8). It includes the electrostatic and hydrophobic components,
| (1) |
We used where is the charge of residue i and is the vacuum electric permittivity. An effective dielectric coefficient is applied to reflect the shielding effect between two residues separated by a distance of , where was used to describe the local dielectric environment when two proteins are forming an interface, and Å to mimic the screening effect at ∼150 mM salt concentration. At pH 7, residue charges for Lys and Arg, for Asp and Glu, and for His (e is the elementary charge) were used (8). Hydrophobic interactions are either attractive (LJ-type) or purely repulsive where
| (2) |
is the Miyazawa-Jernigan (MJ) statistical energy between residues i, j (31). β (in unit of ) is used as an offset parameter to balance attractive and repulsive interactions, and α to scale relative to (8). We used , and , where Å. A scaling factor of γ is introduced for as follows,
| (3) |
where is the van der Waals radius of residue i as used in (8). Note that in this parameter set, both and can vary between different pairs of residues reflecting the nature of sequence dependency. Finally, is accounted only for surface residues with solvent accessible surface area Å2, which was calculated via atomically detailed model structures of individual proteins using a probe size of 1.4 Å.
Simulation and sampling
The CG model was implemented using Langevin MD simulations in a modified version of CHARMM (32). Simulations were performed at 300 K with a friction coefficient of 50 ps−1 (33). A simulation time step of 0.01 ps was used and coordinates were saved every 100 ps.
A PPR sampling strategy, illustrated in Fig. 1, was implemented using a biasing potential (Eq. 4). The PPR sampling repeats a cycle including the following three parts: i), pull the two proteins away from each other when they are close, ii), push them closer when they are separated by more than a threshold distance , and iii), release them to interact freely by removing the biasing potential. We used the following ,
| (4) |
where R is the instantaneous center-to-center distance, and is the target center-to-center distance (marked by solid lines in Fig. 1 A). rmin is the closest residue-residue distance between the two proteins. The value of Å and a spring constant of kcal/(mol·Å2) were used. A simulation length of 10 ns was used for each PPR cycle.
Figure 1.
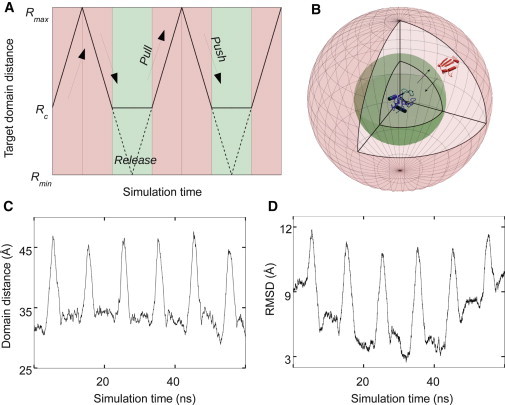
PPR sampling scheme. (A) Three parts of a PPR cycle where the pull and push portions are colored in pink and the release in green. The target trajectory (Rt) is shown in solid line (Rmin≤ Rt≤ Rmax). (B) A three-dimensional illustration of the PPR scheme; one protein (in blue) is positioned at the origin. The inner sphere (in green), with a radius of R = Rc, is the region where the biasing potential is turned off (see Eq. 4); the outer sphere has the radius of R = Rmax. R is the center-to-center domain distance between the two proteins. (C) Plot of R versus time and (D) RMSD versus time from a typical PPR simulation trajectory for the barnase/barstar complex, where Rmax = 50 Å, Rc = 25 Å, Rmin = 0 Å were used.
To further improve search efficiency, a total of 100 independent MD runs were launched simultaneously, each with an initial configuration generated by translation-and-rotation of the two proteins (see the Supporting Material). The total simulation time was 10 μs, which resulted in configurations. Configurations from the unbiased release parts (highlighted in green in Fig. 1, A and B), were used for data analysis.
Structure clustering analysis
Configurations from the simulated trajectories were grouped following a two-step clustering procedure. In the first orientational clustering step, the entire complex was aligned based only on the crystal structure of one protein. Four out-of-plane residues were then picked from the other protein and their Cartesian coordinates were used in a standard K-means clustering algorithm in MATLAB (The MathWorks, Natick, MA). From the resulting clusters , representative configurations with the lowest E12 within each cluster were chosen and used in the next clustering step. In the second root mean-square deviation (RMSD) clustering step, these configurations from the first step were further clustered into final clusters using a pairwise RMSD-based protocol (34) with a RMSD cutoff of 5 Å (for the entire complex). Similar to the first clustering step, the lowest E12 configuration within each cluster was selected to represent the clusters. To focus on the identification of energetically stable conformations, this two-step hierarchical clustering was performed only on those configurations with .
Results and Discussion
Here, we first describe the CG simulations with the selection of model parameters and test them on several well-characterized complexes. To accelerate the simulations, an efficient search method is introduced and compared with brute-force simulations. This CG method is finally applied to characterize the energy landscape of several protein complexes: CCP/cc, E9/Im9, E7/Im7, RXR ligand-binding domain (LBD) dimer, and barnase/barstar. Their resultant energy landscapes are further characterized and organized according to the forces that energetically stabilize their identified favorable conformations.
The CG model
To reduce the degrees of freedom in atomistic simulations and overcome the timescale limitation, a CG approach was used in our studies of protein-protein interactions. The CG model was built on the basis of available crystal structures of individual proteins (i.e., Gō-like models; see Models and Methods). The nonnative-like interactions between proteins were effectively accounted for and optimized. Here, the first optimization is about two CG parameters (α and β in Eq. 2) used to balance the competition between hydrophobic and electrostatic interactions. To achieve this goal, brute-force CGMD simulations (without a biasing potential) were carried out on two protein complexes whose crystal structures are available. One is the barnase/barstar complex of bacterial ribonuclease and its inhibitor (PDB entry 1BRS) (35), and the other is E9/Im9 (PDB entry 1EMV), an immunity protein complex (36). To examine their energetic stability, a range of CG parameters (α = 0.2, 0.4, 0.6 and β = 0.8, 1.3, 1.9) were used for comparison.
Fig. 2 shows the two-dimensional histogram plots of the center-to-center distance between two proteins (R) versus RMSD of the entire complex (with respect to the crystal structure). A total of nine sets of CG simulations, each with a distinct set of α and β, were performed starting from the same crystal configuration. Comparison shows that the complex remains stable for the set of and ; any deviation tends to result in a destabilization of the crystal conformation and the complex starts to dissociate. This set of parameters were also tested on three other complexes shown in Fig. 3, where each complex stays within a reasonable RMSD range to its crystal conformation within a simulation window of 100 ns. Additional energy calculations on protein-protein interaction, averaged over the 100-ns CGMD simulations with and , show that the values of E12 are –14.7 and –20.1 kcal/mol for barnase/barstar and E9/Im9, respectively. These results are consistent with their measured binding enthalpies of −13.9 and −19.1 kcal/mol (37,38) (Fig. S1 in the Supporting Material). Taken together, these results suggest that this CG energy function, even though highly simplified, can provide a rather detailed energy evaluation on protein-protein interactions.
Figure 2.
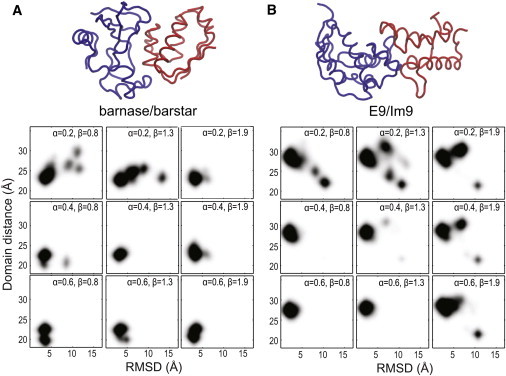
Selection of CG model parameters. (A) Histogram plots of R (domain distance) versus RMSD for barnase/barstar (PDB entry 1BRS (35)) and (B) for E9/Im9 (PDB entry 1EMV (36)). A range of α and β (Eq. 2) are used in each simulation set. For each set, 10 independent simulation runs, each lasting 100 ns, were carried out starting from their corresponding crystal conformations shown above, where R = 23.2 Å and 27.4 Å, respectively. The parameter γ = 0.625 (Eq. 3) is used throughout this work unless specified.
Figure 3.
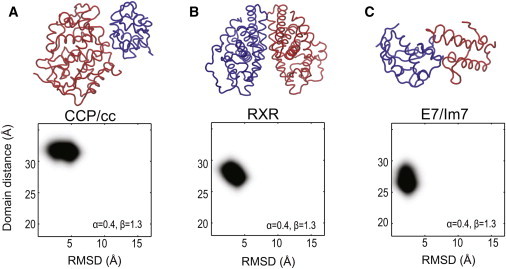
CG model parameters are tested on three protein complexes. Two-dimensional histogram plots of R (domain distance) versus RMSD from the simulations with α = 0.4 and β = 1.3 kBT are shown. Crystal conformations are intact for (A) CCP/cc (PDB entry 2PCC (46)), (B) RXR LBD (PDB entry 1MZN (64)), and (C) E7/Im7 (PDB entry 7CEI (52)) complexes. The simulations lasted 100 ns for each protein complex. This set of parameters α = 0.4 and β = 1.3 kBT is used throughout this work unless specified.
Another feature of the CGMD simulations is the introduction of a scaling factor γ (Eq. 3) to account for realistic pairwise residue distances. This consideration is in part based on the observation that a typical hydrophobic pair of Leu-Ile and a typical charged pair of Asp-Asp has an optimal distance around 7.8 Å and 7 Å, respectively (39); these are substantively lower than their values of 12.4 Å and 11.2 Å, based on their van der Waals radii (8). To account for such a difference, the value of γ = 0.625 was selected for rescaling (Eq. 3). To illustrate and compare the difference, two sets of simulations, one with γ = 0.625 and the other with γ = 1.0, were performed for barnase/barstar. Fig. S2 shows that, within the same length of simulation time, the complex drifts away from its crystal conformation during the simulations with γ = 1.0, but is retained during the ones with γ = 0.625. This is systemically observed in the simulations of other complexes used in this work (data not shown). Thus, this CG parameter γ = 0.625, together with α = 0.4 and β = 1.3, is used for the rest of the CGMD simulations.
Efficient search method
As demonstrated previously, it is difficult for brute-force CGMD simulations to observe protein dissociation events once two proteins are associated. One goal here is to search for multiple available conformations, which would require a more complete search in the configurational space. In fact, several advanced sampling techniques have been developed in the past to address this quest (11–14,16,40–45). In a similar spirit, a PPR sampling strategy is implemented here to accelerate sampling different interactions. Specifically, a biasing potential (see Eq. 4) is first applied to pull and push the two proteins to facilitate protein dissociation and reassociation, respectively; this bias is then removed and the proteins are released to interact freely when they are close enough. We repeated this PPR cycle to achieve sufficient sampling (Fig. 1).
Fig. 1, C and D, illustrates a typical PPR trajectory from the simulations of barnase/barstar. It shows that barnase and barstar dissociate and reassociate as seen in the center-to-center distance and RMSD (with respect to the crystal structure) during the push and pull parts of the PPR cycle (pink regions in Fig. 1 A). Once the two proteins are close enough, the associated complex is further relaxed by free MD simulations without any bias imposed during the release portion. We note that simulation data only from these free release portions were used for the rest of the analysis.
It is observed that this PPR scheme significantly increases the search efficiency for different protein-protein interacting conformations. Taking CCP/cc for example, with the help from PPR, a larger RMSD (with respect to the starting structure) range (up to 20 Å) and a much broader configuration space is sampled (Fig. S3); in contrast, the complex remains in a crystal-like conformation without using PPR (Fig. 3 A), and is confined near its staring point in these brute-force simulations (Fig. S3). This increased sampling efficiency is also systematically observed in other systems used in this work. To further enhance sampling, a set of 100 independent MD runs were launched simultaneously each starting with a random orientation between the two proteins in the complex. As shown below, a wide range of conformations are sampled for the protein complexes we examined. Thus, an efficient search method via the PPR strategy is in place to enhance the sampling of protein-protein association.
Protein interacting landscape pictured by an energy globe
To organize the large amount of simulation data, structurally similar conformations were clustered using a two-step structure clustering: the first step is based on their relative orientation and the second is based on pairwise RMSD (see Methods). Typically, clustering is performed only using pairwise RMSD (34); this would be computationally expensive because configurations generated from CGMD simulations are on the order of . This two-step procedure overcomes this hindrance by grouping the number of configurations to the order of clusters after the first step and finally to clusters in the order of .
To assist the navigation of the conformational diversity, we projected these configurations onto a unit sphere or globe representing relative orientation between complex-forming proteins. As illustrated in Fig. 1 B, one can imagine that one protein is inside the globe, whereas the other protein takes different orientations on the surface; the globe was colored according to the interacting energy E12 (Eq. 1). We found that this energy-mapped globe is a useful tool to identify energetically favorable conformations with different protein positioning on the landscape. It also serves to access the sampling quality achieved by PPR-assisted CGMD simulations by examining the coverage on the globe surface. Discussed below are five protein complexes (CCP/cc, E9/Im9, E7/Im7, RXR LBD dimer, and barnase/barstar) studied in this work; we organized them according to the decomposition of the interacting energy into electrostatic and hydrophobic components.
CCP/cc: electrostatics-driven association
To demonstrate the application of CGMD simulations, the CCP/cc complex was first examined; a similar procedure was followed for other protein complexes. CCP/cc is a complex formed between cytochrome c peroxidase and cytochrome c, whose crystal structure is shown in Fig. 3 A (46). Calculated from the PPR-assisted CGMD simulation data, Fig. 4 A shows a plot of E12 versus RMSD (with respect to the crystal structure). It clearly shows that a wide RMSD range is sampled for CCP/cc. A close examination also shows that the crystal-like configurations have a lower E12, indicating that the CG energy function captures the molecular forces stabilizing the crystal-like conformation. It is worth noting that such a correlation between E12 and RMSD, where the low E12 conformations are funneled into low RMSD regions in the context of protein-protein interactions, somewhat resembles the funnel-like shape recognized in protein folding (47–49).
Figure 4.
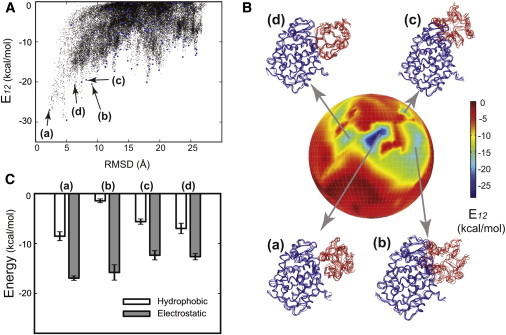
Energy landscape of the CCP/cc complex. (A) A plot of E12 versus RMSD. A total of 44,451 configurations from CGMD simulations are shown in black dots, where Rmax = 90 Å, Rc = 40 Å, and Rmin = 0 Å were used in the PPR scheme. (B) Front view of the energy globe colored by E12. A total of Nf = 191 clusters were obtained (also shown in blue dots in A) after the two-step clustering. Four representative conformations (a–d) are shown on the globe, where each conformation is represented by an ensemble of five lowest energy configurations. Conformation (a) with the lowest E12 resembles the crystal structure (46). Note that conformations with lower E12 are not observed in the back of this globe. (C) The decomposition of hydrophobic (white bars) and electrostatic (gray bars) energies from E12 for each conformation (a–d). Their averages (and standard deviations) were calculated from the ensemble of five configurations shown in B.
The resultant conformations after a two-step clustering were projected into an energy globe shown in Fig. 4 B. It is fairly easy to locate conformational states that are energetically stable or metastable. Marked by arrows on Fig. 4 B are four identified lowest E12 conformations, each of which consists of an ensemble of five configurations. Among them, conformation (a) has a very similar CCP/cc binding interfaces to the crystal configuration (within 3 Å of RMSD), suggesting that the crystal structure is favored in the CG energy evaluation. Other alternative conformations (b–d) are metastable in E12, which differ in either binding interfaces or relative orientations. For example, cytochrome c (in red) is rotated in conformation (c) away from the crystal-like conformation (a). Similar to what is observed in protein folding, these metastable conformations may serve as important intermediate states right before CCP/cc forms the crystal-like conformation, either thermodynamically or kinetically.
To evaluate the molecular forces driving toward the stable conformation, electrostatic and hydrophobic energies were examined separately according to Eq. 1. Fig. 4 C shows both components in these conformations (a–d) where electrostatics dominate over hydrophobic contributions in the total energy E12. This is consistent with that observed in the structural analysis of the CCP/cc complex (46). After all, electrostatic interactions are known to play an important role in protein-protein interactions (50,51). In addition, the crystal-like conformation (a) has stronger hydrophobic interactions compared to others (b–d), thus suggesting a possible role of hydrophobic interactions in the specificity of its crystal-like binding interface.
This phenomenon of electrostatics-driven protein association is also observed in two other complexes: E9/Im9 and E7/Im7, two immunity proteins in the form of specific bacterial toxin/inhibitor complexes (36,52). These two complexes have similar crystal structures (shown in Figs. 2 B and 3 C) with a sequence identity of 50%. Their PPR-CGMD simulation results exhibit a funnel-shaped plot of E12 versus RMSD (Fig. S4 A and Fig. S5 A), similar to what is seen in CCP/cc (Fig. 4 A). Each crystal-like conformation has the lowest E12 on the energy globe for both protein complexes (Fig. S4 B and Fig. S5 B), respectively. Four conformations (a–d) with low E12 identified from the energy globe have similar protein binding interfaces on the immunity protein (in blue), although their internal orientations are different. For their energy decomposition (Fig. S4 C and Fig. S5 C), it appears that E7/Im7 has much higher electrostatic energy than E9/Im9. This difference is mainly due to more charged residues involved at the E7/Im7 interface. It was also observed from mutation studies that a tyrosine (Tyr-54 of Im9) residue at the hydrophobic core of the binding interface is important for the stability of the E9/Im9 complex (36), which might contribute to the less dominant hydrophobic interactions.
RXR LBD dimer: hydrophobics-driven association
A different molecular driving force is observed in the formation of the LBD dimer of a nuclear receptor RXR. Fig. 5 A shows the plot of E12 versus RMSD (with respect to the crystal conformation) for this dimer, which is more rugged compared to the CCP/cc complex in Fig. 4 A. The plot is similar to the CCP/cc complex where the crystal-like conformation is favored, although conformation (d) has comparable E12 with the crystal-like conformation (a) (Fig. 5, A and B). In addition, these two conformations (a) and (d) are close on the energy globe, and differ only by 7 Å in RMSD (Fig. 5 B), suggesting that conformation (d) may serve as an intermediate to the formation of the crystal-like conformation. It is also clear that hydrophobic interactions generally dominate the RXR dimer interface, especially in the crystal-like conformation (a) (Fig. 5 C). Among all the four conformations, one exception is conformation (c) where the second LBD (in red) rotates away and binds at distant sites. A close examination on LBD binding interfaces in the crystal structure also shows that parts of the dimeric interface is weakly attractive or even repulsive locally in electrostatics (data not shown), thus suggesting that hydrophobic interactions are the major molecular driving forces in the dimerization.
Figure 5.

Energy landscape of the RXR LBD dimer. (A) A plot of E12 versus RMSD. A total of 58,480 configurations from CGMD simulations are shown in black dots, where Rmax = 100 Å, Rc = 45 Å, and Rmin = 0 Å were used in the PPR scheme. (B) Front view of the energy globe colored by E12. We used a total of Nf = 589 clusters (also shown in blue dots in A) after the two-step clustering. Four representative conformations (a–d) are shown on the globe, where conformation (a) resembles the crystal structure (64). (C) The decomposition of hydrophobic (white bars) and electrostatic (gray bars) energies from E12 for each conformation (a–d).
Barnase/barstar: interplay between hydrophobic and electrostatic interactions
The notion of a stable crystal-like conformation is challenged by simulation results of the barnase/barstar complex. Although the crystal conformation displayed stability in brute-force simulations (Fig. 2 A), PPR-based CGMD simulations show that multiple alternative conformations are energetically stable (Fig. 6 A). Fig. 6 B shows four conformations with low E12 (a–d) on a multibasin energy globe. In particular, conformation (b) has a similar E12 with the crystal-like conformation (a), but barstar (in red) binds at a distant site from the C-shaped binding groove of barnase (in blue). Furthermore, energy decomposition shows stronger hydrophobic interactions in conformations (a) and (d), whereas electrostatics is stronger in conformations (b) and (c) (Fig. 6 C). This suggests that an interplay between both electrostatic and hydrophobic interactions is in place among these conformations, in accord with experimental observations on a high degree of both shape and charge complementarity (35).
Figure 6.
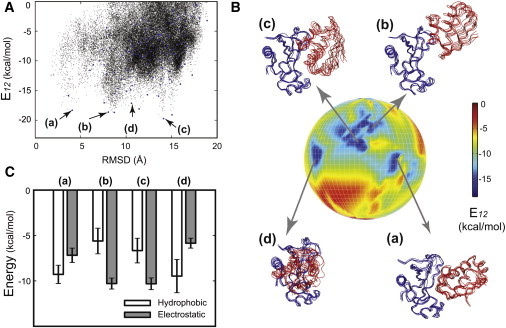
Energy landscape of the barnase/barstar complex. (A) A plot of E12 versus RMSD. A total of 43,554 configurations from CGMD simulations are shown in black dots, where Rmax= 50 Å, Rc = 25 Å, and Rmin = 0 Å were used in the PPR scheme. (B) Front view of the energy globe colored by E12. We used a total of Nf = 120 clusters (also shown in blue dots in A) after the two-step clustering. Four representative conformations (a–d) are shown on the globe, where conformation (a) with the lowest E12 resembles the crystal structure (35). (C) The decomposition of hydrophobic (white bars) and electrostatic (gray bars) energies from E12 for each conformation (a–d).
These simulation results may provide a possible explanation for previous mutation studies. Structural analyses based on the crystal structure show that a set of charged residues (Lys-27, Arg-87, and His-102) in barnase interact with barstar (35), as in the conformation (a). In contrast, a different set of charged residues (Arg-59, Glu-60, Lys-62, Lys-66, and Arg-69) are involved in conformation (b), contributing to an increased electrostatic energy. One difference is that Arg-59 is at the core of a network of interactions at the binding interface in conformation (b), whereas it is on the edge or far away from the core binding interfaces in the crystal-like conformation (a). Because of such a critical role of Arg-59 in the conformation (b), one would imagine that any disruption might affect its complex association, either thermodynamically or kinetically. Indeed, a significant change, >400 times in dissociation rate, has been observed in a point mutation of Arg-59 to Ala (53). Additional mutations Asn-58 and Glu-60 at the interface also show substantial change in the rate. This suggests that conformation (b), predicted from CGMD simulations, provides a structural basis for the observed large rate change upon mutation. We also note that the barnase surface at the conformation (b) is slightly deformed, suggesting that induced-fit helps achieve a better charge complementarity. Taken together, these results suggest that an energy landscape view of protein-protein interactions makes the identification of alternative conformations in barnase/barstar possible, further providing a sound structural basis for mutagenesis.
Concluding Remarks
We have established a theoretical pipeline to navigate the energy landscape of protein-protein association via PPR-CGMD simulations. The simulations naturally permit and account for the flexibility of protein domains in the realization of induced-fit mechanisms. The use of a PPR sampling scheme enables an exhaustive search to uncover hidden areas of the conformational space. An energy globe is further introduced to navigate the energy landscape of a wide range of resultant conformations. This globe also allows accessing the sampling quality determined by the extent to which the globe is covered by the simulation trajectories. Among four (out of five) protein complexes we examined, their crystal-like conformations are favorable on the energy landscape, suggesting that the CG model captures the basic features of molecular forces driving protein-protein association. One exception is barnase/barstar, where apart from the crystal-like conformation, alternative conformations are also energetically favored.
The ability of a simple CG model to identify relevant conformations could be due to the relatively smooth binding free energy landscape for functional proteins (54–57). Of course, the inherent simplifications in such a simple model cannot characterize atomically detailed interactions (23,58–61); in that case, the CG-identified conformations can be relaxed and used as a starting point for atomistic simulations. In addition, the current CG model has captured the physical basis of protein-protein association, but it may fail to produce meaningful results on protein-ligand interactions where details can matter. We also note that folding and unfolding, which can be coupled with the protein association process (54–56,62), are not studied here. Furthermore, our focus is mainly on protein association into compact conformations that are energetically favorable; the formation of extended and entropically favorable conformations, or the kinetic process of association itself, is not fully examined here, but will be illustrated in future communications.
Finally, we wish to emphasize that this PPR-CGMD simulation pipeline can be readily applied to those protein complexes whose crystal structures are unknown, especially since considerable knowledge about individual protein subunits has been made available after decades of efforts (63). It is thus anticipated that this pipeline is positioned to serve as an alternative approach to study protein-protein interactions on a wide range of protein complexes.
Acknowledgments
We thank Marc Parisien for critical reading of this manuscript.
This work was supported in part by the Cleveland Foundation, the American Cancer Society (ACS IRG-91-022-15), and the Department of Defense Breast Cancer Research Program (W81XWH-11-1033). Computational support was provided by the Case Western Reserve University High Performance Computing Cluster.
Supporting Material
References
- 1.Elcock A., Sept D., McCammon J. Computer simulation of protein-protein interactions. J. Phys. Chem. B. 2001;105:1504–1518. [Google Scholar]
- 2.Perkins J.R., Diboun I., Orengo C. Transient protein-protein interactions: structural, functional, and network properties. Structure. 2010;18:1233–1243. doi: 10.1016/j.str.2010.08.007. [DOI] [PubMed] [Google Scholar]
- 3.Koshland D.E., Jr. Application of a theory of enzyme specificity to protein synthesis. Proc. Natl. Acad. Sci. USA. 1958;44:98–104. doi: 10.1073/pnas.44.2.98. [DOI] [PMC free article] [PubMed] [Google Scholar]
- 4.Csermely P., Palotai R., Nussinov R. Induced fit, conformational selection and independent dynamic segments: an extended view of binding events. Trends Biochem. Sci. 2010;35:539–546. doi: 10.1016/j.tibs.2010.04.009. [DOI] [PMC free article] [PubMed] [Google Scholar]
- 5.Ritchie D.W. Recent progress and future directions in protein-protein docking. Curr. Protein Pept. Sci. 2008;9:1–15. doi: 10.2174/138920308783565741. [DOI] [PubMed] [Google Scholar]
- 6.Aloy P., Böttcher B., Russell R.B. Structure-based assembly of protein complexes in yeast. Science. 2004;303:2026–2029. doi: 10.1126/science.1092645. [DOI] [PubMed] [Google Scholar]
- 7.Parisien M., Freed K.F., Sosnick T.R. On docking, scoring and assessing protein-DNA complexes in a rigid-body framework. PLoS ONE. 2012;7:e32647. doi: 10.1371/journal.pone.0032647. [DOI] [PMC free article] [PubMed] [Google Scholar]
- 8.Kim Y.C., Hummer G. Coarse-grained models for simulations of multiprotein complexes: application to ubiquitin binding. J. Mol. Biol. 2008;375:1416–1433. doi: 10.1016/j.jmb.2007.11.063. [DOI] [PMC free article] [PubMed] [Google Scholar]
- 9.Solernou A., Fernandez-Recio J. pyDockCG: new coarse-grained potential for protein-protein docking. J. Phys. Chem. B. 2011;115:6032–6039. doi: 10.1021/jp112292b. [DOI] [PubMed] [Google Scholar]
- 10.Karplus M., Kuriyan J. Molecular dynamics and protein function. Proc. Natl. Acad. Sci. USA. 2005;102:6679–6685. doi: 10.1073/pnas.0408930102. [DOI] [PMC free article] [PubMed] [Google Scholar]
- 11.Hamelberg D., Shen T., Andrew McCammon J. Relating kinetic rates and local energetic roughness by accelerated molecular-dynamics simulations. J. Chem. Phys. 2005;122:241103. doi: 10.1063/1.1942487. [DOI] [PubMed] [Google Scholar]
- 12.Voter A.F. Hyperdynamics: accelerated molecular dynamics of infrequent events. Phys. Rev. Lett. 1997;78:3908–3911. [Google Scholar]
- 13.Jensen M.Ø., Park S., Schulten K. Energetics of glycerol conduction through aquaglyceroporin GlpF. Proc. Natl. Acad. Sci. USA. 2002;99:6731–6736. doi: 10.1073/pnas.102649299. [DOI] [PMC free article] [PubMed] [Google Scholar]
- 14.Grubmüller H., Heymann B., Tavan P. Ligand binding: molecular mechanics calculation of the streptavidin-biotin rupture force. Science. 1996;271:997–999. doi: 10.1126/science.271.5251.997. [DOI] [PubMed] [Google Scholar]
- 15.Yang S., Levine H., Onuchic J.N. Protein oligomerization through domain swapping: role of inter-molecular interactions and protein concentration. J. Mol. Biol. 2005;352:202–211. doi: 10.1016/j.jmb.2005.06.062. [DOI] [PubMed] [Google Scholar]
- 16.Isralewitz B., Gao M., Schulten K. Steered molecular dynamics and mechanical functions of proteins. Curr. Opin. Struct. Biol. 2001;11:224–230. doi: 10.1016/s0959-440x(00)00194-9. [DOI] [PubMed] [Google Scholar]
- 17.Nymeyer H., García A.E., Onuchic J.N. Folding funnels and frustration in off-lattice minimalist protein landscapes. Proc. Natl. Acad. Sci. USA. 1998;95:5921–5928. doi: 10.1073/pnas.95.11.5921. [DOI] [PMC free article] [PubMed] [Google Scholar]
- 18.Shea J.E., Onuchic J.N., Brooks C.L., 3rd Exploring the origins of topological frustration: design of a minimally frustrated model of fragment B of protein A. Proc. Natl. Acad. Sci. USA. 1999;96:12512–12517. doi: 10.1073/pnas.96.22.12512. [DOI] [PMC free article] [PubMed] [Google Scholar]
- 19.Clementi C., Nymeyer H., Onuchic J.N. Topological and energetic factors: what determines the structural details of the transition state ensemble and “en-route” intermediates for protein folding? An investigation for small globular proteins. J. Mol. Biol. 2000;298:937–953. doi: 10.1006/jmbi.2000.3693. [DOI] [PubMed] [Google Scholar]
- 20.Koga N., Takada S. Roles of native topology and chain-length scaling in protein folding: a simulation study with a Go-like model. J. Mol. Biol. 2001;313:171–180. doi: 10.1006/jmbi.2001.5037. [DOI] [PubMed] [Google Scholar]
- 21.Karanicolas J., Brooks C.L., 3rd The origins of asymmetry in the folding transition states of protein L and protein G. Protein Sci. 2002;11:2351–2361. doi: 10.1110/ps.0205402. [DOI] [PMC free article] [PubMed] [Google Scholar]
- 22.Elcock A.H. Molecular simulations of cotranslational protein folding: fragment stabilities, folding cooperativity, and trapping in the ribosome. PLoS Comput. Biol. 2006;2:e98. doi: 10.1371/journal.pcbi.0020098. [DOI] [PMC free article] [PubMed] [Google Scholar]
- 23.Takada S. Coarse-grained molecular simulations of large biomolecules. Curr. Opin. Struct. Biol. 2012;22:130–137. doi: 10.1016/j.sbi.2012.01.010. [DOI] [PubMed] [Google Scholar]
- 24.Onuchic J.N., Wolynes P.G. Theory of protein folding. Curr. Opin. Struct. Biol. 2004;14:70–75. doi: 10.1016/j.sbi.2004.01.009. [DOI] [PubMed] [Google Scholar]
- 25.Flores S.C., Bernauer J., Huang X. Multiscale modeling of macromolecular biosystems. Brief Bioinform. 2012;13:395–405. doi: 10.1093/bib/bbr077. [DOI] [PubMed] [Google Scholar]
- 26.Mills B.M., Chong L.T. Molecular simulations of mutually exclusive folding in a two-domain protein switch. Biophys. J. 2011;100:756–764. doi: 10.1016/j.bpj.2010.12.3710. [DOI] [PMC free article] [PubMed] [Google Scholar]
- 27.Graham T.G.W., Best R.B. Force-induced change in protein unfolding mechanism: discrete or continuous switch? J. Phys. Chem. B. 2011;115:1546–1561. doi: 10.1021/jp110738m. [DOI] [PubMed] [Google Scholar]
- 28.Daily M.D., Phillips G.N., Jr., Cui Q. Many local motions cooperate to produce the adenylate kinase conformational transition. J. Mol. Biol. 2010;400:618–631. doi: 10.1016/j.jmb.2010.05.015. [DOI] [PMC free article] [PubMed] [Google Scholar]
- 29.Yang S., Onuchic J.N., Levine H. Effective stochastic dynamics on a protein folding energy landscape. J. Chem. Phys. 2006;125:054910. doi: 10.1063/1.2229206. [DOI] [PubMed] [Google Scholar]
- 30.Sobolev V., Sorokine A., Edelman M. Automated analysis of interatomic contacts in proteins. Bioinformatics. 1999;15:327–332. doi: 10.1093/bioinformatics/15.4.327. [DOI] [PubMed] [Google Scholar]
- 31.Miyazawa S., Jernigan R.L. Residue-residue potentials with a favorable contact pair term and an unfavorable high packing density term, for simulation and threading. J. Mol. Biol. 1996;256:623–644. doi: 10.1006/jmbi.1996.0114. [DOI] [PubMed] [Google Scholar]
- 32.Brooks B., Bruccoleri R., Karplus M. CHARMM: a program for macromolecular energy, minimization, and dynamics calculations. J. Comput. Chem. 1983;4:187–217. [Google Scholar]
- 33.Yang S., Roux B. Src kinase conformational activation: thermodynamics, pathways, and mechanisms. PLoS Comput. Biol. 2008;4:e1000047. doi: 10.1371/journal.pcbi.1000047. [DOI] [PMC free article] [PubMed] [Google Scholar]
- 34.Karpen M.E., Tobias D.J., Brooks C.L., 3rd Statistical clustering techniques for the analysis of long molecular dynamics trajectories: analysis of 2.2-ns trajectories of YPGDV. Biochemistry. 1993;32:412–420. doi: 10.1021/bi00053a005. [DOI] [PubMed] [Google Scholar]
- 35.Buckle A.M., Schreiber G., Fersht A.R. Protein-protein recognition: crystal structural analysis of a barnase-barstar complex at 2.0-A resolution. Biochemistry. 1994;33:8878–8889. doi: 10.1021/bi00196a004. [DOI] [PubMed] [Google Scholar]
- 36.Kühlmann U.C., Pommer A.J., Kleanthous C. Specificity in protein-protein interactions: the structural basis for dual recognition in endonuclease colicin-immunity protein complexes. J. Mol. Biol. 2000;301:1163–1178. doi: 10.1006/jmbi.2000.3945. [DOI] [PubMed] [Google Scholar]
- 37.Stites W.E. Protein-protein interactions: interface structure, binding thermodynamics, and mutational analysis. Chem. Rev. 1997;97:1233–1250. doi: 10.1021/cr960387h. [DOI] [PubMed] [Google Scholar]
- 38.Keeble A.H., Kirkpatrick N., Kleanthous C. Calorimetric dissection of colicin DNase—immunity protein complex specificity. Biochemistry. 2006;45:3243–3254. doi: 10.1021/bi052373o. [DOI] [PubMed] [Google Scholar]
- 39.Simons K.T., Kooperberg C., Baker D. Assembly of protein tertiary structures from fragments with similar local sequences using simulated annealing and Bayesian scoring functions. J. Mol. Biol. 1997;268:209–225. doi: 10.1006/jmbi.1997.0959. [DOI] [PubMed] [Google Scholar]
- 40.Sugita Y., Okamoto Y. Replica-exchange molecular dynamics method for protein folding. Chem. Phys. Lett. 1999;314:141–151. [Google Scholar]
- 41.Sanbonmatsu K.Y., García A.E. Structure of Met-enkephalin in explicit aqueous solution using replica exchange molecular dynamics. Proteins. 2002;46:225–234. doi: 10.1002/prot.1167. [DOI] [PubMed] [Google Scholar]
- 42.Zhou R., Berne B.J., Germain R. The free energy landscape for beta hairpin folding in explicit water. Proc. Natl. Acad. Sci. USA. 2001;98:14931–14936. doi: 10.1073/pnas.201543998. [DOI] [PMC free article] [PubMed] [Google Scholar]
- 43.Okur A., Roe D.R., Simmerling C. Improving convergence of replica-exchange simulations through coupling to a high-temperature structure reservoir. J. Chem. Theory Comput. 2007;3:557–568. doi: 10.1021/ct600263e. [DOI] [PubMed] [Google Scholar]
- 44.Weinan E., Ren W., Vanden-Eijnden E. String method for the study of rare events. Phys. Rev. B. 2002;66:052301. doi: 10.1021/jp0455430. [DOI] [PubMed] [Google Scholar]
- 45.Maragliano L., Fischer A., Ciccotti G. String method in collective variables: minimum free energy paths and isocommittor surfaces. J. Chem. Phys. 2006;125:24106. doi: 10.1063/1.2212942. [DOI] [PubMed] [Google Scholar]
- 46.Pelletier H., Kraut J. Crystal structure of a complex between electron transfer partners, cytochrome c peroxidase and cytochrome c. Science. 1992;258:1748–1755. doi: 10.1126/science.1334573. [DOI] [PubMed] [Google Scholar]
- 47.Leopold P.E., Montal M., Onuchic J.N. Protein folding funnels: kinetic pathways through compact conformational space. Proc. Natl. Acad. Sci. USA. 1992;89:8721–8725. doi: 10.1073/pnas.89.18.8721. [DOI] [PMC free article] [PubMed] [Google Scholar]
- 48.Wolynes P.G., Onuchic J.N., Thirumalai D. Navigating the folding routes. Science. 1995;267:1619–1620. doi: 10.1126/science.7886447. [DOI] [PubMed] [Google Scholar]
- 49.Dill K.A., Chan H.S. From Levinthal to pathways to funnels. Nat. Struct. Biol. 1997;4:10–19. doi: 10.1038/nsb0197-10. [DOI] [PubMed] [Google Scholar]
- 50.Sheinerman F.B., Norel R., Honig B. Electrostatic aspects of protein-protein interactions. Curr. Opin. Struct. Biol. 2000;10:153–159. doi: 10.1016/s0959-440x(00)00065-8. [DOI] [PubMed] [Google Scholar]
- 51.Baker N., McCammon J. Vol. 44. John Wiley & Sons; Hoboken, NJ: 2005. (Electrostatic Interactions in Structural Bioinformatics). [Google Scholar]
- 52.Ko T.P., Liao C.C., Yuan H.S. The crystal structure of the DNase domain of colicin E7 in complex with its inhibitor Im7 protein. Structure. 1999;7:91–102. doi: 10.1016/s0969-2126(99)80012-4. [DOI] [PubMed] [Google Scholar]
- 53.Schreiber G., Fersht A.R. Interaction of barnase with its polypeptide inhibitor barstar studied by protein engineering. Biochemistry. 1993;32:5145–5150. doi: 10.1021/bi00070a025. [DOI] [PubMed] [Google Scholar]
- 54.Shoemaker B.A., Portman J.J., Wolynes P.G. Speeding molecular recognition by using the folding funnel: the fly-casting mechanism. Proc. Natl. Acad. Sci. USA. 2000;97:8868–8873. doi: 10.1073/pnas.160259697. [DOI] [PMC free article] [PubMed] [Google Scholar]
- 55.Andrec M., Felts A.K., Levy R.M. Protein folding pathways from replica exchange simulations and a kinetic network model. Proc. Natl. Acad. Sci. USA. 2005;102:6801–6806. doi: 10.1073/pnas.0408970102. [DOI] [PMC free article] [PubMed] [Google Scholar]
- 56.Wang J., Huang W., Wang E. Downhill kinetics of biomolecular interface binding: globally connected scenario. Biophys. J. 2004;87:2187–2194. doi: 10.1529/biophysj.104.042747. [DOI] [PMC free article] [PubMed] [Google Scholar]
- 57.Tunbridge I., Best R.B., Kuttel M.M. Simulation of coarse-grained protein-protein interactions with graphics processing units. J. Chem. Theory Comput. 2010;6:3588–3600. doi: 10.1021/ct1003884. [DOI] [PubMed] [Google Scholar]
- 58.Riniker S., Allison J.R., van Gunsteren W.F. On developing coarse-grained models for biomolecular simulation: a review. Phys. Chem. Chem. Phys. 2012 doi: 10.1039/c2cp40934h. In press. [DOI] [PubMed] [Google Scholar]
- 59.Rader A.J. Coarse-grained models: getting more with less. Curr. Opin. Pharmacol. 2010;10:753–759. doi: 10.1016/j.coph.2010.09.003. [DOI] [PubMed] [Google Scholar]
- 60.Thomas P.D., Dill K.A. Statistical potentials extracted from protein structures: how accurate are they? J. Mol. Biol. 1996;257:457–469. doi: 10.1006/jmbi.1996.0175. [DOI] [PubMed] [Google Scholar]
- 61.Gopal S.M., Mukherjee S., Feig M. PRIMO/PRIMONA: a coarse-grained model for proteins and nucleic acids that preserves near-atomistic accuracy. Proteins. 2010;78:1266–1281. doi: 10.1002/prot.22645. [DOI] [PMC free article] [PubMed] [Google Scholar]
- 62.Okazaki K.-i., Takada S. Dynamic energy landscape view of coupled binding and protein conformational change: induced-fit versus population-shift mechanisms. Proc. Natl. Acad. Sci. USA. 2008;105:11182–11187. doi: 10.1073/pnas.0802524105. [DOI] [PMC free article] [PubMed] [Google Scholar]
- 63.Levitt M. Nature of the protein universe. Proc. Natl. Acad. Sci. USA. 2009;106:11079–11084. doi: 10.1073/pnas.0905029106. [DOI] [PMC free article] [PubMed] [Google Scholar]
- 64.Egea P.F., Mitschler A., Moras D. Molecular recognition of agonist ligands by RXRs. Mol. Endocrinol. 2002;16:987–997. doi: 10.1210/mend.16.5.0823. [DOI] [PubMed] [Google Scholar]
- 65.Jelesarov I., Bosshard H.R. Isothermal titration calorimetry and differential scanning calorimetry as complementary tools to investigate the energetics of biomolecular recognition. J. Mol. Recognit. 1999;12:3–18. doi: 10.1002/(SICI)1099-1352(199901/02)12:1<3::AID-JMR441>3.0.CO;2-6. [DOI] [PubMed] [Google Scholar]
Associated Data
This section collects any data citations, data availability statements, or supplementary materials included in this article.