

Abstract
We analyze simple dynamical network models which describe the limited capacity of nodes to process the input information. For a proper range of their parameters, the information flow pattern in these models is characterized by exponential distribution of the incoming information and a fat-tailed distribution of the outgoing information, as a signature of the law of diminishing marginal returns. We apply this analysis to effective connectivity networks from human EEG signals, obtained by Granger Causality, which has recently been given an interpretation in the framework of information theory. From the distributions of the incoming versus the outgoing values of the information flow it is evident that the incoming information is exponentially distributed whilst the outgoing information shows a fat tail. This suggests that overall brain effective connectivity networks may also be considered in the light of the law of diminishing marginal returns. Interestingly, this pattern is reproduced locally but with a clear modulation: a topographic analysis has also been made considering the distribution of incoming and outgoing values at each electrode, suggesting a functional role for this phenomenon.
Introduction
Most social, biological, and technological systems can be modeled as complex networks, and display substantial non-trivial topological features [1], [2]. Moreover, time series of simultaneously recorded variables are available in many fields of science; the inference of the underlying network structure, from these time series, is an important problem that received great attention in the last years. A method based on chaotic synchronization has been proposed in [3], a method based on model identification has been described in [4]. Use of a phase slope index to detect directionalities of interactions has been proposed in [5].
The inference of dynamical networks is also related to the estimation, from data, of the flow of information between variables, as measured by the transfer entropy [6], [7]. Wiener [8] and Granger [9] formalized the notion that, if the prediction of one time series could be improved by incorporating the knowledge of past values of a second one, then the latter is said to have a causal influence on the former. Initially developed for econometric applications, Granger causality has gained popularity also among physicists (see, e.g., [10]–[15]) and eventually became one of the methods of choice to study brain connectivity in neuroscience [16]. Multivariate Granger causality may be used to infer the structure of dynamical networks from data as described in [17]. It has been recently shown that for Gaussian variables Granger causality and transfer entropy are equivalent [18], and this framework has also been generalized to other probability densities [19]. Hence a weighted network obtained by Granger causality analysis can be given an interpretation in terms of flow of information between different components of a system. This way to look at information flow is particularly relevant for neuroscience, where it is crucial to shed light on the communication among neuronal populations, which is the mechanism underlying the information processing in the brain [20]. Furthermore, recent studies have investigated the economics implications of several network types mapping brain function [21], [22].
In many situations it can be expected that each node of the network may handle a limited amount of information. This structural constraint suggests that information flow networks should exhibit some topological evidences of the law of diminishing marginal returns [23], a fundamental principle of economics which states that when the amount of a variable resource is increased, while other resources are kept fixed, the resulting change in the output will eventually diminish [24], [25]. The purpose of this work is to introduce a simple dynamical network model where the topology of connections, assumed to be undirected, gives rise to a peculiar pattern of the information flow between nodes: a fat tailed distribution of the outgoing information flows while the average incoming information flow does not depend on the connectivity of the node. In the proposed model the units, at the nodes the network, are characterized by a transfer function that allows them to process just a limited amount of the incoming information. We show that a similar behavior is observed in another network model, which describes in a different fashion the law of diminishing marginal returns. Moreover, we also propose an exactly solvable Ising model on sparse networks, in the limit of an infinite number of nodes, whose behavior may be seen in the light of the law of diminishing marginal returns. Finally we show that this relevant topological feature is found as well in real neural data.
Materials and Methods
We implement three models on different network structures. Then we analyze human EEG data.
Model 1
The first model we propose is as follows. Given an undirected network of  nodes and symmetric connectivity matrix
  , to each node we associate a real variable
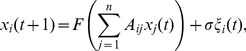
  whose evolution, at discrete times, is given by:
 |
(1) |
where  are unit variance Gaussian noise terms, whose strength is controlled by
  ;
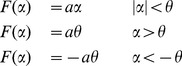
;  is a transfer function chosen as follows:
 |
(2) |
where  is a threshold value. This transfer function is chosen to mimic the fact that each unit is capable to handle a limited amount of information. For large
  our model becomes a linear map. At intermediate values of
  , the nonlinearity connected to the threshold will affect mainly the mostly connected nodes (hubs): the input
  to nodes with low connectivity will remain typically sub-threshold in this case. We consider hierarchical networks generated by preferential attachment mechanism [26]. From numerical simulations of eqs. (1), we evaluate the linear causality pattern for this system as the threshold is varied. We verify that, in spite of the threshold, variables are nearly Gaussian so that we may identify the causality with the information flow between variables [18].
Model 2
We also analyze the following model: to each node of an undirected network we associate the variable  whose evolution is
| (3) |
where  is a node chosen randomly, at each time
  , in the set of the neighboring nodes of
  . Equations (3) implement, in a different way from (1), the occurrence that nodes may handle a limited incoming information: at each time each node is influenced just by one other node.
Model 3
As another example we consider a diluted Ising model on a directed network [27], [28], constructed as follows. The model is made of  Ising spins
  , each connected (with coupling
  ) to
) to  input spins, chosen at random among the
  remaining spins. The number of incoming links for each spin, the in-degree
  , is independently sampled with probability
  ,
,  ,
,  being the maximum value that
  may assume. The dynamics of the system corresponds to parallel updating of Ising variables
  :
:
| (4) |
where the local fields are given by
| (5) |
where the sum is over the input spins of  , and
, and  is the positive coupling. We will consider the limit
 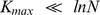 : it is well known that input spins may be treated as independent stochastic variables in this limit: this makes simple the numerical evaluation of
  , the transfer entropy from one input spin to a target spin of connectivity
  (see, e.g., [29]). For
  the out-degree of spins,
  , is a Poisson distribution with parameter
The input flow of information for a spin with in-degree  is
is
whilst the average information flow outgoing a spin of out-degree  is given by
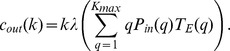 |
The distribution of  in the whole system is.
Human EEG Data
As a real example we consider electroencephalogram (EEG) data. We used recording obtained at rest from 10 healthy subjects. During the experiment, which lasted for 15 min, the subjects were instructed to relax and keep their eyes closed. To avoid drowsiness, every minute the subjects were asked to open their eyes for 5 s. EEG was measured with a standard 10–20 system consisting of 19 channels [5]. Data were analyzed using the linked mastoids reference, and are available from [30].
Results
Model 1
Concerning the first model, we compute the incoming and outgoing information flow from and to each node,  and
and  , summing respectively all the sources for a given target and all the targets for a given source. Then we evaluate the standard deviation of the distributions of
  and
and  , varying the realization of the preferential attachment network and running eqs. (1) for 10000 time points.
In figure 1 we depict  , the ratio between the standard deviation of
  over those of
  , as a function of the
  . As the threshold is varied, we encounter a range of for which the distribution of
  is much narrower than that of
  . In the same figure we also depict the corresponding curve for deterministic scale free networks [31], which exhibits a similar peak, and for homogeneous random graphs (or Erdos-Renyi networks [32]), with
  always very close to one. The discrepancy between the distributions of the incoming and outgoing causalities arises thus in hierarchical networks. We remark that, in order to quantify the difference between the distributions of
  and
and  , here we use the ratio of standard deviations but qualitatively similar results would have been shown using other measures of discrepancy.
Figure 1. Modulation of R for different network architectures.
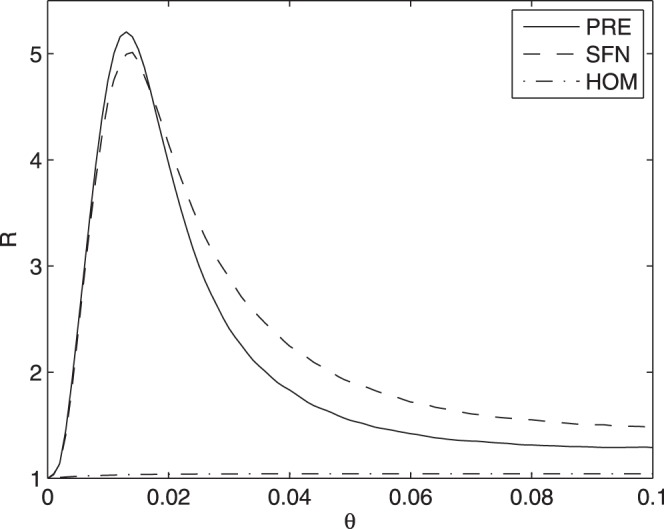
The ratio between the standard deviation of  and those of
  ,
,  , is plotted versus
  for the three architectures of network: preferential attachment (PRE), deterministic scale free (SFN) and homogeneous (HOM). The parameters of the dynamical system are
  and
and  . Networks built by preferential attachment are made of 30 nodes and 30 undirected links, while the deterministic scale free network of 27 nodes is considered. The homogeneous networks have 27 nodes, each connected to two other randomly chosen nodes.
In figure 2 we report the scatter plot in the plane  for preferential attachment networks and for some values of the threshold. The distributions of
  and
and  , with
  equal to 0.012 and corresponding to the peak of figure 1, are depicted in figure 3:
 appears to be exponentially distributed around a typical value, whilst
  shows a fat tail. In other words, the power law connectivity, of the underlying network, influences just the distribution of outgoing causalities.
Figure 2. Incoming and outgoing information and coupling.

Scatter plot in the plane  for undirected networks of 30 nodes and 30 links built by means of the preferential attachment mechanism. The parameters of the dynamical system are
  and
and  . The points represent the nodes of 100 realizations of preferential attachment networks, each with 10 simulations of eqs. (1) for 10000 time points. (Top-left) Scatter plot of the distribution for all nodes at
  . (Top-right) Contour plot of the distribution for all nodes at
  . (Bottom-left) Scatter plot of the distribution for all nodes at
  . (Bottom-right) The total causality (obtained summing over all pairs of nodes) is plotted versus
  ; circles point to the values of
  in the previous subfigures.
Figure 3. Distributions of information flow for the preferential attachment network.

For the preferential attachment network, at  , the distributions (by smoothing spline estimation) of
  and
and  are depicted. Units on the vertical axis are arbitrary.
In figure 4 we show the average value of  and
and  versus the connectivity
  of the network node:
  grows uniformly with
  , thus confirming that its fat tail is a consequence of the power law of the connectivity. On the contrary
  appears to be almost constant: on average the nodes receive the same amount of information, irrespective of
  , whilst the outgoing information from each node depends on the number of neighbors.
Figure 4. Information flow versus connectivity.

In the ensemble of preferential attachment networks of figure (2), at  ,
,  and
and  are averaged over nodes with the same connectivity and plotted versus the connectivity.
It is worth mentioning that since a precise estimation of the information flow is computationally expensive, our simulations are restricted to rather small networks; in particular the distribution of  appears to have a fat tail but, due to our limited data, we can not claim that it corresponds to a simple power-law.
Model 2
A fat tail in the distribution of  is observed also in model 2: in figure 5 we depict
  as a function of
  , for preferential attachment networks and for different size of the networks: the discrepancy between the distributions of
  and
and  increases as the size of the network grows while keeping
  fixed.
Figure 5. Influence of the network size on R.

For the model (3) the ratio  , between the standard deviation of
  and those of
  , is depicted versus
  . Preferential attachment networks, of
  nodes and
  links, are considered.
Model 3
As already stated, model 3 is exactly solvable in the limit  . In figure 6 we depict
  and
and  versus
  , for a power law distribution for connectivity
  ,
,  ,
,  and
and  . The incoming information flow tends to saturate for spins with large in-degree.
Figure 6. Information flow distributions for the Ising model.

The total transfer entropy versus the in-degree and the out-degree for the Ising model.
In figure 7 we depict  for several values of
  corresponding to a power law distribution for in-degree of spins characterized by
  . For low
  the distribution of
  appears to be a power law as the in-degree distribution:
 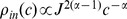 at small
  . Increasing
  , the distribution tends to became exponential, in spite of the power law of input connectivity. These results are robust w.r.t. changes in the exponent
  .
.
Figure 7. Modulation of incoming information for the Ising model.

The distribution of  , for the Ising model, with
  varying from
  to
to  with step
  (from the left to the right).
EEG Data
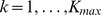
For each subject we considered several epochs of 4 seconds in which the subjects kept their eyes closed. For each epoch we computed multivariate Kernel Granger Causality [15] using a linear kernel and a model order of  , determined by leave-one-out cross-validation. We then pooled all the values for information flow towards and from any electrode and analyzed their distribution.
In figure 8 we plot the incoming versus the outgoing values of the information flow, as well as the distributions of the two quantities: the incoming information seems exponentially distributed whilst the outgoing information shows a fat tail. These results suggest that overall brain effective connectivity networks may also be considered in the light of the law of diminishing marginal returns.
Figure 8. Incoming and outgoing information for EEG data.

For the EEG data the distributions of  and
and  are depicted in a scatter plot (left) and in terms of their distributions, obtained by smoothing spline estimation (right).
More interestingly, this pattern is reproduced locally but with a clear modulation: a topographic analysis has also been made considering the distribution of incoming and outgoing causalities at each electrode. In figure 9 we show the distributions of incoming and outgoing connections corresponding to the electrodes locations on the scalp, and in figure 10 the corresponding map of the parameter  ; the law of diminishing marginal returns seems to affect mostly the temporal regions. This well defined pattern suggests a functional role for the distributions. It is worth to note that this pattern has been reproduced in other EEG data at rest from 9 healthy subjects collected for another study with a different equipment.
Figure 9. Topological probability distributions.

The distributions for incoming (above, light grey) and outgoing (below, dark grey) information at each EEG electrode displayed on the scalp map (original binning and smoothing spline estimation).
Figure 10. Topographic map of R.

The distribution on the scalp of  , the ratio between the standard deviations of the distributions of outgoing and incoming information, for EEG data.
Discussion
In this work we have pointed out that the pattern of information flow among variables of a complex system is the result of the interplay between the topology of the underlying network and the capacity of nodes to handle the incoming information. Implementing two simple toy models on different network structures, we have shown that they may exhibit the law of diminishing marginal returns for a suitable choice of parameters: the presence of nodes with different in-degree is a fundamental ingredient for these phenomena. Our simulations for these two models are restricted to rather small networks, due to the computational burden. However to address this issue we have also proposed an Ising model on a sparse network, which can be exactly solved in the limit of an infinite number of nodes; a similar behavior emerged as well in this case.
The analysis of a real EEG data-set has shown that similar patterns exist for brain signals and could have a specific functional role. We remark that the distribution of in-degree in resting state fMRI directed networks has been observed to fit an exponentially truncated power law [33]; in the same study the architecture of directed networks was presented as a complement to the same work performed in anatomical and functional connectivity.
Apart from fMRI, there is an increasing interest in investigating resting state networks from EEG recordings [34]. The findings of our study could then represent an additional feature to consider in these networks.
The study of information flow mechanisms is crucial in brain research, and effective methods to mine the information flow pattern from data have been recently introduced. Recently interesting contributions, towards a better understanding of communications in brain, have been provided [35]. Our results, thus, may be relevant to get a better characterization of the topology of brain networks.
In general, evidences of the law of diminishing marginal returns are related to the presence of units which are close to be receiving the maximal amount of information that they can process. A similar interpretation may apply in neuroscience. Indeed the brain is an expensive part of human body, and the organization of brain networks can be explained by a parsimonious drive; it has been proposed that connectomes organization corresponds to a trade-off between minimizing costs and the emergence of functional connectivity between multiple neural populations [22]. This economical principle in brain networks may also be connected to the presence, under particular circumstances, of brain units receiving the maximal amount of information in input. Such situations will display evidences of the law of diminishing marginal returns and should be put in evidence by the proposed analysis.
We should as well mention that there are other measures of directed brain connectivity, such as Directed Transfer Function, Partial Directed Coherence and Phase Slope Index, for which the interpretation in terms of information flow is still debated [36]. On the other hand we verified that a significant discrepancy between the distributions of incoming and outgoing connectivities holds also for these methods. Furthermore, bivariate measures do not display this asymmetry of the distributions of  and
and  : this is not surprising, indeed it is well known that bivariate causality also account for indirect interactions, see e.g. [17]. Here we limited ourselves to linear information flow; the amount of nonlinear information transmission and its functional roles are not clear [37]. It will be interesting to investigate these phenomena also in the nonlinear case.
Funding Statement
GW is visiting Gent University with a grant of China Scholarship Council (no 2011607033). No additional external funding received for this study. The funders had no role in study design, data collection and analysis, decision to publish, or preparation of the manuscript.
References
- 1. Barabasi A, Crandall R (2003) Linked: The new science of networks. American Journal of Physics 71: 409. [Google Scholar]
- 2. Boccaletti S, Latora V, Moreno Y, Chavez M, Hwang D (2006) Complex networks: Structure and dynamics. Physics Reports 424: 175–308. [Google Scholar]
- 3. Yu D, Righero M, Kocarev L (2006) Estimating topology of networks. Physical Review Letters 97: 188701. [DOI] [PubMed] [Google Scholar]
- 4. Napoletani D, Sauer T (2008) Reconstructing the topology of sparsely connected dynamical networks. Physical Review E 77: 026103. [DOI] [PubMed] [Google Scholar]
- 5. Nolte G, Ziehe A, Nikulin V, Schlögl A, Krämer N, et al. (2008) Robustly estimating the flow direction of information in complex physical systems. Physical Review Letters 100: 234101. [DOI] [PubMed] [Google Scholar]
- 6. Schreiber T (2000) Measuring information transfer. Physical Review Letters 85: 461–464. [DOI] [PubMed] [Google Scholar]
- 7. Staniek M, Lehnertz K (2008) Symbolic transfer entropy. Physical Review Letters 100: 158101. [DOI] [PubMed] [Google Scholar]
- 8.Wiener N (1956) The theory of prediction. In EF Beckenbach, Ed, Modern mathematics for Engineers.
- 9. Granger C (1969) Investigating causal relations by econometric models and cross-spectral methods. Econometrica: Journal of the Econometric Society 37: 424–438. [Google Scholar]
- 10. Geweke J (1984) Measures of conditional linear dependence and feedback between time series. Journal of the American Statistical Association 79: 907–915. [Google Scholar]
- 11. Chen Y, Rangarajan G, Feng J, Ding M (2004) Analyzing multiple nonlinear time series with extended granger causality. Physics Letters A 324: 26–35. [Google Scholar]
- 12. Blinowska K, Kuś R, Kamiński M (2004) Granger causality and information flow in multivariate processes. Physical Review E 70: 050902. [DOI] [PubMed] [Google Scholar]
- 13. Smirnov D, Bezruchko B (2009) Detection of couplings in ensembles of stochastic oscillators. Physical Review E 79: 046204. [DOI] [PubMed] [Google Scholar]
- 14. Dhamala M, Rangarajan G, Ding M (2008) Estimating granger causality from fourier and wavelet transforms of time series data. Physical Review Letters 100: 18701. [DOI] [PubMed] [Google Scholar]
- 15. Marinazzo D, Pellicoro M, Stramaglia S (2008) Kernel method for nonlinear granger causality. Physical Review Letters 100: 144103. [DOI] [PubMed] [Google Scholar]
- 16. Bressler S, Seth A (2011) Wiener-granger causality: A well established methodology. Neuroimage 58: 323–329. [DOI] [PubMed] [Google Scholar]
- 17. Marinazzo D, Pellicoro M, Stramaglia S (2008) Kernel-granger causality and the analysis of dynamical networks. Physical Review E 77: 056215. [DOI] [PubMed] [Google Scholar]
- 18. Barnett L, Barrett A, Seth A (2009) Granger causality and transfer entropy are equivalent for gaussian variables. Physical Review Letters 103: 238701. [DOI] [PubMed] [Google Scholar]
- 19. Hlavácková-Schindler K (2011) Equivalence of granger causality and transfer entropy: A generalization. Applied Mathematical Sciences 5: 3637–3648. [Google Scholar]
- 20. Friston K (2011) Functional and effective connectivity: A review. Brain Connectivity 1: 13–36. [DOI] [PubMed] [Google Scholar]
- 21. Vértes P, Alexander-Bloch A, Gogtay N, Giedd J, Rapoport J, et al. (2012) Simple models of human brain functional networks. Proceedings of the National Academy of Sciences 109: 5868–5873. [DOI] [PMC free article] [PubMed] [Google Scholar]
- 22. Bullmore E, Sporns O (2012) The economy of brain network organization. Nature Reviews Neuroscience 13: 336–349. [DOI] [PubMed] [Google Scholar]
- 23.Samuelson P, Nordhaus W (2001) Microeconomics (mcgraw-hill book company, oklahoma city).
- 24. López L, Sanjuán M (2002) Relation between structure and size in social networks. Physical Review E 65: 036107. [DOI] [PubMed] [Google Scholar]
- 25. Almendral J, López L, Sanjuán M (2003) Information flow in generalized hierarchical networks. Physica A: Statistical Mechanics and its Applications 324: 424–429. [Google Scholar]
- 26. Barabási A, Albert R (1999) Emergence of scaling in random networks. Science 286: 509–512. [DOI] [PubMed] [Google Scholar]
- 27. Derrida B, Gardner E, Zippelius A (1987) An exactly solvable asymmetric neural network model. Europhysics Letters 4: 167. [Google Scholar]
- 28. Lattanzi G, Nardulli G, Pasquariello G, Stramaglia S (1997) Stochastic learning in a neural network with adapting synapses. Physical Review E 56: 4567. [Google Scholar]
- 29. Pellicoro M, Stramaglia S (2010) Granger causality and the inverse ising problem. Physica A 389: 4747. [Google Scholar]
- 30. http://clopinet.com/causality/data/nolte/.Accessed 2012 Jul 6.
- 31. Barabási A, Ravasz E, Vicsek T (2001) Deterministic scale-free networks. Physica A: Statistical Mechanics and its Applications 299: 559–564. [Google Scholar]
- 32.Erdős P, Rényi A (1960) On the evolution of random graphs. Akad. Kiadó.
- 33. Liao W, Ding J, Marinazzo D, Xu Q, Wang Z, et al. (2011) Small-world directed networks in the human brain: Multivariate granger causality analysis of resting-state fmri. Neuroimage 54: 2683–2694. [DOI] [PubMed] [Google Scholar]
- 34.Mehrkanoon S, Breakspear M, Daffertshofer A, Boonstra T (2011) Generalized time-frequency coherency for assessing neural interactions in electrophysiological recordings. Nature Precedings, precedingsnaturecom/documents/6615/version/1, accessed July 6 2012.
- 35. Dugladze T, Schmitz D, Whittington M, Vida I, Gloveli T (2012) Segregation of axonal and somatic activity during fast network oscillations. Science 336: 6087. [DOI] [PubMed] [Google Scholar]
- 36. Takahashi D, Baccalá L, Sameshima K (2010) Information theoretic interpretation of frequency domain connectivity measures. Biological Cybernetics 103: 463–469. [DOI] [PubMed] [Google Scholar]
- 37. Marinazzo D, Liao W, Chen H, Stramaglia S (2011) Nonlinear connectivity by granger causality. NeuroImage 58: 330–338. [DOI] [PubMed] [Google Scholar]