

Abstract
The NS3 helicase of Hepatitis C virus is an ATP-fueled molecular motor that can translocate along single-stranded (ss) nucleic acid, and unwind double-stranded nucleic acids. It makes a promising antiviral target and an important prototype system for helicase research. Despite recent progress, the detailed mechanism of NS3 helicase remains unknown. In this study, we have combined coarse-grained (CG) and atomistic simulations to probe the translocation mechanism of NS3 helicase along ssDNA. At the residue level of detail, our CG simulations have captured functionally important interdomain motions of NS3 helicase and reproduced single-base translocation of NS3 helicase along ssDNA in the 3′–5′ direction, which is in good agreement with experimental data and the inchworm model. By combining the CG simulations with residue-specific perturbations to protein-DNA interactions, we have identified a number of key residues important to the translocation machinery that agree with previous structural and mutational studies. Additionally, our atomistic simulations with targeted molecular dynamics have corroborated the findings of CG simulations and further revealed key protein-DNA hydrogen bonds that break/form during the transitions. This study offers, to our knowledge, the most detailed and realistic simulations of translocation mechanism of NS3 helicase. The simulation protocol established in this study will be useful for designing inhibitors that target the translocation machinery of NS3 helicase, and for simulations of a variety of nucleic-acid-based molecular motors.
Introduction
Hepatitis C virus (HCV), a single-stranded RNA virus of the Flaviviridae family, is a major cause of chronic liver disease (1). HCV affects ∼200,000,000 people worldwide (2), with no effective treatment or vaccine available to date. Recent research has focused on the replicative enzymes of HCV as promising targets for therapeutic agents (3).
Helicases are ATP-fueled molecular motors that unwind double-stranded (ds) DNA or RNA. They play essential roles in gene replication, transcription, translation, recombination, and repair (4). The full-length nonstructural protein 3 (NS3) of HCV is a multifunctional enzyme (5), which consists of a serine protease (NS3pro) and an RNA helicase (NS3hel) belonging to the superfamily 2 (SF2) helicases (4). Although its in vitro function requires a dimeric form (6), NS3hel possesses helicase activity as a monomer (7,8). NS3hel assembles on a 3′ end of single-stranded (ss) DNA/RNA tail, and actively translocates along ssDNA or ssRNA in the 3′–5′ direction (9). NS3hel is an enzymatic component of HCV’s replicative apparatus essential for HCV propagation, making it a promising antiviral target for HCV (3). NS3hel is also a widely studied prototype system for understanding the mechanism of SF2 helicases (9,10).
Several crystal structures of NS3hel bound with ssDNA and various ATP analogs have been solved (11–16). NS3hel consists of three domains—domains 1 and 2 are two RecA-like α/β domains, and domain 3 is an α-helical domain (see Fig. 1). In NS3hel, ATP binds at the cleft between domains 1 and 2, whereas the ssDNA binds in a groove between domains 1, 2, and domain 3. Domains 1 and 3 share an extensive interface, whereas domain 2 is flexibly linked to the other two so it can undergo large domain motions.
Figure 1.
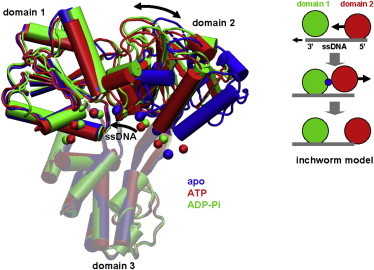
Structures of NS3hel (cartoon representation) bound with ssDNA (chain of beads located at C4¢ atoms) in three biochemical states (blue, apo; red, ATP; and green, ADP-Pi). The three domains of NS3hel and ssDNA are labeled. The opening/closing motions of domain 2 and the 5¢-3¢ sliding of ssDNA are marked by arrows. The three structures are aligned along domain 3 (transparent). A schematic cartoon in the inset illustrates the inchworm model (domain 1, domain 2, ATP, and ssDNA are colored green, red, blue, and gray, respectively; the opening/closing motions of domain 2 and the sliding of ssDNA are marked by arrows; domain 3 is not shown).
X-ray crystallography has provided key structural snapshots of NS3hel (see Fig. 1), which is bound with ssDNA/ssRNA and various ATP analogs mimicking three biochemical states (11–16) (apo, ATP, and ADP-Pi, where Pi represents inorganic phosphate). From the structural data, a mechanistic model has emerged for the translocation of NS3hel along ssDNA in an inchworm-like fashion (complemented by a ratchet action; see Gu and Rice (15), and also see Kim et al. (11), Appleby et al. (16), Velankar et al. (17), and Lee and Yang (18) and Fig. 1, this article): 1), ATP binding induces a closure motion of domain 2 toward domain 1, with domain 1 releasing its grip on ssDNA and sliding along it, whereas domain 2 maintains its grip on ssDNA. 2), After ATP hydrolysis and the release of ADP and Pi, domain 2 opens again as it releases its grip on ssDNA and slides along it, whereas domain 1 maintains its grip on ssDNA. The net effect is the translocation of NS3hel along ssDNA by one base in the 3′–5′ direction, consuming one ATP per step. Such ATP-fueled translocation is thought to unwind DNA duplex by one basepair per ATP hydrolyzed (17), possibly in bursts of three basepairs (19). The inchworm model (with single-base translocation step) is extensively supported by single-molecule fluorescence (19), optical tweezers (20), and transient kinetic (21) studies. Alternative scenarios were also explored. For example, it was proposed that NS3hel behaves like a Brownian ratchet moving along ssDNA with alternating strong/weak affinity for ssDNA (22).
In complement with experimental studies, computer simulations are needed to offer molecular details of helicase mechanism inaccessible to experimental probes. Although the helicase kinetics have been studied using discrete stochastic models (23,24), these simple models are unable to yield structural details of helicase dynamics. To simulate helicase dynamics with full details, the all-atom molecular dynamics (MD) simulation is the method of choice given its unparalleled ability to probe the atomic details of protein dynamics in solution. However, millisecond-long MD simulations of helicase motor cycle are not yet practical given today’s computing power. Previously, by combining nanosecond-long MD simulation and millisecond-long stochastic-dynamics simulation, Yu et al. (25,26) studied the translocation of PcrA helicase along ssDNA.
To overcome the timescale barrier, coarse-grained (CG) modeling has been developed using simplified structural representations and energy functions (27). At the residue level of detail, the elastic network model (ENM) represents a protein structure as a network of Cα atoms connected by elastic springs (28–30) with a uniform force constant (31). The normal-mode analysis (NMA) of ENM yields low-frequency modes, which were found to compare well with many crystallographically observed structural changes (29,32). Many studies have established ENM as an effective means to model protein conformational dynamics with virtually no limit in timescale or system size (see reviews in Bahar and Rader (33) and Zheng et al. (34)). By capturing the mechanical nature of molecular machines, ENM has proven useful in studying the conformational dynamics of several molecular motors, including myosin (35–46), kinesin (36,41,44,46), dynein (47), F1 ATPase (41,48), and helicase (49–52).
In a previous study published before the ATP-analog-bound NS3hel structures were solved, we performed ENM-based calculations for an apo NS3hel structure—we analyzed functionally important interdomain motions, identified a network of hot-spot residues coupling the ATP-binding site and the DNA-binding site, and modeled the closed-form NS3hel structure induced by ATP binding (51,52). That study focused on the conformational changes in NS3hel, without modeling how NS3hel translocates along ssDNA. Now that new NS3hel structures are available for all biochemical states of ATP cycle (15,16), a structure-based simulation of NS3hel translocation has become feasible, which promises to provide detailed insights to helicase function. A recent effort has been made toward this goal (49).
In this study, we have probed the translocation process in NS3hel by simulating the conformational transitions comprising the three-state ATP cycle of NS3hel (apo→ATP→ADP-Pi→apo). This simulation is biologically relevant because it has been shown that HCV NS3hel can translocate along ssDNA without requiring the ss/dsDNA junction (21). We have performed structure-based simulations of NS3hel-ssDNA system at both residue and atomic level of detail:
At the residue level of detail, we have used NMA to demonstrate that the lowest few normal modes can capture the observed conformational changes in NS3hel between three states (apo, ATP, and ADP-Pi) (15,16). Then we have performed CG simulation of the transition pathways (45) connecting the above three states, which has successfully reproduced key features of the inchworm model (see Fig. 1), leading to a net translocation of NS3hel along ssDNA by one base per ATP consumed. By introducing residue-specific perturbations to protein-DNA interactions one residue at a time, we have identified a number of key residues important to the translocation machinery.
At the atomic level of detail, we have used targeted MD to simulate two transitions of NS3hel (apo→ATP and ADP-Pi→apo), which have corroborated the findings of CG simulations and revealed key protein-DNA hydrogen bonds that break/form during the above transitions.
Methods
Elastic network model and normal-mode analysis
In an ENM, a protein structure is represented as a network of beads each corresponding to the Cα atom of an amino-acid residue. An harmonic potential accounts for the elastic interaction between a pair of Cα atoms, which are within a cutoff distance Rc chosen to be 10 Å (53). The ENM potential energy is
| (1) |
where N is the number of Cα atoms, θ(x) is the Heaviside function, dij is the distance between the Cα atom i and j, and d0ij is the value of dij as given by a protein crystal structure. The value kij is the force constant, which is 1 for nonbonded interactions and 100 for bonded interactions between residues. The use of high/low force constant for bonded/nonbonded pairs of Cα atoms was previously shown to improve the accuracy of ENM-based modeling (54).
One can perform NMA based on the ENM potential energy, which yields 3N-6 nonzero normal modes. The involvement of each mode or the lowest 10 modes in a given conformational change can be quantified by calculating the overlap or cumulative overlap (see the Supporting Material).
Coarse-grained transition pathway modeling by iENM
Recently, we have developed an interpolated ENM (iENM) protocol (45) that solves the saddle points of a double-well potential F(EENM1 + Ecol, EENM2 + Ecol), where EENM1 and EENM2 are two ENM potentials (see Eq. 1) based at the beginning and end conformation, and Ecol is a steric collision energy (45). All the saddle points trace a pathway that connects the beginning and end conformation, which is independent of the mathematic form of F(EENM1 + Ecol, EENM2 + Ecol). This method is available on a web server at http://enm.lobos.nih.gov/start_ienm.html.
For simulating NS3hel-ssDNA system, we modify the ENM potentials to accurately model protein-DNA interactions and flexibility of ssDNA (see below).
Quantification of motional order of key protein parts during a transition
We use the predicted pathway to determine the motional order of two protein parts during a transition. To this end, the following reaction coordinate (RC) is defined for a given part S (see (40)),
| (2) |
where RMSDS,1 ( RMSDS,2) is the root-mean-square deviation (RMSD) of Cα atoms of part S between a given intermediate conformation and the beginning (end) conformation, and RMSDS,obs is the corresponding RMSD between the beginning and end conformation. RCS varies from 0 to 1 as the transition proceeds from the beginning to the end conformation. For two protein parts S and S′, if RCS < RCS′ along the pathway (namely, RCS′ ascends from 0 to 1 faster than RCS), we can infer that the motion of S′ precedes that of S.
CG modeling of NS3hel-ssDNA system
To accurately model protein-DNA interactions and flexibility of ssDNA, we modify the standard ENM as follows:
-
1.
For residue-residue interactions within NS3hel, we still use the standard Cα-based ENM with Rc = 10 Å (see Eq. 1).
-
2.
For interactions within ssDNA, we use a modified ENM that represents each nucleic acid by a bead located at the C4′ atom, and adds springs between first, second, and third nearest-neighbor (NN) beads with the same force constant kDNA,
| (3) |
where dij is the distance between the C4′ atom i and j, and dij,0 is the value of dij as given by an NS3hel-ssDNA structure. The cutoff at third NN is chosen based on the analysis of variations of distances between the second, third, and fourth NN C4′ atoms in an NS3hel-ssDNA structure—the standard deviation jumps from 0.8 Å for third NN to 1.4 Å for fourth NN, while it barely changes between second and third NN.
-
3.
To accurately represent protein-DNA interactions at the residue level of detail (i.e., one bead per residue or nucleic acid), we use a structure-based Leonard-Jones 6-12 potential to allow protein-DNA contacts to form/break readily during a transition
| (4) |
where the summation of i is over residues that form heavy-atom contacts (within 4 Å) with DNA backbone in a reference NS3hel-ssDNA structure (chosen to be the end conformation of a transition in NS3hel), di,min is the minimal Cα-C4′ distance for residue i, and kprot-DNA is the force constant. We only consider contacts between protein and DNA backbone in our modeling because functional and structural data suggested that these contacts are sufficient for ensuring that NS3hel maintains a grip on the ssDNA track and undergoes continuous translocation (10).
The ligand (ATP analog) is not explicitly modeled here, but the structural effect of ligand binding and release is indirectly accounted for by the closing/opening of the ATP-binding cleft between domains 1 and 2.
Parameterization of force constants based on fitting crystallographic B-factors
We parameterize the two force constants (kDNA and kprot-DNA) by fitting the B-factors of an NS3hel-ssDNA structure (PDB: 3kql). This structure is chosen because it has minimal effect of crystal packing among the three NS3hel-ssDNA structures (PDBs: 3kqk, 3kqu, and 3kql), which allows the most accurate calculation of B-factors (55). We scan kprot-DNA within the range [0.7, 1.5] with an increment of 0.1, and then find kDNA to optimize the cross correlation (CC) between ENM-predicted and experimental B-factors. The fitted kDNA varies from 22 to 0.6 as kprot-DNA varies from 0.7 to 1.5—reflecting a compensation of stronger protein-DNA interactions (higher kprot-DNA) by higher flexibility of ssDNA (lower kDNA). In this way, we have obtained a series of model parameters with a wide range of DNA flexibility and protein-DNA interaction strength. These parameters fit B-factors almost equally well with 0.76 < CC < 0.77.
Targeted MD simulation
We prepare the system by soaking a crystal structure of ssDNA-bound NS3hel into a water box, then adding Na+ ions to neutralize the system for the particle-mesh Ewald method. The entire system contains 61,033 atoms, which include 9 Na+ ions and 18,103 water molecules. We use the TIP3P model to describe water molecules. For targeted MD simulations, we use NAMD program (56) with CHARMM27 force field (57). The periodic boundary conditions and 2-fs time step are used. All hydrogen bonds are fixed during the simulations. Initially, 5000 steps of energy minimizations are performed using the conjugate gradient method, which are followed by an equilibration MD run for 4 ns, and a targeted MD run for 20 ns under 310 K temperature and 1 Atm pressure. To drive NS3hel toward a target structure, we apply constraint forces to protein atoms only, with a force constant of 500 kcal/(mol·Å2). For the targeted MD trajectories, we analyze the hydrogen bonds between NS3 and ssDNA using the criterion that the maximal distance between donor and acceptor is 4.5 Å.
Results
NMA of NS3 structures captures crystallographically observed conformational changes
Recent structural studies have solved several high-resolution x-ray structures of HCV NS3 in various biochemical states in the presence or absence of NS3pro (15,16). To validate the use of ENM for HCV NS3 helicase, we will compare the interdomain motions predicted by NMA of ENM with the observed conformational changes between NS3 structures in different states (see Table S1 in the Supporting Material).
Conformational changes in NS3hel from apo to ATP state
We have performed NMA using an NS3hel-ssDNA structure in apo state (PDB: 3kqk), and then compared each normal mode with the observed conformational changes from 3kqk to an NS3hel-ssDNA-ADP·BeF3 structure in ATP state (15) (PDB: 3kqu) (see Fig. 1). Encouragingly, 84% of the observed conformational changes are captured by the lowest 10 modes (with cumulative overlap of 0.92) (see Movie S1 a in the Supporting Material), among which mode No. 3 and mode No. 4 contribute most (with overlap of 0.49 and 0.57, respectively).
Mode No. 3 describes correlated rotations of domains 1 and 2 relative to domain 3, which result in the opening of domains 1-3 interface, the closing of domains 1-2 interface, and the sliding of ssDNA toward its 3′ end (see Movie S1 b and Fig. S1 a in the Supporting Material).
Mode No. 4 describes simultaneous rotations of domains 1 and 2 toward domain 3, which cause the closing of domains 1-2 interface and a shift of ssDNA toward domain 3 (see Movie S1 c and Fig. S1 b).
Notably, the above two modes predict opposite changes (opening versus closing) at domains 1-3 interface, which effectively cancel out to describe the observed conformational changes featuring little motion between domains 1 and 3 but a large rotation of domain 2 toward domain 1 (see Movie S1 a). The above finding suggests that the domains 1-3 interface is more flexible than it appears by comparing crystal structures of NS3hel (see Fig. 1).
Although the lowest 10 modes accurately capture the observed conformational changes in NS3hel, they do not correctly predict the translocation of NS3hel along ssDNA, which requires domain 1 to slide along ssDNA while domain 2 holds ssDNA. Instead, in both modes No. 3 and No. 4, domains 1 and 2 maintain their grip on ssDNA with no sliding between domain 1 and ssDNA (see Movie S1, b and c). This is not surprising, as domain 1 and ssDNA are linked by elastic springs in ENM, which disfavor sliding between them. Therefore, to accurately describe the conformational dynamics underlying NS3hel translocation, one has to modify ENM and account for the anharmonicity of protein-DNA interactions (see below).
Conformational changes in NS3hel from ATP to ADP-Pi state
We have performed NMA using the NS3hel-ssDNA-ADP·BeF3 structure in ATP state (PDB: 3kqu), and then compared each normal mode with the observed conformational changes from 3kqu to an NS3hel-ssDNA-ADP·AlF4 structure in ADP-Pi state (15) (PDB: 3kql) (see Fig. 1); 51% of the observed conformational changes are captured by the lowest 10 modes (with cumulative overlap of 0.72) (see Movie S1 d), among which mode No. 1 contributes most (with overlap of 0.61).
Mode No. 1 describes correlated rotations of domains 1 and 2 relative to domain 3, which result in the opening of domains 2-3 interface, and the sliding of ssDNA toward its 5′ end (see Movie S1 e and Fig. S1 c). The opening of domains 2-3 interface may weaken domain 2’s grip on ssDNA, which prepares NS3hel for the sliding of domain 2 along ssDNA upon the release of ADP and Pi.
Conformational changes in NS3hel from ADP-Pi to apo state
We have performed NMA using the NS3hel-ssDNA-ADP·AlF4 structure in ADP-Pi state (PDB: 3kql), and then compared each normal mode with the observed conformational changes from 3kql to the NS3hel–ssDNA structure in apo state (15) (PDB: 3kqk) (see Fig. 1); 67% of the observed conformational changes are captured by the lowest 10 modes (with cumulative overlap of 0.82) (see Movie S1 f), among which mode No. 5 and mode No. 6 contribute most (with overlap of 0.45 and 0.5, respectively):
Mode No. 5 describes distinct hinge motions of domains 1 and 2 relative to domain 3, which result in the opening of domains 1-2 interface and the sliding of ssDNA toward its 3′ end (see Movie S1 g and Fig. S1 d).
Mode No. 6 describes anticorrelated rotations of domains 1 and 2 relative to domain 3, which result in the opening of domains 1-2 interface, the opening of domains 2-3 interface, and the sliding of ssDNA toward its 5′ end (see Movie S1 h and Fig. S1 e).
Although the lowest 10 modes accurately capture the observed conformational changes in NS3hel, they do not correctly predict the translocation of NS3hel along ssDNA, which requires domain 2 to slide along ssDNA while domain 1 holds ssDNA. Instead, in both modes No. 5 and No. 6, domains 1 and 2 maintain their grip on ssDNA (see Movie S1, g and h). This again points to the need for anharmonic representation of protein-DNA interactions (see below).
Conformational changes in full-length NS3 from apo to ATP state
To explore how the protease domain (NS3pro) influences the dynamics of full-length NS3, we have performed NMA using an NS3hel-NS3pro-ssRNA structure in apo state (PDB: 3o8c), and then compared each normal mode with the observed conformational changes from 3o8c to an NS3hel-NS3pro-ssRNA-ADP·BeF3 structure in ATP state (16) (PDB: 3o8r); 59% of the observed conformational changes are captured by the lowest 10 modes (with cumulative overlap of 0.77) (see Movie S1 i), among which mode No. 6 contributes most (with overlap of 0.49).
Mode No. 6 describes a large rotation of domain 2 toward domain 1, and a small twisting motion of domain 1 relative to domain 3, which result in the sliding of ssRNA toward its 3′ end (see Movie S1 j and Fig. S1 f).
Unlike the apo-state NS3hel structure (see above), the relevant modes for the observed conformational changes in full-length NS3 do not involve large opening/closing of domains 1-3 interface, suggesting that this interface may be rigidified by NS3pro that forms extensive contact with domains 1 and 3 (16). The reduced flexibility at domains 1-3 interface may enhance the processivity of ssRNA movement between domains 1 and 3 (with lower probability of ssRNA detachment or slippage). Indeed, it was found that the protease domain greatly improves the translocation efficiency of NS3 (21).
CG transition pathway modeling correctly predicts the order of interdomain motions in NS3hel
NMA is limited to the prediction of possible domain motions accessible to a protein near an equilibrium state corresponding to an energy minimum. To probe intermediate conformational changes taking place during a transition between two states, one must go beyond NMA and explore transition pathways between two distinct energy minima. To this end, we have recently developed an ENM-based transition pathway modeling method (iENM) that generates a transition pathway (consisting of a series of intermediate conformations) that connects two given conformations (named beginning and end conformations) (45). This new, to our knowledge, method was able to predict a clear sequence of structural events involving different protein parts/domains during protein conformational transitions (45), which has illuminated the allosteric coupling mechanisms in molecular motors like myosin (39,40) and dynein (47).
In this study, we have used iENM to simulate the conformational transitions in NS3hel between three biochemical states (apo, ATP, and ADP-Pi), which are captured by three crystal structures of NS3hel (15) (PDBs: 3kqk, 3kqu, and 3kql) (see Fig. 1). We validate the use of iENM for NS3hel by checking whether it correctly predicts the order of interdomain motions observed among crystal structures of NS3hel in different states. To this end, we have generated pathways for three transitions (apo→ATP, ATP→ADP-Pi, apo→ADP-Pi) using iENM, and then compared the predicted pathways with the crystal structures (11–13,15,16) using two reaction coordinates (RCs): RC12 quantifies the progress of motion between domains 1 and 2, and RC13 quantifies the progress of motion between domains 1 and 3 (see Methods). Both RCs vary from 0 to 1, where 0 corresponds to the apo state, and 1 corresponds to the ADP-Pi state. The iENM pathway for apo→ADP-Pi transition predicts that the increase of RC12 precedes RC13 during the transition, which implies that the domains 1-2 motion precedes the domains 1-3 motion. This order is functionally meaningful, because the domains 1-2 motion occurs upon ATP binding while the domains 1-3 motion occurs during the subsequent transition (ATP hydrolysis) (see Fig. 1).
This prediction agrees well with the RCs of most crystal structures, which form two intermediate clusters located near the predicted pathway (see Fig. 2)—the first cluster includes several apo structures of full-length NS3, and the second cluster includes several crystal structures of NS3hel and full-length NS3 bound with ADP-BeF3 (corresponding to ATP state). Two outlier structures (see Fig. 2) may correspond to off-path intermediates trapped by crystallization conditions. It is remarkable that the iENM pathway for apo→ADP-Pi transition visits the ATP-state structures as intermediates even though these structures are not used in the modeling. For comparison, we have also analyzed the pathways for apo→ADP-Pi transition predicted by alternative methods including Morph server (58), mixed-ENM server (44), and MinActionPath server (59), which do not seem to agree with the crystal structures (see Fig. 2) (see the Supporting Material for further comparison between iENM and these alternative methods).
Figure 2.
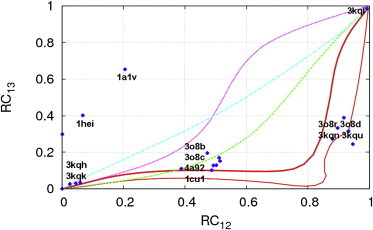
Comparison between calculated transition pathways and crystal structures of NS3hel using two reaction coordinates (RC12 and RC13). The calculated pathways are obtained using the following methods: iENM (solid lines), mixed-ENM server (dashed line), Morph server (dot-dashed line), and MinActionPath server (dotted line). The crystal structures are shown as points (PDB and chain ids: 1a1vA, 1cu1A, 1cu1B, 1heiA, 1heiB, 3o8bA, 3o8bB, 3o8rA, 3o8rB, 3o8dA, 3o8dB, 3o8cA, 3o8cB, 3kquA, 3kquB, 3kquC, 3kquD, 3kquE, 3kquF, 3kqlA, 3kqlB, 3kqkA, 3kqkB, 3kqnA, 3kqhA, 3kqhB, 4a92A, and 4a92B). The following three pathways are calculated by iENM: 3kqk→3kql (thick solid line), 3kqk→3kqu (thin solid line), 3kqu→3kql (thin solid line).
In sum, the iENM-predicted transition pathway correctly predicts the order of interdomain motions in NS3hel as indicated by structural data. This encouraging result gives us confidence to use iENM for further simulation of NS3hel translocation along ssDNA as driven by the interdomain motions in NS3hel.
CG simulation of NS3hel translocation during conformational transitions of NS3hel between three states
After validating iENM for exploring conformational transitions in NS3hel, we will employ it to simulate the translocation of NS3hel along ssDNA as it undergoes the following three transitions: apo→ATP→ADP-Pi→apo, which comprise the ATP cycle. Our goal is to investigate whether a net translocation of NS3hel along ssDNA in the 3′–5′ direction can be generated by the conformational changes in NS3hel during these transitions, and whether the translocation can be described by the inchworm model (see Fig. 1). As indicated by our NMA results, the protein-DNA contacts must be able to break/form readily to enable the sliding of ssDNA relative to domains 1 and 2. To this end, we have modified protein-DNA interactions using an anharmonic potential function, so that the protein-DNA contacts may break at a finite energy cost (see Methods). This idea has been successfully used in our previous works on the flexible fitting of electron microscopy data (60) and solution x-ray scattering data (61).
Conformational transition from apo to ATP state
We have generated a transition pathway from the NS3hel-ssDNA structure in apo state (PDB: 3kqk, chain A) to the NS3hel-ssDNA-ADP·BeF3 structure in ATP state (PDB: 3kqu, chain B), where a six-NA-long ssDNA (numbered NA1 ∼ NA6) is taken from the beginning structure (PDB: 3kqk, chain D). As predicted by the iENM pathway, domain 2 closes toward domain 1 while it holds the ssDNA (see Fig. 3 a and Movie S2 a). Consequently, the ssDNA moves toward its 3′ end by ∼4.8 Å as it slides between domains 1 and 3 (see Fig. 3 a and Movie S2 a). At the end of this transition, the final C4′ positions of NA2 ∼ NA5 (excluding the two NAs at 5′ and 3′ ends) are close to the target C4′ positions in the end structure (PDB: 3kqu, chain M) with RMSD ∼0.6 Å (see Fig. 3 a). Therefore, our CG simulation has successfully reproduced key motions during the apo→ATP transition as postulated by the inchworm model—a closure motion of domain 2 toward domain 1, with domain 1 releasing its grip on ssDNA and sliding along it, while domain 2 maintains its grip on ssDNA (see Fig. 1).
Figure 3.
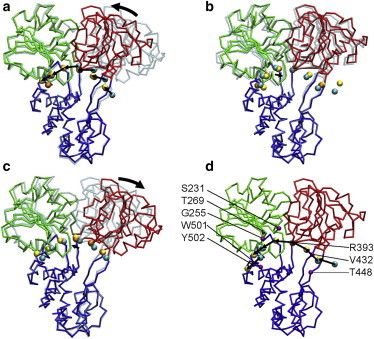
Snapshots at the beginning and end of CG simulations for the following transitions in NS3hel: (a) apo ATP transition; (b) ATP ADP-Pi transition; (c) ADP-Pi apo transition; and (d) 3-state ATP cycle (ATP ADP-Pi apo ATP). In the end conformation of NS3hel, domain 1, 2 and 3 are colored green, red and blue, respectively; the beginning conformation of NS3hel is shown as transparent; ssDNA is shown as a chain of beads located at C4¢ atoms (for ssDNA, the beginning conformation, end conformation, and target conformation are colored cyan, yellow, and orange, respectively); the movements of domain 2 and ssDNA are marked by arrows. In panel d, the residues identified as important to the translocation of NS3hel are labeled and shown as purple beads.
Conformational transition from ATP to ADP-Pi state
We have generated a transition pathway from the NS3hel-ssDNA-ADP·BeF3 structure in ATP state (PDB: 3kqu, chain B) to the NS3hel-ssDNA-ADP·AlF4 structure in ADP-Pi state (PDB: 3kql, chain A), where a seven-NA-long ssDNA (numbered NA9 ∼ NA15) is taken from the beginning structure (PDB: 3kqu, chain M). As predicted by the iENM pathway, domains 1 and 2 undergo a correlated rotation, resulting in the movement of ssDNA toward its 5′ end by ∼0.8 Å relative to domain 3 (see Fig. 3 b and Movie S2 b). Both domains 1 and 2 maintain their grip on ssDNA during this transition, so there is no sliding of ssDNA relative to domains 1 and 2 (see Fig. 3 b and Movie S2 b). At the end of this transition, the final C4′ positions of NA11∼NA14 are close to the target C4′ positions in the end structure (PDB: 3kql, chain E) with RMSD ∼0.3 Å (see Fig. 3 b). Therefore, our CG simulation has revealed a small backward sliding of ssDNA during the ATP→ADP-Pi transition, which is also observed by comparing the two NS3hel-ssDNA structures in ATP and ADP-Pi states (see Fig. 1).
Conformational transition from ADP-Pi state to apo state
We have generated a transition pathway from the NS3hel-ssDNA-ADP·AlF4 structure in ADP-Pi state (PDB: 3kql, chain A) to the NS3hel-ssDNA structure in apo state (PDB: 3kqk, chain A), where a six-NA-long ssDNA (numbered NA16 ∼ NA21) is taken from the beginning structure (PDB: 3kql, chain E). As predicted by the iENM pathway, domain 2 opens early to release its grip on ssDNA, which is followed by a small sliding (∼1.7 Å) of ssDNA toward its 3′ end and a slight opening of domain 1 (see Fig. 3 c and Movie S2 c). At the end of this transition, the final C4′ positions of NA16 ∼ NA20 are close to the target C4′ positions in the end structure (PDB: 3kqk, chain D) with RMSD ∼0.4 Å (see Fig. 3 c). Our finding has largely reproduced key motions during the ADP-Pi→apo transition as postulated by the inchworm model—opening of domain 2 after it releases its grip on ssDNA and slides along it, while domain 1 maintains its grip on ssDNA. The only minor difference is: our CG simulation reveals a small sliding of ssDNA relative to domain 1 (see Fig. 3 c and Movie S2 c), which may be due to the relaxation of the strain at the interface between ssDNA and domain 1 after domain 2’s release of ssDNA.
In sum, our CG simulations for the above three transitions predict a net translocation of NS3hel along ssDNA in the 3′–5′ direction by ∼5.7 Å, which corresponds approximately to one-base step size. This is in good agreement with previous single-molecule fluorescence (19), optical tweezers (20), and transient kinetic (21) studies. We note that the unidirectional translocation of NS3hel along ssDNA is a completely nontrivial result for CG simulations, because both domains 1 and 2 compete for the binding of ssDNA during each transition, and the 3′–5′ translocation of NS3hel along ssDNA can only arise if domain 2 binds more tightly with ssDNA during the apo→ATP transition and domain 1 binds more tightly with ssDNA during the ADP-Pi→apo transition. In our CG simulations, the protein-DNA interactions are modeled based on the NS3hel-ssDNA heavy-atom contacts formed in crystal structures (15) (see Methods), with no biased tuning of protein-DNA interactions (49).
CG simulation of three-state ATP cycle of NS3hel
In the above CG simulations, we have simulated each of the three transitions separately using different initial ssDNA conformations taken from three NS3hel-ssDNA structures (PDBs: 3kqk, 3kqu, and 3kql). Now we will simulate the entire three-state ATP cycle (ATP→ADP-Pi→apo→ATP), one transition at a time, starting from the initial ssDNA conformation given by the NS3hel-ssDNA structure in ATP state (PDB: 3kqu, chain M, keeping NA9 ∼ NA15), and propagating through the three transitions (i.e., using the end ssDNA conformation of first transition as the initial ssDNA conformation of second transition, and so on). Our goal is to test whether the CG simulation can predict the intermediate ssDNA conformations with sufficient accuracy to reproduce single-base translocation of NS3hel along ssDNA in the 3′–5′ direction. We start the simulation from the ATP-state structure because it has a longer ssDNA with both 3′ and 5′ ends extending outside the ssDNA-binding groove (see Fig. 1), which allows NS3hel to maintain all its interactions with ssDNA after the sliding of ssDNA.
During the simulation of ATP cycle, domain 2 first opens as it slides along ssDNA, and then closes as it maintains its grip on ssDNA, driving ssDNA to slide between domains 1 and 3. At the end of the ATP cycle, NS3hel is translocated along ssDNA in the 3′–5′ direction by ∼6 Å (see Fig. 3 d and Movie S3 a), which corresponds approximately to one-base step size. Therefore, we have obtained very similar results for NS3hel translocation from the simulations of separate transitions (see Fig. 3, a–c) and the ATP cycle (see Fig. 3 d), which support the robustness of our CG simulation to the inaccuracy of intermediate ssDNA conformations.
We have run the CG simulation of ATP cycle for a range of model parameters (force constants kDNA ∈[0.6,22] and kprot-DNA ∈[0.7,1.5]; see Methods). We have consistently obtained single-base translocation of NS3hel along ssDNA in the 3′–5′ direction for most parameters (kDNA ∈[1,22] and kprot-DNA ∈[0.7,1.3]), except when ssDNA is too flexible (with kDNA ≤ 0.7). Therefore, this key functional motion is highly robust to changes in the rigidity of ssDNA and the strength of protein-DNA interactions, allowing NS3 to process both DNA and RNA strands in a sequence-independent manner. The simulation inaccuracy, as assessed by the RMSD of C4′ coordinates of ssDNA relative to those given by crystal structures of NS3hel-ssDNA, is the lowest when kDNA = 1 and kprot-DNA = 1.3 (which are therefore chosen as the default parameters).
Assessing the importance of individual DNA-binding residues to NS3hel translocation
The translocation machinery of NS3hel, as described by the inchworm model (see Fig. 1), requires coordinated changes of protein-DNA interactions involving individual DNA-binding residues. Based on the above CG simulation, we will explore which residues are important to NS3hel translocation by simulating mutational perturbations to protein-DNA interactions one residue at a time. We only consider those residues forming atomic contacts with ssDNA backbone in at least one of the three NS3hel-ssDNA structures (PDBs: 3kqk, 3kqu, and 3kql). These DNA-binding residues are mostly located in six conserved motifs of SF2 helicases: motif Ia (P230, S231, and V232), motif Ib (T254 and G255), motif Ic (T269, G271, K272, and A275), motif IV (H369, S370, K371, and K372), motif IVa (Y392 and R393), and motif V (T411, A413, and L414). The rest of them are located in domain 3 (V432, T448, W501, and Y502): V432 and W501 are thought to act as a pair of bookends that define a central binding cavity occupied by 4–5 NAs during NS3hel translocation (11).
We turn off the interaction potential between each of the above residues and ssDNA, and then rerun the CG simulation for ATP cycle. Among those residues, only perturbations to S231, G255, T269, R393, V432, T448, W501, or Y502 (see Fig. 3 d) result in the loss of single-base translocation of NS3hel (see Movie S3 b and Movie S3 c). In all these cases, the perturbations selectively affect the apo→ATP transition, causing a sliding between ssDNA and domain 2 instead of domain 1 (see Movie S3 b and Movie S3 c). Interestingly, these residue-specific perturbations are distributed in both domains 1 and 2: the ones in domain 2 (R393, V432, and T448) weaken the binding of the 5′ segment of ssDNA by domains 2-3 interface, which may lead to slippage between them; the ones in domain 1 (S231, G255, T269, W501, and Y502) disrupt the interactions between the 3′ segment of ssDNA and domains 1-3 interface, suggesting that domain 1 does not passively loosen its grip on ssDNA; instead it may provide some assisting force to facilitate the 3′–5′ translocation of NS3hel along ssDNA.
Our finding is in general agreement with previous structural and mutational studies. In a structural study (11), it was proposed that the interactions between V432 and T448, and the 5′ segment of ssDNA drive the sliding of ssDNA in the 5′–3′ direction as domain 2 closes, and W501 plays a key role in rectifying the 5′–3′ movement of ssDNA (11). S231 is at the bottom of the spring helix, which was proposed to couple rearrangement at the ATPase active site to changing interactions between NS3hel and ssDNA (15). Both T269 and T411 are highly conserved in SF2 helicases, and a mutation to either of them was found to abolish helicase activity of NS3 (62). Both V432 and W501 are highly conserved among HCV NS3 sequences. The W501A mutation was found to disrupt helicase activity of NS3 (62). Our simulations suggest that the functional importance of the above residues may be due to their critical role in facilitating the unidirectional translocation of NS3 along ssDNA. Our simulations have also predicted several previously untested residues (S231, G255, R393, V432, and T448) for future experiments to investigate.
Atomistic simulations of NS3hel translocation
To verify the results of CG simulations and reveal atomic details of hydrogen-bond (HB) interactions between ssDNA and NS3hel, we have used targeted MD (see Methods) to simulate the following two transitions between apo and nucleotide-bound states of NS3hel.
Conformational transition from apo to ATP state
We have performed a 20-ns targeted MD simulation, which starts from the NS3hel structure in apo state (PDB: 3kqk) bound with a six-NA-long ssDNA (numbered NA1 ∼ NA6). We use the NS3hel structure in ATP state (PDB: 3kqn) as the target structure. The simulation has successfully driven the transition from apo to ATP state, with the Cα-based RMSD (relative to the target structure) reduced from 3.7 Å to 0.6 Å (see Movie S4 a).
During the simulation, domain 2 is gradually closing toward domain 1 as it maintains its grip on ssDNA (see Fig. S2 a). Indeed, most HBs between domain 2 and ssDNA (R393:N–NA3:OP1 and T411:OG1–NA3:OP1) are maintained (see Fig. S2 a), except one HB (L414:N–NA4:OP1) that is actually broken in the ATP-state structure of NS3hel (15) (see Fig. 4 a). However, no sliding of ssDNA has occurred relative to domain 1, although the HBs between domain 1 and ssDNA (V232:N–NA5:OP1, G255:N–NA6:OP1, and T269:OG1–NA6:OP1) are broken (see Fig. 4 a and Fig. S2 a). Therefore, although the 5′ segment of ssDNA is moved forward by domain 2, the 3′ segment remains to be held by domain 1. Such partial movement of ssDNA results in increased distortion in ssDNA, with the stacking between the bases of NA2-NA6 largely disrupted (see Fig. 4 a). Notably, the stacking between W501 and the base of NA6 disappears at ∼14 ns when the base flips away (see Movie S4 a), which would allow ssDNA to slide past W501.
Figure 4.
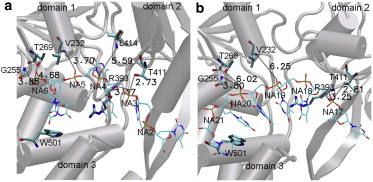
Snapshots at the end of targeted MD simulations for the following transitions in NS3hel: (a) apo→ATP transition and (b) ADP-Pi→apo transition. NS3hel, ssDNA, and selected ssDNA-binding residues (represented by cartoon, lines, and bonds, respectively). Key protein-ssDNA hydrogen bonds (dotted lines with donor-acceptor distance labeled). Lines and bonds are colored according to atom types: C (cyan), O (red), N (blue), and P (tan). The three domains of NS3hel are labeled.
In sum, the targeted MD simulation captures some of the ssDNA movements driven by ATP binding, as proposed in the inchworm model (see Fig. 1) and observed in the CG simulation (see Fig. 3 a). However, the sliding of ssDNA relative to domain 1 has not happened, which is expected to release the distortion within ssDNA. To fully capture the ssDNA movements, much longer MD simulations beyond tens of nanoseconds may be needed.
Conformational transition from ADP-Pi state to apo state
We have performed a 20-ns targeted MD simulation, which starts from the NS3hel structure in ADP-Pi state (PDB: 3kql) bound with a six-NA-long ssDNA (numbered NA16 ∼ NA21). We use the NS3hel structure in apo state (PDB: 3kqk) as the target structure. The simulation has successfully driven the transition from ADP-Pi to apo state, with the Cα-based RMSD (relative to the target structure) reduced from 3.7 Å to 0.6 Å (see Movie S4 b).
During the simulation, domain 2 is gradually opening from domain 1 as it slides along ssDNA (see Fig. S2 b), which cause two HBs between domain 2 and NA18 (R393:N–NA18:OP1 and T411:OG1–NA18:OP1) to break and then reform with NA17 (R393:N–NA17:OP1 and T411:OG1–NA17:OP1) (see Fig. 4 b and Fig. S2 b). In contrast, domain 1 opens slightly as it maintains its grip on ssDNA. Interestingly, the three HBs between domain 1 and ssDNA (V232:N–NA19:OP1, G255:N–NA20:OP1, and T269:OG1–NA20:OP1) become less stable (see Fig. 4 b), which transiently form and break during the simulation (see Movie S4 b and Fig. S2 b). This finding suggests that the ADP-Pi→apo transition causes weaker binding between domain 1 and ssDNA, which prepares NS3hel for the subsequent transition (apo→ATP) when sliding between domain 1 and ssDNA will occur.
Unlike the previous simulation, the ssDNA is not structurally distorted in this simulation. Indeed, the base stacking between NA17-NA20 is preserved (see Fig. 4 b). Throughout the simulation, W501 maintains its stacking with the base of NA20 (see Movie S4 b), serving as a ratchet that prevents the backward sliding of ssDNA relative to domain 1 (11).
In sum, the targeted MD simulation successfully captures the ssDNA movements during the ADP-Pi→apo transition, as proposed in the inchworm model (see Fig. 1) and observed in the CG simulation (see Fig. 3 c).
Conclusion
In this study, we have combined CG and atomistic simulations to probe the structural and dynamic details of the translocation of HCV NS3 helicase—a promising antiviral target and an important prototype system for helicase research. At the residue level of detail, our CG simulations have captured functionally important interdomain motions of NS3, and successfully reproduced single-base translocation of NS3 helicase along ssDNA during the three-state ATP cycle, which are in good agreement with experimental data and the inchworm model. By combining the CG simulations with residue-specific perturbations to protein-DNA interactions, we have identified a number of key residues important to the translocation machinery, which are in agreement with previous structural and mutational studies. Additionally, our atomistic simulations based on targeted MD have corroborated the findings by CG simulations and revealed the protein-DNA hydrogen bonds that break/form during the transitions.
Although our CG and all-atom simulations are in general support of the inchworm model, we cannot exclude the alternative possibility that the sliding of ssDNA relative to domain 1 and 2 do not precisely alternate with each other. For example, the sliding between ssDNA and domain 1 may only occur after several ATP cycles to release several bases at a time (20), which may actually explain our finding of no sliding between ssDNA and domain 1 during the targeted MD simulation of apo→ATP transition.
The CG simulation protocol established in this study is not only accurate (predicting NA positions with RMSD < 0.6 Å) but also efficient—it takes only 3 min to run the entire ATP cycle of NS3hel using a dual-core workstation (compared to ∼60 h for 20-ns targeted MD simulation using 64 processors). This protocol will be useful for future design of inhibitors that target the translocation machinery of NS3, and simulations of a variety of NA-based molecular motors including many monomeric and ring-shaped helicases. This study will also pave the way for future modeling of other aspects of helicase activities in NS3, including dsDNA unwinding and the asynchronous release of displaced ssDNA (20).
Acknowledgments
We thank funding support from the American Heart Association (grant No. 0835292N) and the National Science Foundation (grant No. 0952736).
Supporting Material
References
- 1.De Francesco R., Migliaccio G. Challenges and successes in developing new therapies for hepatitis C. Nature. 2005;436:953–960. doi: 10.1038/nature04080. [DOI] [PubMed] [Google Scholar]
- 2.Brown R.S., Jr., Gaglio P.J. Scope of worldwide hepatitis C problem. Liver Transpl. 2003;9:S10–S13. doi: 10.1053/jlts.2003.50244. [DOI] [PubMed] [Google Scholar]
- 3.Frick D.N. Helicases as antiviral drug targets. Drug News Perspect. 2003;16:355–362. doi: 10.1358/dnp.2003.16.6.829307. [DOI] [PMC free article] [PubMed] [Google Scholar]
- 4.Gorbalenya A.E., Koonin E.V., Blinov V.M. Two related superfamilies of putative helicases involved in replication, recombination, repair and expression of DNA and RNA genomes. Nucleic Acids Res. 1989;17:4713–4730. doi: 10.1093/nar/17.12.4713. [DOI] [PMC free article] [PubMed] [Google Scholar]
- 5.Raney K.D., Sharma S.D., Cameron C.E. Hepatitis C virus non-structural protein 3 (HCV NS3): a multifunctional antiviral target. J. Biol. Chem. 2010;285:22725–22731. doi: 10.1074/jbc.R110.125294. [DOI] [PMC free article] [PubMed] [Google Scholar]
- 6.Serebrov V., Pyle A.M. Periodic cycles of RNA unwinding and pausing by hepatitis C virus NS3 helicase. Nature. 2004;430:476–480. doi: 10.1038/nature02704. [DOI] [PubMed] [Google Scholar]
- 7.Cheng W., Dumont S., Bustamante C. NS3 helicase actively separates RNA strands and senses sequence barriers ahead of the opening fork. Proc. Natl. Acad. Sci. USA. 2007;104:13954–13959. doi: 10.1073/pnas.0702315104. [DOI] [PMC free article] [PubMed] [Google Scholar]
- 8.Serebrov V., Beran R.K., Pyle A.M. Establishing a mechanistic basis for the large kinetic steps of the NS3 helicase. J. Biol. Chem. 2009;284:2512–2521. doi: 10.1074/jbc.M805460200. [DOI] [PMC free article] [PubMed] [Google Scholar]
- 9.Frick D.N. The hepatitis C virus NS3 protein: a model RNA helicase and potential drug target. Curr. Issues Mol. Biol. 2007;9:1–20. [PMC free article] [PubMed] [Google Scholar]
- 10.Pyle A.M. Translocation and unwinding mechanisms of RNA and DNA helicases. Annu. Rev. Biophys. 2008;37:317–336. doi: 10.1146/annurev.biophys.37.032807.125908. [DOI] [PubMed] [Google Scholar]
- 11.Kim J.L., Morgenstern K.A., Caron P.R. Hepatitis C virus NS3 RNA helicase domain with a bound oligonucleotide: the crystal structure provides insights into the mode of unwinding. Structure. 1998;6:89–100. doi: 10.1016/s0969-2126(98)00010-0. [DOI] [PubMed] [Google Scholar]
- 12.Yao N., Reichert P., Weber P.C. Molecular views of viral polyprotein processing revealed by the crystal structure of the hepatitis C virus bifunctional protease-helicase. Structure. 1999;7:1353–1363. doi: 10.1016/s0969-2126(00)80025-8. [DOI] [PubMed] [Google Scholar]
- 13.Yao N., Hesson T., Weber P.C. Structure of the hepatitis C virus RNA helicase domain. Nat. Struct. Biol. 1997;4:463–467. doi: 10.1038/nsb0697-463. [DOI] [PubMed] [Google Scholar]
- 14.Cho H.S., Ha N.C., Oh B.H. Crystal structure of RNA helicase from genotype 1b hepatitis C virus. A feasible mechanism of unwinding duplex RNA. J. Biol. Chem. 1998;273:15045–15052. doi: 10.1074/jbc.273.24.15045. [DOI] [PubMed] [Google Scholar]
- 15.Gu M., Rice C.M. Three conformational snapshots of the hepatitis C virus NS3 helicase reveal a ratchet translocation mechanism. Proc. Natl. Acad. Sci. USA. 2010;107:521–528. doi: 10.1073/pnas.0913380107. [DOI] [PMC free article] [PubMed] [Google Scholar]
- 16.Appleby T.C., Anderson R., Somoza J.R. Visualizing ATP-dependent RNA translocation by the NS3 helicase from HCV. J. Mol. Biol. 2011;405:1139–1153. doi: 10.1016/j.jmb.2010.11.034. [DOI] [PMC free article] [PubMed] [Google Scholar]
- 17.Velankar S.S., Soultanas P., Wigley D.B. Crystal structures of complexes of PcrA DNA helicase with a DNA substrate indicate an inchworm mechanism. Cell. 1999;97:75–84. doi: 10.1016/s0092-8674(00)80716-3. [DOI] [PubMed] [Google Scholar]
- 18.Lee J.Y., Yang W. UvrD helicase unwinds DNA one base pair at a time by a two-part power stroke. Cell. 2006;127:1349–1360. doi: 10.1016/j.cell.2006.10.049. [DOI] [PMC free article] [PubMed] [Google Scholar]
- 19.Myong S., Bruno M.M., Ha T. Spring-loaded mechanism of DNA unwinding by hepatitis C virus NS3 helicase. Science. 2007;317:513–516. doi: 10.1126/science.1144130. [DOI] [PMC free article] [PubMed] [Google Scholar]
- 20.Cheng W., Arunajadai S.G., Bustamante C. Single-base pair unwinding and asynchronous RNA release by the hepatitis C virus NS3 helicase. Science. 2011;333:1746–1749. doi: 10.1126/science.1206023. [DOI] [PMC free article] [PubMed] [Google Scholar]
- 21.Rajagopal V., Gurjar M., Patel S.S. The protease domain increases the translocation stepping efficiency of the hepatitis C virus NS3-4A helicase. J. Biol. Chem. 2010;285:17821–17832. doi: 10.1074/jbc.M110.114785. [DOI] [PMC free article] [PubMed] [Google Scholar]
- 22.Levin M.K., Gurjar M., Patel S.S. A Brownian motor mechanism of translocation and strand separation by hepatitis C virus helicase. Nat. Struct. Mol. Biol. 2005;12:429–435. doi: 10.1038/nsmb920. [DOI] [PubMed] [Google Scholar]
- 23.Betterton M.D., Jülicher F. A motor that makes its own track: helicase unwinding of DNA. Phys. Rev. Lett. 2003;91:258103. doi: 10.1103/PhysRevLett.91.258103. [DOI] [PubMed] [Google Scholar]
- 24.Yu J., Cheng W., Oster G. Coupling translocation with nucleic acid unwinding by NS3 helicase. J. Mol. Biol. 2010;404:439–455. doi: 10.1016/j.jmb.2010.09.047. [DOI] [PubMed] [Google Scholar]
- 25.Yu J., Ha T., Schulten K. Structure-based model of the stepping motor of PcrA helicase. Biophys. J. 2006;91:2097–2114. doi: 10.1529/biophysj.106.088203. [DOI] [PMC free article] [PubMed] [Google Scholar]
- 26.Yu J., Ha T., Schulten K. How directional translocation is regulated in a DNA helicase motor. Biophys. J. 2007;93:3783–3797. doi: 10.1529/biophysj.107.109546. [DOI] [PMC free article] [PubMed] [Google Scholar]
- 27.Tozzini V. Coarse-grained models for proteins. Curr. Opin. Struct. Biol. 2005;15:144–150. doi: 10.1016/j.sbi.2005.02.005. [DOI] [PubMed] [Google Scholar]
- 28.Atilgan A.R., Durell S.R., Bahar I. Anisotropy of fluctuation dynamics of proteins with an elastic network model. Biophys. J. 2001;80:505–515. doi: 10.1016/S0006-3495(01)76033-X. [DOI] [PMC free article] [PubMed] [Google Scholar]
- 29.Tama F., Sanejouand Y.H. Conformational change of proteins arising from normal mode calculations. Protein Eng. 2001;14:1–6. doi: 10.1093/protein/14.1.1. [DOI] [PubMed] [Google Scholar]
- 30.Hinsen K. Analysis of domain motions by approximate normal mode calculations. Proteins. 1998;33:417–429. doi: 10.1002/(sici)1097-0134(19981115)33:3<417::aid-prot10>3.0.co;2-8. [DOI] [PubMed] [Google Scholar]
- 31.Tirion M.M. Large amplitude elastic motions in proteins from a single-parameter, atomic analysis. Phys. Rev. Lett. 1996;77:1905–1908. doi: 10.1103/PhysRevLett.77.1905. [DOI] [PubMed] [Google Scholar]
- 32.Krebs W.G., Alexandrov V., Gerstein M. Normal mode analysis of macromolecular motions in a database framework: developing mode concentration as a useful classifying statistic. Proteins. 2002;48:682–695. doi: 10.1002/prot.10168. [DOI] [PubMed] [Google Scholar]
- 33.Bahar I., Rader A.J. Coarse-grained normal mode analysis in structural biology. Curr. Opin. Struct. Biol. 2005;15:586–592. doi: 10.1016/j.sbi.2005.08.007. [DOI] [PMC free article] [PubMed] [Google Scholar]
- 34.Zheng W., Brooks B.R., Thirumalai D. Allosteric transitions in biological nanomachines are described by robust normal modes of elastic networks. Curr. Protein Pept. Sci. 2009;10:128–132. doi: 10.2174/138920309787847608. [DOI] [PMC free article] [PubMed] [Google Scholar]
- 35.Zheng W., Brooks B. Identification of dynamical correlations within the myosin motor domain by the normal mode analysis of an elastic network model. J. Mol. Biol. 2005;346:745–759. doi: 10.1016/j.jmb.2004.12.020. [DOI] [PubMed] [Google Scholar]
- 36.Zheng W., Brooks B.R. Probing the local dynamics of nucleotide-binding pocket coupled to the global dynamics: myosin versus kinesin. Biophys. J. 2005;89:167–178. doi: 10.1529/biophysj.105.063305. [DOI] [PMC free article] [PubMed] [Google Scholar]
- 37.Miller B.T., Zheng W., Brooks B.R. Langevin network model of myosin. J. Phys. Chem. B. 2008;112:6274–6281. doi: 10.1021/jp077042v. [DOI] [PubMed] [Google Scholar]
- 38.Zheng W., Thirumalai D. Coupling between normal modes drives protein conformational dynamics: illustrations using allosteric transitions in myosin II. Biophys. J. 2009;96:2128–2137. doi: 10.1016/j.bpj.2008.12.3897. [DOI] [PMC free article] [PubMed] [Google Scholar]
- 39.Zheng W. Coarse-grained modeling of conformational transitions underlying the processive stepping of myosin V dimer along filamentous actin. Proteins. 2011;79:2291–2305. doi: 10.1002/prot.23055. [DOI] [PubMed] [Google Scholar]
- 40.Zheng W. Multiscale modeling of structural dynamics underlying force generation and product release in actomyosin complex. Proteins. 2010;78:638–660. doi: 10.1002/prot.22594. [DOI] [PubMed] [Google Scholar]
- 41.Zheng W., Doniach S. A comparative study of motor-protein motions by using a simple elastic-network model. Proc. Natl. Acad. Sci. USA. 2003;100:13253–13258. doi: 10.1073/pnas.2235686100. [DOI] [PMC free article] [PubMed] [Google Scholar]
- 42.Navizet I., Lavery R., Jernigan R.L. Myosin flexibility: structural domains and collective vibrations. Proteins. 2004;54:384–393. doi: 10.1002/prot.10476. [DOI] [PubMed] [Google Scholar]
- 43.Yu H., Ma L., Cui Q. Mechanochemical coupling in the myosin motor domain. II. Analysis of critical residues. PLOS Comput. Biol. 2007;3:e23. doi: 10.1371/journal.pcbi.0030023. [DOI] [PMC free article] [PubMed] [Google Scholar]
- 44.Zheng W., Brooks B.R., Hummer G. Protein conformational transitions explored by mixed elastic network models. Proteins. 2007;69:43–57. doi: 10.1002/prot.21465. [DOI] [PubMed] [Google Scholar]
- 45.Tekpinar M., Zheng W. Predicting order of conformational changes during protein conformational transitions using an interpolated elastic network model. Proteins. 2010;78:2469–2481. doi: 10.1002/prot.22755. [DOI] [PubMed] [Google Scholar]
- 46.Zheng W., Tekpinar M. Large-scale evaluation of dynamically important residues in proteins predicted by the perturbation analysis of a coarse-grained elastic model. BMC Struct. Biol. 2009;9:45. doi: 10.1186/1472-6807-9-45. [DOI] [PMC free article] [PubMed] [Google Scholar]
- 47.Zheng W. Coarse-grained modeling of the structural states and transition underlying the powerstroke of dynein motor domain. J. Chem. Phys. 2012;136:155103. doi: 10.1063/1.4704661. [DOI] [PubMed] [Google Scholar]
- 48.Zheng W. Normal-mode-based modeling of allosteric couplings that underlie cyclic conformational transition in F1 ATPase. Proteins. 2009;76:747–762. doi: 10.1002/prot.22386. [DOI] [PubMed] [Google Scholar]
- 49.Flechsig H., Mikhailov A.S. Tracing entire operation cycles of molecular motor hepatitis C virus helicase in structurally resolved dynamical simulations. Proc. Natl. Acad. Sci. USA. 2010;107:20875–20880. doi: 10.1073/pnas.1014631107. [DOI] [PMC free article] [PubMed] [Google Scholar]
- 50.Flechsig H., Popp D., Mikhailov A.S. In silico investigation of conformational motions in superfamily 2 helicase proteins. PLoS ONE. 2011;6:e21809. doi: 10.1371/journal.pone.0021809. [DOI] [PMC free article] [PubMed] [Google Scholar]
- 51.Zheng W., Liao J.C., Doniach S. Toward the mechanism of dynamical couplings and translocation in hepatitis C virus NS3 helicase using elastic network model. Proteins. 2007;67:886–896. doi: 10.1002/prot.21326. [DOI] [PubMed] [Google Scholar]
- 52.Zheng W. Computer modeling of helicases using elastic network model. Methods Mol. Biol. 2010;587:235–243. doi: 10.1007/978-1-60327-355-8_17. [DOI] [PubMed] [Google Scholar]
- 53.Hafner J., Zheng W. Optimal modeling of atomic fluctuations in protein crystal structures for weak crystal contact interactions. J. Chem. Phys. 2010;132:014111. doi: 10.1063/1.3288503. [DOI] [PubMed] [Google Scholar]
- 54.Ming D., Wall M.E. Allostery in a coarse-grained model of protein dynamics. Phys. Rev. Lett. 2005;95:198103. doi: 10.1103/PhysRevLett.95.198103. [DOI] [PubMed] [Google Scholar]
- 55.Zheng W. A unification of the elastic network model and the Gaussian network model for optimal description of protein conformational motions and fluctuations. Biophys. J. 2008;94:3853–3857. doi: 10.1529/biophysj.107.125831. [DOI] [PMC free article] [PubMed] [Google Scholar]
- 56.Phillips J.C., Braun R., Schulten K. Scalable molecular dynamics with NAMD. J. Comput. Chem. 2005;26:1781–1802. doi: 10.1002/jcc.20289. [DOI] [PMC free article] [PubMed] [Google Scholar]
- 57.MacKerell A.D., Jr., Banavali N., Foloppe N. Development and current status of the CHARMM force field for nucleic acids. Biopolymers. 2000-2001;56:257–265. doi: 10.1002/1097-0282(2000)56:4<257::AID-BIP10029>3.0.CO;2-W. [DOI] [PubMed] [Google Scholar]
- 58.Krebs W.G., Gerstein M. The Morph server: a standardized system for analyzing and visualizing macromolecular motions in a database framework. Nucleic Acids Res. 2000;28:1665–1675. doi: 10.1093/nar/28.8.1665. [DOI] [PMC free article] [PubMed] [Google Scholar]
- 59.Franklin J., Koehl P., Delarue M. MinActionPath: maximum likelihood trajectory for large-scale structural transitions in a coarse-grained locally harmonic energy landscape. Nucleic Acids Res. 2007;35(Web Server issue) doi: 10.1093/nar/gkm342. W477–W82. [DOI] [PMC free article] [PubMed] [Google Scholar]
- 60.Zheng W. Accurate flexible fitting of high-resolution protein structures into cryo-electron microscopy maps using coarse-grained pseudo-energy minimization. Biophys. J. 2011;100:478–488. doi: 10.1016/j.bpj.2010.12.3680. [DOI] [PMC free article] [PubMed] [Google Scholar]
- 61.Zheng W., Tekpinar M. Accurate flexible fitting of high-resolution protein structures to small-angle x-ray scattering data using a coarse-grained model with implicit hydration shell. Biophys. J. 2011;101:2981–2991. doi: 10.1016/j.bpj.2011.11.003. [DOI] [PMC free article] [PubMed] [Google Scholar]
- 62.Lin C., Kim J.L. Structure-based mutagenesis study of hepatitis C virus NS3 helicase. J. Virol. 1999;73:8798–8807. doi: 10.1128/jvi.73.10.8798-8807.1999. [DOI] [PMC free article] [PubMed] [Google Scholar]
Associated Data
This section collects any data citations, data availability statements, or supplementary materials included in this article.