

In this article, the authors analyze in detail the predicted accessibility of binding sites within the seed region (opposite microRNA positions 2–8) using a large set of miRNA binding sites identified in HITS-CLIP and PAR-CLIP experiments. Their analysis revealed that nucleotides at the 3′-end of bound seed matches are significantly more accessible than nucleotides at the 5′-end and also than nucleotides at any positions in the unbound seed matches. Of importance the authors concluded that in order to discriminate between a functional and a nonfunctional binding site, the accessibility of a single nucleotide at the 3′-end is more effective than the accessibility of several nucleotides at the 5′-end. Based on these results, the authors propose a model whereby nucleation of the binding between microRNAs and their mRNA targets begins at the 5′-end of the miRNA and continues along the length of the seed. These findings can be applied to improved miRNA target prediction algorithms.
Keywords: miRNA targets, miRNA seed match, binding site accessibility, PAR-CLIP, HITS-CLIP
Abstract
To find out whether the AGO-miRNA complex is more sensitive to the accessibility of a particular region inside the seed match, we analyze in detail the accessibility of a wide set of miRNA binding sites validated by PAR-CLIP and HITS-CLIP experiments. Our analysis reveals that nucleotides at the 3′-end of bound seed matches are significantly more accessible than nucleotides at the 5′-end as well as nucleotides at any positions in the unbound seed matches. We show that the accessibility of a single nucleotide at the 3′-end is more effective than the accessibility of several nucleotides at the 5′-end in discriminating between functional and nonfunctional binding sites. Analysis of mRNA and protein fold changes induced by miRNA overexpression demonstrates that genes with accessible nucleation regions at the 3′-end are down-regulated more strongly than genes whose accessible nucleation regions are located elsewhere within the seed match. We also observed an increase in the precision of the miRNA target prediction algorithm PACMIT when accessibility toward the 3′-end of the seed match was required. The pronounced sensitivity of the AGO–miRNA complex to the accessibility of the 3′-end of the seed match suggests that, in most cases, nucleation occurs in this region. We show that this conclusion is consistent with previous experimental studies.
INTRODUCTION
Prediction of microRNA (miRNA) targets relies heavily on our understanding of the patterns governing the miRNA–mRNA recognition (Doench and Sharp 2004; Brennecke et al. 2005; Didiano and Hobert 2006, 2008; Filipowicz et al. 2008; Bartel 2009; Hammell 2010). Inferring these patterns requires a systematic analysis of validated miRNA binding sites. Naturally, larger numbers of validated binding sites will provide more examples of what is and what is not relevant in the target recognition, thus allowing a faster identification of more appropriate rules. Despite the availability of automated methods allowing measurement of miRNA-induced down-regulation of mRNA and protein levels for thousands of genes (Ørom and Lund 2010; Thomson et al. 2011), the exact identification of a functional binding site remains difficult. It usually requires the integration of several different techniques, such as reporter gene assays with site-directed mutagenesis, resulting in a more time-consuming procedure that can often be performed for only a few genes at a time (Kuhn et al. 2008; Thomson et al. 2011). As a consequence, only a tiny fraction of sites predicted by computational methods has been validated so far (Papadopoulos et al. 2009; Xiao et al. 2009). This fact poses a formidable obstacle to a detailed understanding of the site recognition process.
Recently, methods based on the sequencing of the RNA isolated by crosslinking immunoprecipitation (CLIP) have provided coordinates of thousands of mRNA regions bound by the AGO-miRNA ribonucleoprotein complex in the human (Hafner et al. 2010) and mouse (Chi et al. 2009). The CLIP method alone, however, cannot reveal the impact of a particular binding site on the mRNA and/or protein levels, and unlike reporter assays combined with site-directed mutagenesis, it cannot provide the exact target positions involved in the miRNA–mRNA pairing. Yet, this lack of information is compensated by the statistical robustness guaranteed by the large number of identified bound regions. For instance, in the photo-activatable ribonucleoside-enhanced CLIP (PAR-CLIP) experiments (Hafner et al. 2010), 17,319 regions bound by hundreds of miRNAs have been mapped to 4647 human transcripts.
Systematic analysis of experimentally verified miRNA targets has shown that site accessibility plays an important role in the recognition of mRNA binding sites either by miRNA– and siRNA–protein complexes (Robins et al. 2005; Ameres et al. 2007; Kertesz et al. 2007; Long et al. 2007; Gredell et al. 2008; Obernosterer et al. 2008; Tafer et al. 2008; Marin and Vanicek 2011, 2012) or by RNA binding proteins that do not mediate the interaction through an RNA guide strand (Li et al. 2011). Detailed analyses of proteomics, transcriptomics, and CLIP-seq experiments have confirmed that site accessibility is a useful criterion for discriminating between functional and nonfunctional miRNA binding sites (Hausser et al. 2009; Wen et al. 2011). Because of its proven role in binding-site identification, accessibility has been employed in several miRNA target prediction methods to reduce the false-discovery rate (Robins et al. 2005; Muckstein et al. 2006; Kertesz et al. 2007; Long et al. 2007; Busch et al. 2008; Betel et al. 2010; Liu et al. 2010; Marin and Vanicek 2011, 2012). Some of these methods have implemented an accessibility filter based on the assumption that only 3–4 nucleotides (nt) in the target should be accessible in order to nucleate the binding with the whole miRNA (Robins et al. 2005; Long et al. 2007; Marin and Vanicek 2011). Requirement of a short nucleation region is justified by the experimental observation that at least 4 base pairs (bp) are necessary to nucleate the formation of a longer RNA–RNA duplex (Hargittai et al. 2004). Recognizing the critical role of the seed region (miRNA positions 2–8) in target recognition, Robins et al. (2009) and Marin and Vanicek (2011) further assume that the nucleation region must be located within the seed match. However, it is not known how accurate the assumption that nucleation can be initiated at any position within the seed is. What we do know is that crystal structures of prokaryotic and eukaryotic AGO–miRNA complexes suggest that only positions 2–6 in the miRNA are well positioned for initiating the Watson-Crick pairing, whereas positions 7 and 8 are not (Wang et al. 2008; Elkayam et al. 2012; Nakanishi et al. 2012; Schirle and MacRae 2012). This could imply that accessibility of nucleotides pairing positions 7–8 might not be relevant in the nucleation process.
Motivated by the structural evidence and by the availability of a large number of AGO–miRNA bound regions discovered in the PAR-CLIP and HITS-CLIP experiments, in this study, we explore the accessibility patterns of all nucleotides within the seed matches of both functional (bound) and nonfunctional (unbound) miRNA binding sites. The goal is to identify possible regions of the seed match whose accessibility could be of particular relevance for the nucleation process. Our results not only confirm the expected difference between the accessibilities of bound and unbound seed matches but also, and more importantly, reveal an exceptional sensitivity of the AGO-miRNA complex to the accessibility of the 3′-end of the seed match. In fact, our analysis implies that the accessibility of the 5′-end is almost irrelevant for the prediction of the functionality of a putative binding site. All together, our results suggest that the nucleation takes place preferentially in the 3′ region of the seed match. This conclusion agrees not only with the structural evidence but also with the results of RISC-mediated cleavage experiments that show how inaccessibility of nucleotides at the 3′-end of the seed match can significantly reduce the miRNA/siRNA function (Ameres et al. 2007).
RESULTS
Assessing accessibility of bound and unbound seed matches
Our analysis considered as a putative miRNA binding site any 7-mer matching positions 2–8 of the 100 miRNAs that had been the most abundant in PAR-CLIP experiments. Seed matches lying within the crosslink-centered regions (CCRs) of the human 3′ UTRs were classified as bound, while those lying outside the CCRs were classified as unbound (see Materials and Methods). Quantification of the accessibility of the seed matches was based on the accessibility of the nucleation region, i.e., of an n-mer (a stretch of n nucleotides) assumed to be responsible for the initiation of the miRNA:mRNA pairing. An n-mer was considered accessible if the probability Pu that the n-mer was unpaired was equal or larger than a cutoff value Pcutoff. A seed match harboring an accessible nucleation region was, in turn, considered to be an accessible site. The calculation of the Pu values for all n-mers (n =1,…,7) in all human 3′ UTR sequences was performed with the program RNAplfold (Bernhart et al. 2006).
Discriminating between bound and unbound sites using accessibility
Once all seed matches had been classified as either bound or unbound and as either accessible or inaccessible, we computed the fraction of bound (B) sites that were accessible (A), i.e., the conditional probability P(A|B) (Fig. 1). Similarly, we computed the fraction of unbound (U) sites that were accessible, i.e., the conditional probability P(A|U) (see Fig. 1). Then, we computed the difference
FIGURE 1.
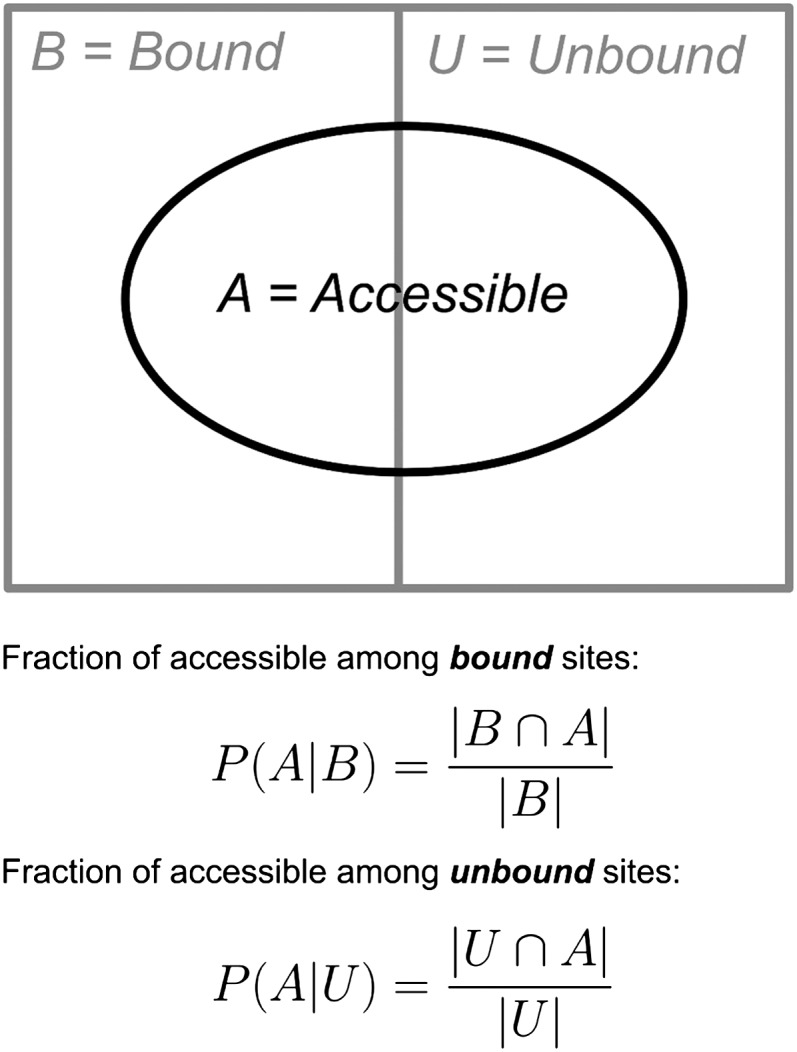
Classification of seed matches according to their accessibility. All seed matches are divided among bound (B) and unbound (U) sites according to the PAR-CLIP data. Similarly, for a given accessibility threshold Pcutoff and length n of the nucleation region, they are divided into accessible (A) and inaccessible. The fraction of accessible among bound sites (i.e., the conditional probability P(A|B)) is computed as the number of sites that are both bound and accessible (|B ∩ A|) divided by the total number of bound sites (|B|). The fraction of accessible among unbound sites (i.e., the conditional probability P(A|U)) is computed as the number of sites that are both unbound and accessible (|U ∩ A|) divided by the total number of unbound sites (|U|).
This difference is our measure of the impact that accessibility has on the discrimination between bound and unbound sites. For instance, in the hypothetical case that accessibility was the only determinant of whether a given site is bound, D should be exactly unity, because in this scenario all bound sites would be accessible [P(A|B) = 1] and all unbound sites inaccessible [P(A|U) = 0]. On the other hand, if accessibility played absolutely no role in the discrimination between bound and unbound sites, D should be zero because in that scenario the two fractions would be equal [P(A|B) = P(A|U)].
To test our methodology, we first analyzed differences between the accessibilities of bound and unbound sites considering a nucleation region of length n = 7. We found that the fraction P(A|B) was always higher than P(A|U) even when the accessibility threshold Pcutoff was varied (Fig. 2A). Moreover, we observed that the difference between P(A|B) and P(A|U) was higher and more statistically significant for lower Pcutoff values, implying that these Pcutoff values allow a much better discrimination between bound and unbound sites. Finally, we also compared bound and unbound sites by means of their “average accessibility,” which was defined as the geometric average of Pu (see Materials and Methods). We observed that the average accessibility was significantly higher for the bound 7-mers than for the unbound ones (P = 8.63 × 10−41, one-sided Wilcoxon rank sum test) (see Fig. 2B). All together, the results presented in Figure 2 agree with the widely accepted assumption that functional binding sites should be accessible in order to be able to interact with the miRNA.
FIGURE 2.

Comparison between the accessibilities of bound and unbound sites. (A) Fractions P(A|B) and P(A|U) of accessible sites among bound and unbound sites, respectively, are compared for 11 values of the accessibility threshold Pcutoff, assuming a nucleation region of length n = 7. Statistical significance was evaluated with the paired one-sided t-test [(*) P ≤ 0.05; (**) P ≤ 0.01; (***) P ≤ 0.001; P-values >0.05 are not indicated]. (B) Average accessibility of a 7-mer seed match is shown for bound and unbound sites. Statistical significance was evaluated with the one-sided Wilcoxon rank sum test. (P = 8.63 × 10−41). As in all further figures, error bars represent standard errors.
Discriminating between bound and unbound sites using short nucleation regions
So far we analyzed the accessibility of the seed match as a whole. Our main intention, however, was to find out whether the accessibility of shorter nucleation regions was essential for the site functionality and whether the position of the nucleation region inside the seed match played a role. Initially, we studied the possible influence of the length n of the nucleation region on the discrimination D, while allowing the nucleation region to be anywhere within the seed match. We denoted this case as an unrestricted location. Figure 3A shows the dependence of the discrimination between bound and unbound sites on the accessibility threshold Pcutoff and on the length n. Similarly, panels B and C of Figure 3 show the individual dependences of P(A|B) and P(A|U) on Pcutoff and n. In contrast to the expected monotonic decrease of P(A|B) and P(A|U) with increasing Pcutoff, discrimination D always has a maximum (see Table 1). Surprisingly, (except for n = 1) the highest discrimination is not observed for the strictest accessibility threshold. From the comparison among the maximum D values for different lengths n, we conclude that the discrimination between bound and unbound sites decreases for shorter lengths of the nucleation region, at least if the location of the nucleation region is unrestricted.
FIGURE 3.

Discrimination between bound and unbound sites as a function of the accessibility threshold Pcutoff and of the length n of the nucleation region. (A) Discrimination D is shown as a function of Pcutoff for all possible lengths n. (B) Fraction of the accessible among bound sites [P(A|B)] plotted as a function of Pcutoff for all lengths n. (C) Fraction of the accessible among unbound sites [P(A|B)] plotted as a function of Pcutoff for all lengths n. (D) Discrimination is shown as a function of the length of the nucleation region while maintaining the same total number of accessible sites. For each length n, we show the cases for which approximately 10 or 13 million accessible sites were obtained. In each case, the corresponding value of Pcutoff is indicated above the bar. Statistical significance was evaluated with the unpaired one-sided t-test.
TABLE 1.
Accessibility threshold (Pcutoff) values maximizing the discrimination between bound and unbound sites for different lengths of the nucleation region
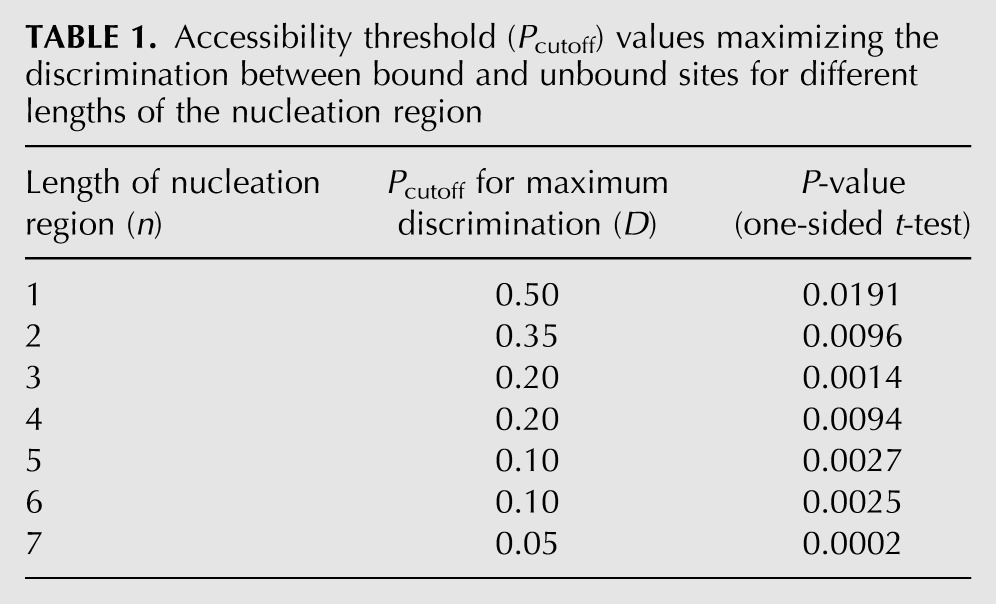
In order to exclude a potential bias due to a varying total number of accessible sites in the 3′ UTRs (regardless of their complementarity to any miRNA seed), we first fixed the total number of accessible sites and then, for each length n, found the n-dependent value of the accessibility cutoff Pcutoff giving this fixed number of accessible sites. Finally, we compared the discrimination values obtained with these precomputed Pcutoff values for different lengths n. Figure 3D shows the discrimination values obtained when 10 or 13 million sites were classified as accessible, for n = 3, 4, 5, 6, and 7. Despite the new constraint, longer nucleation regions again allow better discrimination between bound and unbound sites.
Nucleation regions located at the 3′-end of the seed match maximize discrimination between bound and unbound sites
The miRNA target prediction methods requiring a nucleation region usually allow this region to be located anywhere within the seed (Robins et al. 2005; Marin and Vanicek 2011). Evidence from crystal structures, however, suggests that the 5′-end of the seed match—more exactly positions 7b and 8b (notation defined in Fig. 4A)—might not be relevant for the nucleation of the duplex formation. For this reason, we analyzed the discrimination D obtained with short nucleation regions (n < 7) when their location was restricted to a particular section of the seed match (Fig. 4). We denote this scenario as a restricted location of the nucleation region. Results shown in Figure 4 confirm that the location of the nucleation region is indeed relevant. In fact, for all values of n (panels B–G), the highest discrimination is always observed when the nucleation region is constrained to the 3′-end of the seed matches. The discrimination decreases gradually as the nucleation region moves toward the 5′-end.
FIGURE 4.

Dependence of the discrimination between bound and unbound sites on the location of the nucleation region within the seed match. (A) Numbering of the positions in the binding site. It is based on the corresponding numbering of positions in the miRNA. (B–G) Discrimination obtained when the nucleation region within the binding site is restricted to the positions indicated on the x-axis. For each length n, all possible locations were explored, always using the Pcutoff value indicated in Table 1. Statistical significance was evaluated with the unpaired one-sided t-test.
Similarly, analysis of the average accessibility of all possible nucleation regions (see Fig. 5) shows that n-mers located at the 3′-end (for n = 1,…,5) are more accessible than n-mers located at any other region of the seed match (P ≤ 0.001, one-sided Wilcoxon rank sum test). As in Figure 4, there is a gradual decrease in the average accessibility when the nucleation region moves from the 3′-end to the 5′-end. On the other hand, the average accessibility of the nucleation regions within unbound sites is roughly the same for all locations. Moreover, in most cases it is significantly lower than the accessibility of the same nucleation region in the bound sites.
FIGURE 5.

Average accessibility of the nucleation region as a function of its location within the seed match. (A–F) Average accessibility is shown for both bound and unbound sites and for all possible n-mers. Statistical significance was evaluated with the one-sided Wilcoxon rank sum test.
Finally, Figure 6A compares the values of discrimination obtained with different lengths of the nucleation region. The comparison was performed under three different conditions: (1) unrestricted location of the nucleation region, (2) location restricted to the 5′-end, or (3) location restricted to the 3′-end. The conclusion is surprising: The discrimination between bound and unbound sites remains roughly constant regardless of the assumed length of the nucleation region, as long as this region is restricted to the 3′-end of the seed match. The same is observed in Figure 6B, showing the dependence of the discrimination on the accessibility threshold for different lengths n and focusing on nucleation regions restricted to the 3′-end.
FIGURE 6.

Restricting the location of the nucleation region to the 3′-end results in an optimal discrimination between bound and unbound sites. (A) Discrimination D as a function of the length n in three scenarios: (1) unrestricted location of the nucleation region (unrestricted n-mer), (2) location restricted to the 5′-end (5′ n-mer), or (3) location restricted to the 3′-end (3′ n-mer). Statistical significance was evaluated with the unpaired one-sided t-test. (B) Discrimination D as a function of Pcutoff for nucleation regions of different lengths, yet always restricted to the 3′-end of the seed match. Results in panels A and B are based on the PAR-CLIP data set. (C,D) The same analysis as in panels A and B, but for the HITS-CLIP data set.
In order to confirm our observations in an independent set of validated binding sites, we analyzed separately the HITS-CLIP data set of AGO-bound regions identified in mouse 3′ UTRs. In this case, the “bound” seed matches were defined as the seed matches that overlapped with the AGO ternary map for the 20 most abundant miRNAs (see Materials and Methods). The results of the analysis resemble those obtained for the PAR-CLIP data set: When the location of the nucleation region is unrestricted, the extent of the discrimination increases monotonically with the increasing length of the nucleation region (Fig. 6C; Supplemental Fig. 1). When the nucleation region is restricted to the 3′-end of the seed match, the discrimination remains roughly constant for all lengths n (except for n = 1), and higher than the discrimination obtained for the “unrestricted” and “5′ n-mer” cases (Fig. 6C,D). We also analyzed the discrimination obtained with short nucleation regions (n < 7) when their location was restricted to a particular section of the seed match (Supplemental Fig. 2). Although the discrimination values fluctuate when the nucleation region moves from the 3′-end to the 5′-end, it is still evident that higher discrimination is obtained when this region is located toward the 3′-end of the seed match.
To sum up, we have shown that the location of the nucleation region has a significant impact on the discrimination between bound and unbound sites and also that this feature is not exclusive for human miRNA binding sites.
Discriminatory power of Pu compared with discriminatory power of other thermodynamic properties of the miRNA:mRNA binding
Accessibility is, in this study, measured by probability Pu that a given region within the seed match is unpaired. Clearly, Pu is not the only way to judge the likelihood of the interaction between the miRNA and its target. In fact there are quite a few features that have been used to predict functionality of a putative binding site. Since a comprehensive comparison of the predictive power of various features—as done by Hausser et al. (2009)—is beyond the scope of this article, here we focus only on the thermodynamic features. Among these, the most common are the opening energy (energy required to make the binding region of the target accessible), the hybridization energy (energy gained by paring between the miRNA and the target), and the interaction energy (the difference between these two energies) (Rehmsmeier et al. 2004; Muckstein et al. 2006; Kertesz et al. 2007; Busch et al. 2008). Specifically, we compare the discrimination D obtained with the opening, hybridization, and interaction energies with the discrimination obtained with Pu (using n = 7, n = 4 restricted to the 3′-end, and n = 4 restricted to the 5′-end). Results of this analysis suggest that the best predictors are the probability Pu of the seed match to be accessible and the opening energy—which is not surprising given the clear correlation between these two properties (Fig. 7). The results also show that the accessibility of the 3′-end of the seed match is more useful in discriminating functional from nonfunctional sites than interaction or hybridization energies, which are two features widely used in miRNA target prediction.
FIGURE 7.

Comparison of accessibility (Pu) and other thermodynamic features as predictors of site functionality. Discrimination D based on the accessibility is shown for different lengths and locations of the nucleation region: n = 7 (labeled as Pu (7-mer)), n = 4 restricted to the 3′-end (labeled as Pu (3′ 4-mer)), and n = 4 restricted to the 5′-end (labeled as Pu (5′ 4-mer)). Discrimination values based on hybridization (Ehybrid), opening (Eopen), and interaction (Einteraction) energies are also shown (see Materials and Methods). Statistical significance was evaluated with the unpaired one-sided t-test. Results are based on the PAR-CLIP data set.
The low predictive power of the hybridization energy might be explained by the limitations of current algorithms, which cannot account for important effects such as the necessary pre-accommodation of the RNA strands or possible steric effects of the protein residues. As a consequence, the free energy of the pairing might be largely misestimated, and this may affect the interaction energy values as well. On the other hand, the opening energy depends predominantly only on the RNA sequence, and hence the folding algorithms are expected to be more accurate, which explains the higher predictive power of opening energy observed in Figure 7. Our conclusions based on the discrimination D are in agreement with those of Hausser et al. (2009) who used a different statistical analysis, yet observed the same relative behavior between these three thermodynamic features.
Considering only sites with 3′ accessible nucleation regions improves performance of PACMIT
Briefly, PACMIT is a miRNA target prediction method that scores putative miRNA–3′ UTR interactions according to the overrepresentation (Robins and Press 2005; Murphy et al. 2008) of accessible seed matches (Marin and Vanicek 2011, 2012). In PACMIT, accessible seed matches are those with at least one nucleation region of length n = 4 for which Pu ≥ 0.2 (Marin and Vanicek 2011). Since our present results suggest that the nucleation takes place preferentially at the 3′-end of the seed match, we have included this restriction into the accessibility filter of PACMIT. To evaluate the potential benefits of introducing this new filter, we compared the mRNA and protein fold changes (log2FC) of targets predicted under three different conditions: (1) without the accessibility filter, (2) with the accessibility filter and with unrestricted location of the nucleation region (as currently used in PACMIT), and (3) with the accessibility filter and with restricting the nucleation region to the 3′-end. Indeed, Figure 8 shows that PACMIT's targets predicted using the 3′-restricted location are more down-regulated than those predicted using the unrestricted location. Moreover, this conclusion holds both on the mRNA (Fig. 8A) and protein levels (Fig. 8B) of the targets. When the location of the nucleation region is unrestricted, the strength of the down-regulation decreases gradually with the decreasing length of the nucleation region. However, when the nucleation region is restricted to the 3′-end, the strength of the down-regulation remains roughly constant regardless of the length n. This pattern, observed already in Figure 6A, confirms again that the AGO–miRNA complex is particularly sensitive to the accessibility at the 3′-end of the seed match.
FIGURE 8.

PACMIT's accessibility filter performs better when the location of the nucleation region is restricted to the 3′-end. (A) Mean log2 fold changes in mRNA expression of miRNA targets predicted using the unrestricted and 3′-restricted location of the nucleation region as a function of its length n. (B) Mean log2 fold changes in protein expression for the miRNA targets predicted using the different filters. mRNA and protein fold changes were taken from Selbach et al. (2008) and Baek et al. (2008). In both panels, stars below each bar denote the statistical significance (evaluated with the one-sided Wilcoxon rank sum test) of the difference between the corresponding log2 fold change and the log2 fold change obtained without any filter. (C) Precision vs. sensitivity curves are shown for several miRNA target prediction algorithms that consider the accessibility of the binding site. PACMIT unrestricted refers to PACMIT using the unrestricted location of the nucleation region with length n = 4, and PACMIT 3′-restricted refers to PACMIT using a nucleation region of length n = 4 restricted to the 3′-end of the seed match. The two curves labeled as PACCMIT correspond to the case in which in addition to accessibility, conservation of the seed match in chimp, rhesus and mouse is required.
We also evaluated the effect of the new filter on the precision of the PACMIT algorithm (for details about the data set of positive and negative interactions used for this analysis, see Materials and Methods). While in the old PACMIT algorithm the location of the nucleation region was unrestricted, in the new PACMIT algorithm it was restricted to the 3′-end of the seed match. The analysis includes also the results of PACCMIT, the latest and improved version of our algorithm in which seed matches are filtered by both accessibility and conservation (Marin and Vanicek 2012). The precision versus sensitivity curves in Figure 8C show that restricting the location of the nucleation region increases the precision regardless of whether seed conservation is required. Moreover, the improvement in precision of PACMIT/PACCMIT is not limited to a nucleation region of length n = 4 (for results for n = 1,…,6, see Supplemental Fig. 3).
Figure 8C shows also the precision obtained with other methods that take accessibility of the binding site into account. PITA (Kertesz et al. 2007) and IntaRNA (Busch et al. 2008) score the likelihood of miRNA:mRNA interaction according to the interaction energy. MirSVR considers both accessibility and conservation of the biding site, A/U content, length of the 3′ UTR, and other features in order to score its predictions (Betel et al. 2010). In agreement with previous comparisons (Marin and Vanicek 2011, 2012), Figure 8C shows that PACMIT—in which only accessibility is considered—is more precise than PITA and IntaRNA, in particular among the top predictions (i.e., at low sensitivity). This is consistent with our previous finding that Pu (used in PACMIT) is a better predictor of site functionality than the interaction energy (used in PITA and IntaRNA). Precision of our algorithm is considerably increased by requiring conservation of the seed match (see results of PACCMIT). Among the top predictions, PACCMIT is much more reliable even than MirSVR. On the other hand, for lower-ranking predictions this method shows a comparable or even slightly higher precision than PACCMIT, which could be due to the combined effect of the several features used to score predictions.
DISCUSSION
Accessibility of the miRNA seed match has been used as an indicator of site functionality; according to experimental evidence, four accessible nucleotides should suffice for initiating the miRNA:mRNA duplex formation. However, crystal structures suggest that nucleotides 7 and 8 in the miRNA are not involved in the nucleation process, implying that the accessibility of this region of the seed match might be uninformative of the site functionality.
Motivated by the apparent low relevance of positions 7–8 in nucleating the miRNA:mRNA pairing, here we studied the accessibility of two large data sets of validated binding sites to find out if the conclusions from the crystal structures apply to all miRNAs in general. Two quantities were used to analyze the accessibility of both functional and nonfunctional seed matches: One was the discrimination D between bound and unbound sites obtained from the differences in accessibility, while the other was the average accessibility of all possible nucleation regions (n-mers) located within the seed matches.
First of all, analysis of the accessibility of the whole seed match (7-mers) showed that bound sites were significantly more accessible than unbound ones. Further analyses assuming shorter nucleation regions revealed that, in the bound sites, the accessibility of nucleotides at the 3′-end of the seed match was significantly higher than the accessibility of nucleotides at the 5′-end. Similarly, maximum discrimination between bound and unbound sites was observed when the nucleation region was restricted to the 3′-end of the seed match. In contrast, no difference between the accessibilities of the 3′- and 5′-ends was observed for the unbound sites. As the decrease in discrimination from the 3′- to the 5′-end is gradual, it is impossible to partition the positions among important and unimportant ones. We would rather postulate that position 2b is the most important in the nucleation process and that it is followed in the order of decreasing importance by positions 3b, 4b, etc. This leaves positions 7b and 8b as the least important in predicting site functionality, just as expected from the crystal structures.
Since not all positions within functional seed matches turned out to be equally accessible, we upgraded the accessibility filter of the miRNA target prediction method PACMIT accordingly: After the modification, only sites with the nucleation regions at the 3′-end were considered. Comparison of the precision of PACMIT before and after the modification revealed that PACMIT was indeed more precise when the location of the nucleation region was restricted to the 3′-end. Analysis performed on two other, completely independent data sets showed that targets predicted with this restriction were repressed more strongly than those obtained without the restriction. All together, these results not only confirm the importance of accessibility in discriminating functional from nonfunctional seed matches but also show that appropriate use of this information can improve miRNA target prediction algorithms.
Overall, our findings show that the AGO–miRNA complex is much more sensitive to the accessibility of the 3′-end than to the accessibility of any other region of the seed match. This suggests that the nucleation of the binding occurs preferentially toward the 3′-end. Our conclusion is consistent with the results of three other studies:
The crystal structure of an AGO protein containing a DNA guide strand suggests that the miRNA:mRNA paring is initiated in the seed region (Wang et al. 2008). In fact, the structure shows that nucleotides 2–6 are perfectly exposed to interact through their Watson-Crick edges. While complementarity to positions 7–11 enhances the recognition of the target by the miRNA, these miRNA nucleotides are not properly positioned to initiate Watson-Crick pairing with the binding sites. This would explain the low discrimination between bound and unbound sites observed when the nucleation region was restricted to the 5′-end of the seed match (Figs. 4, 6A). Although the crystal structures were initially obtained for a prokaryotic AGO protein (in Thermus thermophilus), the crystal structures recently obtained for the AGO–miRNA complex in yeast (Nakanishi et al. 2012) and in the human (Elkayam et al. 2012; Schirle and MacRae 2012) showed a good deal of structural similarity between the prokaryotic and eukaryotic AGO proteins. In fact, these new structures confirmed that only positions 2–6 in the guide strand are well positioned to start the pairing. Nakanishi et al. (2012) even hypothesized that only positions 2–4 should be involved in the nucleation of the miRNA:mRNA pairing.
RISC-mediated target cleavage experiments in HeLa cells have shown that when nucleotides 1b–10b in the binding site are made inaccessible, cleavage efficiency decreases by ∼78% in comparison with the case in which all nucleotides are accessible (Ameres et al. 2007). The same investigators show that when nucleotides 6b–10b (i.e., 5 nt) are again made accessible in an attempt to restore the cleavage activity, efficacy is still reduced by ∼68%. In other words, making accessible 5 nt at the 5′-end of the seed match leads to an efficacy increase of only 10% (of the wild-type value). However, when nucleotides 3b–5b are made accessible as well, cleavage efficacy is reduced only by ∼22%. In other words, making accessible the other three additional nucleotides located almost at the 3′-end of the seed match increases the cleavage efficacy by 46% (of the wild-type value).
In a recent analysis of the AGO-mRNA HITS-CLIP “orphan” clusters, i.e., clusters that do not contain any canonical seed matches and that account for 27% of all clusters, Chi et al. (2012) identified an alternative binding mode that requires positions 2–6 of the miRNA to nucleate the pairing with the mRNA. According to the proposed mechanism, once the nucleation step has taken place, position 6b is replaced by position 7b in the duplex (thus leaving position 6b in a bulge). Then, positions 8b and 9b can pair with positions 7 and 8 in the miRNA. The fact that this new binding mode (named G-bulge) explains a considerable fraction of the orphan clusters (up to ∼75% for the brain specific miR-124) implies that the 5′-end region of the binding site is less likely to be used in the nucleation process.
To conclude, our findings are consistent with previous pieces of evidence and suggest that the miRNA-mRNA binding is nucleated toward the 3′-end of the seed match. However, experiments designed specifically to test the functionality of seed matches accessible at either the 3′- or 5′-end should be carried out in order to confirm that the preferential accessibility of the 3′-end of the seed match is in fact due to the requirements of the miRNA:mRNA base pairing.
MATERIALS AND METHODS
3′ UTR and miRNA sequences
Genomic coordinates of Ensembl human (hg18) and mouse (mm9) genes were used to extract the corresponding 3′ UTR sequences using the UCSC Table browser (http://genome.ucsc.edu). Only protein coding genes were included in the database, and when several mRNA isoforms were reported for the same Ensembl gene ID, only the one with the longest 3′ UTR sequence was used in the analysis. Sequences of the 100 most abundant miRNAs in the PAR-CLIP experiments were obtained from the Supplemental Table S5 of the original publication Hafner et al. (2010). Sequences of the miRNAs present in the HITS-CLIP, pSILAC, and microarray experiments were obtained from the miRBase website (http://www.mirbase.org/search.shtml).
Bound and unbound sites in human—PAR-CLIP
Genomic coordinates of the 17,319 CCRs found in the combined AGO-PAR-CLIP experiments were taken from the Supplemental Table S4 of the original publication Hafner et al. (2010). After mapping the CCRs (41 nt in length) to the human 3′ UTRs, the 3′ UTR sequences were scanned for matches to the seed (positions 2–8) of any of the 100 most abundant miRNAs. According to PAR-CLIP developers, miRNA seed matches should be at positions 21–30 of the CCR; therefore, only seed matches completely embedded in this region of the CCR were classified as bound sites. The remaining seed matches were classified as unbound sites.
Bound and unbound sites in mouse—HITS-CLIP
The genomic coordinates of the 15,663 miRNA binding sites reported in the HITS-CLIP AGO ternary map were downloaded from http://ago.rockefeller.edu/tag_mm9.php. After mapping the AGO bound sites of at least 7 bp to the mouse 3′ UTRs, the 3′ UTR sequences were scanned for matches to the seed (positions 2–8) of any of the 20 most abundant miRNAs (the only miRNAs considered for the AGO ternary map). Only seed matches that completely overlapped with the AGO bound sites were classified as bound sites. The remaining seed matches were classified as unbound sites.
Data sets of true and false positives
To compute precision and sensitivity of different methods, we constructed positive and negative data sets using the bound sites of the PAR-CLIP data set. Functional miRNA–gene pairs were defined as those pairs in which at least one bound seed match was found in the human 3′ UTR. A total of N = 3698 highly reliable positive interactions were identified in this way. As for the negative data set, we first selected all unbound genes, i.e., all genes for which no CCR could be mapped to any region of the whole transcript (5′ UTR, CDS, or 3′ UTR). Among these unbound genes we selected all the cases in which at least one 7-mer complementary to positions 2–8 of any of the 100 most expressed miRNAs was found. We call these the “unbound” miRNA–gene pairs. Finally, the negative data set of nonfunctional pairs was constructed by randomly selecting N = 3698 pairs from the list of unbound pairs. We intentionally constructed the negative data set of the same size as the positive data set in order that the values of precision achieved by various methods were well distributed between 0 and 1 and not concentrated at either of the extremes, as could happen if the proportion of negatives in the data set were too high or too low.
Free seed and computation of accessibility
Pu values for all n-mers (n = 1,…,7) in all human and mouse 3′ UTR sequences were computed with RNAplfold (Bernhart et al. 2006) using a window W = 80 and a maximum pairing distance L = 40, as used in other studies (Tafer et al. 2008; Betel et al. 2010; Liu et al. 2010; Li et al. 2011; Marin and Vanicek 2011, 2012).
Statistical analysis
For each CLIP data set, we distributed all bound and unbound seed matches randomly into 10 bins of equal size. In other words, the numbers of bound and unbound sites in each bin were the same among the 10 bins. P(A|B), P(A|U), and D were computed for each bin separately and the corresponding means, standard errors, and P-values were obtained by considering the distribution among the 10 bins. The statistical significance of the mean D values and of the differences between two mean D values was assessed by means of the t-test, while the normality of the distributions of D for each configuration of parameters was corroborated with the Shapiro-Wilk test.
In our analysis, accessibility of an n-mer is defined as the Pu value for this n-mer. Average accessibility of an n-mer is computed as a “geometric” average <Pu> of the Pu values for that n-mer obtained in all seed matches in all human 3′ UTRs. Hence the log10 of the average accessibility (log10 <Pu>) is obtained as an “arithmetic” mean of log10Pu. Means, standard errors, and P-values were obtained by considering the distribution among all bound (or all unbound) sites. The following standard notation is used throughout the article to indicate P-values: (*) P ≤ 0.05; (**) P ≤ 0.01; (***) P ≤ 0.001. P-values >0.05 are not indicated. In all figures, error bars represent standard errors.
Computing discrimination based on thermodynamic features
In order to compare the predictive power of different thermodynamic features, we modified the definition of D (see Equation 1): Instead of classifying the seed matches as accessible based on the Pu values of the nucleation region, we classified seed matches as favorable (F) if they had the relevant energy below a certain optimized cutoff. For each feature, the optimal cutoff was defined as the value that maximized the discrimination D computed as
The optimal cutoffs were (1) for opening energy, 4 kcal/mol; (2) for hybridization energy, −10 kcal/mol; and (3) for interaction energy, −8 kcal/mol. Discrimination was computed for each thermodynamic feature separately.
Protein and mRNA expression fold changes
Protein and mRNA fold changes (log2) were taken from Selbach et al. (2008) and from Baek et al. (2008). The data were merged into a single data set for protein fold changes and a single data set for mRNA fold changes (as done also by Fang and Rajewsky 2011). In total, eight different miRNAs had been transfected into HeLa cells in these studies. However, since miR-1 had been overexpressed in both studies, we only considered the data from Selbach et al. (2008) for this miRNA in order to avoid conflicting expression levels for the same gene. Only miRNA–gene pairs for which both mRNA and protein levels were reported were included in the analysis.
Predictions by other methods
MirSVR
Bulk data for conserved and nonconserved miRNAs were downloaded from http://www.microrna.org/microrna/getDownloads.do; predictions were ranked according to the sum of the scores for individual sites as recommended by the investigators.
PITA
The software was obtained from http://genie.weizmann.ac.il/pubs/mir07/mir07_prediction.html; targets were predicted using default parameters and ranked according to the PITA score.
IntaRNA 1.2.2
The software was downloaded from http://www.bioinf.uni-freiburg.de/Software; targets were predicted using a seed 2–8, w = 80 and L = 40. Predictions were ranked by optimal energy score.
SUPPLEMENTAL MATERIAL
Supplemental material is available for this article.
ACKNOWLEDGMENTS
This research was supported by the EPFL.
Footnotes
Article published online ahead of print. Article and publication date are at http://www.rnajournal.org/cgi/doi/10.1261/rna.033282.112.
REFERENCES
- Ameres SL, Martinez J, Schroeder R 2007. Molecular basis for target RNA recognition and cleavage by human RISC. Cell 130: 101–112 [DOI] [PubMed] [Google Scholar]
- Baek D, Villen J, Shin C, Camargo F, Gygi S, Bartel D 2008. The impact of microRNAs on protein output. Nature 455: 64–71 [DOI] [PMC free article] [PubMed] [Google Scholar]
- Bartel DP 2009. MicroRNAs: Target recognition and regulatory functions. Cell 136: 215–233 [DOI] [PMC free article] [PubMed] [Google Scholar]
- Bernhart SH, Hofacker IL, Stadler PF 2006. Local RNA base pairing probabilities in large sequences. Bioinformatics 22: 614–615 [DOI] [PubMed] [Google Scholar]
- Betel D, Koppal A, Agius P, Sander C, Leslie C 2010. Comprehensive modeling of microRNA targets predicts functional non-conserved and non-canonical sites. Genome Biol 11: R90 doi: 10.1186/gb-2010-11-8-r90 [DOI] [PMC free article] [PubMed] [Google Scholar]
- Brennecke J, Stark A, Russell RB, Cohen SM 2005. Principles of microRNA–target recognition. PLoS Biol 3: e85 doi: 10.1371/journal.pbio.0030085. [DOI] [PMC free article] [PubMed] [Google Scholar]
- Busch A, Richter AS, Backofen R 2008. IntaRNA: Efficient prediction of bacterial sRNA targets incorporating target site accessibility and seed regions. Bioinformatics 24: 2849–2856 [DOI] [PMC free article] [PubMed] [Google Scholar]
- Chi SW, Zang JB, Mele A, Darnell RB 2009. Argonaute HITS-CLIP decodes microRNA-mRNA interaction maps. Nature 460: 479–486 [DOI] [PMC free article] [PubMed] [Google Scholar]
- Chi SW, Hannon GJ, Darnell RB 2012. An alternative mode of microRNA target recognition. Nat Struct Mol Biol 19: 321–327 [DOI] [PMC free article] [PubMed] [Google Scholar]
- Didiano D, Hobert O 2006. Perfect seed pairing is not a generally reliable predictor for miRNA-target interactions. Nat Struct Mol Biol 13: 849–851 [DOI] [PubMed] [Google Scholar]
- Didiano D, Hobert O 2008. Molecular architecture of a miRNA-regulated 3′ UTR. RNA 14: 1297–1317 [DOI] [PMC free article] [PubMed] [Google Scholar]
- Doench JG, Sharp PA 2004. Specificity of microRNA target selection in translational repression. Genes Dev 18: 504–511 [DOI] [PMC free article] [PubMed] [Google Scholar]
- Elkayam E, Kuhn C-D, Tocilj A, Haase AD, Greene EM, Hannon GJ, Joshua-Tor L 2012. The structure of human Argonaute-2 in complex with miR-20a. Cell 150: 100–110 [DOI] [PMC free article] [PubMed] [Google Scholar]
- Fang Z, Rajewsky N 2011. The impact of miRNA target sites in coding sequences and in 3′ UTRs. PLoS ONE 6: e18067 doi: 10.1371/journal.pone.0018067 [DOI] [PMC free article] [PubMed] [Google Scholar]
- Filipowicz W, Bhattacharyya SN, Sonenberg N 2008. Mechanisms of post-transcriptional regulation by microRNAs: Are the answers in sight? Nat Rev Genet 9: 102–114 [DOI] [PubMed] [Google Scholar]
- Gredell JA, Berger AK, Walton SP 2008. Impact of target mRNA structure on siRNA silencing efficiency: A large-scale study. Biotechnol Bioeng 100: 744–755 [DOI] [PMC free article] [PubMed] [Google Scholar]
- Hafner M, Landthaler M, Burger L, Khorshid M, Hausser J, Berninger P, Rothballer A, Ascano M Jr, Jungkamp A-C, Munschauer M, et al. 2010. Transcriptome-wide identification of RNA-binding protein and microRNA target sites by PAR-CLIP. Cell 141: 129–141 [DOI] [PMC free article] [PubMed] [Google Scholar]
- Hammell M 2010. Computational methods to identify miRNA targets. Semin Cell Dev Biol 21: 738–744 [DOI] [PMC free article] [PubMed] [Google Scholar]
- Hargittai MRS, Gorelick RJ, Rouzina I, Musier-Forsyth K 2004. Mechanistic insights into the kinetics of HIV-1 nucleocapsid protein-facilitated tRNA annealing to the primer binding site. J Mol Biol 337: 951–968 [DOI] [PubMed] [Google Scholar]
- Hausser J, Landthaler M, Jaskiewicz L, Gaidatzis D, Zavolan M 2009. Relative contribution of sequence and structure features to the mRNA binding of Argonaute/EIF2C-miRNA complexes and the degradation of miRNA targets. Genome Res 19: 2009–2020 [DOI] [PMC free article] [PubMed] [Google Scholar]
- Kertesz M, Iovino N, Unnerstall U, Gaul U, Segal E 2007. The role of site accessibility in microRNA target recognition. Nat Genet 39: 1278–1284 [DOI] [PubMed] [Google Scholar]
- Kuhn DE, Martin MM, Feldman DS, Terry AV Jr, Nuovo GJ, Elton TS 2008. Experimental validation of miRNA targets. Methods 44: 47–54 [DOI] [PMC free article] [PubMed] [Google Scholar]
- Li X, Quon G, Lipshitz HD, Morris Q 2011. Predicting in vivo binding sites of RNA-binding proteins using mRNA secondary structure. RNA 16: 1096–1107 [DOI] [PMC free article] [PubMed] [Google Scholar]
- Liu H, Yue D, Chen Y, Gao S-J, Huang Y 2010. Improving performance of mammalian microRNA target prediction. BMC Bioinformatics 11: 476 doi: 10.1186/1471-2105-11-476. [DOI] [PMC free article] [PubMed] [Google Scholar]
- Long D, Lee R, Williams P, Chan CY, Ambros V, Ding Y 2007. Potent effect of target structure on microRNA function. Nat Struct Mol Biol 14: 287–294 [DOI] [PubMed] [Google Scholar]
- Marin RM, Vanicek J 2011. Efficient use of accessibility in microRNA target prediction. Nucleic Acids Res 39: 19–29 [DOI] [PMC free article] [PubMed] [Google Scholar]
- Marin RM, Vanicek J 2012. Optimal use of conservation and accessibility filters in microRNA target prediction. PLoS ONE 7: e32208 doi: 10.1371/journal.pone.0032208 [DOI] [PMC free article] [PubMed] [Google Scholar]
- Muckstein U, Tafer H, Hackermuller J, Bernhart SH, Stadler PF, Hofacker IL 2006. Thermodynamics of RNA-RNA binding. Bioinformatics 22: 1177–1182 [DOI] [PubMed] [Google Scholar]
- Murphy E, Vaníček J, Robins H, Shenk T, Levine AJ 2008. Suppression of immediate-early viral gene expression by herpesvirus-coded microRNAs: Implications for latency. Proc Natl Acad Sci 105: 5453–5458 [DOI] [PMC free article] [PubMed] [Google Scholar]
- Nakanishi K, Weinberg DE, Bartel DP, Patel DJ 2012. Structure of yeast Argonaute with guide RNA. Nature 486: 368–374 [DOI] [PMC free article] [PubMed] [Google Scholar]
- Obernosterer G, Tafer H, Martinez J 2008. Target site effects in the RNA interference and microRNA pathways. Biochem Soc Trans 36: 1216–1219 [DOI] [PubMed] [Google Scholar]
- Ørom UA, Lund AH 2010. Experimental identification of microRNA targets. Gene 451: 1–5 [DOI] [PubMed] [Google Scholar]
- Papadopoulos GL, Reczko M, Simossis VA, Sethupathy P, Hatzigeorgiou AG 2009. The database of experimentally supported targets: A functional update of TarBase. Nucleic Acids Res 37: D155–D158 [DOI] [PMC free article] [PubMed] [Google Scholar]
- Rehmsmeier M, Steffen P, Höchsmann M, Giegerich R 2004. Fast and effective prediction of microRNA/target duplexes. RNA 10: 1507–1517 [DOI] [PMC free article] [PubMed] [Google Scholar]
- Robins H, Press WH 2005. Human microRNAs target a functionally distinct population of genes with AT-rich 3′ UTRs. Proc Natl Acad Sci 102: 15557–15562 [DOI] [PMC free article] [PubMed] [Google Scholar]
- Robins H, Li Y, Padgett RW 2005. Incorporating structure to predict microRNA targets. Proc Natl Acad Sci 102: 4006–4009 [DOI] [PMC free article] [PubMed] [Google Scholar]
- Schirle NT, MacRae IJ 2012. The crystal structure of human Argonaute2. Science 336: 1037–1040 [DOI] [PMC free article] [PubMed] [Google Scholar]
- Selbach M, Schwanhausser B, Thierfelder N, Fang Z, Khanin R, Rajewsky N 2008. Widespread changes in protein synthesis induced by microRNAs. Nature 455: 58–63 [DOI] [PubMed] [Google Scholar]
- Tafer H, Ameres SL, Obernosterer G, Gebeshuber CA, Schroeder R, Martinez J, Hofacker IL 2008. The impact of target site accessibility on the design of effective siRNAs. Nat Biotechnol 26: 578–583 [DOI] [PubMed] [Google Scholar]
- Thomson DW, Bracken CP, Goodall GJ 2011. Experimental strategies for microRNA target identification. Nucleic Acids Res 39: 6845–6853 [DOI] [PMC free article] [PubMed] [Google Scholar]
- Wang Y, Sheng G, Juranek S, Tuschl T, Patel DJ 2008. Structure of the guide-strand-containing argonaute silencing complex. Nature 456: 209–213 [DOI] [PMC free article] [PubMed] [Google Scholar]
- Wen J, Parker BJ, Jacobsen A, Krogh A 2011. MicroRNA transfection and AGO-bound CLIP-seq data sets reveal distinct determinants of miRNA action. RNA 17: 820–834 [DOI] [PMC free article] [PubMed] [Google Scholar]
- Xiao F, Zuo Z, Cai G, Kang S, Gao X, Li T 2009. miRecords: An integrated resource for microRNA–target interactions. Nucleic Acids Res 3: D105–D110 [DOI] [PMC free article] [PubMed] [Google Scholar]