Abstract
AGPAT isoforms catalyze the acylation of lysophosphatidic acid (LPA) to form phosphatidic acid (PA). AGPAT2 mutations are associated with defective adipogenesis. Muscle and adipose tissue share common precursor cells. We investigated the role of AGPAT isoforms in skeletal muscle development. We demonstrate that small interference RNA-mediated knockdown of AGPAT1 expression prevents the induction of myogenin, a key transcriptional activator of the myogenic program, and inhibits the expression of myosin heavy chain. This effect is rescued by transfection with AGPAT1 but not AGPAT2. Knockdown of AGPAT2 has no effect. The regulation of myogenesis by AGPAT1 is associated with alterations on actin cytoskeleton. The role of AGPAT1 on actin cytoskeleton is further supported by colocalization of AGPAT1 to areas of active actin polymerization. AGPAT1 overexpression was not associated with an increase in PA levels. Our observations strongly implicate AGPAT1 in the development of skeletal muscle, specifically to terminal differentiation. These findings are linked to the regulation of actin cytoskeleton.
Keywords: Cytoskeleton, Phosphatidic acid, AGPAT2, C2C12, Skeletal muscle, Actin
1. Introduction
The muscle differentiation process involves an initial proliferative stage of myoblasts and subsequent terminal differentiation to form contractile skeletal muscle (Pownall et al., 2002). This process continues throughout life in response to the needs that arrive through growth, exercise and traumatic injury.
During differentiation there is a rearrangement of cell shape from a fibroblast to a spindle like morphology (Yoon et al., 2007; Abramovici et al., 2009; Berendse et al., 2003). These morphological changes facilitate migration towards other differentiated, elongated myoblasts (Siegel et al., 2009; Louis et al., 2008; Wang et al., 2009). Following cell contact, membrane alignment and fusion occurs. Actin cytoskeleton has turned out to be crucial for all these events (Guerin and Kramer, 2009).
Cytoskeleton remodeling is the result of a coordinate polymerization of actin filaments. The role of cytoskeleton in myogenesis is well established; however the factors involved in actin reorganization during skeletal myogenesis are still poorly understood.
AGPAT isoforms catalyze the acylation of lysophosphatidic acid (LPA) at the sn-2 position to form phosphatidic acid (PA). PA has been implicated in cytoskeletal reorganization by inhibiting capping protein activity (Wang et al., 2006). A variety of biological activities have been associated with AGPAT isoforms including regulations of adipocyte differentiation (Gale et al., 2006), cancer progression (Diefenbach et al., 2006) and inflammation (West et al., 1997). AGPAT1 and AGPAT3 are ubiquitously expressed, with AGPAT1 expressed at high levels in skeletal muscle. In human tissues AGPAT2 is highly expressed in liver, pancreas, skeletal muscle and small intestine and is the most highly expressed AGPAT isoform in adipose tissue (Leung, 2001).
In the present study we investigated the role of AGPAT1 and AGPAT2 in myogenesis. We demonstrate that AGPAT1 protein levels are upregulated during myogenesis and appear to be required for skeletal muscle development. We also demonstrate AGPAT1’s role in myogenesis is associated with actin cytoskeleton remodeling. Interestingly, cells overexpressing AGPAT1 have lower levels of phosphatidic acid levels. These studies suggest that the effects on myogenesis are independent of phosphatidic acid accumulation. However a localized increase in PA levels cannot be ruled out.
2. Material and Methods
2.1. Cell culture
C2C12 cells were grown in DMEM supplemented with 100 U/ml penicillin, 100 µg/ml streptomycin and 10% newborn calf serum. For differentiation, once cells reached 70% confluence they were shifted to serum-free medium supplemented with 2% horse serum. Cells were cultured for various times as stated. C2C12 cells were transfected with 25 nM AGPAT1 or AGPAT2 siRNA SMARTpools (Dharmacon, Lafayette, Colorado) or siCONTROL non-targeting siRNA using Dharmafect 3 transfection reagent. For cells undergoing differentiation transfection was done on day-2 of differentiation. Efficiency of transfection was determined by relative mRNA levels after 48 h. For overexpression experiments cells were infected with retrovirus expressing either GFP or GFP-AGPAT1 and selected with G418 for a week. Then indicated cells were transfected with V5 tagged AGPAT1 or empty vector.
2.2. Reverse transcriptase-polymerase chain reaction analysis
Total cellular RNA was isolated with the RNeasy kit (Qiagen, Valencia, CA). Complementary DNA was synthesized using random hexamers and Moloney murine leukemia virus reverse transcriptase (Promega Biosciences) from 1 µg of RNA. Primer sequences were determined through established GenBank sequences (Table 1). Expression of the specific genes was assessed by quantitative reverse transcriptase-polymerase chain reaction (qRT-PCR). Two microliters of cDNA was used as template for RT-PCR, using the Quantitect SybrGreen kit (Qiagen) and 20 pM (each) primers in a final volume of 25 µl. Each measurement was performed in triplicate, and the threshold cycle number at which the amount of amplified target became detectable by fluorescence was determined. Serial dilutions of cDNA were run to ensure linearity and reliability of the assay. Analysis by agarose gel electrophoresis was performed to confirm product length and purity of the amplicon. Real-time qRT-PCR of 18S rRNA was also performed for every sample as an internal control. Relative levels of expression were determined by calculating differences in cycle threshold (Ct) normalized to 18s mRNA expression in all cases.
Table 1.
Primer pairs used for qRT-PCR.
| Gene | mRNA accession no. | Primers |
|---|---|---|
| mAGPAT1 | NM_018862 | 5′-ATGCGCTCCCCTCAGATGGTGTC-3′ |
| 5′-TCACGGTGGTGAGAAAGGTTGTGC-3′ | ||
| mAGPAT2 | NM_026212 | 5′-TCATCAACCGCCAGCAAGCCAGAA-3′ |
| 5′-AGGTCCCCATTGTCGTTGCGTGTA-3′ | ||
| mMyogenin | NM_031189 | 5′-AGCGGCTGCCTAAAGTGGAGAT-3′ |
| 5′-AGGAGGCGCTGTGGGAGTTG-3′ | ||
| mMHC | NM_080728 | 5′-AAGATCGTGTCCCGAGAGGG -3′ |
| 5′-TTGTACAGCACAGCCGGCTC-3′ | ||
| 18s | NR_003286 | 5′-ACTCAACACGGGAAACCTCACC-3′ |
| 5′-CCAGACAAATCGCTCCACCAAC-3′ |
2.3. Immunostaining
Cells were fixed on 4% paraformaldehyde for 1 h at room temperature. Cells were then washed with PBS 3 times for 5–10 mins. Samples were pretreated with 0.3% Triton X-100 in PBS for 10 mins, permeabilized as previously described and incubated in rhodamine–phalloidin diluted in PBS 1:100 at room temperature (Molecular Probes), to visualize F-actin fibers. For AGPAT1 immunostaining cells were fixed as described above and samples were blocked with 10% BlokHen II (Aveslab) for 30 mins. Cells were incubated for 2 h at room temperature with AGPAT1 antibody at 1:100 dilutions. Fluorescein (FITC)-labeled anti-Chicken IgY was used as a secondary antibody (Aveslab).
2.4. Western blot
Cells were cultured on 6-well plates and harvested as previously described (Subauste and Burant, 2007), briefly lysed with PBS containing 50 mM HEPES (pH 7.5), 1% (v/v) TritonX100, 150 mM sodium chloride, 1 mM sodium orthovanadate, 10 mM sodium fluoride, 10 mM sodium pyrophosphate, 1 mM phenylmethylsulfonyl fluoride, 1 ug/ml leupeptin and 1 ug/ml aprotinin. Insoluble material was removed by centrifugation prior to SDSpolyacrylamide gel electrophoresis (PAGE).
2.5. Live cell imaging of myoblasts
For live imaging, C2C12 myoblasts were plated at low density. Cells were imaged on a Delta-Vision live cell imaging system using non-confocal widefield fluorescence coupled with on-board deconvolution software using Imaris plug-in modules from Bitplane Scientific.
2.6. Phosphatidic acid measurement
Cells were washed twice with PBS and scraped using 1 ml of PBS. Cells were pelleted and resuspended in 1.2 ml of water by sonication. Protein assay was performed on the cell homogenates. Lipids were extracted by adding 3 ml of methanol and 1.5 ml of chloroform. Samples were vortexed. Chloroform 1.5 ml and NaCl 0.9% 1.5 ml were then added. Samples were vortexed and centrifuged. The lower layer was transferred to a separate tube and dried under nitrogen. Samples were resuspended in 100 ul of chloroform and run in a TLC plate together with phosphatidic acid standard. The solvent used was chloroform:methanol:acetic acid:water (100:40:12:4). Bands corresponding to phosphatidic acid were identified by comparison with the lipid standard and scraped. Phosphatidic acid was then measured by the ashing procedure for total phosphate as previously described (Ames 1966). Briefly, 30 ul of magnesium nitrate solution was added to the sample and taken to dryness and ashed by shaking the tube over a flame until the brown fumes disappear. Then 300 ul of 0.5 N HCl was added. Samples were boiled for 15 min. Once the samples cooled a solution mix of ascorbic acid with ammonium molybdate was added and incubated for 45 min at 37 °C. Samples were read at 820 mu absorbance.
3. Results
3.1. AGPAT1 but not AGPAT2 is required for myogenesis
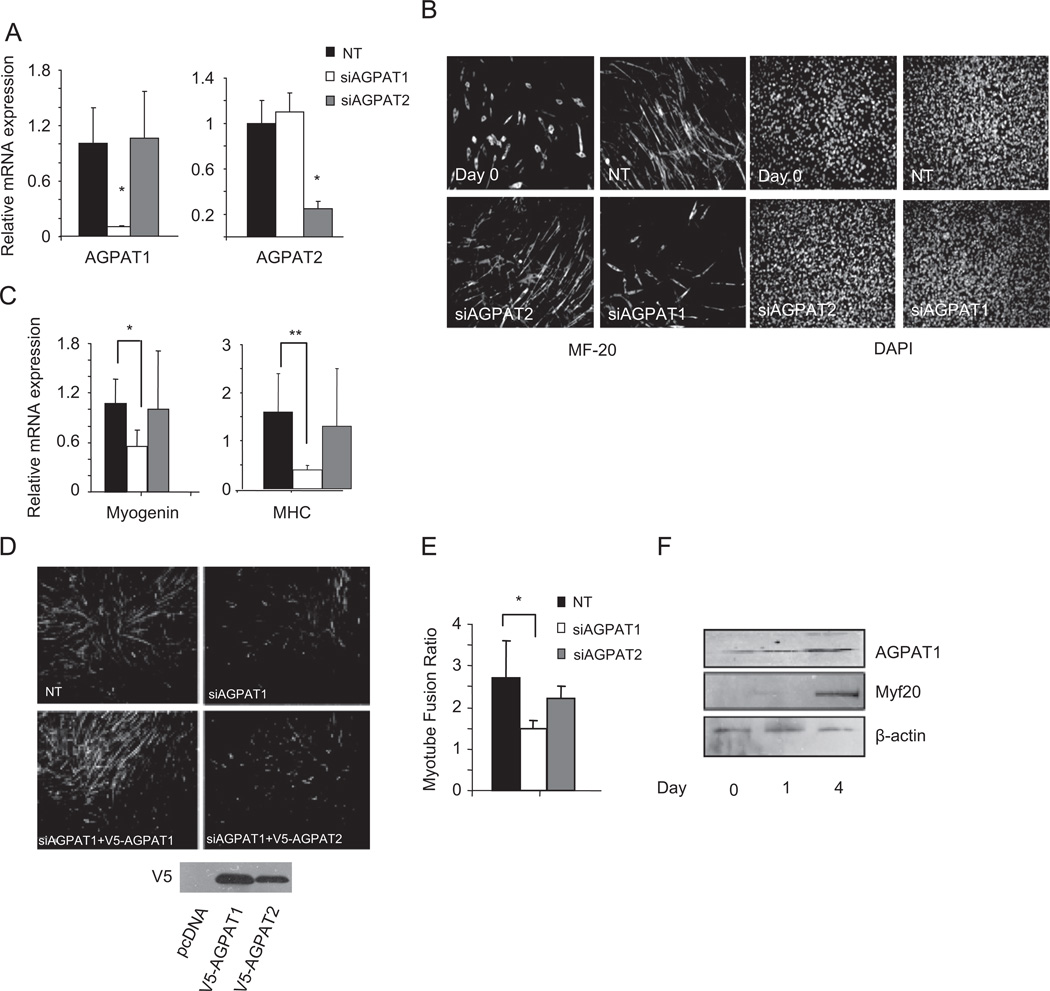
Mesenchymal progenitor cells can differentiate along the adipogenic and myogenic pathways (Sordella et al., 2003). As has been demonstrated by others (Gale et al., 2006), we find that AGPAT2 is critical for adipogenesis while AGPAT1 appears dispensible (Subauste et al., unpublished observation). To determine if AGPAT1 or AGPAT2 expression is necessary for differentiation, we used siRNA to manipulate levels of these proteins prior to initiation of differentiation in C2C12 cells, a well characterized model of myogenesis. We were able to obtain close to 90% knockdown for AGPAT1 and 80% for AGPAT2 mRNAs 2 days after transfection (Fig. 1A). After treating cells with siRNA, myogenesis was induced with 2% horse serum and two days later, cells were immunostained with MF-20 to assess myotube formation. Cells treated with the non-targeting siRNA and with AGPAT2 siRNA were capable of differentiating into myotubes (Fig. 1B), as demonstrated by MF-20 immunostaining. Conversely, AGPAT1 siRNA treatment inhibited the formation of myotubes as shown by decreased immunostaining with MF-20.
Fig. 1.
AGPAT1 downregulation inhibits myogenesis in C2C12 cells. (A) changes in AGPAT mRNA levels in C2C12 cells 48 h following treatment with non-targeting (NT), AGPAT1 or AGPAT2 siRNA. Expression levels were normalized to 18s mRNA levels. (B) MF-20 immunostaining of C2C12 cells at day 0 and after 4 days of differentiation in 2% horse serum following treatment with NT, AGPAT1 or AGPAT2 siRNA. Right panels show DAPI staining of nuclei. Representative images of three independent experiments are shown. Magnification 20×. (C) Levels of myogenesis related genes after 48 h of differentiation following treatment with NT or AGPAT siRNA. Values are the mean of three independent determinations ± S.D.*p < 0.05, **p < 0.01 (D and E) MF-20 immunostaining. Magnification 20×. (D) or fusion index (E) of C2C12 cells after NT or AGPAT1 siRNA treatment followed by rescue with empty vector, V5-AGPAT1 or V5-AGPAT2. (F) AGPAT1 or MF-20 protein levels during myogenesis. β-actin was used as a loading control.
To further demonstrate the effect on myogenesis, we assessed mRNA levels of myogenic markers. qRT-PCR analysis showed an approximate 50% downregulation of myogenin and 70% downregulation of myosin heavy chain (MHC) mRNA expression following disruption of AGPAT1 expression (Fig. 1C), suggesting that AGPAT1 is important for the regulation of terminal differentiation events. As before, knockdown of AGPAT2 had no effect on myogenic differentiation.
To demonstrate that the inhibition of myogenesis was a direct effect of AGPAT1 downregulation and not due to a non-target effect of the siRNA pool, we treated cells with AGPAT1 siRNA and then transfected cells with either pcDNA (empty vector), V5 tagged AGPAT1 or V5 tagged AGPAT2. Only the cells transfected with AGPAT1 rescued myogenic differentiation, as shown by MF-20 immunostaining (Fig. 1D).
We also quantified the fusion index, defined as the ratio of nuclei number in myocytes with two or more nuclei versus the total number of nuclei. Knockdown of AGPAT1 but not AGPAT2 reduced the fusion index by approximately 30% (Fig. 1E).
We examined AGPAT1 expression during myocyte differentiation of C2C12 myoblasts. Consistent with its role in myogenesis the time course showed an upregulation of AGPAT1 protein levels in parallel with an increase of MF-20 protein levels after 4 days of differentiation (Fig. 1F).
From these experiments, we concluded that AGPAT1, unlike AGPAT2, plays an important role in the terminal differentiation of myotubes in C2C12 cells.
3.2. Subcellular localization of AGPAT1
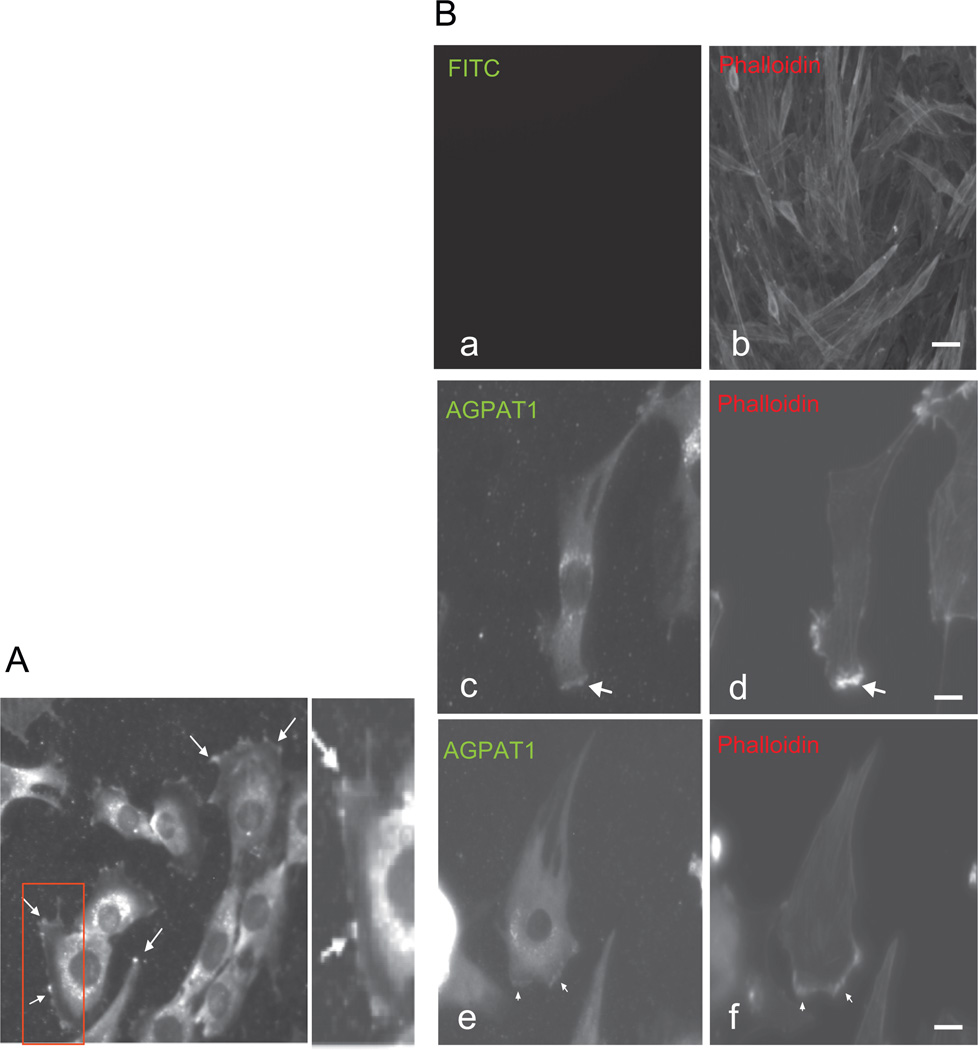
To begin investigating the mechanism by which AGPAT1 regulates myogenesis, we determined the subcellular localization of AGPAT1 in C2C12 myoblasts. Consistent with previous reports, AGPAT1 was distributed perinuclearly in the cytoplasm (Aguado and Campbell, 1998; Fig. 2A). We also observed that a fraction of AGPAT1 was localized to the plasma membrane, particularly to areas of cell ruffling (Fig. 2A, arrows). The formation of membrane ruffles, and in general any membrane protrusions, is an actin dependent process (Borm et al., 2005). Phalloidin–rhodamine conjugate binds specifically at the interface between F-actin subunits and is useful to identify polymerized actin. We found that AGPAT1 is localized to areas of high phalloidin staining at the leading edge, an area of active actin polymerization (Fig. 2B, arrows).
Fig. 2.
Subcellular localization of AGPAT1 in myoblast. (A) Immunostaining of endogenous AGPAT1 in C2C12 showing AGPAT1 accumulation at the sites of membrane extensions (arrows); magnification 60×. (B) Immunostaining for AGPAT1 and phalloidin in C2C12 showing the accumulation of AGPAT1 and actin filaments at the leading edge (arrows). (a,b) Immunostaining only for phalloidin. Bar: 50 uM. (c–f) Immunostaining for phalloidin and AGPAT1. Bar: 10 uM.
These data localized AGPAT1 to cytoskeletal components, particularly to areas of actin polymerization in myoblasts.
3.3. AGPAT1 modulates actin cytoskeleton
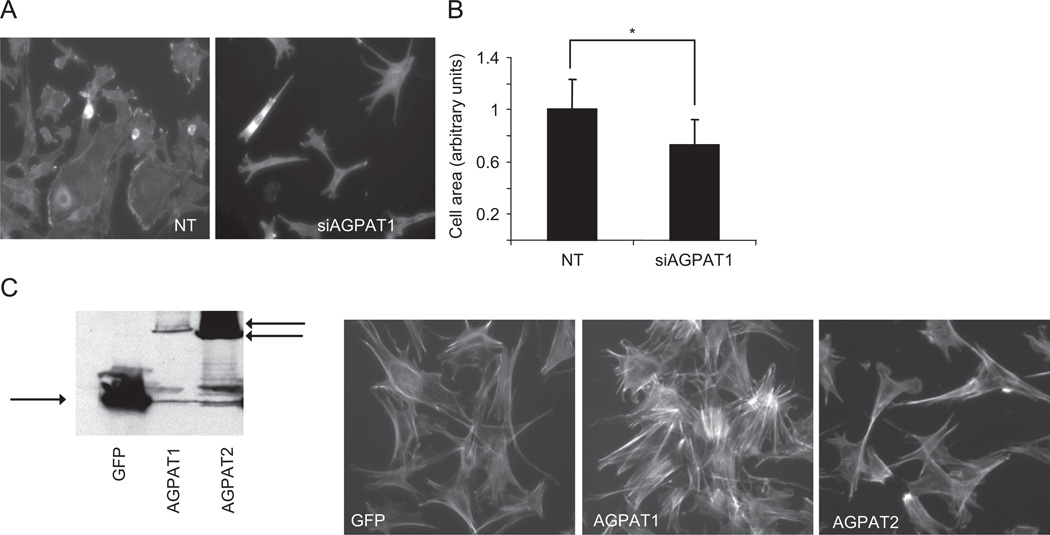
Extensive cytoskeletal reorganization occurs during muscle differentiation (Komati et al., 2005). In light of the data suggesting an involvement of AGPAT1 in terminal differentiation and colocalization with cytoskeletal components, we determined the effect of AGPAT1 disruption on cytoskeleton dynamics. Using phalloidin staining, we demonstrated that control cells had a circular morphology with evidence of intense phalloidin staining in areas corresponding to the leading edge (Fig. 3A). Knockdown of AGPAT1 significantly altered the morphology of myoblasts towards elongation or a star shape, consistent with cell retraction. Knockdown of AGPAT1 also resulted in the lack of well defined leading edges (Fig. 3B). Quantifying cell area under basal conditions shows that AGPAT1 knockdown decreased cell spreading by approximately 30% when compared to controls.
Fig. 3.
AGPAT1 and actin cytoskeleton. (A) C2C12 cells after treatment with non-targeting (NT) and AGPAT1 siRNA. Cells were stained with rhodamine–phalloidin after 36 h of siRNA treatment. Magnification 40×. (B) Quantification of cell area with NT and AGPAT1 siRNA under basal conditions. Values are the mean of three independent determinations ± S.D. *p < 0.001. (C) COS2 cells expressing GFP, GFP-AGPAT1 or GFP-AGPAT2 as shown by immunoblotting with a GFP antibody. Right panel shows rhodamine phalloidin immunostaining of COS2 cells under basal conditions. Magnification 40×.
We also determined the effect of AGPAT1 overexpression using COS2 cells expressing GFP tagged AGPAT1 or AGPAT2 confirmed by western blot (Fig. 3C). An increase in the intensity of phalloidin staining as well as the formation of stress fibers was seen with AGPAT1 overexpression, however AGPAT2 was not able to induce actin polymerization (Fig. 3C). These findings are consistent with a role for AGPAT1 in cytoskeleton dynamics.
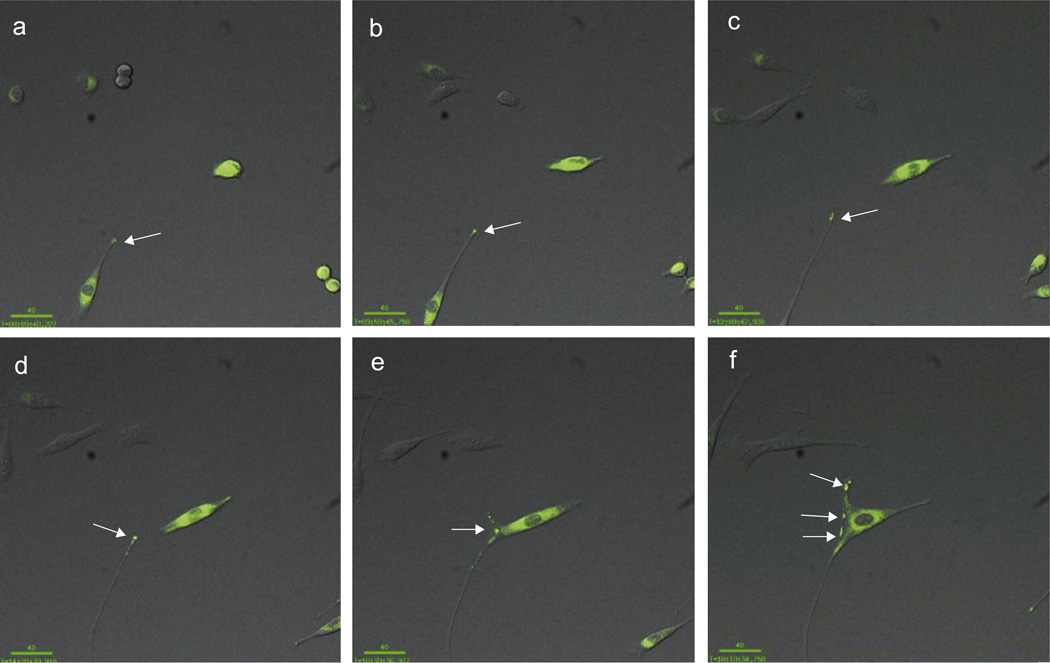
To further determine the role of AGPAT1 on morphological changes in myoblast, we used live time-lapse imaging of C2C12 myoblasts, either expressing GFP or AGPAT1-GFP. C2C12 cells were plated at relatively low densities to facilitate the visualization of AGPAT1 and images were taken every 10 min for 16 h. We observed local accumulation of AGPAT1 at the distal tips of long filopodia close to the neighboring myoblast. Areas of contact were associated with discrete accumulation of AGPAT1 (Fig. 4, MPG A, supplemental data). While we cannot entirely rule out non-specific trapping of the fusion protein, we see no accumulation of GFP protein in the filopodia when expressed alone (MPG B, supplemental data). Both, filopodia and areas of contact and subsequent fusion are known to require active actin cytoskeleton remodeling (Yoon et al., 2007).
Fig. 4.
Live time-lapse imaging reveals that AGPAT1 accumulates at the distal tips of filopodia in C2C12 myoblasts. C2C12 cells expressing GFP tagged AGPAT1 were imaged every 10 min for 16 h. AGPAT1 concentrated at the distal tips of filopodia (arrow). There was also accumulation at areas of contact with other myoblast (e,f). Bar: 40 uM.
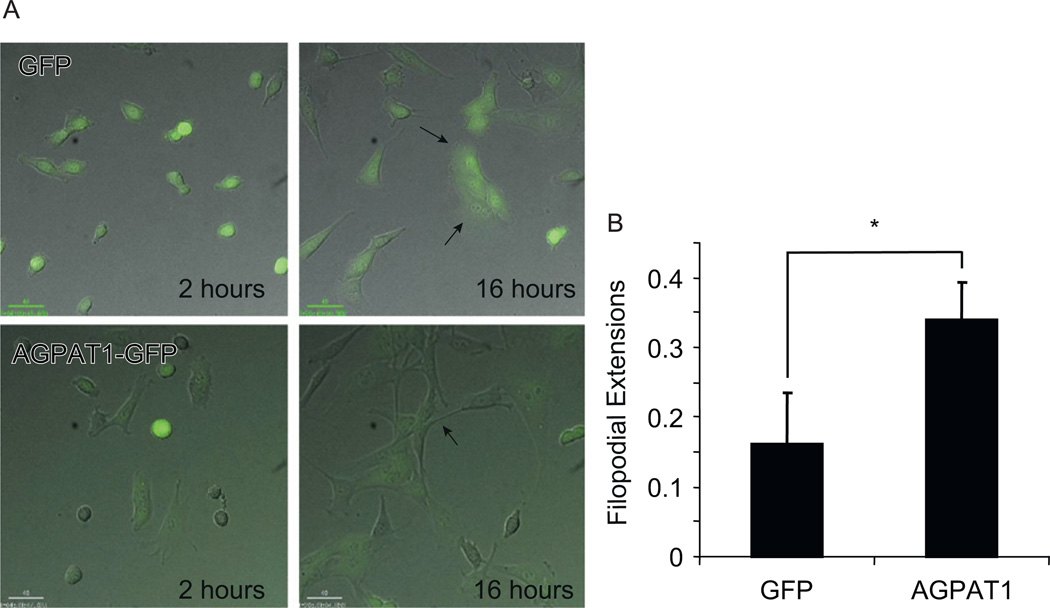
We also evaluated the extent of the morphological changes in C2C12 overexpressing AGPAT1. The morphology was determined at various times after cells were replated with the help of live time-lapse imaging. Myoblasts overexpressing AGPAT1 showed enhanced cell spreading and early formation of filopodial extensions (Fig. 5A, control: MPG C, AGPAT1: MPG D supplemental data). During myogenesis, myoblasts remodel from a fibroblast like morphology to an elongated, spindle like morphology, prior to fusing into myotubes. After 16 h cells overexpressing AGPAT1 even in the absence of differentiation media had a more elongated morphology with an increase in the number of filopodia (Fig. 5B). Control myoblasts exhibited the typical fibroblast like morphology.
Fig. 5.
The overexpression of AGPAT1 affects myoblast morphology. C2C12 expressing GFP or AGPAT1-GFP were plated and incubated at 37 °C for the indicated times. Frames demonstrating the typical morphology of GFP and GFP-AGPAT1 after replating are shown. Arrows indicate filopodial structures. (B) C2C12 cells exhibiting filopodia. The ratio was calculated as the number of filopodia present in a frame divided by the number of cells (n = 124 GFP, n = 100 AGPAT1, *p < 0.01). Bar: 40 uM.
In summary AGPAT1 is localized to areas of rapid actin cytoskeleton polymerization, and overexpression and knockdown experiments demonstrate concordant morphological changes. These data taken collectively are concordant with AGPAT1 having a role on actin cytoskeleton remodeling.
3.4. AGPAT1 and PA levels
Previously it has been suggested that phosphatidic acid, the product of AGPAT1, is capable of regulating actin filament formation (Wang et al., 2006). To determine if changes in PA were associated with cytoskeletal changes we measured PA in cells overexpressing AGPAT1 under basal conditions. Paradoxically we found a trend towards a decrease in PA levels with AGPAT1 overexpression when compared to controls (Fig. 6). Similar results were described for the AGPAT2 isoform (Gale et al., 2006). This would suggest that the effects on actin cytoskeleton are independent of significant increases in PA levels. These studies cannot rule out the possibility of a localized increase in PA levels not detected by whole cell extractions.
Fig. 6.
AGPAT1 and phosphatidic acid levels. Phosphatidic acid levels were determined from lipid extracts from control C2C12 cells or cells overexpressing AGPAT1.
4. Discussion
Patients with a form of congenital generalized lipodystrophy were found to have a mutation in the AGPAT2 isoform, which leads to a decrease in enzyme activity (Agarwal et al., 2002). While initially it was hypothesized that lipodystrophy was secondary to a faulty accumulation of triglycerides, it later became evident that AGPAT2 indeed had an active role in adipose tissue development (Gale et al., 2006). In these subjects muscle development is preserved (Simha and Garg, 2003). Here we show that AGPAT1, but not AGPAT2, is important for myocyte development. The increased expression of AGPAT1 during muscle differentiation is in line with the high levels of AGPAT1 in adult mouse muscle and its role in myogenesis (Leung, 2001). Definitive evidence for the requirement of AGPAT1 in myogenesis came from the observation that knockdown of AGPAT1, unlike AGPAT2, drastically diminished the myogenic capacity of C2C12 cells. This phenotype was rescued by expression of AGPAT1 but not AGPAT2.
Promoter analysis of AGPAT2 shows consensus binding sites for C/EBPβ and PPARγ, which are found in most genes upregulated during adipogenesis (Lefterova et al., 2008). In contrast, AGPAT1 shows binding sites for NOR1 and PPARα, transcription factors enriched in skeletal muscle, which respond to stimuli that is associated with muscle development and hypertrophy (Russell et al., 2003; Mahoney et al., 2005). These results suggest that the AGPAT isoforms are members of gene families that are activated in specific programs during mesenchymal cell differentiation.
Myogenesis is a process that involves a massive rearrangement of actin cytoskeleton. Proteins that regulate actin assembly can indeed activate transcription factors during myogenesis (Formigli et al., 2007). We initially determined that AGPAT1 is localized to areas of rapid actin cytoskeleton remodeling (i.e. leading edge, filopodia) in myoblasts. Also, AGPAT1 is co-localized to areas of actin polymerization as demonstrated by rhodamine–phalloidin co-staining. The role on cytoskeleton was further supported by morphological changes in two different cell lines: C2C12 myoblasts and COS2 cells. The latter in particular demonstrated a marked increase in polymerized actin as demonstrated by phalloidin–rhodamine staining. We determined that AGPAT1 regulates actin cytoskeleton through knockdown and overexpression experiments. This is characterized by changes in cell shape, stress fiber formation, perturbations in leading edge formation and modulation of cell spreading. Thus, the remodeling of the actin cytoskeleton appears to be a component in the regulation of myogenesis by AGPAT1.
We found that AGPAT1 overexpression was not associated with an increase in PA levels but with a trend towards a decrease in PA. Similar results were described for the AGPAT2 isoform (Gale et al., 2006). Although PA has been implicated in actin polymerization by inhibiting capping protein activity, our results would suggest that the effects on actin cytoskeleton are independent of phosphatidic acid levels. However, we cannot rule out the rapid consumption of PA during actin polymerization as well as a highly localized increase in PA not detected by whole cell analysis. The molecular mechanism underlying the regulation of actin polymerization by AGPAT1 remains unknown and will be the focus of future studies.
The AGPAT2 isoform has been implicated in the development of adipose tissue. Here we present results implicating AGPAT1 in skeletal muscle development, specifically to terminal differentiation. The etiology underlying the differences in the physiologic roles of the two AGPAT isoforms is still unclear. These two enzymes, while catalyzing the same reaction, have only approximately 40% homology. Differences in protein interaction, substrate specificity or subcellular localization may account for the different physiologic effects. Our observations link the regulation of myogenesis to the modulation of actin cytoskeleton stabilization.
Supplementary Material
Acknowledgements
We thank Sachi Gianchandani, Chrysta Lienczewski and Anthonia Omorodion for their outstanding technical assistance. This work was supported by a grant and core laboratories from the University of Michigan Metabolomics and Obesity Center.
Footnotes
Appendix A. Supplementary material
Supplementary data associated with this article can be found in the online version at doi:10.1016/j.jdiff.2010.05.006.
References
- Abramovici H, et al. Diacylglycerol kinase zeta regulates actin cytoskeleton reorganization through dissociation of Rac1 from RhoGDI. Mol. Biol. Cell. 2009;20(7):2049–2059. doi: 10.1091/mbc.E07-12-1248. [DOI] [PMC free article] [PubMed] [Google Scholar]
- Agarwal AK, et al. AGPAT2 is mutated in congenital generalized lipodystrophy linked to chromosome 9q34. Nat. Genet. 2002;31(1):21–23. doi: 10.1038/ng880. [DOI] [PubMed] [Google Scholar]
- Aguado B, Campbell RD. Characterization of a human lysophosphatidic acid acyltransferase that is encoded by a gene located in the class III region of the human major histocompatibility complex. J. Biol. Chem. 1998;273(7):4096–4105. doi: 10.1074/jbc.273.7.4096. [DOI] [PubMed] [Google Scholar]
- Ames B. Assay of inorganic phosphate, total phosphate and phosphatases. Method. Enzymol. 1966;8:115–118. [Google Scholar]
- Berendse M, Grounds MD, Lloyd CM. Myoblast structure affects subsequent skeletal myotube morphology and sarcomere assembly. Exp. Cell Res. 2003;291(2):435–450. doi: 10.1016/j.yexcr.2003.07.004. [DOI] [PubMed] [Google Scholar]
- Borm B, et al. Membrane ruffles in cell migration: indicators of inefficient lamellipodia adhesion and compartments of actin filament reorganization. Exp. Cell Res. 2005;302(1):83–95. doi: 10.1016/j.yexcr.2004.08.034. [DOI] [PubMed] [Google Scholar]
- Diefenbach CS, et al. Lysophosphatidic acid acyltransferase-beta (LPAAT-beta) is highly expressed in advanced ovarian cancer and is associated with aggressive histology and poor survival. Cancer. 2006;107(7):1511–1519. doi: 10.1002/cncr.22184. [DOI] [PubMed] [Google Scholar]
- Formigli L, et al. Cytoskeleton/stretch-activated ion channel interaction regulates myogenic differentiation of skeletal myoblasts. J. Cell Physiol. 2007;211(2):296–306. doi: 10.1002/jcp.20936. [DOI] [PubMed] [Google Scholar]
- Gale SE, et al. A regulatory role for 1-acylglycerol-3-phosphate-O-acyltransferase 2 in adipocyte differentiation. J. Biol. Chem. 2006;281(16):11082–11089. doi: 10.1074/jbc.M509612200. [DOI] [PubMed] [Google Scholar]
- Guerin CM, Kramer SG. Cytoskeletal remodeling during myotube assembly and guidance: coordinating the actin and microtubule networks. Commun. Integr. Biol. 2009;2(5):452–457. doi: 10.4161/cib.2.5.9158. [DOI] [PMC free article] [PubMed] [Google Scholar]
- Komati H, et al. Phospholipase D is involved in myogenic differentiation through remodeling of actin cytoskeleton. Mol. Biol. Cell. 2005;16(3):1232–1244. doi: 10.1091/mbc.E04-06-0459. [DOI] [PMC free article] [PubMed] [Google Scholar]
- Lefterova MI, et al. PPARgamma and C/EBP factors orchestrate adipocyte biology via adjacent binding on a genome-wide scale. Genes Dev. 2008;22(21):2941–2952. doi: 10.1101/gad.1709008. [DOI] [PMC free article] [PubMed] [Google Scholar]
- Leung DW. The structure and functions of human lysophosphatidic acid acyltransferases. Front. Biosci. 2001;6:D944–D953. doi: 10.2741/leung. [DOI] [PubMed] [Google Scholar]
- Louis M, et al. TRPC1 regulates skeletal myoblast migration and differentiation. J. Cell Sci. 2008;121(Pt 23):3951–3959. doi: 10.1242/jcs.037218. [DOI] [PubMed] [Google Scholar]
- Mahoney DJ, et al. Analysis of global mRNA expression in human skeletal muscle during recovery from endurance exercise. FASEB J. 2005;19(11):1498–1500. doi: 10.1096/fj.04-3149fje. [DOI] [PubMed] [Google Scholar]
- Pownall ME, Gustafsson MK, Emerson CP., Jr Myogenic regulatory factors and the specification of muscle progenitors in vertebrate embryos. Annu. Rev. Cell Dev. Biol. 2002;18:747–783. doi: 10.1146/annurev.cellbio.18.012502.105758. [DOI] [PubMed] [Google Scholar]
- Russell AP, et al. Endurance training in humans leads to fiber type-specific increases in levels of peroxisome proliferator-activated receptor-gamma coactivator-1 and peroxisome proliferator-activated receptor-alpha in skeletal muscle. Diabetes. 2003;52(12):2874–2881. doi: 10.2337/diabetes.52.12.2874. [DOI] [PubMed] [Google Scholar]
- Siegel AL, et al. 3D timelapse analysis of muscle satellite cell motility. Stem Cells. 2009;27(10):2527–2538. doi: 10.1002/stem.178. [DOI] [PMC free article] [PubMed] [Google Scholar]
- Simha V, Garg A. Phenotypic heterogeneity in body fat distribution in patients with congenital generalized lipodystrophy caused by mutations in the AGPAT2 or seipin genes. J. Clin. Endocrinol. Metab. 2003;88(11):5433–5437. doi: 10.1210/jc.2003-030835. [DOI] [PubMed] [Google Scholar]
- Sordella R, et al. Modulation of Rho GTPase signaling regulates a switch between adipogenesis and myogenesis. Cell. 2003;113(2):147–158. doi: 10.1016/s0092-8674(03)00271-x. [DOI] [PubMed] [Google Scholar]
- Subauste AR, Burant CF. Role of FoxO1 in FFA-induced oxidative stress in adipocytes. Am. J. Physiol. Endocrinol. Metab. 2007;293(1):E159–E164. doi: 10.1152/ajpendo.00629.2006. [DOI] [PubMed] [Google Scholar]
- Wang W, et al. Matrix metalloproteinase-1 promotes muscle cell migration and differentiation. Am. J. Pathol. 2009;174(2):541–549. doi: 10.2353/ajpath.2009.080509. [DOI] [PMC free article] [PubMed] [Google Scholar]
- Wang X, et al. Signaling functions of phosphatidic acid. Prog. Lipid Res. 2006;45(3):250–278. doi: 10.1016/j.plipres.2006.01.005. [DOI] [PubMed] [Google Scholar]
- West J, et al. Cloning and expression of two human lysophosphatidic acid acyltransferase cDNAs that enhance cytokine-induced signaling responses in cells. DNA Cell Biol. 1997;16(6):691–701. doi: 10.1089/dna.1997.16.691. [DOI] [PubMed] [Google Scholar]
- Yoon S, et al. C6ORF32 is upregulated during muscle cell differentiation and induces the formation of cellular filopodia. Dev. Biol. 2007;301(1):70–81. doi: 10.1016/j.ydbio.2006.11.002. [DOI] [PMC free article] [PubMed] [Google Scholar]
Associated Data
This section collects any data citations, data availability statements, or supplementary materials included in this article.


