Abstract
The internal charge transfer (ICT) type fluoroionophore arylvinyl-bipy (bipy = 2,2′-bipyridyl) is covalently tethered to the spirolactam form of rhodamine to afford fluorescent heteroditopic ligand 4. Compound 4 can be excited in the visible region, the emission of which undergoes sequential bathochromic shifts over an increasing concentration gradient of Zn(ClO4)2 in acetonitrile. Coordination of Zn2+ stabilizes the ICT excited state of the arylvinyl-bipy component of 4, leading to the first emission color shift from blue to green. At sufficiently high concentrations of Zn(ClO4)2, the non-fluorescent spirolactam component of 4 is transformed to the fluorescent rhodamine, which turns the emission color from green to orange via intramolecular fluorescence resonance energy transfer (FRET) from the Zn2+-bound arylvinyl-bipy fluorophore to rhodamine. While this work offers a new design of ratiometric chemosensors, in which sequential analyte-induced emission band shifts result in the sampling of multiple colors at different concentration ranges (i.e. from blue to green to orange as [Zn2+] increases in the current case), it also reveals the nuances of rhodamine spirolactam chemistry that have not been sufficiently addressed in the published literature. These issues include the ability of rhodamine spirolactam as a fluorescence quencher via electron transfer, and the slow kinetics of spirolactam ring-opening effected by Zn2+ coordination.
Keywords: Zinc, Fluorescent heteroditopic ligand, Rhodamine spirolactam, Fluorescence resonance energy transfer, Photoinduced electron transfer, Internal charge transfer
Introduction
Developing selective and sensitive detection tools for Zn2+ in biological specimens has attracted much interest during the past decade.1–11 The motivation for this line of research is the need to characterize the roles of Zn2+ in disease-related processes.12–14 Our group has focused on developing indicators for Zn2+ with a concentration coverage appropriate for the uniquely broad range of “free” Zn2+ ions15 in mammalian cellular systems.16,17 Most known indicators for Zn2+ report concentration variations within three orders of magnitude under physiological conditions. This rather limited range originates from the species distribution makeup of a monotopic (one binding site) indicator, and it is inadequate to cover the entire physiological range of Zn2+ observed in mammalian cells.
Our strategy to achieve broad concentration coverage entails the development of a fluorescent heteroditopic ligand, which contains two Zn2+ binding sites of different affinities.18–20 As shown in Figure 1, a fluorescent heteroditopic ligand binds two Zn2+ ions in a sequential manner over a concentration gradient. If the three coordination states of the ligand (free, mono-, and di-coordinated) have distinct fluorescence spectra, the emission intensity and/or wavelength of the ligand upon single-wavelength excitation is a function of [Zn2+] over the collective response range of two coordination sites.16 In this paper, a new design of fluorescent heteroditopic ligands is reported, which shows a continuous emission color change from blue to orange over a concentration gradient of Zn2+ in the organic solvent acetonitrile. A limitation of the selected rhodamine spirolactam ring-opening chemistry in the new design is also described, which at this point prevents the reported prototype structure from being applied as an indicator in aqueous-based systems.
Figure 1.
Cartoons depicting tricolor emission upon single-wavelength excitation resulting from sequential binding of two Zn2+ ions to a fluorescent heteroditopic ligand.
Results and Discussion
Design
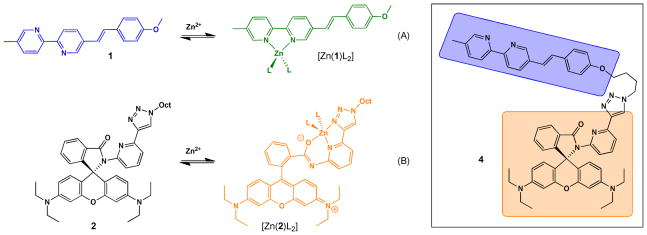
To design a tricolor fluorescent heteroditopic ligand, we employ a bichromophoric system where the emissions of both fluorophores are susceptible to the presence of Zn2+, but in different concentration regimes. To achieve the sequential emission band shifts over an increasing [Zn2+] gradient depicted in Figure 1 under excitation in the visible region, the arylvinyl-bipy-containing compound 121,22 (Scheme 1A) is tethered with rhodamine spirolactam 2 (Scheme 1B) to afford compound 4 (Scheme 1). The emission color of compound 1, which undergoes excited state internal charge transfer (ICT),23,24 changes from blue to green upon Zn2+ coordination (Scheme 1A).21 The non-fluorescent 2 was designed by the addition of a 1,2,3-triazolyl ring on the spirolactam ligand developed by Shiraishi et al.25 The triazolyl ligand acts as both an additional metal coordination ligand for enhancing the coordination affinity, and a linker for tethering other functional groups (as in compound 4).26–29 The spirolactam precursor of rhodamine has been incorporated in fluorescent sensor structures targeting various substances,30–33 including Zn2+.25,34–38 The analyte-induced spirolactam ring-opening reaction affords rhodamine of a bright orange emission.
Scheme 1.
Zn2+-dependent fluorescence changes of 1 and 2, and the structure of ditopic ligand 4. (A) From blue to green; (B) from non-fluorescent to orange. Oct = n-octyl. L: counter ion or solvent.
Compound 1 is susceptible to Zn2+-coordination at a lower concentration than that applied to compound 2. Therefore, in compound 4, we expect that the increase of [Zn2+] will first lead to a blue to green emission color change as a result of binding at the bipy position. As [Zn2+] grows further, the spirolactam ring opens to afford the orange-emitting rhodamine. The emission spectrum of Zn2+-bound arylvinyl-bipy component in 4 overlaps well with the absorption spectrum of rhodamine (Figure 2), which shall lead to an efficient intramolecular FRET from Zn2+-bound arylvinyl-bipy to rhodamine, and consequently a color change from green to orange.20,38,39 Both ICT and FRET processes result in emission band shifts. Therefore, this design shall afford a ratiometric indicator for Zn2+ over two concentration regimes (low and high) under the excitation of arylvinyl-bipy fluorophore.
Figure 2.
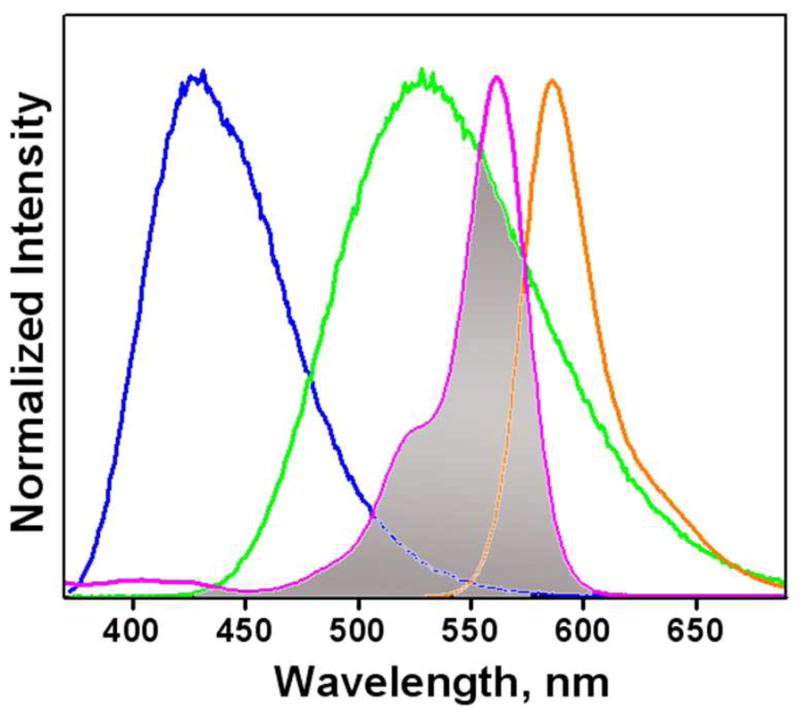
Normalized emission spectra of 1 (blue), [Zn(1)](ClO4)2 (green), absorption (purple), and emission (orange) spectra of [Zn(2)](ClO4)2. The shaded area represents the spectral overlap between the emission of [Zn(1)](ClO4)2 and absorption of [Zn(2)](ClO4)2.
Synthesis
The syntheses of monotopic rhodamine spirolactam ligands 2 and 3 are depicted in Scheme 2. Briefly, 2-amino-6-ethynylpyridine reacts with rhodamine B under POCl3-mediated dehydration conditions to afford spirolactam 7 in 62% yield. Compounds 2 and 3 were synthesized via the copper(I)-catalyzed azide-alkyne cycloaddition (CuAAC) reaction39 between alkyne 7 and n-octyl azide or 4-bromobenzyl azide in 85% and 79% yields, respectively. These two compounds were used to characterize the structural and fluorescence changes of the spirolactam tridentate ligand motif (carbonyl-pyridyl-triazolyl) upon binding to Zn2+.
Scheme 2.
Syntheses of monotopic compounds 2 and 3. NaAsc = sodium ascorbate; TBTA = tris[(1-benzyl-1H-1,2,3-triazol-4-yl)methyl]amine.
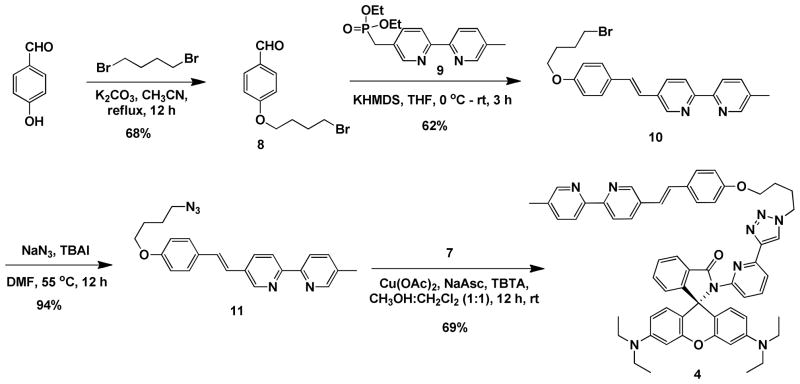
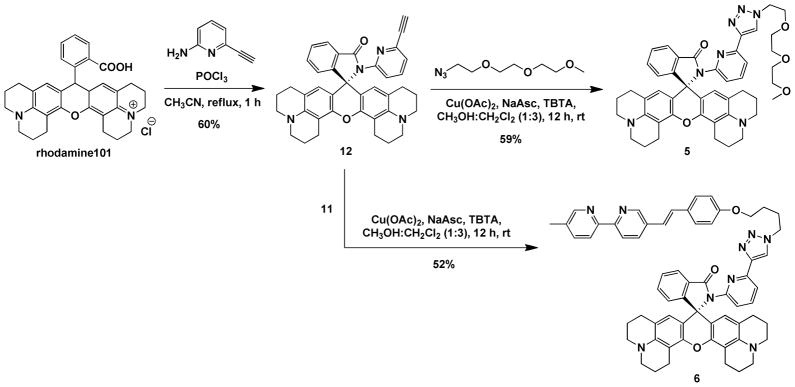
The synthesis of heteroditopic compound 4 (Scheme 3) started from the alkylation of 4-hydroxybenzaldehyde by 1,4-dibromobutane to afford 8. Horner-Wadsworth-Emmons olefination between 8 and phosphonate 9 resulted in alkene 10 in the trans form,40 which, upon conversion to azide 11 via an SN2 substitution, underwent the CuAAC reaction with alkyne 7 to reach compound 4. Rhodamine 101-derived monotopic compound 5 and ditopic compound 6 (Scheme 4) were prepared via similar routes to those leading to compounds 2–4. Compounds 5 and 6 were used to study the impact of structural variation at the xanthene moiety to H+- and Zn2+-mediated the ring-open chemistry of the spirolactam.
Scheme 3.
Synthesis of heteroditopic compound 4. NaAsc = sodium ascorbate; TBTA = tris[(1-benzyl-1H-1,2,3-triazol-4-yl)methyl]amine; KHMDS = potassium hexamethyldisilazide; TBAI = tetrabutylammonium iodide.
Scheme 4.
Syntheses of Rhodamine 101-derived compounds 5 and 6. NaAsc = sodium ascorbate; TBTA = tris[(1-benzyl-1H-1,2,3-triazol-4-yl)methyl]amine.
Zn2+-dependent absorption and fluorescence of monotopic ligands 1 and 2
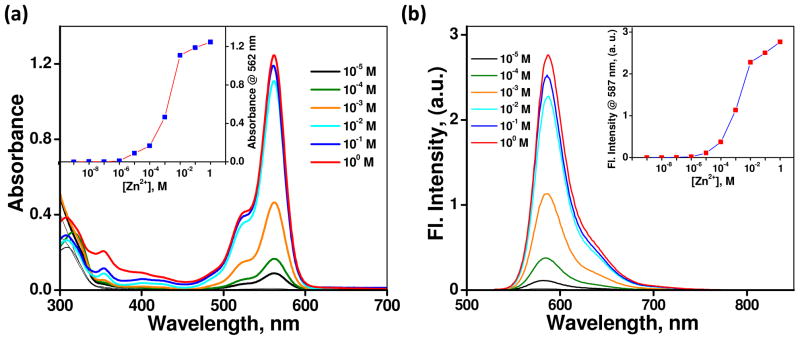
As previously reported,21 compound 1 (Scheme 1A) shows an absorption maximum at 347 nm (ε = 34 × 103 L mol−1 cm−1) and an emission maximum at 431 nm (φf = 0.28) in CH3CN. Upon complexation with Zn(ClO4)2, as a result of stabilizing the charge-transfer excited state, both maxima of absorption and emission of 1 shift bathochromically to 374 nm (ε = 28 × 103 L mol−1 cm−1) and 528 nm (φf = 0.46, Table 1), respectively. A solution of spirolactam 2 (Scheme 1B) in CH3CN is colorless. The absorption and emission spectra of 2 in CH3CN in the presence of varying concentrations of Zn(ClO4)2 (1 nM − 1 M) are shown in Figure 3. Upon increasing [Zn(ClO4)2] from 1 nM to 10 μM, the solution remains colorless. Further increasing the concentration above 10 μM results in the development of a pink color and orange fluorescence (Figure S1), signaling the conversion of the colorless spirolactam to the ring-opened amide form of rhodamine. The dissociation constant of a presumed 1:1 complex [Zn(2)](ClO4)2 is 0.1 mM via curve fitting using a 1:1 binding isotherm equation (Figure S2).41
Table 1.
Absorption maximum (λabs), extinction coefficient (ε), emission maximum (λem), and fluorescence lifetime (τ) of Zn2+ complexes of model systems (1, 2 and 5) and heteroditopic ligands (4 and 6) in CH3CN.
| Compound | λabs/nm | ε/103 mol L−1 cm−1 | λem/nm | φf | τ/ns (Rel. Ampl. %) |
|---|---|---|---|---|---|
| a,b[Zn(1)]2+ | 374 | 28 | 528 | 0.46 | 3.1 |
| c[Zn(2)]2+ | 562 | 107 | 587 | 0.30 | 1.5 |
| a[Zn(4)]2+ | 374 | 32 | 528 | 0.04 | 0.2 |
| d[Zn(4)]2+ | 376, 567 | 35, 45 | 587 | 0.11 | 1.6 (70), 3.7 (30) |
| c[Zn(5)]2+ | 584 | 72 | 607 | 0.72 | 5.06 |
| e[Zn(6)]2+ | 366 | 25 | 516 | 0.05 | 0.4 (56), 1.9 (44) |
| d[Zn(6)]2+ | 373, 588 | 34, 31 | 608 | 0.13 | 5.4 (92), 1.4 (8) |
of the monozinc complex;
value taken from ref. 21;
Zn(ClO4)2 saturated condition;
in presence of 10 equiv of Zn(ClO4)2 in acetonitrile;
in presence of 0.6 equiv of Zn(ClO4)2.
Figure 3.
(a) Effect of addition of Zn(ClO4)2 from 1 nM to 1 M on the absorption spectrum of 2 (10 μM) in CH3CN. Inset shows the variation of absorbance at 562 nm vs [Zn(ClO4)2]. (b) Corresponding emission changes. Inset shows the variation of fluorescence intensity at 587 nm vs [Zn(ClO4)2]. The solutions contain 0.14% DMSO.
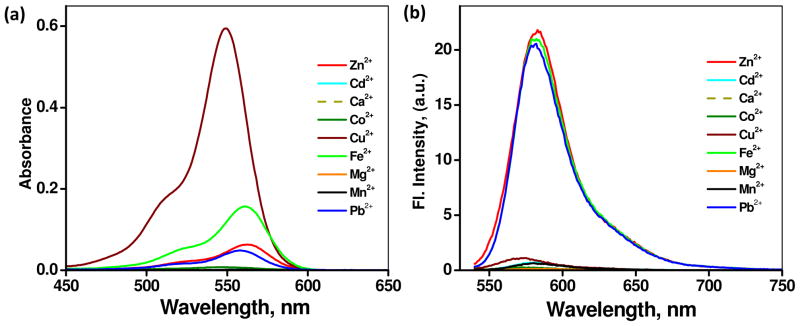
Absorption and fluorescence responses of spirolactam 2 (10 μM) to other divalent metal ions (Cd2+, Ca2+, Co2+, Cu2+, Fe2+, Mg2+, Mn2+ and Pb2+, in 5 equiv each as perchlorate salts) in CH3CN are shown in Figure 4. Similar to Zn2+, additions of Cu2+, Fe2+, and Pb2+ salts result in the development of a pink color of the solution, characteristic of the conversion from spirolactam to rhodamine. Among these metal ions, Cu2+ leads to a distinctive absorption enhancement (549 nm, apparent molar absorptivity = 59 × 103 mol L−1 cm−1). Fe2+ under the same conditions also leads to a more pronounced absorbance change (561 nm, 15 × 103 mol L−1 cm−1) than those of Zn2+ (562 nm, 6 × 10³ mol L−1 cm−1), Pb2+ (558 nm, 4 × 10³ mol L−1 cm−1), and Co2+ (547 nm, 0.7 × 10³ mol L−1 cm−1). All other metal ions fail to manage detectable changes in the absorption spectrum of 2.
Figure 4.
(a) Absorption spectra of 2 (10 μM) obtained with 5 equiv of perchlorate salts of Zn2+, Cd2+, Ca2+, Co2+, Cu2+, Fe2+, Mg2+, Mn2+ and Pb2+ in CH3CN. (b) Corresponding fluorescence spectra. λex = 530 nm. The solutions contain 0.14% DMSO.
The fluorescence responses of these metal ions are shown in Figure 4b. Consistent with the formation of rhodamine, the additions of Fe2+ and Pb2+ lead to intense orange emission upon excitation at 530 nm (φf = 0.08 and 0.26, respectively), similar to that of Zn2+ (φf = 0.21). Even though Cu2+ opens spirolactam ring effectively as shown by the absorption data (Figure 4a), the emission is almost entirely quenched. All other metal ions show negligible changes in the emission spectra, in line with the absorption data. Overall, the metal ion selectivity of compound 2 with regard to absorption can be understood based on the Irving-Williams series42 and the HSAB theory, which are typically applicable to polyaza type ligands. On the emission side, paramagnetic metal ions, such as Cu2+, tend to mask the strong affinities to the ligand by effectively quenching the fluorescence.
Zn2+-dependent structural changes of monotopic spirolactam ligand 3
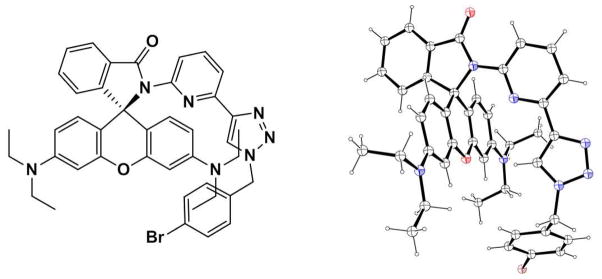
The single crystals of 3 were grown by slow evaporation of a CH2Cl2/hexanes solution to space group P21/c. As depicted in Figure 5, the lactam ring and xanthene core of 3 are almost orthogonal to each other. Similar rhodamine spirolactam systems with different substituents have recently been reported.35,43,44 The pyridyl and triazolyl groups are in a typical transoid arrangement45 with a dihedral angle of 13.6° for minimizing the dipole interactions between the two heterocycles.
Figure 5.
Chemdraw (left) and ORTEP diagram (30% ellipsoids, right) of single crystal X-ray structure of 3. Carbon and hydrogen: black; nitrogen: blue; oxygen: red.
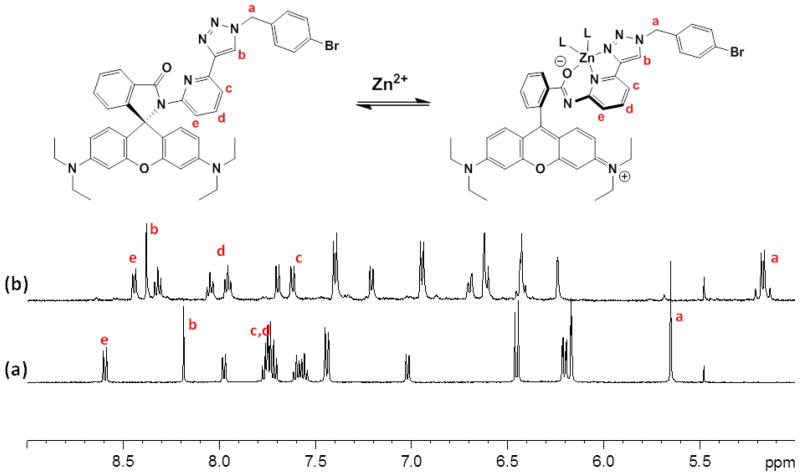
Attempts to obtain single crystals of the Zn2+ complexes of 3 suitable for X-ray diffraction were not successful in several trials. Therefore, IR and 1H NMR data of the complex were acquired to study the structural changes of 3 upon Zn2+ binding. The IR spectrum of spirolactam 3 shows the absorption of an amide carbonyl at 1682 cm−1. Upon coordination with Zn2+, the carbonyl stretching frequency was lowered to 1584 cm−1 (Figure S3), which is consistent with the hypothesis that carbonyl oxygen participates in binding to result in a reduction of C=O bond order (see structure in Figure 6), hence the force constant of the stretching vibration of the carbonyl.25
Figure 6.
1H NMR spectrum of 3 (500 MHz, CD3CN), (a) no Zn(ClO4)2 added, and (b) in the presence of 2 equiv of Zn(ClO4)2.
The titration of 3 with Zn(ClO4)2 was monitored via 1H NMR spectroscopy in CD3CN (Figure 6). The 1H NMR spectrum of 3 shows the triazolyl proton (Hb) at 8.19 ppm and the pyridyl protons at 7.70–7.78 ppm (Hc and Hd), and 8.59 ppm (He). The addition of Zn(ClO4)2 from 0 to 1 equiv results in broadening of the peaks, which upon further addition of Zn2+ sharpen at different chemical shifts. At 2 equiv, the triazolyl Hb proton and the pyridyl proton Hd that is para to the nitrogen atom shift downfield to 8.38 and 7.95 ppm, respectively. The other pyridyl protons, Hc and He, shift to upfield. The benzylic protons of 3, Ha, which appear as a single peak at 5.65 ppm in the free ligand, shift to 5.17 ppm as two doublets in an AB system. The splitting is explained by the diastereotopicity of the benzylic protons in the axially chiral Zn2+ complex. These structural data are consistent with the assignment that Zn2+ binds at the tridentate coordination site containing carbonyl oxygen, pyridyl and triazolyl26,46,47 nitrogen atoms, as shown in Scheme 1B and Figure 6.
Zn2+-dependent absorption and fluorescence of heteroditopic ligand 4
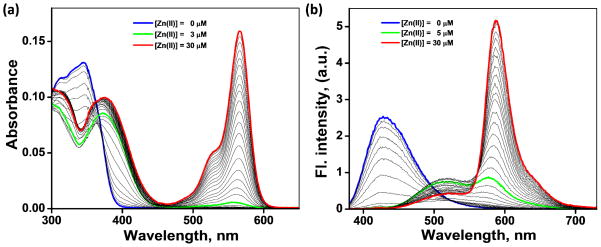
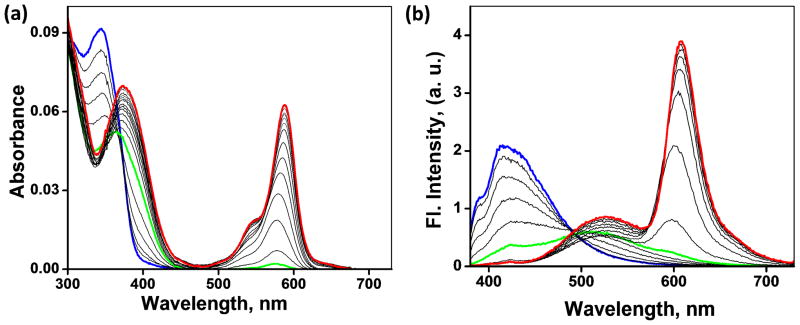
The absorption spectra of heteroditopic ligand 4 over a [Zn(ClO4)2] gradient (0–10 equiv) are shown in Figure 7a. The absorption maximum of 4 in CH3CN at 347 nm (the blue trace) is assigned to the S0→S1 transition of 5-(4-methoxystyryl)-5′-methyl-2,2′-bipyridine. The absence of any absorbance band above 400 nm indicates the existence of rhodamine moiety in the ring-closed spirolactam form. Addition of Zn(ClO4)2 from 0–3 μM results in a bathochromic shift of the absorption maximum to 376 nm. Further addition of Zn(ClO4)2 results in the development of a pink color (Figure 8, top) and appearance of the band corresponding to the ring-opened amide form of rhodamine at 567 nm.
Figure 7.
(a) Effect of Zn(ClO4)2 (0–30 μM) on the absorption spectrum of compound 4 (3.0 μM) in CH3CN. (b) Corresponding changes of the emission spectrum (λex = 370 nm). Blue: free ligand; green: molar ratio of 4 and Zn2+ is 1:1; red: Zn2+ is in 10-fold excess relative to 4.
Figure 8.
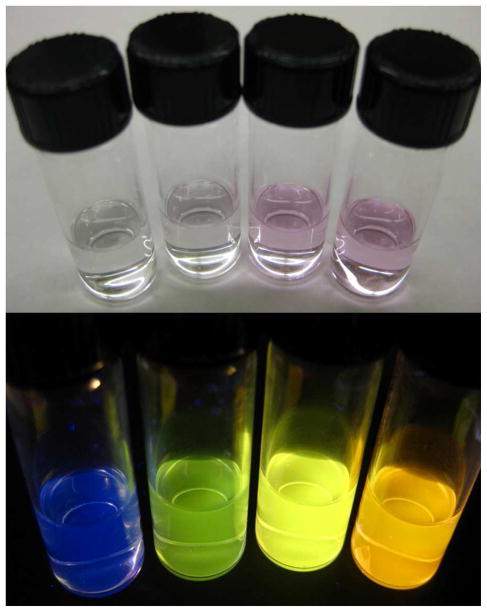
Photographs show the color of a CH3CN solution of 4 (top, 10 μM) and the fluorescence emission (bottom) upon illuminating the same sample using a handheld UV lamp (λex = 365 nm) in the presence of various equiv of Zn(ClO4)2, from left to right: 0, 1.5, 3, 10 equiv.
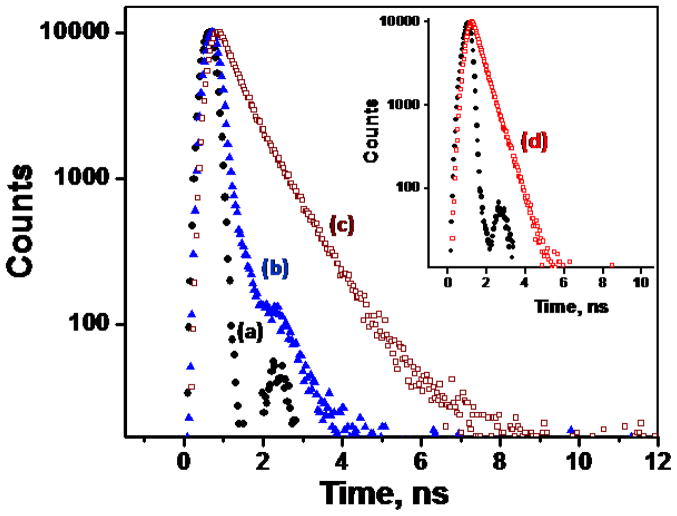
The corresponding changes of the emission spectrum of 4 upon excitation at 370 nm are shown in Figure 7b. The addition of Zn(ClO4)2 from 0–5 μM leads to a shift of emission from blue (λem = 420 nm) to green (λem = 528 nm), which results from Zn2+-coordination at the arylvinyl-bipy component. Upon further addition of Zn(ClO4)2 beyond 5 μM, the spirolactam converts to the ring-opened amide form of rhodamine. The spectral overlap between the absorption of the ring-opened amide form of rhodamine and the emission of Zn2+-arylvinyl-bipy complex (Figure 2) leads to FRET, which results in the second emission shift from green to orange (587 nm). The fluorescence decay at 587 nm upon excitation at 370 nm, where the Zn2+-arylvinyl-bipy absorbs, has a longer lifetime (1.6 and 3.7 ns, see Table 1 and Figure 11) than that obtained via direct excitation of the rhodamine fluorophore (λex = 560 nm, the lifetime of [Zn(2)]2+ is 1.5 ns, see Figure 11, inset). This observation is consistent with the hypothesis that the orange emission from the Zn2+-bound 4 shown in Figure 7b results from a FRET mechanism. We further verified the sensitized excitation of the Zn2+-rhodamine moiety in 4 using the following control experiment.20,39 When excited at 370 nm, titration of Zn(ClO4)2 into an equimolar mixture of monotopic compounds 1 and 2 results in an intense green emission (Figure S4) instead of the orange emission observed with ditopic compound 4, where compounds 1 and 2 are covalently tethered.
Figure 11.
Fluorescence decay profiles monitored at 520 nm (▲) and 580 nm (□) by exciting samples using a 370 nm nanoLED excitation source, (a) IRF (●), (b) the monozinc complex of 4 (▲, blue), (c) 4 in the presence of 10 equiv of Zn(ClO4)2 (□, wine). Inset: (d) 2 in the presence of 10 equiv of Zn(ClO4)2 (□, red) in CH3CN excited at 560 nm.
The emission color transition of 4 over an increasing [Zn(ClO4)2] gradient was examined visually. Fluorescence emission of an CH3CN solution of 4 (10 μM) upon illumination using a handheld UV lamp in the presence of various equiv of Zn(ClO4)2 is shown in Figure 8. In the absence of Zn(ClO4)2, a blue emission was observed. The addition of 1.5 equiv of Zn(ClO4)2 leads to a green color, indicative of the formation of the Zn2+-arylvinyl-bipy moiety. Further addition of 1.5–3.0 equiv Zn(ClO4)2 results in a yellowish emission; and in the presence of 10 equiv Zn(ClO4)2, the fluorescence of the solution is bright orange, typical of that of rhodamine. Comparing to the color of the solution of 4 in the presence of Zn(ClO4)2 at various concentrations under the ambient light (Figure 8, top), the emission of 4 carries a much higher visual sensitivity to the change of [Zn(ClO4)2].
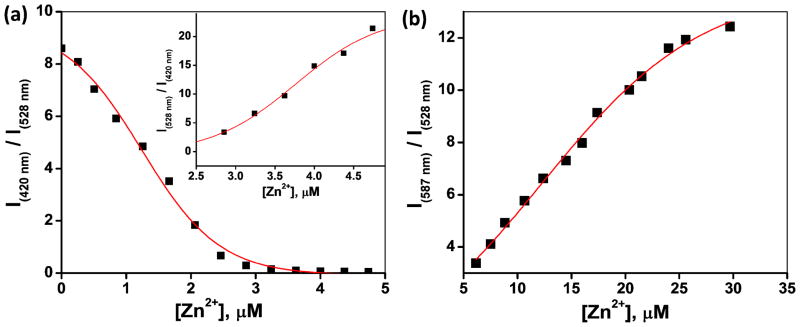
The sequential emission band shifts of 4 over an increasing [Zn(ClO4)2] gradient offer an opportunity to correlate emission intensity and [Zn(ClO4)2] ratiometrically. As shown in Figure 9a, the ratio of fluorescence intensity at 420 nm (blue channel) over that of 528 nm (green channel) decreases steadily as [Zn(ClO4)2] increases up to 3 μM. The inverse intensity ratio of 528 nm over 420 nm (Figure 9a, inset) tracks the growth of [Zn(ClO4)2] in the 3–5 μM range. When [Zn(ClO4)2] is over 5 μM, the orange emission channel (587 nm) is open. The intensity ratio at 587 nm over 528 nm increases as [Zn(ClO4)2] grows in the high concentration regime (Figure 9b). In conjunction with the visual inspection in estimating [Zn(ClO4)2] (Figure 8), the observed ratiometric correlation between fluorescence intensity and [Zn(ClO4)2], the “analyte” in this case, over a range in acetonitrile offers promises in developing multicolor fluorescent indicator for Zn2+ for quantitative analyses based on this fluorescent heteroditopic scaffold.
Figure 9.
Emission intensity ratios of compound 4 vs [Zn(ClO4)2] in CH3CN (λex = 370 nm). (A) [Zn(ClO4)2] = 0–5 μM; inset: [Zn(ClO4)2] = 2.5–5.0 μM; (B) [Zn(ClO4)2] = 5.0–30 μM.
Effect of Pb2+ and Fe2+ on the fluorescence of heteroditopic ligand 4
The influence of Pb2+ and Fe2+, which induce fluorescence turn-on of the monotopic spirolactam 2, on the spectral response of heteroditopic ligand 4 was also analyzed in CH3CN. The addition of Pb(ClO4)2 leads to a bathochromic shift of bipy absorption towards 379 nm, along with a concomitant increase of absorbance at 561 nm (Figure S5). This observation suggests that the two binding sites in compound 4 have comparable affinities to Pb2+, leading to simultaneous rather than sequential binding. As a result, the emission spectra collected during the Pb2+ titration experiment include only one emission band of the Pb2+/4 complex, which is centered at 583 nm assignable to the amide form of rhodamine.
A clear piece of evidence for FRET-mediated sensitization of rhodamine moiety in 4 was observed upon titrating with Fe(ClO4)2 (Figure S6). The addition of 0–10 equiv of Fe2+ results in sequential emergence of absorption bands at 370 and 564 nm. However, due to the inability of the non-emissive Fe(bipy)2+ to act as the FRET donor, no emission bands were observed from the solution upon excitation at 370 nm, even though Fe2+ induces ring-opening of the spirolactam effectively, and the complex of which fluoresces under direction excitation (Figure 4b).
Intramolecular photoinduced electron transfer in monozinc complex [Zn(4)]2+
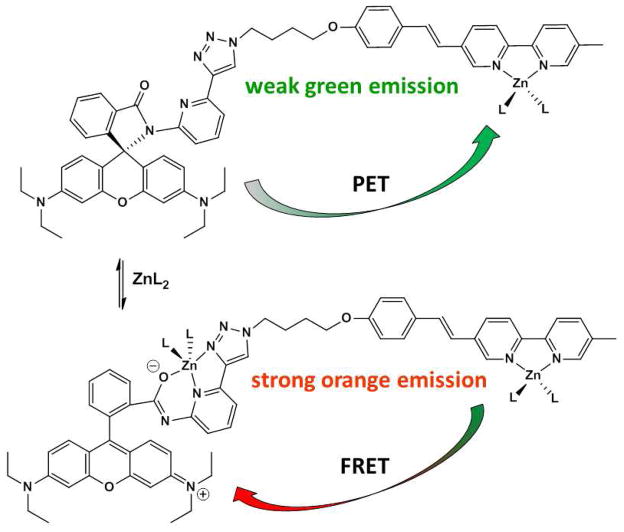
Comparing to the Zn2+ complex of compound 1 (φf = 0.46), the weak fluorescence of the monozinc complex of heteroditopic ligand 4 (φf = 0.04, Table 1), which arises from the same arylvinyl-bipy moiety in 1, caught our attention. We hypothesized that the intramolecular photoinduced electron transfer (PET) from the two electron-rich N,N-diethylanilinyl groups in the spirolactam form of rhodamine component quenches the excited Zn2+-arylvinyl-bipy complex in 4 (Figure 10).
Figure 10.
PET and FRET pathways in heteroditopic ligand 4. L: counter ion or solvent.
To verify the PET quenching process in the mononuclear [Zn(4)L2] shown in Figure 10, we estimated the Gibbs free energy (ΔG°) of electron transfer from the rhodamine spirolactam moiety to the excited Zn2+-arylvinyl-bipy moiety in 4 using the Rehm-Weller equation (1),48
| (1) |
where ‘Eox’ is the oxidation potential of the donor (i.e., rhodamine spirolactam moiety in 4, 0.48 V), ‘Ered’ is the reduction potential of the acceptor (i.e., Zn2+-arylvinyl-bipy moiety in 4, −1.77 V), ‘E0,0’ is the excitation energy of the Zn2+-arylvinyl-bipy complex (as determined for [Zn(1)]2+ at 2.82 eV), ‘d’ is the center-to-center distance between the electron donor and the acceptor, and ‘ε’ is the dielectric constant of the solvent. Eox and Ered of model compounds 1 and 2 and heteroditopic compound 4 were determined using cyclic voltammetry (Table S1). The cyclic voltammograms are shown in Figure S12. With the large dielectric constant of the CH3CN solvent (ε = 37), the work term ‘e2/dε’ is omitted in the calculation. The application of the Rehm-Weller equation gave a value of ΔG° = −0.57 eV, which indicates that the intramolecular photoinduced reduction of Zn2+-arylvinyl-bipy moiety from the spirolactam component in 4 is spontaneous.
To further investigate the intramolecular PET quenching process in [Zn(4)]2+, we measured fluorescence lifetime (τ) of the monozinc complex of 4 in CH3CN using the nanosecond time-correlated single photon counting technique, and compared it with that of the model system, [Zn(1)]2+ complex. The decay profiles along with the instrument response function (IRF) are shown in Figure 11. Complex [Zn(1)]2+ experiences a monoexponential decay with τ = 3.1 ns.25 The fluorescence lifetime of the monozinc complex of 4 (blue triangles) is much shorter and close to the IRF (ca. 0.2 ns). These data support an efficient intramolecular PET relaxation pathway available to the Zn2+-arylvinyl-bipy complex in 4, which shortens its lifetime.
Zn2+-dependent fluorescence of 4 under physiological conditions
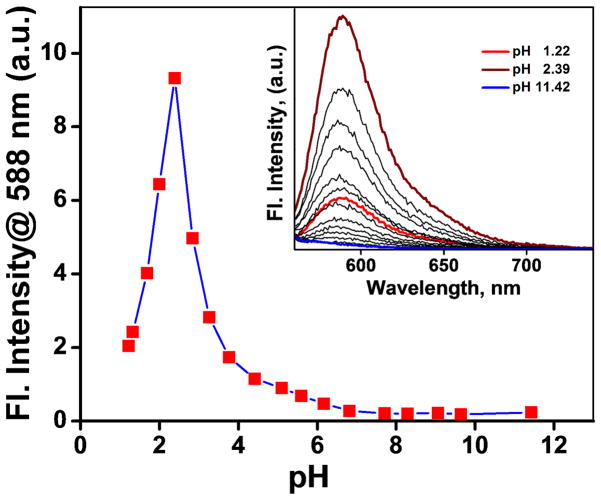
One of the potential uses of the heteroditopic ligands is as indicators for Zn2+ under physiological conditions. The bipy moiety in 4 has a pKa value ~ 4.4.17 To assess the pKa of the rhodamine spirolactam moiety of 4, pH titration of compound 2 was carried out in the range of pH 1.2 to 11.4. The pH-dependent emission intensity change at 588 nm is plotted in Figure 12. Assuming that protonation (likely of the carbonyl group) leads to the ring-opening of the spirolactam, the pKa of the spirolactam moiety is ~ 2.8, as estimated using the Henderson-Hasselbach equation (Figure S7). Based on the pKa values of both Zn2+ binding sites in 4, we conclude that the fluorescence of 4 is not sensitive to the fluctuations of the pH value within the physiological range (e.g. 6–8).
Figure 12.
(a) Emission changes of 2 (10 μM, λex = 570 nm) at 588 nm at various pH values (pH 1.2 to 11.4) in a mixed buffer (HEPES – 27 mM, EPPS – 9 mM, CHES - 9 mM, MES – 27 mM, NaOAc – 18 mM, EGTA – 9 mM) solution containing KNO3 (90 mM). 20% DMSO was added as co-solvent. Inset: emission spectra of 2 collected at various pH values.
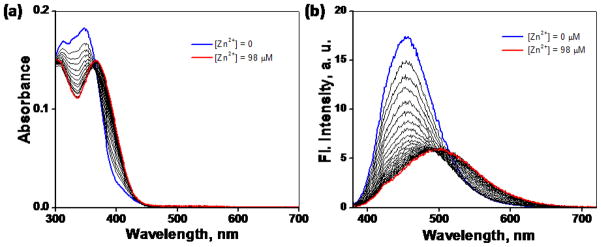
The Zn2+-dependent spectroscopic characteristics of heteroditopic ligand 4 were studied under simulated physiological conditions. Compound 4 (5 μM) upon titrating with ZnCl2 (0–98 μM) in a 1:1 mixture of CH3CN and a pH neutral aqueous buffer solution (50 mM HEPES, 50 mM NaCl, pH 7.2) (Figure 13) shows only the bathochromic absorption and emission spectral shifts characteristic of the formation of the Zn2+-arylvinyl-bipy complex. The fluorescence intensity from the Zn2+-arylvinyl-bipy component of 4 is relatively weak (red spectrum in Figure 13b), which can be attributed to the quenching by the diethylanilinyl group in the spirolactam component as described earlier. ZnCl2 is unable to effect the ring-opening of the spirolactam moiety, based on the absence of absorption band of rhodamine centering near 588 nm.
Figure 13.
(a) Effect of addition of ZnCl2 (0–98 μM) on the absorption spectrum of compound 4 (5 μM) in a 1:1 CH3CN/HEPES buffer (50 mM HEPES, 50 mM NaCl, pH 7.2). (b) Corresponding changes of the emission spectrum (λex = 370 nm).
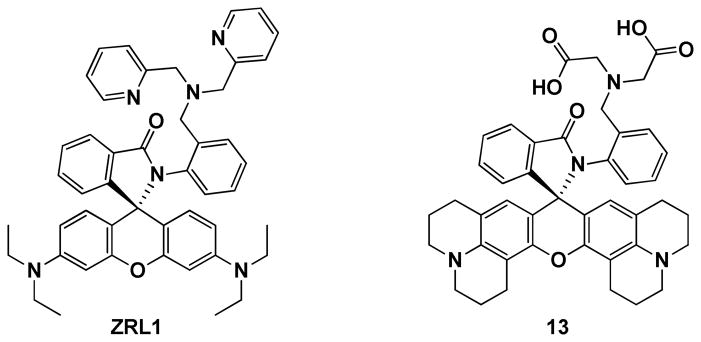
A survey of the reported examples in which rhodamine spirolactam chemistry is applied in developing fluorescent indicators for Zn2+ under physiological conditions35–38 reveals that similar predicaments of slow Zn2+-mediated spirolactam ring opening kinetics are probably encountered in all cases, to various degrees. Best to our knowledge, two rhodamine spirolactam ligands for Zn2+ that operate in entirely aqueous media have been reported thus far.35,36 This is an astonishingly small number relative to the volume of reports on targeting other metal ions using the rhodamine ring-opening chemistry.33 Lippard et al. developed probe ZRL1 (Chart 1) by utilizing the strong chelating ability of dipicolylamino49 group to hold Zn2+ close to the carbonyl of the spirolactam moiety. But the ring-opening rate is slow as evidenced by the long wait time (2 h) between Zn2+ additions in the titration experiment.35 The Nagano group utilized iminodiacetate as the Zn2+ chelator on a similar scaffold (e.g., 13 in Chart 1), and studied the role of xanthene core on the ring-opening kinetics of rhodamine spirolactam. The study by Nagano et al. showed that under physiological conditions the spirolactams derived from rhodamine B and 6G are hardly opened upon addition of Zn2+, while the derivatives from rhodamine 101, as in compound 13, show much more sensitive responses.
Chart 1.
Structures of Zn2+ indicators ZRL1 (by Lippard et al.)35 and 13 (by Nagano et al.).36
Based on the work from Lippard35 and Nagano groups,36 two strategies to enhance the rate of Zn2+-coordination effected ring-opening of spirolactam emerge: (1) to include a strong-binding ligand that directs Zn2+ to interact with the carbonyl of the spirolactam; (2) to increase the electronic conjugation of the xanthene amino groups to the spiro carbon as in compound 13. In this work, we synthesized the monotopic 5 and ditopic compound 6 by replacing rhodamine B in 2 and 4 with rhodamine 101 (Scheme 4), to see whether this structural modification (Strategy #2) accelerates the ring-opening kinetics to allow for the application of this heteroditopic design under physiological conditions.
Spectral response of monotopic spirolactam 5 to Zn2+ coordination was studied in CH3CN. Compound 5 remains colorless in the presence of 1 nM up to 1 μM of Zn(ClO4)2. Further increasing [Zn(ClO4)2] above 1 μM results in the development of a pink color and orange fluorescence of the solution (Figure S8). The dissociation constant of complex [Zn(5)](ClO4)2 is 20 μM (Figure S9), comparing to the 0.1 mM observed for [Zn(2)](ClO4)2.41 Therefore, the replacement of rhodamine B in compound 2 by rhodamine 101 increases the affinity to Zn2+ in CH3CN by 5-fold.
A solution of heteroditopic 6 (2.1 μM) in CH3CN is colorless and shows only absorption corresponding to the bipy moiety. The addition of Zn(ClO4)2 from 0–0.6 equiv leads to an increase of absorbance near 360 nm, as a result of the formation of Zn2+-bipy complex. Further addition of Zn2+ leads to the increase of the band centered at 580 nm. Fluorescence change over the Zn(ClO4)2 titration experiment also suggests the two-stage binding process of 6, in which emission bands at 520 and 608 nm were observed (Figure 14). As observed in the case of 4, at ratios of [Zn2+]/[6] less than 1:1, the samples exhibit a weak green fluorescence. However, in contrast to 4, no clear transition of emission color from green to orange was observed due to a more competitive binding between the two coordination sites, as a result of the increased affinity of the rhodamine 101-derived spirolactam pyridyl-triazolyl secondary site to Zn2+.
Figure 14.
(a) Effect of addition of Zn(ClO4)2 (0–10 μM) on the absorption spectrum of 6 (2.1 μM) in CH3CN. (b) Corresponding changes of the emission spectrum (λex = 370 nm). Blue: free ligand; green: ratio of [6]/[Zn2+] is 1:0.6; red: Zn2+ is in 10-fold excess relative to 6.
Spirolactam 5 derived from rhodamine 101 shows a more sensitive response to pH change than rhodamine B-derived compound 2. Fluorescence of 5 increases as the pH value drops from 6 to 3 to result in a sigmoidal pH-fluorescence profile (Figure S10). The higher pKa value of 5 (5.0) than that of 2 (~ 2.8) suggests that the ring-opening reaction of 5 is more susceptible to a Brønsted or a Lewis acid than that of 2, which is consistent with Nagano et al.’s conclusion.36
Fluorescence responses of ditopic 6 to Zn2+ were studied under simulated physiological conditions (Figure S13). Similar to 4, addition of Zn2+ results in a green emission, corresponding to the binding at bipy site. Further addition of Zn2+ is unable to elicit the rhodamine emission. These observations emphasize the reluctance of the spirolactam components in both 4 and 6 to undergo Zn2+-effected ring-opening under physiological conditions, which can be attributed to the weak affinity of pyridyl-triazolyl moiety to Zn2+ in an aqueous environment. Extending from this work, the next logical step is to undertake structural alterations of the Zn2+ binding moiety for enhancing the interaction between Zn2+ and the carbonyl of the spirolactam in an aqueous environment (Strategy #1).
Conclusion
A fluorescent heteroditopic ligand (4) undergoing sequential emission bathochromic shifts over an increasing [Zn(ClO4)2] gradient in CH3CN is demonstrated. Compound 4 can be excited in the visible region. Its emission color spans from blue continuously to orange depending on [Zn(ClO4)2]. The initial emission band shift from blue to green is attributed to the Zn2+-coordination stabilized internal charge transfer (ICT) component in 4. At a sufficiently high [Zn(ClO4)2], the spirolactam component in 4 transforms to the highly fluorescent rhodamine, which turns the emission color from green to orange via intramolecular FRET from the ICT fluorophore to rhodamine. This work represents a new fluorescent heteroditopic ligand design where sequential target-induced emission band shifts result in a drastic emission color change (i.e. from blue to orange in the case of compound 4).
In the current demonstration, the second step emission color change of heteroditopic compounds 4 and 6 from green to orange, which shall result from Zn2+-induced spirolactam ring-opening, fails to occur under physiological conditions. From this observation, the nuances of rhodamine spirolactam chemistry that have not been sufficiently addressed are revealed, which include the ability of the spirolactam as a fluorescence quencher via electron transfer, and more significantly, the slow kinetics of spirolactam ring-opening effected by Zn2+-coordination. Given the ever-growing number of reports of metal ion sensor development utilizing the ring-opening chemistry of rhodamine spirolactam,33 we feel it is of importance to report the limitations of this system, so that they can be addressed by the collective attention and effort from the relevant research communities. Our ongoing efforts focus on structural modification to overcome the slow Zn2+-dependent ring opening kinetics, so that fluorescent heteroditopic indicators based on this design can be applied in aqueous solutions.
Experimental Section
Materials and General Methods
Reagents and solvents were purchased from various commercial sources and used without further purification unless otherwise stated. All reactions were carried out in oven- or flame-dried glassware. Analytical thin-layer chromatography (TLC) was performed using pre-coated TLC plates with silica gel 60 F254 or with aluminum oxide 60 F254 neutral. Flash column chromatography was performed using 40–63 μm (230–400 mesh ASTM) silica gel or alumina (80–200 mesh, pH 9–10) as the stationary phases. Silica and alumina gel was flame-dried under vacuum to remove adsorbed moisture before use. 1H and 13C NMR spectra were recorded at 300 MHz and 125 MHz (on two different instruments), respectively. All chemical shifts were reported in δ units relative to tetramethylsilane. Spectrophotometric and fluorometric titrations were conducted on a UV-Visible spectrophotometer and a fluorescence spectrophotometer, respectively, with a 1-cm semi-micro quartz cell. The fluorescence quantum yields were determined by comparison of the integrated area of corrected emission spectrum with those of quinine bisulphate (φf = 0.54 in 1 N H2SO4) and rhodamine 101 inner salt (φf = 1.0 in ethanol) using the literature methods.50–52 Fluorescence lifetimes were determined using a nanosecond single-photon counting system employing 370- and 560-nm nanoLED excitation source. Photon count was set at 10,000, the TAC range was 100 ns, the sync delay was 70 ns, and coaxial delay was 65 ns. The fluorescence lifetime values were determined by deconvoluting the instrument response function with exponential decay using a decay analysis software. The quality of the fit was judged by χ2 value (< 1.2) and the visual inspection of the residuals. The cyclic voltammograms were acquired in CH3CN (spectroscopic grade) containing Bu4NPF6 (100 mM) as supporting electrolyte using an electrochemical analyzer. The data were collected at a concentration of 1.0 mM in a single compartment cell with a Pt disc working electrode, a Pt wire counter electrode, and a Ag/AgCl reference electrode. The cyclic voltammograms at a scan rate of 100 mV/s are reported.
2-Amino-6-[(trimethylsilyl)ethynyl]pyridine
2-Amino-6-bromopyridine (100 mg, 0.58 mmol), Pd(PPh3)2Cl2 (12 mg, 0.017 mmol, 3 mol %), and CuI (5 mg, 0.028 mmol, 5 mol %) were added to dry THF (10 mL) in a flame-dried round-bottom flask. The mixture was purged by argon for 30 min. The reaction mixture was cooled on ice. Triethylamine (2 mL) was added and stirred for 5 min. Ethynyltrimethylsilane (100 μL, 0.69 mmol) was subsequently added and stirred at rt. After 12 h, the reaction mixture was filtered through a short pad of alumina and washed with THF. Solvent was removed under reduced pressure, and the obtained crude product was purified by silica column chromatography using a THF-CH2Cl2 (1:9) mixture as a white solid. Mp: 125–126 °C. The yield was 90 mg (82%). 1H NMR (300 MHz, CDCl3): δ/ppm 7.36 (t, J = 7.8 Hz, 1H), 6.85 (d, J = 7.8 Hz, 1H), 6.45 (d, J = 8.4 Hz, 1H), 4.5 (bs, 2H), 0.25 (s, 9H); 13C NMR (125 MHz, CDCl3): δ/ppm 158.4, 140.8, 137.8, 117.9, 108.9, 104.2, 93.5, −0.11; HRMS (CI) (m/z): [M+H]+ calcd for C10H15N2Si 191.1005, found 191.1006.
2-Amino-6-ethynylpyridine
2-Amino-6-[(trimethylsilyl)ethynyl]pyridine (90 mg, 0.47 mmol) was stirred in CH3OH (10 mL) containing 20% KOH. After 1 h, water (20 mL) was added to dilute the mixture, which was subsequently extracted with ethyl acetate (3 × 30 mL). The combined organic phases were dried over anhydrous Na2SO4. Solvent was removed under reduced pressure to afford the analytically pure product a pale brown solid. Mp: 117–120 °C. The yield was 55 mg (99%). 1H NMR (300 MHz, CDCl3): δ/ppm 7.38 (t, J = 7.8 Hz, 1H), 6.86 (d, J = 7.2 Hz, 1H), 6.47 (d, J = 8.4 Hz, 1H), 4.5 (bs, 2H), 3.06 (s, 1H); 13C NMR (125 MHz, CDCl3): δ/ppm 158.5, 140.1, 137.9, 117.9, 109.4, 83.2, 76.1; HRMS (CI) (m/z): [M+H]+ calcd for C7H7N2 119.0609, found 119.0604.
Compound 7
Rhodamine B (400 mg, 0.84 mmol) and 2-amino-6-ethynylpyridine (120 mg, 1.01 mmol) were refluxed with a catalytic amount of POCl3 in CH3CN (20 mL). After 1 h the reaction mixture was cooled to rt, and the solvent was removed under reduced pressure. The crude product was purified as an amorphous pale orange solid by column chromatography on basic alumina using CH2Cl2 as eluent. The yield of 7 was 280 mg (62%). 1H NMR (300 MHz, CDCl3): δ/ppm 8.38 (d, J = 8.4 Hz, 1H), 7.99 (d, J = 8.4 Hz, 1H), 7.42–7.53 (m, 3H), 7.17 (d, J = 7.2 Hz, 1H), 6.97 (d, J = 7.2 Hz, 1H), 6.40 (m, 4H), 6.13 (dd, J = 8.4, 2.4 Hz, 2H), 3.29 (m, 8H), 2.97 (s, 1H), 1.12 (t, J = 7.2 Hz, 12H); 13C NMR (125 MHz, CDCl3): δ/ppm 168.3, 154.3, 153.6, 150.5, 148.5, 139.5, 137.1, 133.8, 130.8, 128.3, 127.9, 124.7, 123.3, 122.9, 115.6, 108.3, 107.0, 97.9, 82.7, 75.5, 66.7, 44.5, 12.8; HRMS (CI) (m/z): [M+H]+ calcd for C35H35N4O2 543.2760, found 543.2744.
Compound 2
Compound 7 (20 mg, 0.037 mmol) and n-octyl azide (10 mg, 0.037 mmol) were dissolved in a CH2Cl2-CH3OH (1:3) mixture (4 mL). Aqueous solutions of sodium ascorbate (0.5 M, 25 μL) and Cu(OAc)2·H2O (0.1 M, 25 μL) were mixed to produce an orange suspension containing the copper(I) catalytic species, which was subsequently added to the stirring solution. TBTA (catalytic amount) was added, and the mixture was stirred for 12 h at rt. It was then partitioned between CH2Cl2 and a basic EDTA (pH = 10) solution. The organic fraction was washed with basic brine (pH > 10) two more times before dried over K2CO3. The solvent was removed, and compound 2 was isolated by alumina chromatography as a pale orange amorphous solid using CH3OH in CH2Cl2 (gradient 0–1%) as eluent. The yield was 22 mg (85%). 1H NMR (300 MHz, CDCl3): δ/ppm 8.47 (d, J = 7.8 Hz, 1H), 8.00 (d, J = 8.4 Hz,1H), 7.99 (s, 1H), 7.62–7.73 (m, 2H), 7.45–7.49 (m, 2H), 7.08 (d, J = 7.8 Hz, 1H), 6.53 (d, J = 9.0 Hz, 2H), 6.31 (d, J = 2.4 Hz, 2H), 6.13–6.17 (dd, J = 8.4 2.4 Hz, 2H), 4.38 (t, J = 7.2 Hz, 2H), 3.26 (q, J = 7.2 Hz, 8H), 2.01 (t, J = 6.6 Hz, 2H), 1.23–1.43 (m, 10H), 1.09 (t, J = 7.2 Hz, 12H), 0.90 (t, J = 6.6 Hz, 3H); 13C NMR (125 MHz, CDCl3): δ/ppm 168.9, 154.5, 152.5, 150.4, 148.6, 148.4, 148.1, 138.0, 133.8, 129.5, 128.2, 127.9, 124.3, 123.5, 122.6, 115.4, 115.3, 108.8, 107.9, 97.5, 66.0, 50.5, 44.5, 32.0, 30.7, 29.3, 26.8, 22.8, 14.3, 12.8; HRMS (CI) (m/z): [M+H]+ calcd for C43H52N7O2 698.4182, found 698.4171.
Compound 3
Synthesized by the same procedure as above. 4-bromobenzyl azide was used instead of n-octyl azide. The product was isolated as a crystalline pale orange solid. The yield was 22 mg (79%). Mp: 216–217 °C. 1H NMR (300 MHz, CDCl3): δ/ppm 8.54 (dd, J = 8.4, 1.2 Hz, 1H), 8.12 (s, 1H), 7.99 (dd, J = 6.6, 1.8 Hz, 1H), 7.61–7.73 (m, 4H), 7.45–7.49 (m, 2H), 7.27 (d, J = 9.0 Hz, 2H), 7.05 (dd, J = 5.4, 2.4 Hz, 1H), 6.47 (dd, J = 6.6, 3.0 Hz, 2H), 6.12 (m, 4H), 5.53 (s, 2H), 3.26 (m, 8H), 1.09 (t, J = 7.2 Hz, 12H); 13C NMR (125 MHz, CDCl3): δ/ppm 168.9, 154.4, 152.4, 150.5, 149.2, 148.3, 147.7, 137.9, 134.2, 133.8, 132.4, 129.7, 129.4, 128.2, 127.9, 124.2, 123.4, 122.9, 122.8, 115.4, 115.1, 108.6, 107.7, 97.3, 65.8, 53.5, 44.3, 12.7. HRMS (ESI-TOF) (m/z): [M+Na]+ calcd for C42H40N7BrO2Na 776.2324, found 776.2313.
Compound 8
4-Hydroxybenzaldehyde (1.0 g, 8.2 mmol), 1,4-dibromobutane (1.8 g, 8.2 mmol) and K2CO3 (2.2 g, 16 mmol) were refluxed in CH3CN (20 mL). After 12 h the solution was cooled to rt before water (50 mL) was added. The aqueous solution was extracted with ethyl acetate (3 × 30 mL). The combined organic phases were dried over anhydrous Na2SO4, concentrated in vacuo, and purified by flash chromatography on silica. Unreacted 1,4-dibromobutane was collected by eluting with hexanes. Compound 8 was isolated using ethyl acetate–hexanes mixture (1:19) as eluent. The product was an amorphous white solid. The yield was 1.42 g (68%). 1H NMR (300 MHz, CDCl3): δ/ppm 9.88 (s, 1H), 7.83 (d, J = 9.0 Hz, 2H), 6.98 (d, J = 9.0 Hz, 2H), 4.08 (t, J = 5.7 Hz, 2H), 3.49 (t, J = 6.1 Hz, 2H), 1.95–2.14 (m, 4H); 13C NMR (125 MHz, CDCl3): δ/ppm 190.7, 163.9, 131.9, 129.9, 114.7, 67.3, 33.5, 29.3, 27.7; HRMS (CI) (m/z): [M+H]+ calcd for C11H14BrO2 257.0177, found 257.0176.\
Compound 10
In a flame-dried flask compounds 940 (200 mg, 0.62 mmol) and 7 (160 mg, 0.62 mmol) were dissolved in dry THF (20 mL) and cooled to 0 °C. Potassium hexamethyldisilazide (1.5 mL, 0.5 M in toluene, 0.74 mmol) was added dropwise. Upon completing the addition, the stirring was continued for 3 h while the temperature rose to rt. The reaction mixture was then partitioned between CH2Cl2 and water. The aqueous layer was washed with CH2Cl2 (3 × 50 mL). The organic portions were combined, and dried over Na2SO4 followed by solvent removal under vacuum. The product was isolated via silica chromatography using a 1:1 mixture of CH2Cl2-hexanes as a pale yellowish amorphous solid. The yield was 162 mg (62%). 1H NMR (300 MHz, CDCl3): δ/ppm 8.73 (s, 1H), 8.51 (s, 1H), 8.34 (d, J = 8.4 Hz, 1H), 8.29 (d, J = 7.8 Hz, 1H), 7.94 (d, J = 8.4 Hz, 1H), 7.62 (d, J = 8.4 Hz, 1H), 7.49 (d, J = 9.0 Hz, 2H), 7.17 (d, J = 16.2 Hz, 1H), 6.99 (d, J = 16.2 Hz, 1H), 6.90 (d, J = 8.1 Hz, 2H), 4.03 (t, J = 6.0 Hz, 2H), 3.50 (t, J = 6.6 Hz, 2H), 2.40 (s, 3H), 1.94–2.13 (m, 4H); 13C NMR (125 MHz, CDCl3): δ/ppm 159.0, 154.7, 153.5, 149.7, 147.9, 137.5, 133.3, 133.1, 133.0, 130.2, 129.6, 128.0, 122.7, 120.7, 120.5, 114.8, 66.9, 33.5, 29.5, 27.9, 18.5; HRMS (ESI-TOF) (m/z): [M+H]+ calcd for C23H24BrN2O 423.1072, found 423.1063.
Compound 11
Compound 10 (100 mg, 0.24 mmol), NaN3 (30 mg, 0.47 mmol), 18-crown-6 (catalytic amount) and tetrabutylammonium iodide (catalytic amount) were heated in DMF (5 mL) at 55 °C. After 12 h the solution was cooled to rt before water (15 mL) was added. The yellow solid was filtered and dried to afford the analytically pure product as a pale yellowish amorphous solid. The yield was 86 mg (94%). 1H NMR (300 MHz, CDCl3): δ/ppm 8.72 (s, 1H), 8.51 (s, 1H), 8.34 (d, J = 8.4 Hz, 1H), 8.28 (d, J = 7.5 Hz, 1H), 7.93 (d, J = 8.4 Hz, 1H), 7.62 (d, J = 7.8 Hz, 1H), 7.49 (d, J = 9.0 Hz, 2H), 7.17 (d, J = 16.2 Hz, 1H), 6.99 (d, J = 16.2 Hz, 1H), 6.90 (d, J = 8.7 Hz, 2H), 4.03 (t, J = 6.0 Hz, 2H), 3.38 (t, J = 6.6 Hz, 2H), 2.40 (s, 3H), 1.80–1.93 (m, 4H); 13C NMR (125 MHz, CDCl3): δ/ppm 159.0, 154.6, 153.4, 149.7, 147.9, 137.5, 133.3, 133.0, 130.2, 129.6, 128.0, 122.5, 120.6, 120.5, 114.7, 67.2, 51.2, 26.5, 25.8, 18.4; HRMS (ESI-TOF) (m/z): [M+Na]+ calcd for C23H23N5ONa 408.1800, found 408.1795.
Compound 4
Synthesized by the same procedure as described for 2. Compound 11 (14 mg, 0.037 mmol) was used in place of n-octyl azide. The residue was purified by column chromatography on alumina using CH3OH in CH2Cl2 (gradient 0–2%) as eluent. The product was obtained as a pale orange amorphous solid. The yield was 24 mg (69%). 1H NMR (300 MHz, CDCl3): δ/ppm 8.72 (s, 1H), 8.49 (s, 1H), 8.48 (d, J = 8.4 Hz, 1H), 8.35 (d, J = 8.4 Hz, 1H), 8.29 (d, J = 7.8 Hz, 1H), 8.01 (s, 1H), 7.92–8.00 (m, 2H), 7.61–7.72 (m, 3H), 7.44–7.50 (m, 4H), 7.17 (d, J = 17.0 Hz, 1H), 7.09 (d, J = 4.2 Hz, 1H), 6.98 (d, J = 17.0 Hz, 1H), 6.94 (d, J = 8.4 Hz, 2H), 6.53 (d, J = 9.0 Hz, 2H), 6.33 (s, 2H), 6.15 (d, J = 8.4 Hz, 2H), 4.49 (t, J = 6.9 Hz, 2H), 4.09 (t, J = 5.7 Hz, 2H), 3.23 (q, J = 7.2 Hz, 8H), 2.39 (s, 3H), 2.26 (m, 2H), 1.91 (m, 2H), 1.06 (t, J = 6.9 Hz, 12H); 13C NMR (125 MHz, CDCl3): δ/ppm 168.9, 159.1, 154.9, 154.5, 153.6, 152,5, 150.5, 149.8, 148.8, 148.4, 148.0, 147.9, 138.1, 137.7, 133.9, 133.5, 133.2, 133.1, 130.3, 129.9, 129.4, 128.2, 127.9, 124.3, 123.5, 122.9, 122.7, 120.8, 120.7, 115.4, 114.9, 108.8, 107.9, 97.5, 66.9, 66.0, 50.0, 44.4, 31.1, 27.4, 26.4, 18.6, 12.8; HRMS (ESI-TOF) (m/z): [M+H]+ calcd for C58H58N9O3 928.4663, found 928.4669.
Compound 12
Synthesized by the same procedure as described for 7. Rhodamine 101 inner salt was used in place of rhodamine B. The yield of 12 was 296 mg (60%) as an amorphous pale red solid. 1H NMR (300 MHz, CDCl3): δ/ppm 8.47 (d, J = 8.4 Hz, 1H), 7.98 (d, J = 8.4 Hz, 1H), 7.42–7.53 (m, 3H), 7.19 (d, J = 7.2 Hz, 1H), 6.95 (d, J = 7.2, 1H), 5.80 (s, 2H), 2.91–3.11 (m, 13H), 2.39 (t, J = 6.6 Hz, 4H), 2.02 (t, J = 5.4 Hz, 4H), 1.81 (t, J = 5.4 Hz, 4H); 13C NMR (125 MHz, CDCl3): δ/ppm 168.4, 153.7, 150.4, 149.4, 143.2, 139.2, 136.9, 133.7, 131.0, 128.2, 125.0, 124.2, 123.0, 122.6, 115.8, 115.2, 108.3, 107.5, 83.3, 75.1, 67.6, 50.1, 49.7, 27.1, 22.2, 21.9, 21.4. HRMS (ESI-TOF) (m/z): [M+H]+ calcd for C39H35N4O2 591.2760, found 591.2756.
Compound 5
Synthesized by the same procedure as described for 2. Compound 12 was used in place of 7 and 1-azido-2-(2-(2-methoxyethoxy)ethoxy)ethane was used in place of n-octyl azide. The residue was purified by column chromatography on alumina using ethyl acetate in CH2Cl2 (gradient 0–80%). The yield of 5 was 17 mg (59%) as an amorphous pale reddish solid. 1H NMR (300 MHz, CDCl3): δ/ppm 8.46 (dd, J = 8.4, 1.2 Hz, 1H), 7.98 (dd, J =, 6.0, 2.4 Hz, 1H), 7.79 (s, 1H), 7.62–7.73 (m, 2H), 7.40–7.48 (m, 2H), 7.04 (dd, J = 5.4, 1.8 Hz, 1H), 6.06 (s, 2H), 4.54 (t, J = 6.0 Hz, 2H), 3.98 (t, J = 6.0 Hz, 2H), 3.34–3.67 (m, 8H), 3.29 (s, 3H), 2.98–3.08 (m, 10H), 2.75–2.83 (m, 2H), 2.38 (t, J = 6.6 Hz, 4H), 1.98–2.06 (m, 4H), 1.74–1.82 (m, 4H); 13C NMR (125 MHz, CDCl3): δ/ppm 169.2, 154.9, 150.5, 148.6, 147.9, 147.3, 143.1, 137.9, 133.8, 129.2, 127.9, 124.5, 124.2, 123.7, 123.4, 116.9, 115.4, 115.3, 108.7, 106.9, 72.0, 71.1, 70.7, 70.6, 69.8, 66.8, 59.2, 50.4, 50.0, 49.5, 27.2, 22.1, 21.8, 21.7; HRMS (ESI-TOF) (m/z): [M+H]+ calcd for C46H50N7O5 780.3873, found 780.3873.
Compound 6
Synthesized by the same procedure as described above. The yield of 6 was 18 mg (52%) as an amorphous pale reddish solid. 1H NMR (300 MHz, CDCl3): δ/ppm 8.72 (s, 1H), 8.36–8.53 (m, 2H), 8.34 (d, J = 8.4 Hz, 1H), 8.28 (d, J = 8.1 Hz, 1H), 7.92–8.00 (m, 2H), 7.78 (s, 1H), 7.61–7.73 (m, 3H), 7.40–7.48 (m, 4H), 7.15 (d, J = 16.8 Hz, 1H), 7.02–7.06 (m, 1H), 6.97 (d, J = 16.2 Hz, 1H), 6.88 (d, J = 9.0 Hz, 2H), 6.08 (s, 2H), 4.48 (t, J = 7.2 Hz, 2H), 4.05 (t, J = 5.4 Hz, 2H), 2.98–3.08 (m, 10H), 2.75–2.85 (m, 2H), 2.36–2.39 (m, 7H), 2.23 (t, J = 7.2 Hz, 2H), 1.92–2.04 (m, 6H), 1.77 (t, J = 6.0 Hz, 4H); 13C NMR (125 MHz, CDCl3): δ/ppm 169.3, 159.0, 155.0, 154.9, 153.6, 150.5, 149.8, 148.9, 148.0, 147.8, 147.2, 143.1, 137.9, 137.7, 133.9, 133.5, 133.2, 133.1, 130.4, 129.9, 129.1, 128.2, 128.0, 124.4, 124.2, 123.4, 122.9, 122.7, 120.8, 120.7, 117.0, 115.4, 115.3, 114.8, 108.7, 106.8, 67.6, 66.7, 56.2, 50.3, 50.0, 49.6, 29.9, 27.8, 27.2, 26.6, 22.1, 21.9, 21.8, 18.6; HRMS (ESI-TOF) (m/z): [M+H]+ calcd for C62H58N9O3 976.4663, found 976.4693.
Supplementary Material
Acknowledgments
This work was supported by the National Institute of General Medical Sciences (R01GM081382).
Footnotes
Supporting Information. Copies of 1H and 13C NMR spectra for all reported compounds, additional spectra, and. cif file of compound 3. This material is available free of charge via the Internet at http://pubs.acs.org/.
References
- 1.Kimura E, Aoki S. BioMetals. 2001;14:191–204. doi: 10.1023/a:1012942511574. [DOI] [PubMed] [Google Scholar]
- 2.Kikuchi K, Komatsu H, Nagano T. Curr Opin Chem Biol. 2004;8:182–191. doi: 10.1016/j.cbpa.2004.02.007. [DOI] [PubMed] [Google Scholar]
- 3.Jiang P, Guo Z. Coord Chem Rev. 2004;248:205–229. [Google Scholar]
- 4.Lim NC, Freake HC, Bruckner C. Chem Eur J. 2005;11:38–49. doi: 10.1002/chem.200400599. [DOI] [PubMed] [Google Scholar]
- 5.Thompson RB. Curr Opin Chem Biol. 2005;9:526–532. doi: 10.1016/j.cbpa.2005.08.020. [DOI] [PubMed] [Google Scholar]
- 6.Chang CJ, Lippard SJ. Met Ions Life Sci. 2006;1:321–370. [Google Scholar]
- 7.Dai Z, Canary JW. New J Chem. 2007;31:1708–1718. [Google Scholar]
- 8.Carol P, Sreejith S, Ajayaghosh A. Chem Asian J. 2007;2:338–348. doi: 10.1002/asia.200600370. [DOI] [PubMed] [Google Scholar]
- 9.Nolan EM, Lippard SJ. Acc Chem Res. 2009;42:193–203. doi: 10.1021/ar8001409. [DOI] [PMC free article] [PubMed] [Google Scholar]
- 10.Tomat E, Lippard SJ. Curr Opin Chem Biol. 2010;14:225–230. doi: 10.1016/j.cbpa.2009.12.010. [DOI] [PMC free article] [PubMed] [Google Scholar]
- 11.Xu Z, Yoon J, Spring DR. Chem Soc Rev. 2010;39:1996–2006. doi: 10.1039/b916287a. [DOI] [PubMed] [Google Scholar]
- 12.Maret W. BioMetals. 2001;14:187–190. [Google Scholar]
- 13.J Nutr. 2000:130. Supplement of the issue. [Google Scholar]
- 14.Frederickson CJ, Koh J-Y, Bush AI. Nat Rev Neurosci. 2005;6:449–462. doi: 10.1038/nrn1671. [DOI] [PubMed] [Google Scholar]
- 15.See an interpretation of “free” or “mobile” Zn2+ ions in: Krężel A, Maret W. J Biol Inorg Chem. 2006;11:1049–1062. doi: 10.1007/s00775-006-0150-5.
- 16.Zhang L, Murphy CS, Kuang G-C, Hazelwood KL, Constantino MH, Davidson MW, Zhu L. Chem Commun. 2009:7408–7410. doi: 10.1039/b918729d. [DOI] [PubMed] [Google Scholar]
- 17.Kuang G-C, Allen JR, Baird MA, Nguyen BT, Zhang L, Morgan TJJ, Levenson CW, Davidson MW, Zhu L. Inorg Chem. 2011;50:10493–10504. doi: 10.1021/ic201728f. [DOI] [PMC free article] [PubMed] [Google Scholar]
- 18.Zhang L, Clark RJ, Zhu L. Chem Eur J. 2008;14:2894–2903. doi: 10.1002/chem.200701419. [DOI] [PubMed] [Google Scholar]
- 19.Zhu L, Zhang L, Younes AH. Supramol Chem. 2009;21:268–283. [Google Scholar]
- 20.Wandell RJ, Younes AH, Zhu L. New J Chem. 2010;34:2176–2182. [Google Scholar]
- 21.Younes AH, Zhang L, Clark RJ, Zhu L. J Org Chem. 2009;74:8761–8772. doi: 10.1021/jo901889y. [DOI] [PubMed] [Google Scholar]
- 22.Ajayaghosh A, Carol P, Sreejith S. J Am Chem Soc. 2005;127:14962–14963. doi: 10.1021/ja054149s. [DOI] [PubMed] [Google Scholar]
- 23.de Silva AP, Gunaratne HQN, Gunnlaugsson T, Huxley AJM, McCoy CP, Rademacher JT, Rice TE. Chem Rev. 1997;97:1515–1566. doi: 10.1021/cr960386p. [DOI] [PubMed] [Google Scholar]
- 24.Valeur B, Leray I. Coord Chem Rev. 2000;205:3–40. [Google Scholar]
- 25.Zhang X, Shiraishi Y, Hirai T. Tetrahedron Lett. 2007;48:5455–5459. [Google Scholar]
- 26.Huang S, Clark RJ, Zhu L. Org Lett. 2007;9:4999–5002. doi: 10.1021/ol702208y. [DOI] [PubMed] [Google Scholar]
- 27.Struthers H, Mindt TL, Schibli R. Dalton Trans. 2010;39:675–696. doi: 10.1039/b912608b. [DOI] [PubMed] [Google Scholar]
- 28.Lau YH, Rutledge PJ, Watkinson M, Todd MH. Chem Soc Rev. 2011;40:2848–2866. doi: 10.1039/c0cs00143k. [DOI] [PubMed] [Google Scholar]
- 29.Michaels HA, Murphy CS, Clark RJ, Davidson MW, Zhu L. Inorg Chem. 2010;49:4278–4287. doi: 10.1021/ic100145e. [DOI] [PubMed] [Google Scholar]
- 30.Kim HN, Lee MH, Kim HJ, Kim SK, Yoon J. Chem Soc Rev. 2008;37:1465–1472. doi: 10.1039/b802497a. [DOI] [PubMed] [Google Scholar]
- 31.Quang DT, Kim JS. Chem Rev. 2010;110:6280–6301. doi: 10.1021/cr100154p. [DOI] [PubMed] [Google Scholar]
- 32.Jun ME, Roy B, Ahn KH. Chem Commun. 2011;47:7583–7601. doi: 10.1039/c1cc00014d. [DOI] [PubMed] [Google Scholar]
- 33.Chen X, Pradhan T, Wang F, Kim JS, Yoon J. Chem Rev. 2012;112:1910–1956. doi: 10.1021/cr200201z. [DOI] [PubMed] [Google Scholar]
- 34.Mashraqui SH, Khan T, Sundaram S, Betkar R, Chandiramani M. Chem Lett. 2009;38:730–731. [Google Scholar]
- 35.Du P, Lippard SJ. Inorg Chem. 2010;49:10753–10755. doi: 10.1021/ic101569a. [DOI] [PMC free article] [PubMed] [Google Scholar]
- 36.Sasaki H, Hanaoka K, Urano Y, Terai T, Nagano T. Bioorg Med Chem. 2011;19:1072–1078. doi: 10.1016/j.bmc.2010.05.074. [DOI] [PubMed] [Google Scholar]
- 37.Xu L, Xu Y, Zhu W, Zeng B, Yang C, Wu B, Qian X. Org Biomol Chem. 2011;9:8284–8287. doi: 10.1039/c1ob06025b. [DOI] [PubMed] [Google Scholar]
- 38.Han Z-X, Zhang X-B, Li Z, Gong Y-J, Wu X-Y, Jin Z, He C-M, Jian L-X, Zhang J, Shen G-L, Yu R-Q. Anal Chem. 2010;82:3108–3113. doi: 10.1021/ac100376a. [DOI] [PubMed] [Google Scholar]
- 39.Sreenath K, Allen JR, Davidson MW, Zhu L. Chem Commun. 2011;47:11730–11732. doi: 10.1039/c1cc14580k. [DOI] [PMC free article] [PubMed] [Google Scholar]
- 40.Zhang L, Zhu L. J Org Chem. 2008;73:8321–8330. doi: 10.1021/jo8015083. [DOI] [PubMed] [Google Scholar]
- 41.Zhu L, Zhong Z, Anslyn EV. J Am Chem Soc. 2005;127:4260–4269. doi: 10.1021/ja0435945. [DOI] [PubMed] [Google Scholar]
- 42.The Irving-Williams trend applies to high-spin configurations. Fe2+ when bound to compound 2 is likely low-spin, which exhibits a stronger effect than Co2+ or Zn2+, different from the Irving-Williams behavior. The low-spin assignment of Fe2+ is consistent with the strong emission of Fe2+/2 complex.
- 43.Kwon JY, Jang YJ, Lee YJ, Kim KM, Seo MS, Nam W, Yoon J. J Am Chem Soc. 2005;127:10107–10111. doi: 10.1021/ja051075b. [DOI] [PubMed] [Google Scholar]
- 44.Mahato P, Saha S, Suresh E, Liddo RD, Parnigotto PP, Conconi MT, Kesharwani MK, Ganguly B, Das A. Inorg Chem. 2012;51:1769–1777. doi: 10.1021/ic202073q. [DOI] [PubMed] [Google Scholar]
- 45.Younes AY, Clark RJ, Zhu L. Supramol Chem. 2012 doi: 10.1080/10610278.2012.695790. and references therein. [DOI] [Google Scholar]
- 46.Li Y, Huffman JC, Flood AH. Chem Commun. 2007:2692–2694. doi: 10.1039/b703301j. [DOI] [PubMed] [Google Scholar]
- 47.Schweinfurth D, Hardcastle K, Bunz UHF. Chem Commun. 2008:2203–2205. doi: 10.1039/b800284c. [DOI] [PubMed] [Google Scholar]
- 48.Rehm D, Weller A. Isr J Chem. 1970;8:259–271. [Google Scholar]
- 49.de Silva AP, Moody TS, Wright GD. Analyst. 2009;134:2385–2393. doi: 10.1039/b912527m. [DOI] [PubMed] [Google Scholar]
- 50.Melhuish WH. J Phys Chem. 1961;65:229–235. [Google Scholar]
- 51.Meech SR, Phillips D. J Photochem. 1983;23:193–217. [Google Scholar]
- 52.Karstens T, Kobs K. J Phys Chem. 1980;84:1871–1872. [Google Scholar]
Associated Data
This section collects any data citations, data availability statements, or supplementary materials included in this article.


