

Abstract
The cerebellar cortex coordinates movements and maintains balance by modifying motor commands as a function of sensory-motor context, which is encoded by mossy fiber (MF) activity. MFs exhibit a wide range of activity, from brief precisely timed high-frequency bursts, which encode discrete variables such as whisker stimulation, to low-frequency sustained rate-coded modulation, which encodes continuous variables such as head velocity. While high-frequency MF inputs have been shown to activate granule cells (GCs) effectively, much less is known about sustained low-frequency signaling through the GC layer, which is impeded by a hyperpolarized resting potential and strong GABAA-mediated tonic inhibition of GCs. Here we have exploited the intrinsic MF network of unipolar brush cells to activate GCs with sustained low-frequency asynchronous MF inputs in rat cerebellar slices. We find that low-frequency MF input modulates the intrinsic firing of Purkinje cells, and that this signal transmission through the GC layer requires synaptic activation of Mg2+-block-resistant NMDA receptors (NMDARs) that are likely to contain the GluN2C subunit. Slow NMDAR conductances sum temporally to contribute approximately half the MF-GC synaptic charge at hyperpolarized potentials. Simulations of synaptic integration in GCs show that the NMDAR and slow spillover-activated AMPA receptor (AMPAR) components depolarize GCs to a similar extent. Moreover, their combined depolarizing effect enables the fast quantal AMPAR component to trigger action potentials at low MF input frequencies. Our results suggest that the weak Mg2+ block of GluN2C-containing NMDARs enables transmission of low-frequency MF signals through the input layer of the cerebellar cortex.
Introduction
Execution of coordinated movement requires that motor commands are set in the context of ongoing sensory-motor activity. In the cerebellar cortex, sensory-motor stimuli are represented by mossy fiber (MF) activity, with discrete events encoded as precisely timed high-frequency bursts (Chadderton et al., 2004), and continuous variables encoded as continuous rate-coded firing (van Kan et al., 1993; Arenz et al., 2008; Prsa et al., 2009; see also Sawtell, 2010). In the vestibular cerebellum, MFs encode head velocity through bidirectional modulation of firing rate at tens of hertz (Lisberger and Fuchs, 1978; Arenz et al., 2008; Barmack and Yakhnitsa, 2008), substantially lower than the firing rates typically used to examine granule cell (GC) input-output properties in vitro (Mitchell and Silver, 2003; Rothman et al., 2009) and in vivo (Chadderton et al., 2004; Rancz et al., 2007). This raises the question of how low-frequency time-varying MF activity encoding vestibular information (Barmack and Yakhnitsa, 2008) and proprioceptive input (Jörntell and Ekerot, 2006; Sawtell, 2010) is transmitted through the GC layer.
Properties of MF-GC synapses have been extensively dissected in vitro. Synaptic currents display fast direct quantal and slow spillover-mediated AMPA receptor (AMPAR) components as well as an NMDA receptor (NMDAR) component (Silver et al., 1992; DiGregorio et al., 2002). The NMDAR component undergoes developmental maturation with a switch from GluN2A/B-containing receptors to GluN2C-containing receptors (Farrant et al., 1994; Monyer et al., 1994). This results in a weakening of the Mg2+ block and a change in the voltage-dependent properties of the NMDARs (Takahashi et al., 1996; Cathala et al., 2000; Yamada et al., 2001). However, the functional relevance of these changes remains to be investigated. GC output is enhanced in a nonlinear manner by membrane depolarization (Chadderton et al., 2004; Jörntell and Ekerot, 2006; Rancz et al., 2007) depending upon NMDARs (D'Angelo et al., 1995; Cathala et al., 2000; Imamura et al., 2000; Rothman et al., 2009) and subthreshold sodium channels (Magistretti et al., 2006). Other factors such as short-term depression (Saviane and Silver, 2006; Rothman et al., 2009), glutamate spillover (Mitchell and Silver, 2000; DiGregorio et al., 2002) and inhibition (Mitchell and Silver, 2003) also influence GC integration. By combining data collected in vitro and in vivo, modeling studies have predicted roles for specific currents in GC layer integration and gain control (Maex and De Schutter, 1998; Yamazaki and Tanaka, 2007; Rothman et al., 2009; Solinas et al., 2010; Kalmbach et al., 2011). While GluN2C-containing NMDARs are known to contribute to integration during high-frequency bursts (D'Angelo et al., 1995; Cathala et al., 2000) and regulate plasticity at MF-GC synapses (Rossi et al., 1996; D'Angelo et al., 1999), little is known about how they contribute to temporal integration of asynchronous low-frequency synaptic activity.
Here, we have developed an in vitro model of asynchronous time-varying MF input that mimics in vivo MF activity during vestibular sensory input. By combining this in vitro network approach and mathematical modeling of populations of GCs, we show that NMDARs with weak voltage-dependent rectification play a key role in the integration and transmission of signals through the GC layer.
Materials and Methods
Slice preparation.
Experiments were performed on the cerebellum of 17- to 30-d-old male Wistar rats. In accordance with guidelines of the Centre Nationale de la Recherche Scientifique, animals were deeply anesthetized with isoflurane. The cerebellar vermis was isolated and placed in bicarbonate-buffered saline (BBS) at 2–5°C for a few minutes. Parasagittal slices (300 μm) were cut on a HM650V vibratome (Microm) in the following solution (in mm): 130 K-gluconate, 15 KCl, 2 EGTA, 20 HEPES, 25 glucose, 0.05 APV, and 0.00005 Minocycline to inhibit microglia and protect against focal ischemia (Tikka et al., 2001); pH adjusted to 7.4 by NaOH. Each slice was then transferred for 30–60 s to a recovery solution containing the following (in mm): 225 d-Mannitol, 2.341 KCl, 1.25 NaH2PO4, 25 NaHCO3, 25 Glucose, 0.513 CaCl2, 7.671 MgCl2, 0.05 APV, and 0.00005 Minocycline; (33°C) oxygenated with 95% O2/5% CO2. Slices were then placed in a recording chamber of 33°C BBS containing the following (in mm): 126 NaCl, 3.3 KCl, 12.5 NaH2PO4, 24.8 NaHCl3, 25 Glucose, 1.6 CaCl, 1.5 MgCl2, 0.00005 Minocycline.
Electrophysiology.
Slices were transferred to a recording chamber perfused with 33°C carbogen-bubbled BBS that flowed at 4 ml/min. Within the chamber, slices were positioned on an elevated nylon mesh to promote oxygenation. Recordings were confined to lobules IX and X of the vestibular cerebellum. Slices were illuminated with red light (750 nm) and imaged with a CoolSnap SF CCD camera (Photometrics) mounted onto an Olympus BX51W microscope. GCs, unipolar brush cells (UBCs) and Purkinje cells (PCs) were identified visually by their size, morphology and position in the cortical layers and identification was confirmed by the value of their compensated capacitance: 3–6 pF, 8–17 pF, and 25–35 pF, respectively. UBCs were further distinguished from GCs and Golgi cells by their characteristic T-type calcium-channel-dependent bursting in response to current injection from hyperpolarized potentials.
Patch pipettes for electrophysiological recordings were pulled from borosilicate glass electrodes with a final resistance of 6–9 MΩ for GCs, 3–5 MΩ for UBCs, and 2.5–3.5 MΩ for PCs. Voltage-clamp recordings in GCs and PCs were performed using an intracellular solution containing the following (in mm): 120 d-gluconic acid, 100 CsOH, 1 tetraethylammonium hydroxide, 10 HEPES, 6 NaCl, 16 BAPTA, 0.1 QX-314-Cl, 1 CaCl2,10 phosphocreatine-K2, 4 ATP-Mg, 0.4 GTP-Na, pH adjusted to 7.35 with CsOH with a final osmolarity of 295–305 mOsm; liquid junction potential was empirically determined to be −12 mV. The concentration of the QX-314-Cl was kept low to prevent possible inhibition of NMDARs (Hahnenkamp et al., 2006). Current-clamp recordings in GCs and UBCs were performed with an internal solution containing the following (in mm): 135 KMeSO4, 3 NaCl, 1 MgCl2, 0.10 EGTA, 10 phosphocreatine-K2, 10 HEPES, 4 ATP-Mg, 0.4 GTP-Na2; pH adjusted to 7.35 with KOH with a final osmolarity of 295–305 mOsm; liquid junction potential was empirically determined to be −10 mV. All reported membrane potentials are corrected for the liquid junction potential. Extracellular recordings of PCs were performed with sharp electrodes filled with 2 m NaCl2 yielding a resistance of ∼20 MΩ. PCs were identified by their morphology and their stereotypic spontaneous 15–50 Hz regular firing.
Electrophysiological data were acquired with a double EPC-10 amplifier (Heka Elektronik) run by PatchMaster software (Heka Elektronik). Data were sampled at 50 kHz and filtered online at 5 kHz. Analysis was performed using IGOR Pro software (WaveMetrics) with in-house written procedures. Synaptic events were detected and analyzed using SpAcAn (http://www.spacan.net/), a collection of functions for IGOR Pro.
Pressure ejection of (S)-3,5-dihydroxyphenylglycine.
Pressure ejection of (S)-3,5-dihydroxyphenylglycine (DHPG) was used to evoke UBC activity in the GC layer. To perform these experiments, 1.5 μm diameter electrodes (5 MΩ) were filled with 100–200 μm concentrations of the selective mGluR1 agonist DHPG (Tocris Bioscience) diluted in HEPES-buffered saline containing the following (in mm): 140 NaCl, 2.31 KCl, 1.25 NaH2PO4, 10 HEPES, 1.6 CaCl2, 1.5 MgCl2; ∼300 mOsm. Electrodes were placed 100–200 μm deep in the GC layer near the white matter to avoid activation of metabotropic glutamate receptors (mGluRs) in the molecular layer (Baude et al., 1993). Brief 50–300 ms pulses of pressure (0.5–1.0 bar) were applied using a Picospritzer 2 (General Valve Corporation).
Quantification of Purkinje cell synaptic activity.
The integral of PC EPSCs was calculated by zeroing the baseline of each current trace and integrating over time. A correction for baseline drift was applied by calculating the slope of a line connecting the average current 100 ms before and after the DHPG-evoked synaptic activity and subtracting the integral of this line. The duration of the sustained component of the EPSC response was measured from the first EPSC following the bursting phase to the first isolated EPSC whose decay returned to the baseline current. The presence of a long-lasting tail of low-frequency EPSCs, and the difficulty of quantifying the EPSC frequency during the DHPG effect, precluded a more rigorous analysis.
Voltage dependence of NMDAR Mg2+ block.
To compute the voltage dependence of NMDAR Mg2+ block, voltage ramps were applied to GCs from +28 to −92 mV during DHPG stimulation. GCs were only considered for this analysis if they exhibited a stationary NMDAR-mediated current (at least 5 s) during the sustained phase of DHPG excitation which was typically associated with synaptic inputs >25 Hz. By subtracting voltage-ramp currents recorded in the absence of DHPG stimulation from those recorded during DHPG stimulation, we were able to compute the voltage dependence of NMDAR activation at UBC MF-GC synapses. The average NMDAR current was fit with the following equation:
where V is the membrane voltage, GNMDAR is the maximum peak NMDAR conductance and ENMDAR is the NMDAR conductance reversal potential. The fraction of NMDARs not blocked, m(V), was described with a Woodhull formalism (Woodhull, 1973) that accounts for voltage-dependent block by external Mg2+ and for permeation of Mg2+ through the channel (Kupper et al., 1998; Antonov and Johnson, 1999):
 |
where kon and koff are the binding and unbinding rate constants, kperm is the permeation rate constant, δbind and δperm are the apparent fractions of the membrane field felt by external Mg2+ in the binding/unbinding process (assumed to be the same for simplicity; δbind = δon = δoff) and the permeation process, θ = zF/RT, z is the ionic charge (2), F is the Faraday constant, R is the ideal gas constant, T is temperature and e is the base of the natural logarithm. Because application of Equation 2 produces poorly constrained curve fits due to too many free parameters, we reduced the number of free parameters by one by dividing the numerator and denominator by kon, and defining parameters C1 and C2 as the ratios koff/kon and kperm/kon, respectively. Although Kupper et al. (1998) addressed this same problem by an “approximate” method, whereby initial values of their parameters were set to values published in a previous study, and kperm and δperm were then added in a second round of curve fitting, we used a simpler approach that did not require this approximation, by using the definitions of C1 and C2 to remove one free parameter. Hence, in our Results we report curve-fit values for C1 and C2 rather than kon, koff, and kperm.
Pharmacology.
DHPG (mGluR1 agonist), NBQX (AMPAR antagonist), SR-95531 (GABAA receptor antagonist), d-APV (NMDAR antagonist), TTX (sodium channel antagonist), Strychnine (glycine receptor antagonist), and Mibefradil (T-type calcium channel antagonist; Tocris Bioscience and Ascent Scientific) were prepared in water and stored at −22°C. To ensure inhibition of T-type calcium channels by Mibefradil, slices were incubated in 1 μm Mibefradil for a minimum of 30 min. (R-(R*,S*)-(4-Hydroxyphenyl)-methyl-4-(phenylmethyl)-1-piperidine propanol (Ro25-6981) was purchased from Roche. All other drugs and chemicals were obtained from Sigma. Zn2+ (100 μm) was buffered in 10 mm Tricine, resulting in a final concentration of 1.2 μm free Zn2+. Tricine (10 mm) was included in all conditions described below in Figure 4C, including control conditions, to buffer any residual background Zn2+.
Figure 4.

GC NMDARs have a weak voltage dependence, and a pharmacological profile of GC layer transmission consistent with GluN2C-containing receptors. A1, DHPG-evoked GC NMDAR EPSCs isolated by bath application of 5 μm NBQX. The GC membrane potential was ramped from +28 to −92 mV with (top, black) and without (gray) evoking NMDAR currents by DHPG stimulation. Subtraction of the two current responses revealed the NMDAR current–voltage relationship (bottom, shaded region). A2, Resulting current–voltage relationship from shaded region in A1 (black) and a fit to Equation 1 (red): GNMDAR = 401.7 pS, ENMDAR = 2.4 mV, C1 = 3.70 mm, C2 = 0.033 mm, δbind = 0.34, δperm = 0.47 (T = 33°C; [Mg2+]out = 1.5 mm), where C1 = koff/kon and C2 = kperm/kon. B, Fraction of NMDARs not blocked m(V) from the fit in A2 (red curve). Blue curve shows fit of Equation 1 to GC NMDAR currents evoked by direct MF stimulation: GNMDAR = 367.9 pS, C1 = 2.07 mm, C2 = 0.015 mm, δbind = 0.35, δperm = 0.53 (T = 35°C; [Mg2+]out = 1.0 mm; ENMDAR constrained to 0 mV; data from Rothman et al., 2009). Gray dashed curve shows a simultaneous fit of Equation 1 to the P7–P9 wild-type GC data of Takahashi et al. (1996) using both 0.1 and 1.0 mm [Mg2+]out data: C1 = 1.97 mm, C2 = 0.0035 mm, δbind = 0.43, δperm = 0.48, average GNMDAR = 952.6 pS, ENMDAR = 10.28 mV (T = 24.5°C). For comparison, m(−80 mV) = 7.8, 7.0, and 1.4% for the 3 respective curves. C, Normalized charge integral of the PC synaptic response after application of SR and Str, zinc (Zn), Ro25-6981 (Ro-25), and APV. Tricine (10 μm) was included in all conditions to buffer free zinc.
GC models.
GCs were simulated with an integrate-and-fire model whose membrane voltage V was described by the following differential equation:
 |
where V′ is the derivative of V with respect to time t, Cm is the membrane capacitance, Gm and Em are the membrane conductance and reversal potential, GGABAR and EGABAR are the tonic GABAA receptor (GABAR) conductance and reversal potential, i is the MF synapse number, GAMPAR and EAMPAR are the AMPAR peak conductance and reversal potential, GNMDAR and ENMDAR are the NMDAR peak conductance and reversal potential, ΔAMPAR(t) and ΔNMDAR(t) are Poisson trains of synaptic conductance waveforms, and m(V) is the fraction of NMDARs not blocked by Mg2+, defined by Equation 2. A total of 242 different models were simulated using Cm and Em measured from 242 GCs in vitro (P35 rats, 35°C), where Cm was measured under voltage clamp and Em was measured under current clamp while inhibitory receptors were blocked with 10 μm SR-95531 and 0.3 μm strychnine. For 38 of these 242 GCs, Gm was estimated by fitting Equation 3 to subthreshold voltage responses to injection of MF AMPAR conductance trains using dynamic clamp. These fits, together with a more accurate measure of Cm in voltage clamp, gave the following linear relation between Cm and Gm:
This linear relation, plus variance characterization (a normal distribution between −0.5 and 0.5 nS; data not shown), was then used to simulate Gm of the remaining 204 GCs. For the tonic GABAR conductance, GGABAR = 438 pS and reversal potential EGABAR = −75 mV (Rothman et al., 2009). This tonic conductance, along with Em, determined the resting membrane potential (Vrest) of the 242 models, which had a distribution resembling that of Em (−79.9 ± 5.3 mV) but was narrower and slightly more depolarized (Vrest = −78.4 ± 3.7 mV). Each GC model was given 4 independent MF synaptic inputs (i = 1–4) each assigned a GAMPAR value randomly sampled from a conductance distribution computed previously (Sargent et al., 2005, their Fig. 1C) (current values were converted to conductance assuming a −76 mV holding potential and −6 mV liquid junction potential). Average GAMPAR of the 4 MF inputs per GC was 0.64 ± 0.25 nS for the 242 models. Values for GNMDAR were such that the ratio of GNMDAR to GAMPAR, denoted as φ, was the same across all inputs. Simulations were computed for φ in the range 0–1.4. Reversal potentials EAMPAR and ENMDAR were set to 0 mV.
Figure 1.
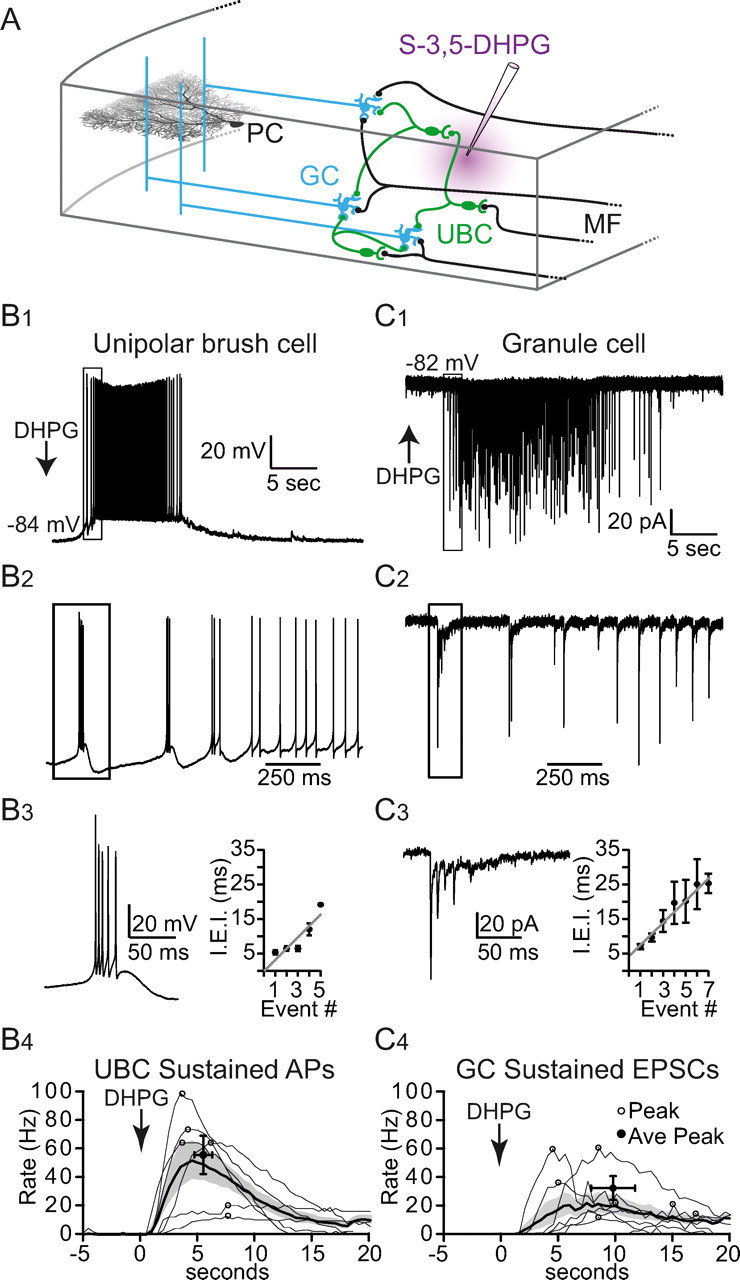
DHPG evokes asynchronous patterns of cerebellar MF-like activity that resembles in vivo activity. A, Simplified schematic of the vestibular cerebellum. Extrinsic MFs (black) convey vestibular afferent signals to GCs (blue) and UBCs (green) in the GC layer. UBC axons are called intrinsic MFs, which synapse onto the dendrites of GCs and other UBCs and therefore form a feedforward MF network. GCs integrate extrinsic and intrinsic MF activity and transmit this information to PCs via their axons, referred to as parallel fibers. As mGluR1 expression in the GC layer is restricted to UBCs, local pressure ejection of DHPG (purple) only excites UBCs. B1, A typical UBC voltage response to local pressure ejection of DHPG in the GC layer (arrow) is biphasic, consisting of a bursting phase of APs (boxed region) followed by a phase of sustained firing. B2, Enlargement of boxed region in B1 showing transition between AP bursting and sustained activity phase. B3, Enlargement of boxed region in B2 showing an individual burst of APs. Right, Plot of IEI versus AP number within the burst, and a line fit to the data. B4, Frequency of APs during sustained activity phase in UBCs. The average frequency (thick trace) and SEM (shaded region) for 1 s bins are displayed along with individual cell responses (thin traces). Circles denote time of peak frequencies. C1, GC synaptic currents recorded under voltage-clamp in response to local pressure ejection of DHPG, showing a biphasic pattern similar to that of the UBC APs in B1. C2, Enlargement of boxed region in C1 showing initial phase of EPSCs. C3, Enlargement of boxed region in C2 showing initial burst of EPSCs. Right, Plot of IEI versus EPSC number within the burst, and a line fit to the data. C4, Frequency of EPSCs during sustained activity phase in GCs. Average frequency, SEM and individual cell responses as for B4.
The time course of single NMDAR and AMPAR direct and spillover synaptic conductances were modeled with the following multiple-exponential equation:
 |
where te is the synaptic event time, τr is the rise-time constant, τd1, τd2, and τd3 are the decay-time constants, d1, d2, and d3 are the percentage amplitudes of the different components, and anorm is a normalization scale factor. Fitting this equation to isolated GC conductance waveforms (data from Rothman et al., 2009; DiGregorio et al., 2002, 2007; T = 35−37°C) gave the following parameters for the NMDAR component: n = 1.00, τr = 1.14 ms, d1 = 64.12%, τd1 = 8.10 ms, d2 = 35.88%, τd2 = 37.00 ms, d3 = 0%; the AMPAR direct component: n = 1.94, τr = 0.16 ms, d1 = 89.38%, τd1 = 0.32 ms, d2 = 9.57%, τd2 = 1.73 ms, d3 = 1.05%, τd3 = 19.69 ms; and the AMPAR spillover component: n = 1.74, τr = 0.38 ms, d1 = 42.78%, τd1 = 1.38 ms, d2 = 53.59%, τd2 = 7.27 ms, d3 = 3.63%, τd3 = 30.86 ms (see Fig. 8C legend for more details). These waveforms were normalized so their peaks equaled 1 (anorm = 71.90%, 32.07% and 62.39%, respectively).
Figure 8.
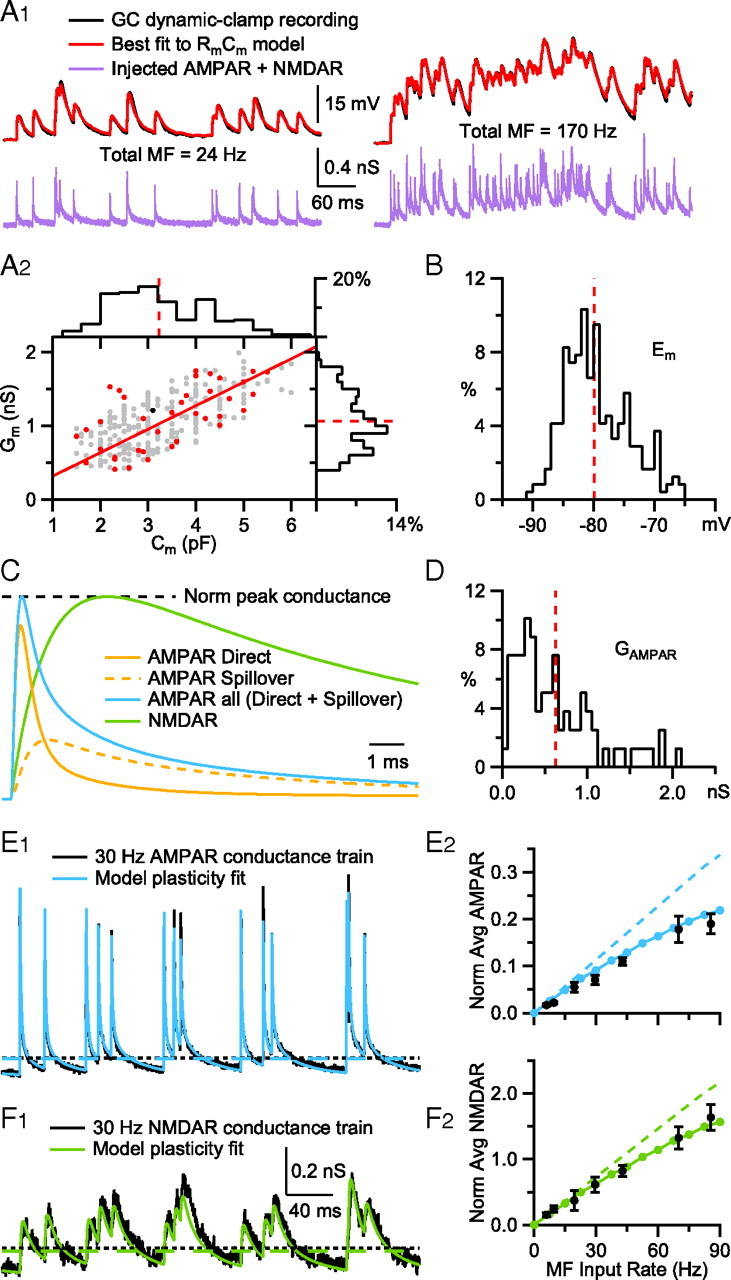
Conductance-based integrate-and-fire models mimic heterogeneity in GC membrane properties and MF synaptic input. A1, A simple RmCm model fit (red; Eq. 3) to the subthreshold voltage trajectory of a GC (black) during injection of a synaptic conductance train (purple) injected via dynamic clamp. The injected conductance train consisted of the sum of 4 different MF inputs, for a sum total rate (Total MF) of 24 Hz (left) and 170 Hz (right). Similar fits were computed for 37 other GCs (data not shown). Data from Rothman et al. (2009). A2, Relationship between membrane conductance (Gm; estimated from RmCm model fits as in A1, red circles; black circle denotes GC in A1) and membrane capacitance (Cm measured in voltage clamp) for 38 GCs, together with a linear fit (red line; Gm = Cm · 318.6 pS/pF; R2 = 0.89, p < 0.001). Gray symbols show passive properties for 204 additional GCs, estimated using their experimentally measured Cm and the linear relation and the residual distribution (differences between the line fit and data points, which were well described by a normal distribution between −0.5 and 0.5 nS; data not shown) to generate appropriate Gm values. Histograms show distributions of Cm and Gm for the full GC population in bins of 0.4 pF and 0.1 nS, with average values (red dashed lines; 3.22 ± 1.02 pF and 1.06 ± 0.37 nS). B, Membrane reversal potential (Em) measured from 242 GCs in the presence of inhibitory blockers. Dashed line denotes average (−79.9 ± 5.3 mV). C, Time course of model AMPAR conductance (AMPAR all, blue; Eq. 5; peak normalized to one) and underlying spillover (dashed orange) and direct (solid orange) components with a peak ratio of 0.34. The 10–90% rise times of the direct, spillover and summed components were 0.17, 0.57, and 0.17 ms, respectively, as in the work of DiGregorio et al. (2002). The decay of “AMPAR all” was fit by a double-exponential function with fast and slow components (A1 = 74%, τ1 = 1.15, A2 = 24%, τ2 = 9.71) that closely matched those of the isolated AMPAR currents in this study. The model NMDAR conductance waveform (green, NMDAR; Eq. 5; peak normalized to one) had a 10–90% rise time of 1.4 ms, which matches that of NMDAR EPSCs recorded at MF-GC synapses (n = 4; data from Rothman et al., 2009), and a single-exponential decay time constant of 24.7 ms, which matches that of the isolated NMDAR currents in this study (Fig. 5B). D, Distribution of mean peak AMPAR conductances (GAMPAR) for single MF synapses. Dashed line denotes average (0.63 ± 0.48 nS, n = 79). Data from Sargent et al. (2005), their Figure 1C. E1, Fit of the plasticity model (blue; Eq. 6) to a 30 Hz MF-GC AMPAR conductance train (black). The fitting routine minimized the sum of squared residuals of the two conductance trains, not the peak amplitudes. Dashed lines denote time-averaged conductance values for the data (black) and fit (blue) measured at t >100 ms from the onset of synaptic input. Data from Rothman et al. (2009). E2, Time-averaged AMPAR conductance (dashed lines in E1) as a function of the input rate of a single MF, for real GCs (black circles; n = 4; SEM; Rothman et al., 2009) and the synaptic model (blue circles). Conductance trains were normalized so the amplitude of the first synaptic input equaled one. For comparison, model gAMPAR with no plasticity is shown as the dashed line. F1 and F2, Same as E1 and E2, but for the unblocked NMDAR conductance (green). Data in F1 were low-passed filtered at 1 kHz for presentation.
Short-term plasticity of the NMDAR and AMPAR conductances were implemented with the depression (D) and facilitation (F) dynamic variables of Varela et al. (1997) (A = A0DF); however we modeled the increment factor of F as a multiplicative operation, like D, rather than an additive operation. In this model, after each synaptic input, D was multiplied by a constant d, and F by a constant f:
Between events, both D and F recovered exponentially back to their initial values of 1.0 with time constants τD and τF. Fitting this model to Poisson-like trains of synaptic currents recorded from single MF-GC connections (mean rates 6–140 Hz) gave the following plasticity parameters for the NMDAR component: d = 0.9, τD = 70 ms, f = 1.7, τF = 3.5 ms; the AMPAR direct component: d = 0.6, τD = 50 ms; and the AMPAR spillover component: d = 0.95, τD = 50 ms. A lower limit was placed on D of these 3 components so that D did not fall below the minimum D encountered in our fits to the data (Dmin = 0.1, 0.1 and 0.6 respectively). Similarly, an upper limit was placed on F (Fmax = 3.4 for the NMDAR component). Note the AMPAR direct and spillover components are well described without facilitation (i.e., f = 1.0), and the spillover component shows little depression (d = 0.95) compared with the direct component (d = 0.6). A final comparison of the time-averaged conductance of the model AMPAR and NMDAR components to that of real data confirmed that the plasticity models faithfully reproduce the time-averaged conductance levels recorded at MF-GC synapses.
Trains of random synaptic event times (te) for each MF input were computed for a given mean frequency. Trains were given an absolute refractory period by requiring event times to be at least 1 ms apart. Trains of event times were converted to NMDAR conductance trains (ΔNMDAR(t) in Eq. 3) using the NMDAR waveform defined by Equation 5, and the successive peak amplitudes were scaled by the plasticity scale factors defined by Equation 6. AMPAR conductance trains (ΔAMPAR(t) in Eq. 3) were computed in a similar manner, except for having separate direct and spillover components. These two components were scaled so that the ratio of their peaks of the first synaptic event (which has no depression or facilitation) equaled 0.34, the average value reported by DiGregorio et al. (2002) (slow:fast amplitude ratio). After the direct and spillover components were added together, the final train, ΔAMPAR(t), was scaled so that the peak of the first synaptic event equaled one. Final trains were then scaled by GNMDAR and GAMPAR as defined in Equation 3.
APs were generated when the model's membrane potential V reached a threshold of −40 mV, at which time V was set to 32 mV for one integration time step, then clamped to −63 mV for a refractory period of 2.0 ms. These parameters were based on measurements from 38 GCs (Rothman et al., 2009). A 2.0 ms refractory period was chosen since this represents the smallest interspike interval observed during high rates of GC firing.
Equation 3 was solved with a fourth-order Runge-Kutta algorithm using a 10 μs time step. The total simulation time varied between 15 and 50 s depending on the MF input rate (15 s at the highest MF input rate of 90 Hz, and 50 s at the lowest MF input rate of 7.5 Hz). Steady-state action potential (AP) rate and percentage conductance values were computed for times >100 ms from the onset of the first MF input. Simulation code was written in Java. Data were analyzed in IGOR Pro using NeuroMatic software (http://www.neuromatic.thinkrandom.com/).
Statistics.
Variability is presented as SD, unless otherwise noted as SEM. For standard normal distributions (determined using the Shapiro-Wilk test), the statistical significance was calculated using a Student's t test. For nonparametric distributions, a Mann–Whitney test was used, and is noted in the text. Statistical significance of normalized data was determined from raw data, before normalization. For PC extracellular recordings the standard score, or z-score, was calculated for each bin (500 ms) in comparison with bins recorded from 0 to 10 s before pressure ejection of DHPG. The peak z-score was calculated as the bin with the largest value averaged with its 4 adjacent bins.
Results
A large fraction of vestibular MF afferents terminate on UBCs, a glutamatergic interneuron concentrated in the vestibular cerebellum (Diño et al., 2001). UBCs relay and redistribute excitatory inputs from extrinsic MFs by projecting an intrinsic network of axons that make synaptic contacts with other UBCs and GCs within glomerular synaptic structures (Fig. 1A) (Berthié and Axelrad, 1994). Immunohistochemical studies in the mouse have identified mGluR1 and Calretinin as specific markers for two complementary subpopulations of UBCs (Nunzi et al., 2002), of which mGluR1-expressing UBCs are the source of ∼30% of all MFs in the lobule X (Nunzi and Mugnaini, 2000). As mGluR1 expression in the GC layer is restricted to UBCs (Nunzi et al., 2002), we examined the possibility of producing MF excitation by selectively activating the mGluR1 UBC MF network.
DHPG evokes asynchronous time-varying patterns of MF activity as observed in vivo
To examine whether we could pharmacologically activate the UBC network, we made whole-cell current-clamp recordings from UBCs while applying brief (<300 ms) local pressure ejection of the mGluR1 agonist DHPG 100–200 μm deep within the GC layer (Fig. 1A). Results show a biphasic response of AP firing (Fig. 1B1,B2) consisting of several brief high-frequency bursts of APs (4 of 6 cells) followed by a sustained depolarization and firing (6 of 6 cells). In the bursting phase (Fig. 1B3), the UBC membrane potential rose from −83.5 ± 5.6 mV to −65.6 ± 2.3 mV and produced an average AP firing rate of 166.0 ± 32.3 Hz (n = 4). In the sustained activity phase, the membrane potential peaked at a similar value (−65.5 ± 5.9 mV) but firing reached a lower peak rate (55.4 ± 32.9 Hz, peak occurred 5.3 ± 1.9 s after DHPG application, n = 6; Fig. 1B4). The duration of the sustained phase, determined as the time period in which the firing rate was at least 15% of the peak, varied from 11 to 38 s (average 20.61 ± 11.8 s, n = 6).
Next, we examined the downstream effects of stimulating UBCs with DHPG by making whole-cell voltage-clamp recordings from GCs. Responses to DHPG were detectable in 90 of 191 GCs. These responses mirrored the patterns of activity evoked in UBCs, where high-frequency bursts of EPSCs (85–178 Hz, average 106 ± 43.6 Hz, n = 7) preceded time-varying sustained activity (21–60 Hz, peak rate 31.3 ± 20.8 Hz, n = 7; Fig. 1C1,C2). During the burst, the average inter-event interval (IEI) lengthened with each successive event (Fig. 1C3, linear slope = 3.38 ± 0.92 ms/event) similar to AP firing in UBCs (Fig. 1B3, linear slope = 3.27 ± 0.30 ms/event). The average duration of the sustained EPSC input to GCs (17.8 ± 8.54 s, n = 7) was similar to that of the UBC responses given above (p > 0.05). That the rate and duration profiles of GC EPSCs parallel the UBC spiking activity suggests that most of the GCs we recorded from responded to a single UBC MF input. There were, however, a small number of GCs (n = 4) that exhibited bursts of synaptic events during the sustained activity phase, suggesting these GCs were innervated by two different UBC MF inputs.
The specificity of DHPG for activating UBCs and the close resemblance of the 10–60 Hz GC EPSC responses to the range of frequencies recorded in vivo during behaviorally relevant stimuli in the C3 zone of the cat (10–300 Hz MF activity, Jörntell and Ekerot, 2006; Bengtsson and Jörntell, 2009), in the mouse flocculus (5–60 Hz, Arenz et al., 2008) and in the mouse nodulus-vermis (5–10 Hz; Barmack and Yakhnitsa, 2008) suggests that DHPG can provide a useful tool for studying signal processing within the cerebellar cortex.
Asynchronous UBC MF activity modulates cerebellar output in an NMDAR-dependent manner
To examine the role of AMPARs and NMDARs in the transfer of information through the cerebellar cortex, we made extracellular recordings of PCs while stimulating UBC MFs in the GC layer with DHPG (Fig. 1A). Since PCs express mGluR1 (Martin et al., 1992; Nunzi et al., 2003) we ensured that the DHPG ejection pipette was located deep within the GC layer, away from the target PC. To check that DHPG was not acting directly on the PCs, we repeated the DHPG application in the presence of glutamatergic receptor blockers. Of the 20 PC recordings, 4 PCs exhibited a direct DHPG effect and were therefore discarded. Two other PCs exhibited up and down states and were also discarded. The 14 remaining PCs all displayed spontaneous regular firing (28.7 ± 10.6 Hz; n = 14; Fig. 2A1). After DHPG pressure ejection, the spontaneous firing rate significantly increased in 12 PCs (Fig. 2A2), peaking 3.7 ± 2.2 s after DHPG pressure ejection, and remained elevated (>2 SDs above baseline) for 8.2 ± 2.8 s. Calculated in terms of SDs, or z-score, the average peak frequency modulation for all PCs was 8.7 ± 6.9 (Fig. 2A3). DHPG modulation of PC firing was eliminated by bath application of 5 μm NBQX in the 6 PCs tested, as expected when AMPARs at the GC-PC synapse are blocked (Fig. 2A4, ANOVA, F(1,13) = 10.59, p < 0.05, 1.8 ± 1.5 peak z-score). Surprisingly, bath application of the NMDAR antagonist APV (50 μm) also eliminated the modulation of PC firing (Fig. 2A4, ANOVA, F(1,13) = 10.15 p < 0.05, APV peak z-score 2.1 ± 1.4, n = 6). Since NMDARs are not expressed postsynaptically in PC parallel-fiber spines in mature rats (Perkel et al., 1990; Momiyama et al., 1996; Casado et al., 2000), this suggests that NMDARs upstream of the GC-PC synapse are necessary for transmission of signals through the GC layer.
Figure 2.
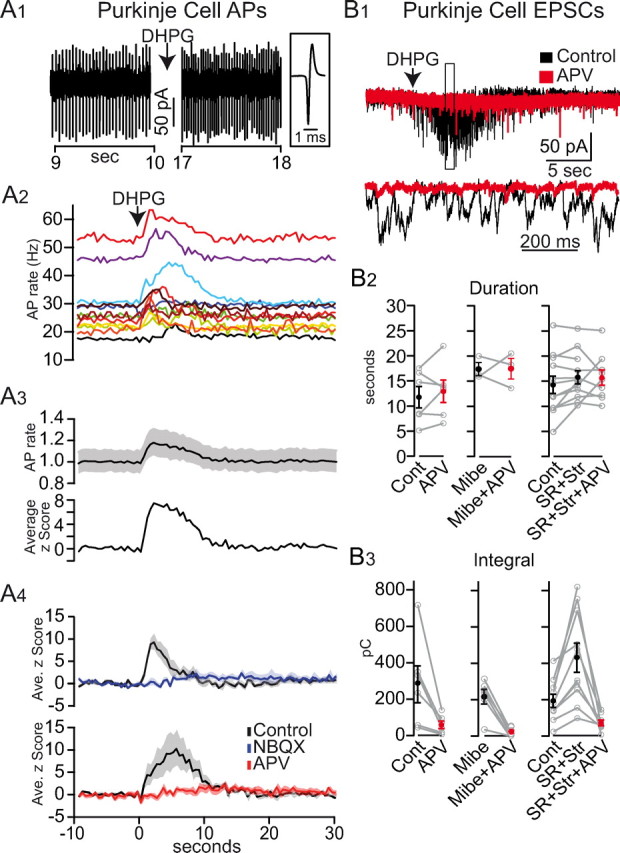
Asynchronous UBC MF activity modulates cerebellar cortex output in an NMDAR-dependent manner. A1, Extracellular PC recording showing an increase in AP rate from 30 to 43 Hz after pressure ejection of DHPG in the GC layer. Right, A single AP on expanded time scale. A2, DHPG increased the AP rate in 12 PCs (rate computed in 500 ms bins). A3, Normalized average rate (black line) and SEM (shaded region) of the traces in A2. Bottom, Average z-score of the same traces. A4, Z-score of AP rate before (black) and after application of 5 μm NBQX (blue) or 50 μm APV (red). Shaded regions denote SEM. B1, Example traces of EPSCs recorded in PCs in response to puff application of DHPG in the GC layer (arrow) in control (black) and APV (red). Below, enlargement of boxed region. B2, Duration of the synaptic responses in PCs for various drug conditions. Cont, Control; Mibe, 1 μm Mibefradil; SR, 1 μm SR-95531; Str, 500 nm Strychnine. B3, Charge integral of the synaptic responses in PCs for various drug conditions as in B2.
To quantify the synaptic activity underlying this NMDAR-dependent modulation of PC firing, we repeated the above experiments while making whole-cell voltage-clamp recordings from PCs. Pressure ejection of DHPG in the GC layer evoked PC responses characterized by intense bouts of synaptic activity (Fig. 2B1). The bouts of synaptic activity lasted on average 14.25 ± 5.94 s (Fig. 2B2), a duration comparable to the activity evoked by DHPG in UBCs (APs, p > 0.05) and GCs (EPSCs, p > 0.05). We quantified the PC response by calculating the integral, or charge, of the synaptic current, giving an average of 224 ± 167 pC (n = 18; control conditions). Consistent with our extracellular recordings, bath application of APV dramatically inhibited the synaptic response to 21% of the control value (Fig. 2B3, 288 ± 247 pC in control vs 61 ± 50 pC in APV, p < 0.05, n = 6). Potential direct effects of DHPG on PCs were minimized in these experiments by buffering internal calcium with 16 mm BAPTA, which strongly inhibits mGluR1-mediated inward currents in PCs (Galante and Diana, 2004). Moreover, tonic PC currents, indicative of a direct effect of DHPG, were not observed in the time window between pressure ejection of DHPG and the start of the synaptic response (n = 18), and the profound inhibitory effect of APV indicated any direct DHPG-mGluR1 activation was minimal. These results demonstrate that NMDARs play a key role in the transmission of information through the GC layer.
The high-frequency bursting phase is not essential for GC layer throughput
Sensory stimuli encoded by brief high-frequency MF bursts have been shown to be efficiently transmitted by GCs (Chadderton et al., 2004; Rancz et al., 2007; Barmack and Yakhnitsa, 2008; Rothman et al., 2009; Sawtell, 2010) due to amplification by synaptic NMDARs (D'Angelo et al., 1995; Mapelli et al., 2010). Hence, we wondered whether the DHPG-evoked activity recorded in PCs may result from the selective transmission of UBC high-frequency bursts by GCs. To test this, we used Mibefradil, a preferential, but not specific, T-type calcium-channel antagonist (Mehrke et al., 1994; Viana et al., 1997; McDonough and Bean, 1998) that has been shown to inhibit high-frequency bursts in UBCs (Diana et al., 2007). In the presence of 1 μm Mibefradil, we observed no DHPG-evoked high-frequency bursts of APs in UBCs (n = 6) nor the corresponding bursts of EPSCs in GCs (n = 7; data not shown). DHPG-evoked synaptic responses recorded from PCs were not significantly reduced in the presence of Mibefradil (Fig. 2B3, 224 ± 167 pC in control, n = 18, vs 216 ± 97 pC in Mibefradil, n = 6; p > 0.05, Mann–Whitney). Hence, these results suggest the high-frequency bursts are not essential for transmitting signals through the GC layer.
Interestingly, we found that when high-frequency bursts were suppressed by Mibefradil, the inhibition by APV of the synaptic current integral recorded in PCs (Fig. 2B3, 78 ± 11% in control, n = 6) was significantly enhanced (90 ± 7%, n = 6; p < 0.05, Mann–Whitney). This indicates that transmission of activity through the GC layer during the sustained phase displays a greater dependence on NMDARs than during the bursting phase. Thus, at the low frequencies observed during the sustained phase, the slow kinetics of the NMDAR current contributes strongly to temporal summation. These results show that the sustained phase of UBC activation underlies the majority of DHPG-mediated synaptic input onto PCs, and that NMDARs play a key role in transmitting this low-frequency asynchronous input.
NMDAR dependence of GC layer transmission persists in the absence of inhibition
Within the vestibular cerebellum, Golgi cells provide inhibitory input to both UBCs and GCs (Dugué et al., 2005). In addition, GCs receive tonic and slow spillover inhibitory components that produce shunting inhibition (Brickley et al., 1996; Rossi et al., 2003) which can modulate the gain of the GC layer (Hamann et al., 2002; Mitchell and Silver, 2003; Rothman et al., 2009). To test the impact of inhibitory GABAR and glycinergic currents on the transfer function of the GC layer during DHPG stimulation, we measured the synaptic current integral in PCs before and after bath application of 1 μm SR-95531 (SR) and 1 μm strychnine (Str) (Fig. 2B3). Blocking inhibitory currents produced a 2.2-fold increase in the integral of PC EPSCs (from 191 ± 107 pC in control to 417 ± 237 pC in SR + Str, n = 12; p < 0.05, Mann–Whitney). Thus, transmission of asynchronous patterns of intrinsic UBC MF activity to the molecular layer is highly modulated by inhibition, as with synchronized activity evoked by electrical stimulation in vitro (Hamann et al., 2002). However, blocking inhibition did not significantly alter the duration of the PC response (Fig. 2B2, 15.80 ± 4.57 s in SR + Str, n = 12; p > 0.05, Mann–Whitney), suggesting that UBC excitability was not altered. Even at this heightened level of GC layer gain, application of APV reduced the PC synaptic response to 15.2% of control (Fig. 2B3, 65.8 ± 43.6 pC in SR + Str + APV p < 0.001, Mann–Whitney). These results highlight the powerful influence of inhibitory currents and NMDARs on GC layer throughput.
Blocking NMDARs does not affect UBC activity
Within the GC layer, both UBCs (Kinney and Slater, 1993) and GCs (Silver et al., 1992; Farrant et al., 1994; Monyer et al., 1994; D'Angelo et al., 1995; Feldmeyer and Cull-Candy, 1996; Takahashi et al., 1996; Cathala et al., 2000) express NMDARs of different molecular subtypes (Billups et al., 2002). Since UBC axons may innervate other UBCs, APV may decrease the synaptic drive received by GCs during DHPG application by either blocking NMDARs at UBC-UBC synapses or UBC-GC synapses. To distinguish between these two possibilities, we compared the frequency and response duration of EPSCs evoked by DHPG in GCs before and after application of APV (Fig. 3A). Results show neither the average EPSC frequency (114 ± 27 Hz in control vs 108 ± 32 Hz in APV, p > 0.05) nor the response duration (61 ± 25 ms in control vs 68 ± 23 ms in APV, p > 0.05) of the high-frequency bursts were altered by APV (Fig. 3B). Furthermore, APV did not significantly alter the frequency or response duration during the sustained activity phase (Fig. 3C, sustained frequency: ANOVA, F(1,57) = 0.07 p > 0.05). The lack of an effect of APV on the frequency and time characteristics of GC EPSCs evoked by DHPG-UBC stimulation indicates that APV is not inhibiting GC layer transmission by acting at UBC-UBC synapses.
Figure 3.

NMDARs downstream of UBCs enable GC layer signaling. A, DHPG-evoked synaptic currents recorded in GCs held at −82 or +18 mV in control conditions (black) and 50 μm APV (red). Integration of synaptic currents is illustrated by the shaded region. Traces at bottom show enlargement of boxed regions. B, Comparison of EPSC rate and duration of each burst in control and APV. C, EPSC rate (computed in 1 s bins) in control (black) and APV (red). Shaded regions denote SEM. Holding potential was −82 mV. DHPG was applied at time 0. D, Average integral of the GC synaptic current in APV (red) and APV + NBQX (blue) normalized to control conditions during the bursting and sustained activity phase at −82 or +18 mV.
GC NMDAR EPSCs are not altered by DHPG
Since mGluR1 activation can potentially modulate a variety of conductances (Ferraguti et al., 2008) we examined the direct effect of DHPG on GC EPSCs evoked by electrical stimulation of MFs. We found the total charge of the GC NMDAR component, isolated by application of 5 μm NBQX, was unaltered by bath application of 50 μm DHPG (data not shown, 0.14 ± 0.08 vs 0.12 ± 0.07 pC, n = 4, p > 0.05). A final application of APV abolished the synaptic response (0.02 ± 0.01 pC, n = 4, p < 0.05). Hence, these results show no direct effect of DHPG on GC EPSCs, which is consistent with immunohistochemical results showing no detectable expression of mGluR1 in GCs (Nunzi et al., 2002).
NMDARs contribute a substantial fraction of charge at UBC MF-GC synapses
To quantify the charge carried by GC NMDARs during intrinsic UBC-MF excitation, we quantified the ratio of the NMDAR and AMPAR components in GCs by comparing the synaptic charge before and after application of APV (Fig. 3A). At depolarized potentials (+18 mV), where voltage-dependent Mg2+ block of NMDARs is reduced, the NMDAR component accounted for 80% of the total synaptic charge in both the bursting phase (Fig. 3D, 80.67 ± 9.46%, n = 3) and sustained activity phase (80.5 ± 20.1%, n = 4). Strikingly, when GCs were voltage-clamped near their resting membrane potential (−82 mV), NMDARs still carried a substantial fraction of the total synaptic charge in both the bursting phase (Fig. 3D, 46.0 ± 17.3%, n = 4) and sustained activity phase (42.5 ± 17.4%, n = 7). Coapplication of APV and NBQX eliminated the remaining synaptic response during the bursting phase (4.0 ± 3.4% of control at −82 mV, n = 4, p < 0.05; 2.0 ± 5.0% of control at +18 mV, n = 4, p < 0.05, significance refers to change after application of NBQX) and during the sustained activity phase (5.6 ± 7% of control at −82 mV, n = 7, p < 0.05; 13 ± 16% of control at +18 mV, n = 6, p > 0.05, significance refers to change after application of NBQX). Alternatively, it is possible to estimate the NMDAR charge contribution by integrating individual NMDAR EPSC bursts (in contrast to integrating the entire bursting phase) isolated in NBQX. This analysis revealed a slightly smaller NMDAR component ratio of 39 ± 13% at −82 mV (n = 6, p < 0.05 vs control, p > 0.05 vs integral of all bursts). Together, these results indicate that NMDARs expressed by GCs contribute nearly half of the synaptic charge during GC integration at subthreshold potentials.
NMDARs at the UBC MF-GC synapse have a weak voltage dependence and a pharmacological profile consistent with GluN2C-containing receptors
To understand why NMDARs contribute such a large fraction to the MF-GC synaptic charge, even at hyperpolarized potentials, we examined the current–voltage relationship of GC synaptic NMDARs. During whole-cell recordings from GCs, application of NBQX unveiled a steady-state NMDAR conductance at both resting and depolarized membrane potentials during sustained DHPG-evoked synaptic inputs (>25 Hz; Fig. 4A1, black trace). To determine the voltage dependence of this NMDAR conductance, 2 s voltage ramps from +28 mV to −92 mV were applied during DHPG stimulation. Subtraction of voltage ramps in the absence of DHPG stimulation (Fig. 4A1) revealed the resulting synaptic NMDAR current (Fig. 4A2, n = 4) reversed at 2.4 mV and showed an incomplete Mg2+ block at hyperpolarized potentials. This current–voltage curve was fit according to a Woodhull formalism (Eqs. 1 and 2; Fig. 4A2; Woodhull, 1973) that accounts for voltage-dependent block by external Mg2+ and for permeation of Mg2+ through the channel (Kupper et al., 1998). The fit yielded a position of the blocking site at 34% within the membrane field and a Mg2+ permeation at 0 mV of 0.9% relative to the off-rate of Mg2+ (C2/C1). The mean unblocked NMDAR conductance was 400 pS, leading to a current of −2.6 pA at −80 mV. The overall voltage-dependent behavior (Fig. 4A2) is consistent with channels containing GluN2C subunits (Cathala et al., 2000; Rossi et al., 2002; Qian et al., 2005) or GluN2D subunits. It is also consistent with Woodhull fits of previously published experimental results obtained in mature animals (Fig. 4B; Rothman et al., 2009) but not in younger animals (Takahashi et al., 1996) which predominantly express GluN2A/B subunits (Monyer et al., 1994).
To further test whether GluN2C-containing NMDARs are responsible for transmission of signals through the GC layer, we investigated the effect of subunit-specific noncompetitive NMDAR antagonists on GC EPSCs recorded in PCs. At low concentrations, Zn2+ ions have been shown to specifically inhibit homomeric GluN2A-containing NMDARs (Paoletti et al., 1997; Fayyazuddin et al., 2000; Bidoret et al., 2009), while the ifenprodil analog Ro25-6981 (300 nm) selectively inhibits GluN2B over GluN2A and GluN2C-containing NMDARs (Fischer et al., 1997; Bidoret et al., 2009). To rule out possible effects of inhibitory transmission on GC throughput, we measured PC synaptic currents in the presence of 1 μm Strychnine and 1 μm SR-95531, which had the combined effect of increasing the integral of the synaptic currents (Fig. 4C, 249 ± 3% of control, p < 0.01, SEM, n = 10). Bath application of 1.2 μm free Zn2+ (Paoletti et al., 1997) did not significantly alter the integral of synaptic responses evoked by DHPG, confirming that homomeric GluN2A-containing NMDARs do not contribute to GC output (Fig. 4C, 108 ± 10% of the response in Strychnine and SR-95531, p > 0.05, SEM, n = 6). Similarly, application of the GluN2B-specific antagonist Ro25-6981 (300 nm) had no significant effect on the PC response (Fig. 4C, 82 ± 8% of the response in Zn2+, p > 0.05, SEM, n = 9). The remaining synaptic response was dramatically inhibited by application of 50 μm APV (18 ± 6% of the response in Ro25-6981, p < 0.01, SEM, n = 8). The lack of a significant inhibitory effect of Zn2+ on the PC response does not exclude the presence of tri-heteromeric GluN2A/C-containing NMDARs which display <20% sensitivity to micromolar Zn2+ inhibition compared with homomeric GluN2A-containing NMDARs (Hatton and Paoletti, 2005). The pharmacological profile and the developmental expression of GluN2C subunits in GCs (rather than GluN2D; Farrant et al., 1994; Monyer et al., 1994; Feldmeyer and Cull-Candy, 1996; Takahashi et al., 1996), together with the incomplete Mg2+ block observed in GC recordings, all indicate that transmission of MF signals through the GC layer is dependent on GluN2C-containing NMDARs.
Amplitude and kinetics of the AMPAR and NMDAR components of UBC-GC EPSCs
The capacity of synaptic currents to trigger APs depends on their charge content and on the frequency-dependent summation of their slowest components. We therefore examined the kinetics and component ratios of isolated EPSCs (IEI > 100 ms) evoked by DHPG stimulation. Isolated events were characterized by an average amplitude of −37.9 ± 19.8 pA (Fig. 5A2, n = 10) comparable to in vivo studies (10–40 pA, Arenz et al., 2008; ∼45 pA, Rancz et al., 2007) and in vitro studies (19.7 pA, Cathala et al., 2000; ∼54 pA, DiGregorio et al., 2002; Chadderton et al., 2004; Saviane and Silver, 2006). The average 20–80% rise time (Fig. 5A2, 233 ± 14 μs) also matched well with previous reports (190 ± 30 μs, DiGregorio et al., 2002; 150 ± 10 μs, Cathala et al., 2003). Synaptic currents at the MF-GC synapse consist of at least three kinetic components: a fast decay component mediated by direct excitation of rapidly desensitizing AMPARs, a second slower component attributed to activation of AMPARs by glutamate spillover onto adjacent synapses (DiGregorio et al., 2002) and up to 2 slower NMDAR-mediated components (Cathala et al., 2000; Zhang et al., 2008). We characterized the kinetics of the NMDAR component by fitting EPSCs before and after application of 50 μm APV. Because the small amplitude of the NMDAR component yields imprecision in the curve fit, we increased the scale of the NMDAR component by integrating the EPSCs and extracting the NMDAR component by subtraction of the integral EPSC in APV from that in control conditions (Fig. 5A1). Fitting the subtracted integral with a mono-exponential function revealed an NMDAR decay time constant of 29 ± 11 ms (Fig. 5A3). The size of the NMDAR component was quite variable, but on average comprised ∼35% of the total charge of the EPSC (Fig. 5A3, 35 ± 20%, or 63 ± 36 fC, amplitude 2.8 ± 2.4 pA). This is slightly smaller than the NMDAR-component ratio measured during the entire bursting phase (∼46%) and for individual bursts (∼39%). The discrepancy is likely due to the relatively short time window (100 ms) from which events were selected, which may have prevented detection of a second slower decay component (Cathala et al., 2000). These results indicate that the NMDAR synaptic conductance decays more slowly than the AMPAR spillover component (DiGregorio et al., 2002) and will therefore contribute more efficiently to temporal summation at intermediate frequencies.
Figure 5.
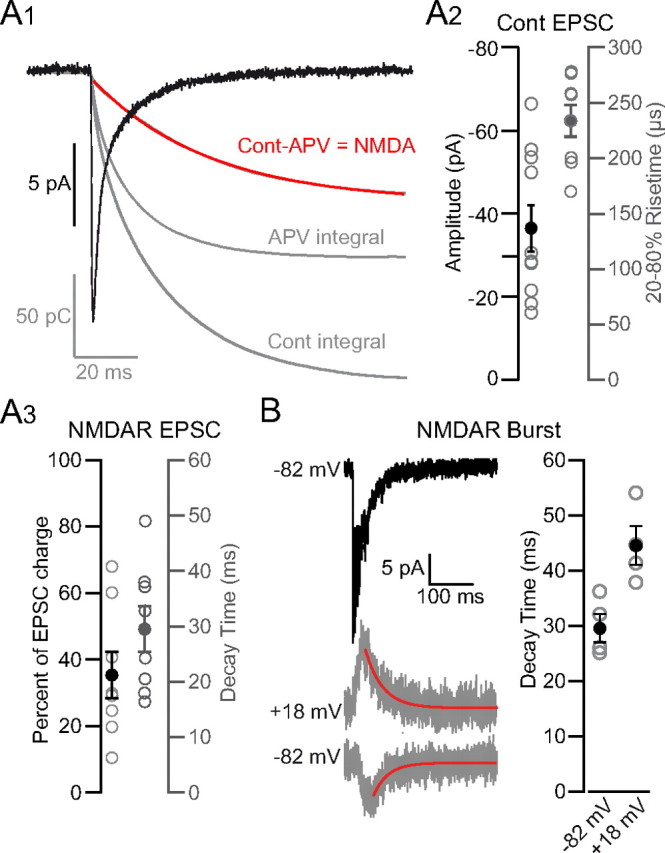
Amplitude and kinetics of AMPAR and NMDAR components of UBC MF-GC EPSCs. A1, GC EPSC recorded at −82 mV during DHPG stimulation obtained by averaging synaptic events isolated by >100 ms (black trace). The EPSC integrals in control and APV are shown in gray. Subtraction of the integral in APV from the integral in control conditions gives the kinetics of charge due to NMDARs, which is fit with a single exponential (red trace). A2, Amplitude (left) and 20–80% rise time constant (right) of EPSCs isolated by >100 ms. Filled circles represent the average value. A3, Percentage of the total charge carried by NMDARs (left). Decay time constant of the NMDAR component (right). B, Top, EPSC burst recorded at −82 mV. Bottom, NMDAR bursts isolated with NBQX at +18 and −82 mV and a single exponential fit (red trace). Right, Decay time constant of NMDAR component determined from isolated bursts.
Although the small amplitude of the NMDAR component in individual EPSCs prevented a direct fit of the current, it was possible to measure the decay kinetics of isolated NMDAR currents that summed during high-frequency bursts. At −82 mV, the average decay was nearly identical to decay time constants measured for individual EPSCs (Fig. 5B, 29.9 ± 5.2 ms, n = 4). The decay was slightly longer at +18 mV (Fig. 5B, 44.7 ± 7.0 ms, n = 4) consistent with previous studies demonstrating a prolonged decay of NMDAR-mediated currents at depolarized potentials (Konnerth et al., 1990; D'Angelo et al., 1994; Kirson and Yaari, 1996; Clarke and Johnson, 2008). Thus our overall results are in accordance with those of a previous study showing relatively fast NMDAR decay kinetics paralleled by a decreased sensitivity to Mg2+ in P21 rats (Cathala et al., 2000) (22−25°C) (biexponential fit weighted decay = 75 ± 7 ms). Together, the kinetics and pharmacology of the NMDAR component suggest the involvement of tri-heteromeric receptors containing GluN1/GluN2A/GluN2C subunits (Cathala et al., 2000).
Short-term plasticity at intrinsic and extrinsic MF synapses onto GCs are similar
Short-term plasticity is an important factor affecting frequency-dependent integration. At extrinsic MF-GC synapses, short-term plasticity is characterized by robust presynaptic release and cumulative postsynaptic depression of the fast AMPAR component due to desensitization (Saviane and Silver, 2006; DiGregorio et al., 2007; Hallermann et al., 2010). While intrinsic UBC MFs and extrinsic MFs form structurally similar glomeruli (Berthié and Axelrad, 1994), the time-dependent properties of UBC-GC transmission have yet to be studied. We therefore investigated short-term depression during DHPG-evoked UBC-MF high-frequency bursts and low-frequency sustained activity.
Consistent with findings at extrinsic synapses in vivo and in vitro (Xu-Friedman and Regehr, 2003; Saviane and Silver, 2006; Rancz et al., 2007), EPSCs within the burst (85–178 Hz) depressed rapidly (Fig. 6A1–A3). On average the second EPSC of a burst, which occurred 7.0 ± 2.1 ms after the first EPSC, depressed to 52.6 ± 12.5%, while the fifth EPSCs depressed to 34.4 ± 19.5% of the first EPSC (55 ± 27 ms after the first EPSC). Significant depression was observed from the first through fourth EPSC (p < 0.001, Mann–Whitney), whereas no further decrease in amplitude was observed after the fourth EPSC (0.36 ± 0.21% vs 0.34 ± 0.20%, Mann–Whitney p > 0.05). To estimate the extent of short-term depression during the sustained phase of activity, we plotted the average peak EPSC amplitude versus the frequency of EPSCs for 1 s bins (Fig. 6B). These plots indicate a similar qualitative behavior of EPSC depression, although less pronounced. Linear fits of these data show a negative correlation in 6 of 7 cells for frequencies up to 100 Hz (initial amplitude equaled 55 ± 25 pA, average slope equaled −0.51 ± 0.36 pA/Hz, n = 6). The remaining cell exhibited relatively small initial event amplitudes and displayed no correlation with frequency (31.5 pA with slope of 0.04 ± 0.05 pA/Hz). Thus, the amplitude of EPSCs in the sustained phase tends to depress with increasing frequency. Overall, short-term depression at intrinsic UBC MF-GC synapses is within the range of depression observed at extrinsic MF-GC synapses, where the contribution of the fast AMPAR-mediated currents diminishes with increasing frequency (40% and 34% at 100 Hz, respectively; Xu-Friedman and Regehr, 2003; Saviane and Silver, 2006).
Figure 6.
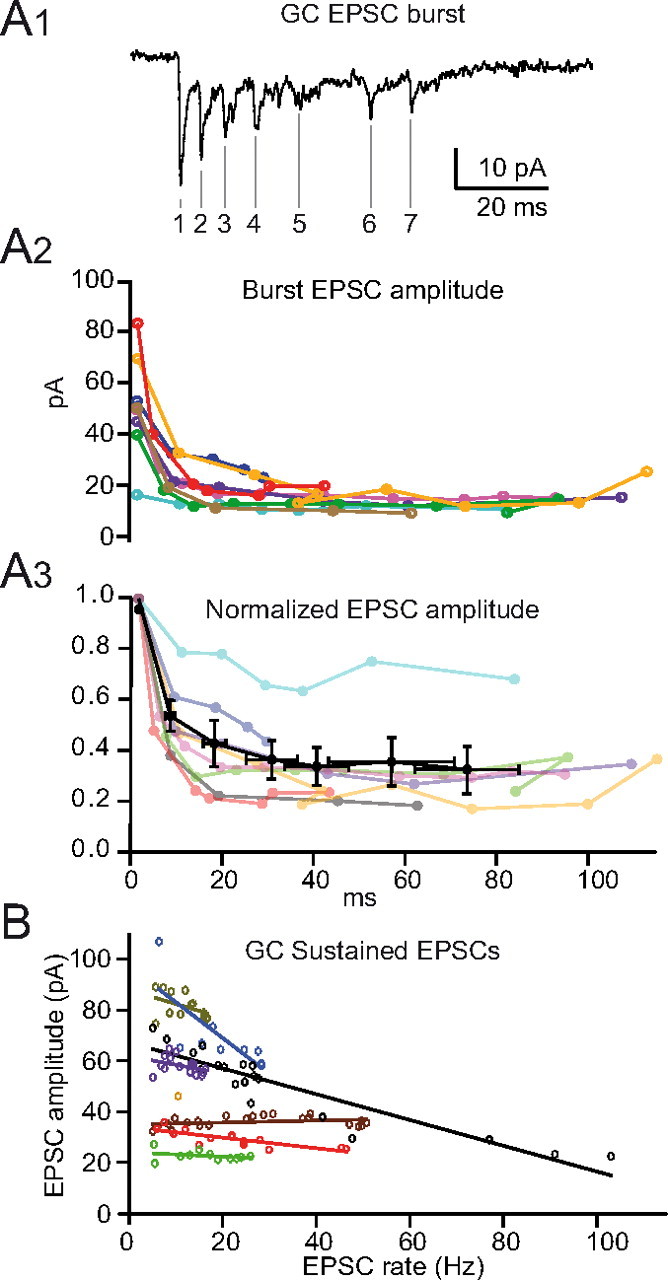
Short-term plasticity at UBC MF-GC synapses. A1, Example of a DHPG-evoked EPSC burst recorded in a GC held at −82 mV, with denoted EPSC number. A2, Amplitude of EPSCs during the burst for individual GCs shows short-term depression and a wide range of variability. A3, Short-term depression of EPSCs during the burst plotted as normalized average amplitude (black) and for individual cells (colors). B, Linear fits to the relationship between EPSC amplitude and frequency (1 s bins) for the sustained component of DHPG-evoked activity recorded in individual cells (colors).
In contrast to the combined EPSCs, NMDAR EPSCs do not show significant levels of depression at high frequencies. With 5.5 ± 2.5 EPSCs on average per burst (n = 243 bursts) and an average charge of 63 fC per isolated NMDAR EPSC, the independent summation of NMDAR EPSCs should yield 348 fC on average per burst. We measured an average total NMDAR charge of 342 ± 101 fC per burst, corresponding to 98% of the predicted value, arguing against saturation of the NMDARs even at high frequencies. This is in agreement with the observation that NMDARs are activated with low efficacy by synaptic release due to perisynaptic localization (Yamada et al., 2001; Petralia et al., 2002; Rossi et al., 2002; Cathala et al., 2003) and with the fact that GluN1/GluN2C receptors, in contrast to GluN1/GluN2A receptors, display no (Bidoret et al., 2009) or very little desensitization (Wyllie et al., 1998; Dravid et al., 2008). These results suggest that during sustained signaling, the fast AMPAR synaptic conductance will tend to depress at UBC MF-GC synapses, while the slower NMDAR and AMPAR spillover-mediated conductances, which exhibit little depression, will tend to summate.
GC input-output relationship during DHPG stimulation
To understand how NMDAR conductances contribute to the integrative behavior of GCs, we performed current-clamp recordings on GCs during DHPG stimulation. Because the small size of GCs leaves them highly susceptible to recording artifacts in current-clamp configuration (Gabbiani et al., 1994; D'Angelo et al., 2001; Gall et al., 2005), we only recorded from GCs with high-resistance seals (>7 GΩ) and stopped recording at the first sign of instability or excitability change. Such stringent restrictions limited the recording time to <5 min. Under these conditions, the average resting potential of GCs was −80 ± 6 mV (n = 7). GC responses to DHPG started with high amplitude transient depolarizations that corresponded to the high-frequency UBC burst phase (Fig. 7A1,A2). The sustained phase of activity was characterized by the occurrence of a plateau depolarization crowned by occasional APs. We estimated the frequency of EPSPs and APs as well as the average membrane potential in 500 ms bins. The ratio of EPSPs to APs (transmission rate) in each bin was highly dependent on the average membrane potential (Fig. 7B). Above −65 mV the transmission rate rose sharply (linear regression of the data positive to −70 mV displayed a slope of 13 ± 2 × 10⁻³ mV−1 and an x-intercept of −68.12 ± 0.53 mV, p < 0.01, n = 7 cells, 412 APs). This suggests that summation of slow depolarizing synaptic conductances leading to sustained plateau depolarization is required for AP generation. Similarly the input-output function rose approximately linearly above an input rate of 58 Hz with a slope of 0.32 ± 0.03 Hz/Hz (p < 0.01; Fig. 7C1). These results suggest that low-frequency MF input of tens of hertz can generate APs in GCs, due to the summation of slow and fast synaptic conductances.
Figure 7.
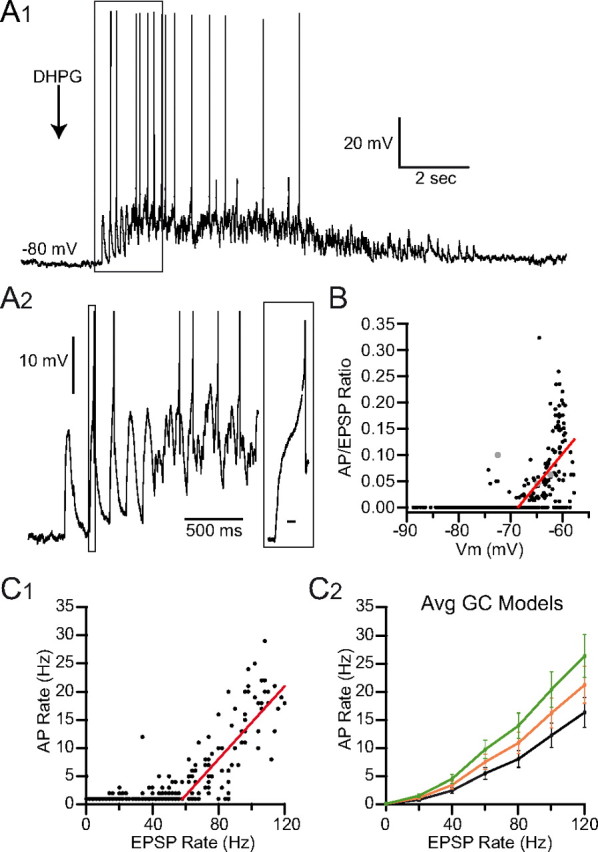
Input-output relationship of GCs during low-frequency UBC MF input. A1, GC current-clamp recording of EPSPs and APs evoked by DHPG stimulation of UBC MF input (arrow). A2, Enlargement of boxed region in A1. Inset is enlargement of boxed region, showing the AP at the peak of a burst. Calibration: boxed region, 10 ms. B, Input-output relationship (ratio of APs per EPSC) is plotted versus membrane potential (Vm) with linear fit (red). Gray points indicate APs evoked during the bursting phase. C1, GC AP rate versus EPSP rate (500 ms bins). Red line is a linear fit. C2, Average GC model input-output curves for single MF inputs with physiological levels of NMDAR conductance (φ = 1.0, 1.2, 1.4; black, orange, and green respectively; 242 GC models). The curves match the GC data in C1.
Models of synaptic integration that capture the heterogeneity in synaptic input and membrane properties across the GC population
MF synapses and GC membrane properties vary widely from cell to cell (Sargent et al., 2005). Since this is likely to affect their input-output properties, particularly at low frequencies, we developed a large family of conductance-based integrate-and-fire models to study synaptic integration across the GC population. To do this, we used experimental measurements from a dataset of 242 GCs that included measurements of membrane capacitance (Cm) and membrane reversal potential (Em). To estimate the membrane input conductance (Gm) of these GCs over a voltage range relevant for synaptic integration, we fit the passive properties of a single-compartment model (Eq. 3) to subthreshold voltage traces recorded from a subset of these GCs (n = 38). As Figure 8A1 shows, GC subthreshold voltage responses to random trains of synaptic conductances can be mimicked quite closely with a simple RmCm circuit. Results of these passive-model fits provided not only Gm measurements for this subset of GCs, but revealed a linear relationship between Gm and Cm (Fig. 8A2, red line; Cm measured under voltage-clamp) which then allowed us to generate Gm values for the remaining GCs (n = 204; see Materials and Methods). Distributions for Cm, Gm and Em are plotted in Figure 8, A2 and B, for the full GC population. The AP threshold, after-hyperpolarization and refractory period of the 242 models were set to the average of experimentally measured values. Each model received 4 independent MF synaptic inputs with separate AMPAR and NMDAR components. The AMPAR component consisted of a separate fast and slow component mediated by direct quantal release and glutamate spillover components, respectively (Fig. 8C). We accounted for natural variability in the peak AMPAR conductance by sampling from an experimentally measured distribution (Sargent et al., 2005; Fig. 8D). The time courses of the AMPAR and NMDAR components were derived from fits to experimental data (Rothman et al., 2009; DiGregorio et al., 2002, 2007) and match the behavior of the AMPAR and NMDAR conductances described in this paper (Fig. 8C legend) and previously. For the voltage dependence of the NMDAR component, we used m(V) from the fit to the data in Figure 4A2. The short-term plasticity characteristics of the direct and spillover AMPAR and NMDAR components were determined by fitting the synaptic data from Rothman et al. (2009) using simple plasticity models based on the work of Varela et al. (1997) (Fig. 8E1,F1). The plasticity models for the AMPAR and NMDAR component closely predict the experimentally measured relationship between the time-averaged conductance and MF input rate (Fig. 8E2,F2).
To simplify the presentation of our model simulations, we kept the ratio of the peak NMDAR conductance (GNMDAR, unblocked) and peak AMPAR conductance (GAMPAR), defined as φ, constant for each simulation. We report simulations for a range of φ, from 0 (i.e., no NMDARs) to 1.4. This range of φ corresponds to a 0–40% percentage NMDAR conductance at −82 mV, and 0–90% at +18 mV. The larger values of φ (1.0–1.4) reproduce the UBC MF-GC synaptic integral data in Figure 3D, and produce input-output relationships for a single UBC MF input comparable to the GC data in Figure 7C1, as seen in 7C2.
NMDARs enable spiking in GC models during low-frequency UBC MF input
We then used our 242 GC models to systematically explore how the AMPAR and NMDAR components of the synaptic input contribute to transmission of signals at low-to-intermediate input rates. Figure 9A1 shows examples of the membrane voltage of one of our GC models that has membrane properties close to the mean values across the population, and where the ratio of the NMDAR and AMPAR components was set to a physiological level (φ = 1.0). When this model was driven with random trains of synaptic input that contained only the AMPAR spillover component (orange traces), the membrane voltage depolarized but did not reach the AP threshold, even when the input rate was raised to 240 Hz (i.e., up to 60 Hz per MF; bottom). Adding the fast direct AMPAR component increased the membrane noise (blue traces), particularly at low frequencies where depression of this component was minimal (top), but was still not sufficient to drive the model to fire reliably. When the model was driven with only the NMDAR component (green traces), the membrane voltage depolarized to a level similar to that observed for simulations with only the AMPAR spillover component, and these two components together (red traces) were sufficient to drive AP-threshold crossings at higher rates. However, only when all of the components were present (AMPAR direct and spillover, and NMDAR) did the model fire reliably at low MF input rates (black traces). Hence, these simulations show that both the slow spillover AMPAR and NMDAR components produce the major membrane depolarization during rate coded MF input, while the fast direct AMPAR component boosts the probability of AP-threshold crossing at low MF input rates.
Figure 9.
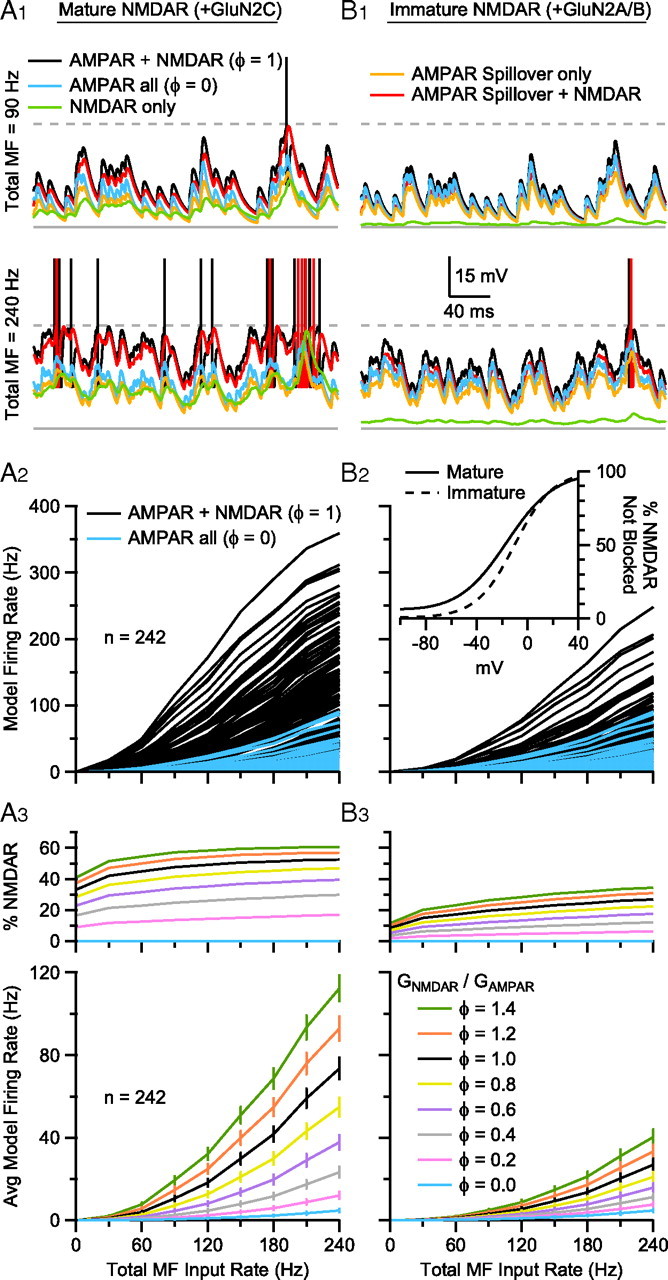
Incomplete Mg2+ block of GluN2C-containing NMDARs enhances AP firing in GC models during low-frequency MF input. A1, Voltage traces from a GC model with mid-range membrane properties (Cm = 3.0 pF, Gm = 1.1 nS, Em = −80 mV) during excitation with 4 asynchronous MF inputs with total input rate of 90 Hz (top) and 240 Hz (bottom) under different input conditions: AMPAR + NMDAR (black; φ = 1.0), AMPAR all (blue; φ = 0), NMDAR only (green), AMPAR spillover only (orange), AMPAR spillover + NMDAR (red). Resting potential was −77.9 mV (solid gray line). AP threshold was −40 mV (dashed gray line); APs truncated to −15 mV. A2, Steady-state input-output relationships (GC firing rate vs total MF input rate) for 242 GC models with different Cm, Gm, Em, and synaptic properties (Fig. 8). To construct the input-output relationships, each GC was driven by 4 statistically independent random MF synaptic conductance trains, with the same mean frequency, and this frequency was then varied between 7.5 and 60 Hz. The blue traces show GC input-output relations for AMPAR only MF inputs, while MF inputs with both AMPAR and NMDAR components are shown in black. The voltage dependence of the NMDAR conductance was set to that for mature GCs (B2 inset, solid line) that express GluN2C. φ denotes the ratio of GNMDAR to GAMPAR, such that for AMPAR only, φ = 0 and for AMPAR plus NMDAR components, φ = 1.0. These ratios were the same across all 4 MF inputs. A3, Average input-output relations of the 242 GC models in A2 (blue and black) plus simulations for other φ in the range 0–1.4. Error bars denote SEM. Top graph shows the percentage of the total synaptic current injected into the GC models mediated by NMDARs. B1, B2, and B3, The same as A1, A2, and A3, except the NMDAR voltage-dependent block was that of immature GCs (B2 inset, dashed line) that express GluN2A/B. B2 inset, Fraction of NMDARs not blocked as a function of voltage (m(V); Eq. 2). Solid line is from a fit to the GC data in Figure 4A2. Dashed line is from a fit to the P7–P9 wild-type GC data of Takahashi et al., 1996, shown in Figure 4B.
We next explored how the AMPAR and NMDAR components contribute to the steady-state rate coded input-output relationships across the heterogeneous population of model GCs. As Figure 9A2 shows, AMPAR only excitation (blue) produced no firing in the least excitable GC models and input-output relationships with a shallow slope and low maximal firing rates in the most excitable GC models. However, addition of the NMDAR component (black; φ = 1.0) enabled firing in all the GC models over low-to-intermediate MF input rates, markedly increasing the gain of the input-output relationships. These simulations also show that the natural heterogeneity in the GC population produces input-output relationships with a wide range of gains.
Finally, Figure 9A3 shows the mean input-output relationships across the 242 GC population for a range of NMDAR conductances (φ = 0.0–1.4), again showing the weak GC firing even at 240 Hz with AMPAR only excitation (blue). Interestingly, for simulations with physiological levels of NMDAR conductance (φ = 1.0–1.4) the time-averaged NMDAR conductance reached levels as high as 50–60% of the total synaptic conductance, and thus injected charge (top; percentage NMDAR), and this fraction remained relatively constant as a function of the MF input rate. Hence, these simulations show that the NMDAR component of the UBC MF-GC synapse is essential for generating reliable GC firing at low MF input rates.
Incomplete Mg2+ block of NMDARs boosts the efficacy of low-frequency MF inputs
To explore the role of NMDAR subtypes in signal transmission in GCs, we compared the properties of GC synaptic integration and the input-output relationships for native GluN2C-containing NMDARs (Fig. 9A1–A3), which exhibit incomplete Mg2+ block (Fig. 9B2 inset, solid line), with those obtained with GluN2A/B-containing NMDARs (Fig. 9B1–B3), which are expressed in immature GCs and exhibit strong voltage-dependent Mg2+ block (Fig. 9B2 inset, dashed line). This comparison shows that the GC depolarization induced by NMDAR synaptic input is much smaller for immature GluN2A/B-containing receptors than GluN2C-containing receptors, even at a 240 Hz MF input rate (compare green traces between Fig. 9A1 and B1). The inability of GluN2A/B receptors to depolarize the GC substantially reduced the range of AP firing across the heterogeneous GC population (Fig. 9B2). On average, the GC models showed as much as a fourfold reduction in output spiking, and a fourfold reduction in the percentage charge conveyed by the NMDAR conductance at low MF input rates (Fig. 9B3). These simulations confirm that the weak voltage dependence of mature NMDARs containing the GluN2C subunit enhances the integration of MF input, enabling transmission of low-frequency signals through the GC layer.
Discussion
We have studied how sustained low-frequency intrinsic MF inputs are transmitted through the input layer of the cerebellar cortex. To do this, we used a novel in vitro model of cerebellar activity that mimicked asynchronous low-frequency MF firing during vestibular input, as well as biologically detailed mathematical models of GCs that included much of their natural heterogeneity. Our results show that low-frequency MF activity modulates PC output and that low-frequency signal transmission through the GC layer is NMDAR dependent. Moreover, we establish that the weak voltage-dependent Mg2+ block of NMDARs in GCs facilitates this low-frequency transmission by contributing a substantial fraction of the synaptic charge. Slowly decaying EPSCs mediated by NMDARs, which are likely to contain the GluN2C subunit, and the slow spillover-mediated AMPAR component, are equally effective at depolarizing the GC, while the fast quantal AMPAR conductance enhances AP generation at low frequencies by introducing additional voltage fluctuations. Hence, our results reveal the mechanism that enables low-frequency rate-coded inputs to be transmitted through the GC layer and provides a functional role for GluN2C-containing NMDARs.
Pharmacological stimulation of the UBC network
An inherent difficulty in studying neuronal circuits in vitro is activating realistic input patterns. To date, in vitro studies of the GC layer network have been restricted to synchronous activity produced by electrical stimulation (Hamann et al., 2002) or opto-genetic approaches (Crowley et al., 2009). These methods synchronize inputs with millisecond precision, a condition unlikely to occur in vivo. We have overcome this limitation by activating the UBC network asynchronously by applying DHPG deep in the GC layer. However, our approach does rely on the selective activation of mGluR1 on UBCs by local pressure ejection of DHPG. Several lines of evidence suggest we achieved such selective activation in our experiments. First, while low levels of mGluR1 RNA have been reported in GCs (Shigemoto et al., 1992), immunohistochemical studies have not found such an expression (Jaarsma et al., 1998). Consistent with this latter finding, we did not detect any currents in GCs due to direct activation by DHPG. Second, while EPSPs in PCs evoked by electrical stimulation of MFs in the turtle cerebellum are augmented by mGluR agonist ACPD (1-amino-1,3-dicarboxycyclopentane) in an NMDAR-dependent manner, suggesting an effect of ACPD on GC NMDARs (Kinney and Slater, 1993), our direct recordings from MF-GC synapses show that DHPG does not alter NMDAR currents. Indeed, the augmentation of PC EPSPs by ACPD in turtle is consistent with our results showing an increased GC-layer transmission when UBCs are excited by an mGluR agonist. Third, while molecular layer interneurons (Shigemoto et al., 1992) and PCs (Martin et al., 1992; Nunzi et al., 2003) both express mGluR1, we found that blocking synaptic transmission with an AMPAR antagonist blocked the DHPG-modulation of PC activity, indicating that modulation of PC firing frequency resulted from synaptic activation and not a direct effect of DHPG.
While the frequency and asynchronous nature of UBC DHPG stimulation in vitro resembles activity in vivo, differences remain in the timing and spatial pattern of MF activity. MFs asynchronously activated by pressure ejection of DHPG will not contain temporal information encoded by MFs in vivo. Moreover, selective activation of intrinsic UBC MFs will result in an incomplete spatial pattern of MF activation.
Molecular identity of NMDARs in cerebellar GCs
Our results showing incomplete Mg2+ block and weak voltage dependence of the synaptic NMDAR component, together with the insensitivity of GC layer signaling to selective blockers of GluN2A/B subunits, are consistent with the presence of GluN2C or GluN2D-containing receptors (Monyer et al., 1994; Wenzel et al., 1995; Yamada et al., 2001; Petralia et al., 2002). In accordance with these results, and the interpretation that GluN2C-containing receptors mediate GC signaling, several studies have shown that early in development GluN2A/B-containing receptors predominate in cerebellar GCs, but that GluN2C-containing receptors are strongly expressed at the later developmental age we have studied (Monyer et al., 1994). This developmental change from GluN2A/B- to GluN2C-containing receptors results in NMDARs with a lower channel conductance (Farrant et al., 1994), slower kinetics (Cathala et al., 2000) and weaker voltage dependence due to incomplete Mg2+ block (Feldmeyer and Cull-Candy, 1996), consistent with our results. However, in contrast to the relatively slow decay kinetics (>200 ms) characteristic of homomeric GluN2C receptors (Dravid et al., 2008; Bidoret et al., 2009), we observed time constants of ∼30 ms. Previous studies of GC synaptic responses evoked by extrinsic MFs have reported slightly longer time constants with variable weighted decays (biexponential fits) averaging ∼52–75 ms (Silver et al., 1992; Cathala et al., 2000). However, results from these studies may have been influenced by recording in 0 Mg2+ (Konnerth et al., 1990; Rauner and Köhr, 2011) or at room temperature (Bidoret et al., 2009). On the other hand, our shorter decay kinetics could be explained by the expression of tri-heteromeric GluN2A/C receptors (Cathala et al., 2000; Nieus et al., 2006). This is supported by the absence of a significant effect from the conjoint application of specific GluN2A (Zn2+) and GluN2B (Ro-25) antagonists to PC responses. Tri-heteromeric GluN2A/C receptors, in contrast, are only inhibited by 20% in 1.2 μm free Zn2+ (Hatton and Paoletti, 2005). The unique kinetic profile of the NMDA EPSCs could also be explained by NMDARs containing GluN3 subunits: a weak immunohistochemical staining of GluN3 (NR3B) subunit has been reported in cerebellar GCs (Wee et al., 2008); however, their contribution to GC layer signaling remains unclear. Whatever the precise subunit combination, our results show that incomplete Mg2+ block of GC NMDARs enables signaling at hyperpolarized membrane potentials.
Synaptic integration in GCs
Our results show that the slowly decaying AMPAR and NMDAR components play an equal role in depolarizing the GC from its hyperpolarized resting state. Interestingly, both of these components arise from spillover of glutamate within the cerebellar glomerulus (Cathala et al., 2000; DiGregorio et al., 2002). Comparison of the total NMDAR-mediated charge per EPSC versus bursts indicates that NMDAR currents are not saturated and sum linearly during high-frequency stimulation. These results are consistent with studies that show NMDAR subunit labeling at both intraglomerular attachment plaques and postsynaptic densities (Yamada et al., 2001; Petralia et al., 2002; Rossi et al., 2002), as well as the absence of NMDAR-currents from spontaneous, but not evoked, synaptic currents (Cathala et al., 2000). Indeed, modeling studies indicate that extrasynaptic NMDAR activation may comprise as much as 80% of the NMDAR currents (Mitchell and Lee, 2007). Spillover-mediated activation therefore plays a central role in both NMDAR- and AMPAR-mediated signaling through the GC layer.
The slow kinetics of spillover-activated AMPAR and NMDAR conductances facilitates temporal integration and transmission of low-frequency rate-coded signals (DiGregorio et al., 2002; Porres et al., 2011). Our findings reveal that at resting potentials, NMDARs contribute ∼45% of synaptic charge at UBC MF-GC synapses during low-frequency activity and thus play a key role in depolarizing GCs. Using conductance-based integrate-and-fire models, we show that the weak voltage dependence of GluN2C-containing NMDARs is essential for extending GC signaling to low input frequencies. Experiments and simulations also reveal that the fast quantal AMPAR component contributes to low-frequency signaling by introducing large voltage fluctuations, but these become smaller at high rates due to desensitization (Saviane and Silver, 2006; DiGregorio et al., 2007). Our results suggest that the developmental switch between GluN2A/B- and GluN2C-containing NMDARs in GCs (Farrant et al., 1994; Monyer et al., 1994; Feldmeyer and Cull-Candy, 1996) extends the dynamic range of rate-coded signaling through the cerebellar cortex.
Physiological implications
In vivo recordings from GCs during whisker stimulation suggest that discrete stimuli entering the cerebellar cortex are encoded as high-frequency bursts of MF activity and that a single MF may be sufficient to generate firing in GCs (Chadderton et al., 2004; Rancz et al., 2007). Effective transmission of MF busts is likely to be important in relaying the precise timing of external events and motor commands. In contrast, continuous variables encoded as lower frequency rate-coded MF firing (van Kan et al., 1993; Arenz et al., 2008; Prsa et al., 2009; Sawtell, 2010) are integrated by GCs. Our results show that even the low frequencies encountered in the rodent vestibular system (10–60 Hz; Arenz et al., 2008) can be transmitted effectively through the GC layer as a result of temporal summation of slow spillover-mediated AMPAR and NMDAR conductances. The slow kinetics of these currents are well matched to the relatively slow time scale of vestibular (Arenz et al., 2008; Barmack and Yakhnitsa, 2008), joint position (van Kan et al., 1993) and proprioceptive signaling (Jörntell and Ekerot, 2006; Sawtell, 2010). The surprisingly large contribution of NMDAR-mediated currents at hyperpolarized potentials may also lead to elevation of the internal calcium concentration and induction of synaptic plasticity (D'Errico et al., 2009).
Our modeling of synaptic integration in GCs, which includes heterogeneity in the synaptic input, membrane resistance, capacitance and resting potential, results in a family of input-output relationships with a wide range of properties. We show that slow AMPAR and NMDAR components are required for low-frequency signaling across the GC population. However, if the mean frequency of MF inputs onto an individual GC (which vary in vivo; Arenz et al., 2008) were matched to GC gain, GCs could operate over their most sensitive range, thereby extending the range of MF firing rates that the GC layer could process efficiently.
The build-up of sustained depolarizing conductances, rather than temporal summation of fast synchronized quantal AMPAR conductances, is particularly well suited for multimodal integration of asynchronous low-frequency inputs, as proposed in the superior colliculus (Binns and Salt, 1996). Interestingly, in vivo recordings in the vestibular cerebellum (Arenz et al., 2008), and cerebellar-like structures of the weakly electric fish, indicate that GCs can integrate multimodal inputs (Sawtell, 2010). In fish, summation of tonic proprioceptive plateau potentials and electric organ corollary discharge trigger GC APs. Thus, contextual proprioceptive activity, coded as sustained time varying activity, may raise the membrane potential to a level from which high-frequency bursts are able to trigger GC throughput with temporal precision. Our results show that slow spillover-mediated AMPAR and NMDAR components play a key role in depolarizing GCs during sustained rate-coded signaling.
Footnotes
This work was funded by CNRS, INSERM, the Agence Nationale de la Recherche (Grant 2007 BSYS 010)/Biotechnology and Biological Sciences Research Council (Grant F005490) and the Wellcome Trust (064413). R.A.S. is the recipient of a Wellcome Trust Principal Research Fellowship (095667) and a European Research Council advanced grant. E.J.S. is a recipient of the Marie Curie Actions International Incoming Fellowship (MIF-CT-2006-040118) and a fellowship from the Fondation pour la Recherche Médicale (SPF20081214925). We thank Clement Lena, Stéphane Supplison, Anne Feltz, Karin Aubrey, Angela Vergnano, Romain Ly, and Daniel Ward for their comments on the manuscript.
References
- Antonov SM, Johnson JW. Permeant ion regulation of N-methyl-d-aspartate receptor channel block by Mg(2+) Proc Natl Acad Sci U S A. 1999;96:14571–14576. doi: 10.1073/pnas.96.25.14571. [DOI] [PMC free article] [PubMed] [Google Scholar]
- Arenz A, Silver RA, Schaefer AT, Margrie TW. The contribution of single synapses to sensory representation in vivo. Science. 2008;321:977–980. doi: 10.1126/science.1158391. [DOI] [PMC free article] [PubMed] [Google Scholar]
- Barmack NH, Yakhnitsa V. Functions of interneurons in mouse cerebellum. J Neurosci. 2008;28:1140–1152. doi: 10.1523/JNEUROSCI.3942-07.2008. [DOI] [PMC free article] [PubMed] [Google Scholar]
- Baude A, Nusser Z, Roberts JD, Mulvihill E, McIlhinney RA, Somogyi P. The metabotropic glutamate receptor (mGluR1 alpha) is concentrated at perisynaptic membrane of neuronal subpopulations as detected by immunogold reaction. Neuron. 1993;11:771–787. doi: 10.1016/0896-6273(93)90086-7. [DOI] [PubMed] [Google Scholar]
- Bengtsson F, Jörntell H. Sensory transmission in cerebellar granule cells relies on similarly coded mossy fiber inputs. Proc Natl Acad Sci U S A. 2009;106:2389–2394. doi: 10.1073/pnas.0808428106. [DOI] [PMC free article] [PubMed] [Google Scholar]
- Berthié B, Axelrad H. Granular layer collaterals of the unipolar brush cell axon display rosette-like excrescences. A Golgi study in the rat cerebellar cortex. Neurosci Lett. 1994;167:161–165. doi: 10.1016/0304-3940(94)91052-9. [DOI] [PubMed] [Google Scholar]
- Bidoret C, Ayon A, Barbour B, Casado M. Presynaptic NR2A-containing NMDA receptors implement a high-pass filter synaptic plasticity rule. Proc Natl Acad Sci U S A. 2009;106:14126–14131. doi: 10.1073/pnas.0904284106. [DOI] [PMC free article] [PubMed] [Google Scholar]
- Billups D, Liu YB, Birnstiel S, Slater NT. NMDA receptor-mediated currents in rat cerebellar granule and unipolar brush cells. J Neurophysiol. 2002;87:1948–1959. doi: 10.1152/jn.00599.2001. [DOI] [PubMed] [Google Scholar]
- Binns KE, Salt TE. Importance of NMDA receptors for multimodal integration in the deep layers of the cat superior colliculus. J Neurophysiol. 1996;75:920–930. doi: 10.1152/jn.1996.75.2.920. [DOI] [PubMed] [Google Scholar]
- Brickley SG, Cull-Candy SG, Farrant M. Development of a tonic form of synaptic inhibition in rat cerebellar granule cells resulting from persistent activation of GABAA receptors. J Physiol. 1996;497:753–759. doi: 10.1113/jphysiol.1996.sp021806. [DOI] [PMC free article] [PubMed] [Google Scholar]
- Casado M, Dieudonné S, Ascher P. Presynaptic N-methyl-d-aspartate receptors at the parallel fiber-Purkinje cell synapse. Proc Natl Acad Sci U S A. 2000;97:11593–11597. doi: 10.1073/pnas.200354297. [DOI] [PMC free article] [PubMed] [Google Scholar]
- Cathala L, Misra C, Cull-Candy S. Developmental profile of the changing properties of NMDA receptors at cerebellar mossy fiber-granule cell synapses. J Neurosci. 2000;20:5899–5905. doi: 10.1523/JNEUROSCI.20-16-05899.2000. [DOI] [PMC free article] [PubMed] [Google Scholar]
- Cathala L, Brickley S, Cull-Candy S, Farrant M. Maturation of EPSCs and intrinsic membrane properties enhances precision at a cerebellar synapse. J Neurosci. 2003;23:6074–6085. doi: 10.1523/JNEUROSCI.23-14-06074.2003. [DOI] [PMC free article] [PubMed] [Google Scholar]
- Chadderton P, Margrie TW, Häusser M. Integration of quanta in cerebellar granule cells during sensory processing. Nature. 2004;428:856–860. doi: 10.1038/nature02442. [DOI] [PubMed] [Google Scholar]
- Clarke RJ, Johnson JW. Voltage-dependent gating of NR1/2B NMDA receptors. J Physiol. 2008;586:5727–5741. doi: 10.1113/jphysiol.2008.160622. [DOI] [PMC free article] [PubMed] [Google Scholar]
- Crowley JJ, Fioravante D, Regehr WG. Dynamics of fast and slow inhibition from cerebellar Golgi cells allow flexible control of synaptic integration. Neuron. 2009;63:843–853. doi: 10.1016/j.neuron.2009.09.004. [DOI] [PMC free article] [PubMed] [Google Scholar]
- D'Angelo E, Rossi P, Taglietti V. Voltage-dependent kinetics of N-methyl-d-aspartate synaptic currents in rat cerebellar granule cells. Eur J Neurosci. 1994;6:640–645. doi: 10.1111/j.1460-9568.1994.tb00309.x. [DOI] [PubMed] [Google Scholar]
- D'Angelo E, De Filippi G, Rossi P, Taglietti V. Synaptic excitation of individual rat cerebellar granule cells in situ: evidence for the role of NMDA receptors. J Physiol. 1995;484:397–413. doi: 10.1113/jphysiol.1995.sp020673. [DOI] [PMC free article] [PubMed] [Google Scholar]
- D'Angelo E, Rossi P, Armano S, Taglietti V. Evidence for NMDA and mGlu receptor-dependent long-term potentiation of mossy fiber-granule cell transmission in rat cerebellum. J Neurophysiol. 1999;81:277–287. doi: 10.1152/jn.1999.81.1.277. [DOI] [PubMed] [Google Scholar]
- D'Angelo E, Nieus T, Maffei A, Armano S, Rossi P, Taglietti V, Fontana A, Naldi G. Theta-frequency bursting and resonance in cerebellar granule cells: experimental evidence and modeling of a slow K+-dependent mechanism. J Neurosci. 2001;21:759–770. doi: 10.1523/JNEUROSCI.21-03-00759.2001. [DOI] [PMC free article] [PubMed] [Google Scholar]
- D'Errico A, Prestori F, D'Angelo E. Differential induction of bidirectional long-term changes in neurotransmitter release by frequency-coded patterns at the cerebellar input. J Physiol. 2009;587:5843–5857. doi: 10.1113/jphysiol.2009.177162. [DOI] [PMC free article] [PubMed] [Google Scholar]
- Diana MA, Otsu Y, Maton G, Collin T, Chat M, Dieudonné S. T-type and L-type Ca2+ conductances define and encode the bimodal firing pattern of vestibulocerebellar unipolar brush cells. J Neurosci. 2007;27:3823–3838. doi: 10.1523/JNEUROSCI.4719-06.2007. [DOI] [PMC free article] [PubMed] [Google Scholar]
- DiGregorio DA, Nusser Z, Silver RA. Spillover of glutamate onto synaptic AMPA receptors enhances fast transmission at a cerebellar synapse. Neuron. 2002;35:521–533. doi: 10.1016/s0896-6273(02)00787-0. [DOI] [PubMed] [Google Scholar]
- DiGregorio DA, Rothman JS, Nielsen TA, Silver RA. Desensitization properties of AMPA receptors at the cerebellar mossy fiber granule cell synapse. J Neurosci. 2007;27:8344–8357. doi: 10.1523/JNEUROSCI.2399-07.2007. [DOI] [PMC free article] [PubMed] [Google Scholar]
- Diño MR, Perachio AA, Mugnaini E. Cerebellar unipolar brush cells are targets of primary vestibular afferents: an experimental study in the gerbil. Exp Brain Res. 2001;140:162–170. doi: 10.1007/s002210100790. [DOI] [PubMed] [Google Scholar]
- Dravid SM, Prakash A, Traynelis SF. Activation of recombinant NR1/NR2C NMDA receptors. J Physiol. 2008;586:4425–4439. doi: 10.1113/jphysiol.2008.158634. [DOI] [PMC free article] [PubMed] [Google Scholar]
- Dugué GP, Dumoulin A, Triller A, Dieudonné S. Target-dependent use of coreleased inhibitory transmitters at central synapses. J Neurosci. 2005;25:6490–6498. doi: 10.1523/JNEUROSCI.1500-05.2005. [DOI] [PMC free article] [PubMed] [Google Scholar]
- Farrant M, Feldmeyer D, Takahashi T, Cull-Candy SG. NMDA-receptor channel diversity in the developing cerebellum. Nature. 1994;368:335–339. doi: 10.1038/368335a0. [DOI] [PubMed] [Google Scholar]
- Fayyazuddin A, Villarroel A, Le Goff A, Lerma J, Neyton J. Four residues of the extracellular N-terminal domain of the NR2A subunit control high-affinity Zn2+ binding to NMDA receptors. Neuron. 2000;25:683–694. doi: 10.1016/s0896-6273(00)81070-3. [DOI] [PubMed] [Google Scholar]
- Feldmeyer D, Cull-Candy S. Functional consequences of changes in NMDA receptor subunit expression during development. J Neurocytol. 1996;25:857–867. doi: 10.1007/BF02284847. [DOI] [PubMed] [Google Scholar]
- Ferraguti F, Crepaldi L, Nicoletti F. Metabotropic glutamate 1 receptor: current concepts and perspectives. Pharmacol Rev. 2008;60:536–581. doi: 10.1124/pr.108.000166. [DOI] [PubMed] [Google Scholar]
- Fischer G, Mutel V, Trube G, Malherbe P, Kew JN, Mohacsi E, Heitz MP, Kemp JA. Ro 25–6981, a highly potent and selective blocker of N-methyl-d-aspartate receptors containing the NR2B subunit. Characterization in vitro. J Pharmacol Exp Ther. 1997;283:1285–1292. [PubMed] [Google Scholar]
- Gabbiani F, Midtgaard J, Knöpfel T. Synaptic integration in a model of cerebellar granule cells. J Neurophysiol. 1994;72:999–1009. doi: 10.1152/jn.1994.72.2.999. [DOI] [PubMed] [Google Scholar]
- Gall D, Prestori F, Sola E, D'Errico A, Roussel C, Forti L, Rossi P, D'Angelo E. Intracellular calcium regulation by burst discharge determines bidirectional long-term synaptic plasticity at the cerebellum input stage. J Neurosci. 2005;25:4813–4822. doi: 10.1523/JNEUROSCI.0410-05.2005. [DOI] [PMC free article] [PubMed] [Google Scholar]
- Hahnenkamp K, Durieux ME, Hahnenkamp A, Schauerte SK, Hoenemann CW, Vegh V, Theilmeier G, Hollmann MW. Local anaesthetics inhibit signalling of human NMDA receptors recombinantly expressed in Xenopus laevis oocytes: role of protein kinase C. Br J Anaesth. 2006;96:77–87. doi: 10.1093/bja/aei271. [DOI] [PubMed] [Google Scholar]
- Hallermann S, Fejtova A, Schmidt H, Weyhersmüller A, Silver RA, Gundelfinger ED, Eilers J. Bassoon speeds vesicle reloading at a central excitatory synapse. Neuron. 2010;68:710–723. doi: 10.1016/j.neuron.2010.10.026. [DOI] [PMC free article] [PubMed] [Google Scholar]
- Hamann M, Rossi DJ, Attwell D. Tonic and spillover inhibition of granule cells control information flow through cerebellar cortex. Neuron. 2002;33:625–633. doi: 10.1016/s0896-6273(02)00593-7. [DOI] [PubMed] [Google Scholar]
- Hatton CJ, Paoletti P. Modulation of triheteromeric NMDA receptors by N-terminal domain ligands. Neuron. 2005;46:261–274. doi: 10.1016/j.neuron.2005.03.005. [DOI] [PubMed] [Google Scholar]
- Imamura Y, Inokawa H, Ito A, Kadotani H, Toyama K, Noda M, Nakanishi S, Hirano T. Roles of GABAergic inhibition and NMDA receptor subunits in the spatio-temporal integration in the cerebellar cortex of mice. Neurosci Res. 2000;38:289–301. doi: 10.1016/s0168-0102(00)00173-5. [DOI] [PubMed] [Google Scholar]
- Jaarsma D, Diño MR, Ohishi H, Shigemoto R, Mugnaini E. Metabotropic glutamate receptors are associated with non-synaptic appendages of unipolar brush cells in rat cerebellar cortex and cochlear nuclear complex. J Neurocytol. 1998;27:303–327. doi: 10.1023/a:1006982023657. [DOI] [PubMed] [Google Scholar]
- Jörntell H, Ekerot CF. Properties of somatosensory synaptic integration in cerebellar granule cells in vivo. J Neurosci. 2006;26:11786–11797. doi: 10.1523/JNEUROSCI.2939-06.2006. [DOI] [PMC free article] [PubMed] [Google Scholar]
- Kalmbach BE, Voicu H, Ohyama T, Mauk MD. A subtraction mechanism of temporal coding in cerebellar cortex. J Neurosci. 2011;31:2025–2034. doi: 10.1523/JNEUROSCI.4212-10.2011. [DOI] [PMC free article] [PubMed] [Google Scholar]
- Kinney GA, Slater NT. Potentiation of NMDA receptor-mediated transmission in turtle cerebellar granule cells by activation of metabotropic glutamate receptors. J Neurophysiol. 1993;69:585–594. doi: 10.1152/jn.1993.69.2.585. [DOI] [PubMed] [Google Scholar]
- Kirson ED, Yaari Y. Synaptic NMDA receptors in developing mouse hippocampal neurones: functional properties and sensitivity to ifenprodil. J Physiol. 1996;497:437–455. doi: 10.1113/jphysiol.1996.sp021779. [DOI] [PMC free article] [PubMed] [Google Scholar]
- Konnerth A, Keller BU, Ballanyi K, Yaari Y. Voltage sensitivity of NMDA-receptor mediated postsynaptic currents. Exp Brain Res. 1990;81:209–212. doi: 10.1007/BF00230117. [DOI] [PubMed] [Google Scholar]
- Kupper J, Ascher P, Neyton J. Internal Mg2+ block of recombinant NMDA channels mutated within the selectivity filter and expressed in Xenopus oocytes. J Physiol. 1998;507:1–12. doi: 10.1111/j.1469-7793.1998.001bu.x. [DOI] [PMC free article] [PubMed] [Google Scholar]
- Lisberger SG, Fuchs AF. Role of primate flocculus during rapid behavioral modification of vestibuloocular reflex. I. Purkinje cell activity during visually guided horizontal smooth-pursuit eye movements and passive head rotation. J Neurophysiol. 1978;41:733–763. doi: 10.1152/jn.1978.41.3.733. [DOI] [PubMed] [Google Scholar]
- Maex R, De Schutter E. Synchronization of Golgi and granule cell firing in a detailed network model of the cerebellar granule cell layer. J Neurophysiol. 1998;80:2521–2537. doi: 10.1152/jn.1998.80.5.2521. [DOI] [PubMed] [Google Scholar]
- Magistretti J, Castelli L, Forti L, D'Angelo E. Kinetic and functional analysis of transient, persistent and resurgent sodium currents in rat cerebellar granule cells in situ: an electrophysiological and modelling study. J Physiol. 2006;573:83–106. doi: 10.1113/jphysiol.2006.106682. [DOI] [PMC free article] [PubMed] [Google Scholar]
- Mapelli J, Gandolfi D, D'Angelo E. High-pass filtering and dynamic gain regulation enhance vertical bursts transmission along the mossy fiber pathway of cerebellum. Front Cell Neurosci. 2010;4:14. doi: 10.3389/fncel.2010.00014. [DOI] [PMC free article] [PubMed] [Google Scholar]
- Martin LJ, Blackstone CD, Huganir RL, Price DL. Cellular localization of a metabotropic glutamate receptor in rat brain. Neuron. 1992;9:259–270. doi: 10.1016/0896-6273(92)90165-a. [DOI] [PubMed] [Google Scholar]
- McDonough SI, Bean BP. Mibefradil inhibition of T-type calcium channels in cerebellar Purkinje neurons. Mol Pharmacol. 1998;54:1080–1087. doi: 10.1124/mol.54.6.1080. [DOI] [PubMed] [Google Scholar]
- Mehrke G, Zong XG, Flockerzi V, Hofmann F. The Ca(++)-channel blocker Ro 40-5967 blocks differently T-type and L-type Ca(++) channels. J Pharmacol Exp Ther. 1994;271:1483–1488. [PubMed] [Google Scholar]
- Mitchell CS, Lee RH. Output-based comparison of alternative kinetic schemes for the NMDA receptor within a glutamate spillover model. J Neural Eng. 2007;4:380–389. doi: 10.1088/1741-2560/4/4/004. [DOI] [PubMed] [Google Scholar]
- Mitchell SJ, Silver RA. Glutamate spillover suppresses inhibition by activating presynaptic mGluRs. Nature. 2000;404:498–502. doi: 10.1038/35006649. [DOI] [PubMed] [Google Scholar]
- Mitchell SJ, Silver RA. Shunting inhibition modulates neuronal gain during synaptic excitation. Neuron. 2003;38:433–445. doi: 10.1016/s0896-6273(03)00200-9. [DOI] [PubMed] [Google Scholar]
- Momiyama A, Feldmeyer D, Cull-Candy SG. Identification of a native low-conductance NMDA channel with reduced sensitivity to Mg2+ in rat central neurones. J Physiol. 1996;494:479–492. doi: 10.1113/jphysiol.1996.sp021507. [DOI] [PMC free article] [PubMed] [Google Scholar]
- Monyer H, Burnashev N, Laurie DJ, Sakmann B, Seeburg PH. Developmental and regional expression in the rat brain and functional properties of four NMDA receptors. Neuron. 1994;12:529–540. doi: 10.1016/0896-6273(94)90210-0. [DOI] [PubMed] [Google Scholar]
- Nieus T, Sola E, Mapelli J, Saftenku E, Rossi P, D'Angelo E. LTP regulates burst initiation and frequency at mossy fiber-granule cell synapses of rat cerebellum: experimental observations and theoretical predictions. J Neurophysiol. 2006;95:686–699. doi: 10.1152/jn.00696.2005. [DOI] [PubMed] [Google Scholar]
- Nunzi MG, Mugnaini E. Unipolar brush cell axons form a large system of intrinsic mossy fibers in the postnatal vestibulocerebellum. J Comp Neurol. 2000;422:55–65. doi: 10.1002/(sici)1096-9861(20000619)422:1<55::aid-cne4>3.0.co;2-9. [DOI] [PubMed] [Google Scholar]
- Nunzi MG, Shigemoto R, Mugnaini E. Differential expression of calretinin and metabotropic glutamate receptor mGluR1alpha defines subsets of unipolar brush cells in mouse cerebellum. J Comp Neurol. 2002;451:189–199. doi: 10.1002/cne.10344. [DOI] [PubMed] [Google Scholar]
- Nunzi MG, Russo M, Mugnaini E. Vesicular glutamate transporters VGLUT1 and VGLUT2 define two subsets of unipolar brush cells in organotypic cultures of mouse vestibulocerebellum. Neuroscience. 2003;122:359–371. doi: 10.1016/s0306-4522(03)00568-2. [DOI] [PubMed] [Google Scholar]
- Paoletti P, Ascher P, Neyton J. High-affinity zinc inhibition of NMDA NR1-NR2A receptors. J Neurosci. 1997;17:5711–5725. doi: 10.1523/JNEUROSCI.17-15-05711.1997. [DOI] [PMC free article] [PubMed] [Google Scholar]
- Perkel DJ, Hestrin S, Sah P, Nicoll RA. Excitatory synaptic currents in Purkinje cells. Proc Biol Sci. 1990;241:116–121. doi: 10.1098/rspb.1990.0074. [DOI] [PubMed] [Google Scholar]
- Petralia RS, Wang YX, Wenthold RJ. NMDA receptors and PSD-95 are found in attachment plaques in cerebellar granular layer glomeruli. Eur J Neurosci. 2002;15:583–587. doi: 10.1046/j.1460-9568.2002.01896.x. [DOI] [PubMed] [Google Scholar]
- Porres CP, Meyer EMM, Grothe B, Felmy F. NMDA currents modulate the synaptic input-output functions of neurons in the dorsal nucleus of the lateral lemniscus in Mongolian gerbils. J Neurosci. 2011;31:4511–4523. doi: 10.1523/JNEUROSCI.6054-10.2011. [DOI] [PMC free article] [PubMed] [Google Scholar]
- Prsa M, Dash S, Catz N, Dicke PW, Thier P. Characteristics of responses of Golgi cells and mossy fibers to eye saccades and saccadic adaptation recorded from the posterior vermis of the cerebellum. J Neurosci. 2009;29:250–262. doi: 10.1523/JNEUROSCI.4791-08.2009. [DOI] [PMC free article] [PubMed] [Google Scholar]
- Qian A, Buller AL, Johnson JW. NR2 subunit-dependence of NMDA receptor channel block by external Mg2+ J Physiol. 2005;562:319–331. doi: 10.1113/jphysiol.2004.076737. [DOI] [PMC free article] [PubMed] [Google Scholar]
- Rancz EA, Ishikawa T, Duguid I, Chadderton P, Mahon S, Häusser M. High-fidelity transmission of sensory information by single cerebellar mossy fibre boutons. Nature. 2007;450:1245–1248. doi: 10.1038/nature05995. [DOI] [PMC free article] [PubMed] [Google Scholar]
- Rauner C, Köhr G. Triheteromeric NR1/NR2A/NR2B receptors constitute the major N-methyl-d-aspartate receptor population in adult hippocampal synapses. J Biol Chem. 2011;286:7558–7566. doi: 10.1074/jbc.M110.182600. [DOI] [PMC free article] [PubMed] [Google Scholar]
- Rossi DJ, Hamann M, Attwell D. Multiple modes of GABAergic inhibition of rat cerebellar granule cells. J Physiol. 2003;548:97–110. doi: 10.1113/jphysiol.2002.036459. [DOI] [PMC free article] [PubMed] [Google Scholar]
- Rossi P, D'Angelo E, Taglietti V. Differential long-lasting potentiation of the NMDA and non-NMDA synaptic currents induced by metabotropic and NMDA receptor coactivation in cerebellar granule cells. Eur J Neurosci. 1996;8:1182–1189. doi: 10.1111/j.1460-9568.1996.tb01286.x. [DOI] [PubMed] [Google Scholar]
- Rossi P, Sola E, Taglietti V, Borchardt T, Steigerwald F, Utvik JK, Ottersen OP, Köhr G, D'Angelo E. NMDA receptor 2 (NR2) C-terminal control of NR open probability regulates synaptic transmission and plasticity at a cerebellar synapse. J Neurosci. 2002;22:9687–9697. doi: 10.1523/JNEUROSCI.22-22-09687.2002. [DOI] [PMC free article] [PubMed] [Google Scholar]
- Rothman JS, Cathala L, Steuber V, Silver RA. Synaptic depression enables neuronal gain control. Nature. 2009;457:1015–1018. doi: 10.1038/nature07604. [DOI] [PMC free article] [PubMed] [Google Scholar]
- Sargent PB, Saviane C, Nielsen TA, DiGregorio DA, Silver RA. Rapid vesicular release, quantal variability, and spillover contribute to the precision and reliability of transmission at a glomerular synapse. J Neurosci. 2005;25:8173–8187. doi: 10.1523/JNEUROSCI.2051-05.2005. [DOI] [PMC free article] [PubMed] [Google Scholar]
- Saviane C, Silver RA. Fast vesicle reloading and a large pool sustain high bandwidth transmission at a central synapse. Nature. 2006;439:983–987. doi: 10.1038/nature04509. [DOI] [PubMed] [Google Scholar]
- Sawtell NB. Multimodal integration in granule cells as a basis for associative plasticity and sensory prediction in a cerebellum-like circuit. Neuron. 2010;66:573–584. doi: 10.1016/j.neuron.2010.04.018. [DOI] [PubMed] [Google Scholar]
- Shigemoto R, Nakanishi S, Mizuno N. Distribution of the mRNA for a metabotropic glutamate receptor (mGluR1) in the central nervous system: an in situ hybridization study in adult and developing rat. J Comp Neurol. 1992;322:121–135. doi: 10.1002/cne.903220110. [DOI] [PubMed] [Google Scholar]
- Silver RA, Traynelis SF, Cull-Candy SG. Rapid-time-course miniature and evoked excitatory currents at cerebellar synapses in situ. Nature. 1992;355:163–166. doi: 10.1038/355163a0. [DOI] [PubMed] [Google Scholar]
- Solinas S, Nieus T, D'Angelo E. A realistic large-scale model of the cerebellum granular layer predicts circuit spatio-temporal filtering properties. Front Cell Neurosci. 2010;4:12. doi: 10.3389/fncel.2010.00012. [DOI] [PMC free article] [PubMed] [Google Scholar]
- Takahashi T, Feldmeyer D, Suzuki N, Onodera K, Cull-Candy SG, Sakimura K, Mishina M. Functional correlation of NMDA receptor epsilon subunits expression with the properties of single-channel and synaptic currents in the developing cerebellum. J Neurosci. 1996;16:4376–4382. doi: 10.1523/JNEUROSCI.16-14-04376.1996. [DOI] [PMC free article] [PubMed] [Google Scholar]
- Tikka T, Fiebich BL, Goldsteins G, Keinanen R, Koistinaho J. Minocycline, a tetracycline derivative, is neuroprotective against excitotoxicity by inhibiting activation and proliferation of microglia. J Neurosci. 2001;21:2580–2588. doi: 10.1523/JNEUROSCI.21-08-02580.2001. [DOI] [PMC free article] [PubMed] [Google Scholar]
- van Kan PL, Gibson AR, Houk JC. Movement-related inputs to intermediate cerebellum of the monkey. J Neurophysiol. 1993;69:74–94. doi: 10.1152/jn.1993.69.1.74. [DOI] [PubMed] [Google Scholar]
- Varela JA, Sen K, Gibson J, Fost J, Abbott LF, Nelson SB. A quantitative description of short-term plasticity at excitatory synapses in layer 2/3 of rat primary visual cortex. J Neurosci. 1997;17:7926–7940. doi: 10.1523/JNEUROSCI.17-20-07926.1997. [DOI] [PMC free article] [PubMed] [Google Scholar]
- Viana F, Van den Bosch L, Missiaen L, Vandenberghe W, Droogmans G, Nilius B, Robberecht W. Mibefradil (Ro 40-5967) blocks multiple types of voltage-gated calcium channels in cultured rat spinal motoneurones. Cell Calcium. 1997;22:299–311. doi: 10.1016/s0143-4160(97)90068-3. [DOI] [PubMed] [Google Scholar]
- Wee KSL, Zhang Y, Khanna S, Low CM. Immunolocalization of NMDA receptor subunit NR3B in selected structures in the rat forebrain, cerebellum, and lumbar spinal cord. J Comp Neurol. 2008;509:118–135. doi: 10.1002/cne.21747. [DOI] [PubMed] [Google Scholar]
- Wenzel A, Scheurer L, Künzi R, Fritschy JM, Mohler H, Benke D. Distribution of NMDA receptor subunit proteins NR2A, 2B, 2C and 2D in rat brain. Neuroreport. 1995;7:45–48. [PubMed] [Google Scholar]
- Woodhull AM. Ionic blockage of sodium channels in nerve. J Gen Physiol. 1973;61:687–708. doi: 10.1085/jgp.61.6.687. [DOI] [PMC free article] [PubMed] [Google Scholar]
- Wyllie DJ, Béhé P, Colquhoun D. Single-channel activations and concentration jumps: comparison of recombinant NR1a/NR2A and NR1a/NR2D NMDA receptors. J Physiol. 1998;510:1–18. doi: 10.1111/j.1469-7793.1998.001bz.x. [DOI] [PMC free article] [PubMed] [Google Scholar]
- Xu-Friedman MA, Regehr WG. Ultrastructural contributions to desensitization at cerebellar mossy fiber to granule cell synapses. J Neurosci. 2003;23:2182–2192. doi: 10.1523/JNEUROSCI.23-06-02182.2003. [DOI] [PMC free article] [PubMed] [Google Scholar]
- Yamada K, Fukaya M, Shimizu H, Sakimura K, Watanabe M. NMDA receptor subunits GluRepsilon1, GluRepsilon3 and GluRzeta1 are enriched at the mossy fibre-granule cell synapse in the adult mouse cerebellum. Eur J Neurosci. 2001;13:2025–2036. doi: 10.1046/j.0953-816x.2001.01580.x. [DOI] [PubMed] [Google Scholar]
- Yamazaki T, Tanaka S. A spiking network model for passage-of-time representation in the cerebellum. Eur J Neurosci. 2007;26:2279–2292. doi: 10.1111/j.1460-9568.2007.05837.x. [DOI] [PMC free article] [PubMed] [Google Scholar]
- Zhang W, Howe JR, Popescu GK. Distinct gating modes determine the biphasic relaxation of NMDA receptor currents. Nat Neurosci. 2008;11:1373–1375. doi: 10.1038/nn.2214. [DOI] [PMC free article] [PubMed] [Google Scholar]