

Abstract
The acquisition of drug-resistance mutations by infectious pathogens remains a pressing health concern, and the development of strategies to combat this threat is a priority. Here we have applied a general strategy, inverse design using the substrate envelope, to develop inhibitors of HIV-1 protease. Structure-based computation was used to design inhibitors predicted to stay within a consensus substrate volume in the binding site. Two rounds of design, synthesis, experimental testing, and structural analysis were carried out, resulting in a total of 51 compounds. Improvements in design methodology led to a roughly 1000-fold affinity enhancement to a wild-type protease for the best binders, from Ki of 30–50 nM in round one to below 100 pM in round two. Crystal structures of a subset of complexes revealed a binding mode similar to each design that respected the substrate envelope in nearly all cases. All four best binders from round one exhibited broad specificity against a clinically relevant panel of drug-resistant HIV-1 protease variants, losing no more than 6–13 fold affinity relative to wild type. Testing a subset of second-round compounds against the panel of resistant variants revealed three classes of inhibitors — robust binders (maximum affinity loss of 14–16 fold), moderate binders (35–80 fold), and susceptible binders (greater than 100 fold). Although for especially high-affinity inhibitors additional factors may also be important, overall, these results suggest that designing inhibitors using the substrate envelope may be a useful strategy in the development of therapeutics with low susceptibility to resistance.
Keywords: computational drug design, protease inhibitors, drug resistance, substrate envelope hypothesis, binding specificity, inverse design
Introduction
One of the most important limiting factors in the current treatment of pathogens and cancer is drug resistance resulting from rapidly evolving populations of viruses, bacteria, or tumor cells.1–8 Although resistance can be caused by a variety of mechanisms,6,9–12 one of the most common, especially in viruses, results from mutations in the drug target leading to reduced drug binding yet maintainence of the normal function of the target,6,11,13,14 perhaps at a reduced level. Due to the increasing prevalence of this form of resistance, drugs need to be developed that do not induce these viable escape mutations. Most current efforts to design therapeutics with improved resistance profiles have focused on analyzing the failure modes of existing drugs and designing new compounds that have high efficacy against known resistant mutants.15–18 Although this strategy has met with success,17,19 it has also resulted in the identification of new, unanticipated modes of resistance.20,21 It is clear that a strategy is needed to design drugs that will not be susceptible to escape mutations even when the possible modes of resistance are unknown.
One such strategy, which is especially applicable to targets that are essential enzymes, is to design drugs that mimic the structural features of substrates.22–26 If a drug molecule makes the same or fewer interactions and contacts with the target as substrate, it could be difficult for mutations to evolve that block inhibitor binding yet maintain substrate recognition. Ideally, escape mutants should never survive because they would render the pathogen nonviable. One form of this idea can be summarized as the “substrate envelope hypothesis” — meaning that inhibitors that stay within a consensus substrate shape should be less likely to induce resistance mutations than those that exceed the envelope and provide handles for escape mutations to lower inhibitor affinity selectively (Figure 1).22
Figure 1.

Illustration of the substrate envelope hypothesis. In the wild-type drug target, the traditional inhibitor (A, top) occupies more of the binding site and makes more contacts than a substrate (A, bottom). In B, the drug target has mutated to expand the active site in a region that only contacts the inhibitor (star). The inhibitor (B, top) loses contacts and consequently binding affinity, while the substrate (B, bottom) loses negligible affinity as it never contacted the mutable residue. If the inhibitor had been designed to only make interactions made by the substrate, this resistance mutation might have little effect on its binding affinity.
The goal of this work is to explore the substrate envelope hypothesis as an inhibitor design principle using HIV-1 protease as a model target and computational ligand design techniques to generate inhibitors that mimic the substrate shape. HIV-1 protease was selected as a model system due to the vast amount of structural, inhibitor, and resistance data available. Mechanisms of drug resistance in HIV-1 protease have been well studied,2,6,27 and binding modes of several HIV-1 protease peptide substrates have been determined.22,28 The substrate complexes suggest a consensus substrate envelope22 that can serve as a boundary for drug design studies. In order to design inhibitor molecules that stay within the envelope and are predicted to have high affinity to the protease, we employed a combinatorial small-molecule design technique based on an inverse approach. The novel inverse ligand design strategy implemented here is particularly well suited to generating molecules within a specified envelope because a fixed target shape is integrated, serving as both a limit on the size and shape of the ligand as well as a trial molecular boundary for electrostatic modeling. The methodology makes use of guaranteed discrete search, an efficient grid-based scheme for energetic evaluation with continuum electrostatics, and a hierarchical strategy that uses increasingly accurate physics-based energy functions to refine an ordered list of predicted highest affinity binders. The inverse small-molecule design procedure used a library of scaffold molecules, and placed them discretely within the envelope. Then, a combinatorial search over a discrete space of functional groups was performed to identify molecules that do not extend outside the envelope and are predicted to have high affinity. For this work, the scaffold employed was similar to the scaffold used by the clinical inhibitors amprenavir (APV)15 and darunavir (DRV, TMC114)18 (Table 1, top), which is known to fit well inside the substrate envelope,23 is amenable to efficient synthesis, and, as used here, has three sites for functional group diversity. The functional group library was selected completely naively in the first round of design, and consisted of reagents from chemical catalogs. In a second round of design, the functional group library was biased by lessons learned from the first round.
Table 1.
Inhibitory activity against the wild-type HIV-1 protease for an initial library (Round One) of fifteen compounds designed to stay within the substrate envelope. The dashed lines indicate how the functional groups are converted to fragments for attachment to the (R)-hydroxyethylamino scaffold (top).
 | |||
|---|---|---|---|
| R3 | R2 | R3 | R2 |
 |
 |
 |
 |
| R1 | Ki (nM) | R1 | Ki (nM) |
 |
11a (MIT-1-KK-79) 510 |
 |
12f (MIT-1-AC-83) 2400 |
 |
11b‡ (MIT-1-KK-80) 40 |
 |
12g (MIT-1-AC-84) 1100 |
 |
11c‡ (MIT-1-KK-81) 50 |
 |
12h‡ (MIT-1-AC-86) 33 |
 |
11d (MIT-1-KK-82) 1100 |
 |
12i (MIT-1-KK-94) 610 |
 |
11e (MIT-1-KK-83) 580 |
 |
12j‡ (MIT-1-AC-87) 53 |
| R3 | R2 | R3 | R2 |
 |
 |
 |
 |
| R1 | Ki (nM) | R1 | Ki (nM) |
 |
13j (MIT-1-KK-90) 13000 |
 |
14l (MIT-1-KK-85) 380 |
 |
13i (MIT-1-KK-91) 26000 |
 |
14m (MIT-1-KK-86) 650 |
 |
13k (MIT-1-KK-92) 12000 |
||
Compounds denoted with a ‡ indicate that a crystal structure has been solved of the complex.
Previous studies by this same collaborative effort provided initial support for the substrate envelope hypothesis through retrospective analysis,29 as well a further prospective test of its feasibility in design.30 The latter study used different computational design methodology with the same scaffold to produce two compounds with low nanomolar affinity to wild-type HIV-1 protease and robust binding to a panel of three clinically relevant drug-resistant mutants (CARB-AD37, Ki = 24 nM against WT enzyme with a 15-fold maximal affinity loss in the mutants; CARB-KB45, Ki = 58 nM with a 50–fold maximal affinity loss). HIV-1 protease inhibitors in the clinic tend to bind tighter, and tighter binding inhibitors may be significantly more susceptible to drug resistance mutations.
The current study includes two rounds of design, synthesis, assays, and analysis and presents 51 novel compounds. Analysis of results from the first design round permitted methodological improvements leading to the development of compounds with up to 1000-fold higher affinity for wild-type HIV-1 protease than developed in round one and in previous substrate-envelope studies. Some, but not all, of these tighter-binding inhibitors show robust activity against an expanded panel of drug-resistant HIV-1 protease variants including I50V/A71V, which is a signature mutation for APV and DRV resistance.21,31 These data provide strong support for the utility of the substrate envelope hypothesis as a design principle in the era of drug resistance; the observation that not all envelope-respecting inhibitors led to robust binding indicates that other factors also constribute to resistance. A significant feature of the substrate envelope hypothesis is that prior knowledge of drug resistant strains is not needed.
Results and Discussion
Computational design of an initial substrate envelope inhibitor library
The computational inverse design method was used to build inhibitors that do not exceed the substrate envelope and are also predicted to bind with high affinity to the wild-type protease. The envelope was generated from superimposed substrate peptides bound to an inactivated mutant (D25N) of HIV-1 protease.22 Structure-based computational design was carried out in the substrate envelope in the context of one reactivated (N25D) substrate-bound protease structure (RT–RH). Compounds were generated inside the substrate envelope using the scaffold/functional group scheme presented at the top of Table 1. The (R)-(hydroxyethylamino)sulfonamide scaffold is derived from the clinically approved inhibitors amprenavir15 and darunavir (TMC114).18 This core was selected because it can be efficiently synthesized chemically and is known to fit well inside the substrate envelope, given appropriate functional groups.29 The three substituents grown from this scaffold, termed R1, R2, and R3 are derived from carboxylic acids, primary amines, and sulfonyl chlorides, respectively (Figure 2). Functional groups used in the first-round design procedure were taken from the ZINC database of commercially available compounds,32 augmented by searches of chemical catalogs. The set of functional groups was chosen naively; all compounds that matched the required chemistry were used. For a discrete set of scaffold geometries placed inside the substrate envelope, a discrete space of functional group attachments and conformations was evaluated using combinatorial search techniques and an approximate scoring function. The top-ranked compounds from the combinatorial search were hierarchically re-evaluated using increasingly more accurate physics-based energy functions to identify candidate molecules for synthesis and testing.
Figure 2.

Reaction scheme for the synthesis of the first-round protease inhibitor library. Reagents and conditions: (a) EtOH or iPrOH, 80 °C, 2–3 h; (b) aq. Na2CO3, CH2Cl2, 0 °C to rt, 4–8 h; (c) Et3N, CH2Cl2, 0 °C to rt, 4–8 h; (d) TFA, CH2Cl2, rt, 1 h; (e) EDCI, HOBt, DIPEA, DMF–CH2Cl2 (1:1), 0 °C to rt, overnight.
Eight independent inverse design runs were performed, using a protease structure containing either a doubly deprotonated or singly protonated aspartyl dyad, a tight or loose definition of the substrate envelope, and one of two procedures for positioning the amprenavir/darunavir-like scaffold in the substrate envelope (see Computational Methods). Out of the highest scoring compounds across all design conditions, twenty were selected based on their robustness to the design parameters and cross validation with alternative computational methods,30 of which fifteen were synthesized and tested for inhibition against the wild-type HIV-1 protease (Table 1).
Synthesis of the first-round designed protease inhibitor library
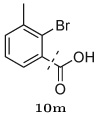
The designed protease inhibitors from the first-round library were prepared according to the synthetic route illustrated in Figure 2. The Boc-protected intermediates (R)-(hydroxyethylamino)sulfonamides 6–9 were prepared according to the procedures described earlier.33 Briefly, ring opening of commercially available chiral epoxide, (1S,2S)-(1-oxiranyl-2-phenylethyl)carbamic acid tert-butyl ester 1 with selected primary amines 2a–b provided the amino alcohols 3–4. Reactions of various sulfonyl chlorides 15a–d with 3 and 4 gave the sulfonamide intermediates, (R)-(hydroxyethylamino)sulfonamides 6–9. After removing the Boc protection, the free amine fragments were coupled with selected carboxylic acids 10a–m in parallel fashion using EDCI/HOBt/DIPEA in a DMF–CH2Cl2 (1:1) mixture (Method A) to afford the designed inhibitors 11–14.
Experimental and computational evaluation of the round one inhibitor library
Of the twenty designed compounds, fifteen were synthesized and their inhibitory activity (Ki) was experimentally measured against the wild-type HIV-1 protease using an enzymatic inhibition assay.33,34 The results of these assays are shown in Table 1. All fifteen compounds tested had measurable inhibitory activity against the wild-type protease, with Ki values of approximately 30–26,000 nM. Four compounds had Ki values of 50 nM or less.
When comparing the structures of the compounds and their relative binding affinities, several trends emerged. For example, the use of a methylated isoxazole ring at the R3 position was detrimental to binding, resulting in inhibition constants greater than 10 µM. This was surprising considering that these compounds were predicted to make strong hydrogen bonding interactions with the backbone amide hydrogens of protease residues Asp29 and Asp30. It is possible that the presence of the methyl group biased the conformation of the inhibitors in the unbound state, which was not accounted for in the computational design algorithm. The five additional compounds that were designed but not synthesized all contained this isoxazole ring and would likely have poor affinity.
Several other groups that were predicted to make hydrogen bonding interactions led to favorable binding affinities in this set of compounds, including an N-acetyl-L-alaninyl substitution 10h at R1, a catechol ring 10c at R1, and an m-anisole 5a at R3 in several compounds. In addition, several non-polar groups also led to more potent inhibitors, including fluorinated groups 10b, 10j, and 5b at R1 and R3 in several compounds, and a thiophene ring 2a at R2.
Overall, even the best binders in the first round of designed compounds, while similar to that from previous substrate envelope studies,30 were still 2–4 orders of magnitude weaker than clinically approved inhibitors (Table 3). This finding prompted a re-evaluation of the computational procedure to identify limitations that may have contributed to lower potency. One possible explanation is the commonly designed thiophene ring at the R2 position, which interacts with the P1/P1′ pocket of the protease. The majority of known tight-binding inhibitors of HIV-1 protease use highly aliphatic or aromatic groups to interact with this hydrophobic pocket.35 Perhaps the thiophene ring may still be too polar for the hydrophobic P1 subsite. However, the thiophene moiety was one of the least polar functional groups available in the naive primary amine library used to diversify the R2 position in the inverse design calculations. Unsubstituted aliphatic and aromatic groups were not present in the set of compounds searched at R2. Therefore, the low affinity observed in this first-round library may be due to limited diversity in the initial selection of functional groups, rather than deficiencies in the design algorithm itself.
Table 3.
Experimental Ki values (in nM) for the binding of clinically approved inhibitors and designed substrate-envelope inhibitors to a panel of drug-resistant HIV-1 protease mutants. Worst fold loss is defined as the ratio between the Ki values of the weakest-binding mutant and the wild-type protease.
| Inhibitor | WT | M1 (L10I, G48V, I54V, L63P, V82A) |
M2 (D30N, L63P, N88D) |
M3 (L10I, L63P, A71V, G73S, I84V, L90M) |
M4 (I50V, A71V) |
Worst fold loss |
|---|---|---|---|---|---|---|
| ritonavir (RTV) | 0.055 | 3.0 | 0.46 | 2.8 | NDa | 55 |
| saquinavir (SQV) | 0.065 | 90 | 1.0 | 78 | ND | 1385 |
| indinavir (IDV) | 0.18 | 34 | 0.73 | 21 | ND | 189 |
| nelfinavir (NFV) | 0.28 | 15 | 3.5 | 19 | ND | 68 |
| lopinavir (LPV) | 0.005 | 6.1 | 0.040 | 0.90 | ND | 1220 |
| amprenavir (APV) | 0.10 | 0.15 | 0.21 | 1.4 | 0.34 | 14 |
| atazanavir (ATV) | 0.046 | 0.33 | 0.009 | 0.49 | ND | 11 |
| tipranavir (TPV) | 0.088 | 0.014 | 0.001 | 0.032 | ND | 0.36 |
| darunavir (DRV) | 0.008 | 0.005 | 0.041 | 0.025 | 0.33 | 41 |
| 11b (MIT-1-KK-80) | 42 | 260 | 85 | 79 | ND | 6 |
| 11c (MIT-1-KK-81) | 50 | 380 | 66 | 140 | ND | 8 |
| 12h (MIT-1-AC-86) | 33 | 270 | 29 | 95 | ND | 8 |
| 12j (MIT-1-AC-87) | 53 | 140 | 130 | 670 | ND | 13 |
| 27a (MIT-2-KB-83) | 0.14 | 1.5 | 0.020 | 2.0 | 0.84 | 14 |
| 27b (MIT-2-KB-84) | 0.24 | 3.0 | 0.79 | 9.7 | ND | 40 |
| 28a (MIT-2-KB-98) | 0.027 | 5.9 | 0.12 | 1.8 | 1.2 | 219 |
| 28b (MIT-2-KB-99) | 0.12 | 7.6 | 0.45 | 2.6 | ND | 63 |
| 29a (MIT-2-AD-89) | 0.12 | 0.99 | 0.064 | 1.6 | 4.1 | 34 |
| 29b (MIT-2-AD-86) | 0.062 | 3.5 | 0.84 | 7.0 | 5.3 | 113 |
| 30a (MIT-2-AD-93) | 0.036 | 0.44 | 0.31 | 0.57 | 0.10 | 16 |
| 30b (MIT-2-AD-92) | 0.063 | 0.93 | 0.49 | 6.5 | 5.4 | 103 |
| 30d (MIT-2-AD-94) | 0.063 | 1.1 | 0.88 | 5.0 | 1.3 | 79 |
| 32c (MIT-2-KC-08) | 0.014 | 0.41 | 0.094 | 2.4 | 0.24 | 171 |
ND, not determined
Another possibility was the choice of protease structure used for design. In this first-round inhibitor library, the substrate envelope was placed inside a protease structure derived from one of the substrate-inactivated protease crystal structures. Subsequent evaluation of the ability of the calculated energetics to reproduce experimental affinities revealed that the computational techniques had trouble discriminating tighter- from weaker-binding inhibitors when they were designed against the substrate-bound protease structure (Figure 5A). This issue was alleviated when the compounds were designed against a protease structure derived from a darunavir complex (Figure 5B). These results suggest the amprenavir/darunavir scaffold may induce a particular protease conformation that is necessary for the correct scoring and ranking of inhibitors based around this scaffold.36
Figure 5.

Comparisons between predicted and experimental binding affinities. (A) The round one designed compounds (green), as well as the clinical inhibitor amprenavir (APV) (black), were generated and scored using a substrate envelope inside a protease structure derived from a substrate complex. (B) Round one (green) and round two compounds (blue), in addition to the clinical inhibitors amprenavir (APV) and darunavir (DRV) (black), were designed and scored inside a “maximal” envelope that completely fills the active site of a HIV-1 protease structure derived from a complex with darunavir. Generating and scoring compounds without the substrate envelope constraint and inside a structure bound to a similar scaffold improves the ability to differentiate between tighter and weaker binders. Experimental Ki values were converted to binding energies by assuming that Ki = Kd and that ΔGbind = +RT lnKd.
Computational design, synthesis, and experimental testing of a higher-affinity substrate envelope inhibitor library
Given that the clinically approved HIV protease inhibitors all have at least 0.1 nM potency against the wild-type protease, it is important to test the substrate envelope hypothesis in the context of high-affinity inhibitors because they may have more intrinsic susceptibility to resistance mutations. To this end, we repeated the computational inhibitor design procedure using the knowledge gained from the first round of design in order to propose compounds predicted to remain inside the substrate envelope and have improved potency against the wild-type protease. Specifically, the library of functional groups was biased towards the most successful substituents from the first round, and the substrate envelope was placed inside a darunavir-bound protease structure. For this second-round of design, only a doubly-deprotonated protease structure was used because in the first round of design the protonation state did not significantly alter relative energetics. In addition, only the tighter definition of the substrate envelope was utilized because this yielded the more potent compounds in the first round of design.
To select inhibitors for synthesis and testing, the top 1000 compounds from the inverse design procedure were analyzed to identify combinatorial libraries that were completely contained within this top-scoring set. One such set, consisting of thirty-six members, was chosen based on diversity and the structure-activity relationships learned from the first round of design. This library contained all possible combinations of six groups at the R1 position, three groups at the R2 position, and two groups at the R3 position (Figure 2), and was synthesized in an analogous manner to the first-round library as shown in Figure 3. The intermediate (R)-(hydroxyethylamino)sulfonamides 20–25 were deprotected, and the resulting free amines were coupled with selected carboxylic acids 26a–f in a parallel fashion using two slightly different coupling methods to afford the designed inhibitors 27–32. The carboxylic acids 26a–b were reacted with the free amines under standard amide coupling conditions using EDCI/HOBt/DIPEA in a DMF-CH2Cl2 (1:1) mixture (Method A). The carboxylic acids 26c–f, with an α-hydroxy, β-hydroxy, or amino group, were coupled with free amines using only EDCI/HOBt in a H2O–CH2Cl2 (1:1) mixture (Method B) to avoid racemization.37
Figure 3.

Reaction scheme for the synthesis of the second-round protease inhibitor library. Reagents and conditions: (a) EtOH or iPrOH, 80 °C, 2–3 h; (b) aq. Na2CO3, CH2Cl2, 0 °C to rt, 4–8 h; (c) TFA, CH2Cl2, rt, 1 h; (d) EDCI, HOBt, DIPEA, DMF–CH2Cl2 (1:1), 0 °C to rt, overnight (e) EDCI, HOBt, H2O–CH2Cl2 (1:1), 0 °C, 24 h.
The thirty-six designed substrate-envelope inhibitors were tested for inhibition against the wild-type HIV-1 protease. Overall, the second-round substrate envelope inhibitor library had significantly improved potency, with Ki values ranging from 14 pM to 4 nM (Figure 2). It should also be noted that compound 27a has been reported previously.38
Again, interesting structure–activity relationships could be identified in the binding data. For example, utilizing an N-acetyl-L-valinyl substituent 26c at the R1 position consistently led to inhibitors with Ki values less than 0.1 nM, for all the choices made at the R2 and R3 positions. Conversely, selecting the n-pentyl substituent 15c at the R2 position generally led to the weakest-binding compounds, except when paired with the N-acetyl-L-valinyl group 26c at R1, where it led to two of the most potent compounds. Several of these context-dependent functional group binding contributions are present in the data, suggesting that there may be significant non-additive interactions between the protease subsites upon binding. Other general trends include replacement of the para-anisole substituent 19a at R3 with the benzothiazolyl group 19b often leading to a several-fold improvement in Ki, and replacement of the isobutyl group 15a at R2 with a (S)-2-methylbutyl group 15b also leading to more potent inhibitors. Interestingly, replacement of the N-acetyl-L-valinyl substituent 26c with a similar R1 group derived from L-α-hydroxylisovaleric acid 26d often led to significantly weaker binders, suggesting that the amide group plays an important role in the potency of the N-acetyl-L-valinyl substituent 26c, presumably through peptide-like interactions with the protease.
Experimental binding affinities to drug-resistant HIV-1 proteases
In order to gain initial insight into whether compounds designed to stay within the substrate envelope would be less likely to elicit escape mutations, the inhibition constants for several designed compounds were experimentally measured in drug resistant proteases. Four drug resistant HIV-1 protease mutants were selected from previously identified sets of co-evolving mutations in drug resistant clinical isolates by Shafer and coworkers39 and Swanstrom and coworkers.40 The four drug resistant variants of HIV-1 protease, which are prototypes of different patterns of drug resistance, included: two multi-drug resistant variants M1 (L10I, G48V, I54V, L63P, V82A) and M3 (L10I, L63P, A71V, G73S, I84V, L90M), a signature variant of nelfinavir (NFV) resistance M2 (D30N, L63P, N88D) and a signature variant of APV and DRV resistance M4 (I50V, A71V). The four designed compounds from the first-round library with the highest affinity for the wild-type protease and diverse compounds from the second-round library were tested for binding against the drug resistant proteases, in addition to the clinical inhibitors ritonavir (RTV),41 saquinavir (SQV),42 indinavir (IDV),43 nelfinavir (NFV),44 lopinavir (LPV),45 amprenavir (APV),15 atazanavir (ATV),46 tipranavir (TPV),16 and darunavir (DRV).18 The results of the binding assays are shown in Table 3.
The clinical inhibitors saquinavir and lopinavir exhibited the worst resistance profiles, each losing more than 1,000-fold inhibition relative to wild type in the M1 (L10I, G48V, I54V, L63P, V82A) protease, which was unsurprising given that the M1 mutations were known to co-evolve in response to lopinavir and saquinavir treatment.40 On the other hand, second- and third-generation protease inhibitors such amprenavir, darunavir, and atazanavir exhibited a relatively flat resistance profile for these protease mutants, with affinity losses less than 15-fold. These inhibitors are primarily impacted by M3 mutations (L10I, L63P, A71V, G73S, I84V, L90M), which are known, for example, to correlate with amprenavir treatment.40 Although tipranavir was actually more potent against these particular drug-resistant protease variants than it was against the wild type, tipranavir is known to be susceptible to drug resistance, primarily through novel mutation pathways.47,48 The M4 mutations (I50V, A71V), known to arise in response to amprenavir and darunavir treatment, had little effect on amprenavir and designed inhibitors, and a modest effect on darunavir binding. Lastly, the M2 mutations (D30N, L63P, N88D) had a minimal effect on the inhibitors except in the case of nelfinavir, where modest resistance was observed, in accordance with previous findings.44
Although the first-round designed inhibitors bound more weakly than the clinical compounds, they had resistance profiles similar to or better than amprenavir and darunavir, losing at most 6–13 fold inhibition in the three mutants tested (M1–M3). One interesting feature in the resistance patterns of the round-one inhibitors was that small changes in structure were sufficient to shift the resistance profile. For example, when an N-acetyl-L-alaninyl group at R1 in compound 12h was changed to a trifluoroisobutenyl group in compound 11c, the resistance profile shifted from being M1 (L10I, G48V, I54V, L63P, V82A) sensitive to M3 (L10I, L63P, A71V, G73S, I84V, L90M) sensitive.
Results were more mixed for the second-round inhibitors, which all have significantly improved potency against the wild-type protease. The ten second-round inhibitors that were tested fall into three main classes — two that remain potent against the mutant panel (< 15-fold affinity loss), four that have a moderate shift (< 80-fold), and four that are highly susceptible to resistance mutations (> 100-fold). Again, very small changes in molecular structure, such as the addition of a methyl group to compound 28a to generate compound 30a, were sufficient to dramatically alter the resistance profile (in this case, a 10-fold difference in the M1 mutant). Interestingly, there was no significant relationship between the potency against the wild-type protease and the resistance profile. For example, the potent inhibitor 30a (36 pM), had a relatively flat resistance profile (16-fold loss), while the weaker inhibitor 28b (120 pM) was susceptible to the M1 mutations (L10I, G48V, I54V, L63P, V82A) (64-fold loss). This specific finding contradicts the natural assumption that it is intrinsically easier to develop resistance against a tighter-binding inhibitor than a weaker-binding one, yet the trend remains that the (nanomolar) round-one inhibitors had flatter resistance profiles than the (picomolar) round-two inhibitors.
Crystal structures of designed compounds bound to wild-type HIV-1 protease
To further understand the resistance profiles for the designed substrate-envelope inhibitors in a structural context, crystal structures were solved of complexes between nine designed inhibitors and the wild-type HIV-1 protease. Out of the nine solved complexes, four were of the tightest binding inhibitors from the round one library, while the remaining five were of diverse inhibitors from the second-round library. Crystallographic information and statistics for these structures can be found in Table 4.
Table 4.
Crystallographic and refinement statistics
| 11b (MIT-1-KK-80) |
11c (MIT-1-KK-81) |
12h (MIT-1-AC-86) |
12j (MIT-1-AC-87) |
29b (MIT-2-AD-86) |
30a (MIT-2-AD-93) |
30d (MIT-2-AD-94) |
32c (MIT-2-KC-08) |
28a (MIT-2-KB-98) |
|
|---|---|---|---|---|---|---|---|---|---|
| Resolution (Å) | 2.1 | 2.0 | 1.9 | 1.85 | 1.85 | 1.80 | 1.95 | 1.85 | 1.85 |
| Space group | P212121 | P212121 | P212121 | P212121 | P212121 | P212121 | P212121 | P212121 | P212121 |
| a (Å) | 50.91 | 50.83 | 50.67 | 50.74 | 50.80 | 50.86 | 50.88 | 50.88 | 50.91 |
| b (Å) | 58.11 | 58.06 | 57.98 | 57.94 | 58.04 | 58.18 | 58.37 | 58.23 | 58.26 |
| c (Å) | 61.63 | 61.76 | 61.54 | 61.70 | 61.76 | 61.80 | 61.84 | 61.81 | 61.81 |
| z | 4 | 4 | 4 | 4 | 4 | 4 | 4 | 4 | 4 |
| Rmerge (%) | 5.1 | 5.4 | 4.7 | 6.5 | 5.8 | 4.2 | 6.6 | 4.2 | 4.4 |
| Completeness (%) | 99.0 | 99.7 | 98.6 | 95.4 | 99.9 | 94.5 | 98.2 | 95.8 | 92.5 |
| Total no. of reflections | 76441 | 85715 | 98469 | 86034 | 89209 | 106905 | 94050 | 97446 | 75550 |
| No. of unique reflections | 11126 | 12846 | 14666 | 15443 | 16171 | 16632 | 13691 | 15597 | 15105 |
| Rfree (%) | 23.0 | 20.5 | 19.7 | 20.5 | 20.3 | 20.3 | 21.0 | 21.0 | 21.2 |
| Rfactor (%) | 17.0 | 15.6 | 15.9 | 16.6 | 17.4 | 17.3 | 17.4 | 17.3 | 17.0 |
| RMSDa in | |||||||||
| Bond lengths (Å) | 0.008 | 0.008 | 0.008 | 0.008 | 0.008 | 0.008 | 0.008 | 0.007 | 0.007 |
| Bond angles (°) | 1.267 | 1.211 | 1.240 | 1.227 | 1.215 | 1.193 | 1.160 | 1.298 | 1.253 |
| Temperature (°C) | −80 | −80 | −80 | −80 | −80 | −80 | −80 | −80 | −80 |
| PDBb ID | 2QI0 | 2QI1 | 2QHY | 2QHZ | 2QI7 | 2QI4 | 2QI3 | 2QI5 | 2QI6 |
RMSD, root mean square deviation
PDB, Protein Data Bank
Overall, these crystal structures had strong similarities to previously solved HIV–1 protease-inhibitor complexes containing the (R)-hydroxyethylamino scaffold.18 In all nine crystal structures, the regions of the inhibitors that were analogous to APV/DRV conserved the network of hydrogen bonds and water. When the structures were superimposed with each other, the protease backbone of four structures of high nanomolar inhibitor complexes from the first-round library showed considerable variation, while the protease backbone of the five complexes with inhibitors with subnanomolar affinity all clustered together very tightly. The high affinity structures were also closer in conformation with the structure of the complex with APV. Thus, high affinity inhibitors of this scaffold seem to converge the overall conformation of HIV-1 protease to a very similar low energy minimum.
When comparing the crystal structures of inhibitors to their resistance profiles, we also focused our attention on pairs of compounds where small changes in the inhibitor structure led to significant changes in inhibition against the mutant panel. For example, in the first-round substrate envelope library, inhibitors 12h and 12j differ only by the R1 substituent, yet the resistance profile switched from being M1 (L10I, G48V, I54V, L63P, V82A) to M3 (L10I, L63P, A71V, G73S, I84V, L90M) sensitive, respectively. Comparing the crystal structures of 12h and 12j reveals that for 12h, the N-acetyl-L-alaninyl substituent 10h at the R1 position makes direct hydrogen bonding interactions with Gly48, a residue that is mutated to Val in the M1 variant to which inhibitor 12h is sensitive (Figure 4A). The trifluoroisobutenyl group 10j present at R1 in compound 12j does not make this contact. Analogously, in the structure of 12j, the trifluoroisobutenyl group 10j makes intimate contact with residue Ile84, which is mutated to Val in the M3 variant (Figure 4A). The β-carbon of the N-acetyl-L-alaninyl group 10h, in contrast, makes less contact with Ile84. In sum, for the inhibitors 12h and 12j, the presence and absence of inhibitor–protease contacts in the wild-type context can help to explain the observed resistance profiles.
Figure 4.

Crystallographic contacts with mutable residues for pairs of similar designed compounds that exhibited different resistance profiles. Compound 12h (cyan carbons) contacts the M1 mutable residue Gly48, and makes minimal contacts with the residue Ile84, mutated to Val in the M3 variant. Compound 12j (purple carbons) makes close contacts with the M3 mutable residue Ile84, while avoiding Gly48 (A). Compound 30a (cyan carbons) and 28a (purple carbons) differ by one methyl group, in the proximity of Val82, which is mutated to Ala in the M1 variant (B). Compound 28a is sensitive to the M1 mutations, even though it makes less contact with Val82. Both 30a (cyan carbons) and 30d (purple carbons) do not contact Ile84, even though the latter is M3 sensitive (C).
Small changes in inhibitor structure also led to significant changes in inhibition against the mutant panel for the second-round compounds, but the ability to rationalize these results with the wild-type crystal structures was less obvious. For example, compounds 30a and 28a differ by a single methyl group on the R2 substituent, yet the resistance profile changes from being relatively flat to M1 variant (L10I, G48V, I54V, L63P, V82A) sensitive. The crystal structures for 30a and 28a are almost completely superimposable, and the extra methyl group in compound 30a buries 3.7 Å2 of additional accessible surface area against the side chain of Val82, which is mutated to Ala in the M1 variant (Figure 4B). Although it is surprising that 30a, given its flat resistance profile, makes more extensive contacts to this mutable residue, one possible explanation for its broad specificity is that the extra methyl group can compensate for lost packing interactions in the V82A background. The ability for compounds to compensate for lost interactions may not be visible through analysis of the wild-type structure alone, and may require structural studies in the mutant background.49,50
Another pair of similar compounds with different resistance profiles from the second-round library is 30a and 30d, which vary only at their R1 substituents. Although 30d is sensitive to the M3 variant (L10I, L63P, A71V, G73S, I84V, L90M), both 30a and 30d do not make close contacts with the mutable Ile84 side chain present in the protease binding site (closest non-hydrogen–non-hydrogen distance is 4.2 and 4.7 Å, respectively) (Figure 4C). It is possible that other mechanisms besides changes in direct inhibitor–protease interaction may be involved in the sensitivity of 30d to the M3 mutations, for example, changes in the structural dynamics of the protease.51–54
Overall, comparing the crystal structures of the designed substrate-envelope inhibitors to their profiles against drug-resistant HIV-1 protease variants helped to reveal possible structural mechanisms of resistance. In some cases, the resistance profiles could be rationalized by the observed inhibitor–protease contacts in the binding site. In other cases, inhibitors that had broad specificity made extensive contacts to mutable residues, suggesting that they may be able to compensate for lost contacts upon mutation.50 Finally, some inhibitors were sensitive to mutations in the binding site that they do not contact in the wild-type protease, possibly indicating that some rearrangement occurs in the mutant variant complex.
Comparison of calculated and experimental binding affinities
In order for computational inhibitor design algorithms to enrich libraries with compounds that bind tightly experimentally, it is important that the scoring functions used for design correlate well with experimental affinities. The energy function used to perform the final ranking of compounds in the inverse design procedure was based on a rigid-binding Poisson–Boltzmann surface area (PBSA) approach.55 It included contributions to the binding free energy from direct van der Waals interaction, electrostatic solvation and interaction as computed with the linearized Poisson–Boltzmann equation, and a non-polar solvation term directly proportional to the surface area buried upon binding.
After designing the first round of substrate-envelope inhibitors in a substrate-bound protease structure, we compared the calculated energies from the inverse design procedure to those determined experimentally (Figure 5A). Overall, little or no correlation was observed between the computed and experimental binding energies for these designed compounds. Previous reports have shown that it is difficult for computation to discriminate between compounds that are separated by less than 3–4 orders of magnitude in binding affinity with energy functions similar to those used in this work.56 Surprisingly, APV was not ranked significantly better than the designed compounds when designed inside a substrate-bound protease, considering that its experimental inhibition constant was five orders of magnitude tighter than the weakest binding designed inhibitors.
In an attempt to improve the predictive ability of our energetic model, several modifications to the scoring function were tested for the ability to improve agreement between computed and measured affinities in round one of this study in preparation for round two. While the transferability of such modifications to other active sites, or even other scaffolds in this site may be limited, they could nevertheless prove quite useful. Modifications tested included using several dielectric constants for the molecular interior, several minimization protocols for the designed structures before scoring, and applying several methods for weighting the various energy terms to determine a final score. However, none of these efforts resulted in significantly better agreement with experiment (data not shown). The inability to improve correlation led to a close examination of the predicted structure for amprenavir from inverse design in the minimal shape. Due to the position of the Ile84 side chain in the substrate-bound protease structure, the isobutyl group of amprenavir was unable to adopt the conformation observed in its own crystal structure (PDB accession code 1HPV15) due to the presence of a van der Waals clash. Therefore, another possible explanation for the poor energy ranking was that the substrate-bound protease structure lacked the induced-fit conformation required to bind the amprenavir/darunavir scaffold.
Significant improvement in the correlation between computed and measured affinity resulted when the target protease structure and the model used for the design envelope were both changed. When designing the inhibitors presented in this work, compounds were not permitted to extend beyond the substrate envelope. Compounds designed with low-energy conformations within the substrate envelope may have a lower-energy conformation that exceeds the envelope; the exceeding structure could be adopted when bound to wild-type protease and the envelope-respecting structure could be adopted when in complex with certain resistance mutants. The addition of the substrate envelope constraint on ligand geometry may have been partially responsible for decreased correlation with wild-type affinity. However, the use of a “maximal” ligand envelope in inverse design, which completely fills the central four pockets of the protease active site, was still insufficient to observe correlation with experimental affinities when used in conjunction with a protease structure derived from a substrate complex. It was also necessary to switch from using a protease structure from a substrate complex to using a protease structure that was bound to an inhibitor containing a scaffold similar to the one used in the designed compounds.
The inverse design procedure was repeated using the protease structure from a complex with darunavir18 and a maximal envelope that completely filled the central four subsites (P2-P2′) of the protease. The functional group library used for design contained the fragments necessary to regenerate both the first- and second-round designed compounds as well as those needed to generate amprenavir and darunavir. The highest ranking combinatorially generated structures for each of these compounds were evaluated using the full PBSA scoring function, and the correlation between these energies and those from experiment is shown in Figure 5B.
After changing the envelope definition and protease structure, there was significant improvement in the correlation between calculated and experimental binding free energies (R2 = 0.8). The scoring function correctly predicted the improved potency of the round-two inhibitors as compared to round one, and correctly ranked amprenavir (APV) and darunavir (DRV) among the designed compounds. Interestingly, there was not much improvement in the relative ranking of compounds within either the round-one or round-two libraries, most likely due to the difficulty in predicting small binding free energy differences with the scoring function used here.56 Additionally, the experimentally measured binding free energies amount to roughly 30% of the computed energies, consistent with the neglect of changes in configurational entropy on binding.57,58 Although results are only presented for the darunavir-bound protease structure, re-designing the compounds in a protease structure derived from a complex with amprenavir (PDB accession code 1HPV),15 led to similarly improved correlation (data not shown). These results reinforce the importance of induced fit in correctly scoring inhibitor affinity.36
Comparison of predicted and experimentally determined structures
In addition to observing correlation between predicted and experimentally determined binding free energies, it is important that the structural models used for scoring in computational design are predictive of the true experimental structures. To this end, crystal structures were determined of complexes between wild-type HIV-1 protease and the four tightest binding designed inhibitors from the first round of design as well as five diverse compounds from the second round of design. When comparing predicted to experimental structures, two structural models were available for each designed compound. The first was the initial structure designed against the substrate envelope in a substrate- or darunavir-bound protease used to propose compounds for synthesis, and the second was the structure used for improved energy function correlation designed without the substrate envelope constraint in the darunavir-bound protease. Because a crystal structure is a representative low-energy structure (or average of multiple such structures), it made sense to initially compare geometries against the structural prediction designed without envelope constraints.
In general, the structural agreement between the predicted (without envelope) and experimental structures was reasonably high (Figure 6). After aligning the protease structures, the root-mean-square deviation (RMSD) in coordinate positions for non-hydrogen atoms of the inhibitors were all less than 1.25 Å. The major structural differences included a flip of the thiophene ring orientation in all of the first-round inhibitors, small misalignments in the R1 group position for 12j, 11c, 29b (as compared to both experimental geometries), and 30d, and 180° ring flips in the R1 groups for 11b, 28a, and 30a. Additionally, the conformation of the n-pentyl R2 substituent 21c in inhibitor 32c was not predicted correctly; this substituent has a large number of rotatable bonds and low-energy states.
Figure 6.

Comparison between predicted and experimentally determined binding modes for nine designed inhibitors. Predicted structures were derived from inverse design calculations without the substrate envelope constraint, and are drawn in atom colors (cyan carbons) while the crystal structure is in purple. Green atoms are fluorine. For clarity, hydrogen atoms have been omitted and only one of the two crystallographically determined orientations for compound 29b is shown. Although the protease has not been shown for clarity, the alignment of predicted and crystallographic structures were prepared by aligning all Cα atoms of the protease and not the inhibitor structures.
When the substrate envelope was superimposed on the crystal structures of the inhibitors, it was clear that the thiophene ring contained in all of the crystallized first-round designed compounds protruded (Figure 7A). This finding is significant because it implies that a lower energy structure can be obtained if the inhibitors are allowed to leave the envelope, the same conclusion obtained from the previous scoring-function analysis. Consequently, the predicted structures for the round-one inhibitors containing a thiophene group 11a at R2 designed using the envelope constraint in a substrate-bound protease structure had less similarity to the crystal structures (Figure 7B). In order for these round-one inhibitors to stay within the confines of the substrate envelope, the sulfonamide nitrogen inverted (as compared to the crystal structure; see also Reference 30) and the thiophene ring at R1 rotated almost 180° with respect to its linkage to the scaffold. This predicted geometry, where the substituents interacting with the P1 and P1′ protease pockets are pointing away from each other, is very reminiscent of the binding mode that the substrates utilize.22 The crystallographic binding modes for the round-two inhibitors, in almost all cases, remained inside the substrate envelope even when their conformation differed from computational prediction (without the substrate envelope constraint) (Figure 6). The only exception was compound 29b, where in one of the two experimentally observed configurations, the terminal methyl group of the R1 substituent exceeded the envelope definition by approximately 0.75 Å (Figure 7C). Again, when this compound was initially computationally designed to stay within the substrate envelope, it was predicted to adopt a slightly altered conformation that remained inside the envelope. Interestingly, in the other experimentally observed orientation for 29b, the R1 substituent also adopts a conformation that remains inside the substrate envelope (Figure 7D).
Figure 7.

Superposition of the substrate envelope (transparent orange) on the crystallographic or predicted structures of selected designed inhibitors. In the crystal structure of 12h, the thiophene ring exceeded the substrate envelope (A), while the predicted structure for 12h within the substrate envelope (B) adopted a different conformation for the R2 substituent that was reminiscent of the substrate-bound structures.27 The terminal methyl group of the R1 substituent of compound 29b exceeded the envelope in one of the two inhibitor geometries observed in the crystal structure (C). In the alternative experimentally observed conformation for 29b, the R1 substituent adopted a different conformation that remained inside the substrate envelope, similar to the structure originally predicted by computational design (D). Structures that protruded (A, C) are drawn using a space-filling model to highlight regions that exceed the substrate envelope.
With the exception of the thiophene R2 group in the first-round inhibitors, designed functional groups generally remained inside the substrate envelope in their respective crystal structures, suggesting that the inverse ligand design methodology can successfully generate inhibitors that strictly occupy the substrate envelope in the majority of cases. Although a few of the designed inhibitors exceeded the envelope in their lowest-energy configuration, structural and computational analyses imply they may be able to retreat inside the envelope and adopt an envelope conformation with a small energetic penalty. This has led to a refinement of the substrate envelope hypothesis, where the only requirement of an envelope inhibitor is that a binding mode exists that remains inside the substrate shape, and is energetically close to the unconstrained binding conformation.
Conclusions
The present study further tests the substrate envelope hypothesis as a design principle for the development of inhibitors less likely to induce resistance mutations in a drug target and extends the analysis to include highly potent inhibitors. Using HIV-1 protease as a model system, a computational inverse small-molecule design strategy was employed to generate protease inhibitors predicted to have favorable binding energetics while remaining inside an envelope defined by crystal structures of substrate complexes. These compounds were combinatorially generated using a molecular scaffold derived from the clinical HIV-1 protease inhibitors amprenavir and darunavir, known to bind and stay within the HIV-1 protease substrate envelope, as well as functional group libraries derived from commercial sources.
Two rounds of design, synthesis, experimental testing, and structural analysis were performed. In the first round, fifteen substrate-envelope inhibitors were chemically synthesized and tested for binding against wild-type HIV-1 protease; all bound detectably, with four compounds characterized by inhibition constants (Ki) ranging from 30–50 nM. These four compounds exhibited broad specificity against a panel of three drug resistant mutant HIV-proteases, losing no more than 6–13 fold affinity relative to wild type. A comparison of predicted to experimental binding free energies as well as predicted to crystallographic structures for inhibitors highlights the limitations and strengths of our computational models, some of which led to altered procedures in the second round, including the use of targeted functional group libraries and a protein complex with an inhibitor from the same family, rather than a substrate-bound structure, as the base conformation for design. Thirty-six envelope inhibitors were chemically synthesized and tested in the second round. All compounds bound with affinities between 14 pM–4 nM, with twelve compounds binding tighter than 100 pM. That is, all compounds were of higher affinity than the first round, with the best compounds roughly 1000-fold improved. Crystal structures of a subset of the complexes revealed binding modes that respected the substrate envelope and were similar to those predicted computationally. A favorable comparison between computed and experimentally determined binding affinities validated modifications to the computational inhibitor design procedures. Testing a subset of these tighter-binding second-round compounds against the panel of resistant protease variants revealed three classes — some compounds exhibited robust binding across the panel with a maximum affinity loss of 14–16 fold, some compounds were moderately susceptible to drug-resistance mutations, losing up to 35–80 fold in affinity, and a third classes were highly susceptible, losing greater than 100 fold in potency.
Overall, these results suggest that designing inhibitors that mimic substrates may be a useful strategy in the development of therapeutics with better resistance properties, but that additional factors beyond the substrate envelope may be important, especially for very potent inhibitors. The substrate envelope hypothesis, as currently posited, is a static and local model, assuming that substrate similarity can be captured by a single envelope shape and by the direct contacts this envelope makes with the target protein. The presented crystallographic analysis revealed, in several cases, that inhibitors sensitive to particular mutations either did not contact mutable residues directly, or were suggestive of compensatory interactions that broad-specificity inhibitors could utilize to adapt to binding-site variations. Comparing the crystal structures to the substrate envelope revealed cases where inhibitors exceeded the envelope, yet had favorable resistance profiles. Calculations predict that these compounds, with a minimal energetic cost, can adopt alternative binding modes contained within the substrate envelope. Furthermore, in order to observe a favorable comparison between calculated and experimentally-determined binding affinities, it was necessary to allow the designed inhibitors to adopt a conformation without the substrate envelope constraint, suggesting that experimentally, low-energy binding modes may exceed the envelope, even for inhibitors with favorable resistance profiles. These findings provide evidence that structural dynamics may also play an important role in drug resistance51–54 and serve to further refine the substrate envelope hypothesis. In addition to remaining inside the substrate envelope, inhibitors that successfully avoid eliciting drug-resistance mutations should likely exhibit the same structural dynamics and plasticity as the substrate peptides. While the work reported here is based around a scaffold similar to clincially approved HIV-1 protease inhibitors, the prinicples are quite general and should be applicable to any scaffold capable of supporting inhibitors that bind within the substrate envelope.
Materials and Methods
Computational Methods
HIV-1 protease structure preparation
Crystal structures of five inactivated HIV-1 protease–substrate peptide complexes were obtained from the Protein Data Bank (PDB)59 (Accession codes 1F7A, 1KJ7, 1KJF, 1KJG, and 1KJH)22,28 in addition to a structure of HIV-1 protease bound to the inhibitor darunavir (Accession code 1T3R).18 Although a sixth substrate complex was available, it was not used in this study because of its poorer resolution. For structures with multiple occupancy, the first conformation was used in all calculations. In all structures, the terminal side-chain dihedral angle for asparagine, glutamine, and histidine residues was considered for a 180° rotation if it would improve the geometry of local hydrogen bonding. All water molecules were removed from the protease–substrate complexes except for five that were highly conserved across all structures.22 In the darunavir-bound structure, only the flap water molecule was retained. Hydrogen atoms were added to all structures using the hbuild module60 in the charmm computer program61 using the general charmm22 parameter set62 and a distance-dependent dielectric constant of 4. In addition, any missing side-chain atoms were built back into the structures using charmm and the default geometry in charmm22. All ionizable residues were left in their standard states at pH 7, with histidines singly protonated on the ε nitrogen.
For subsequent inverse inhibitor design calculations, the protease from the RT-RH substrate complex (PDB accession code 1KJG) and the darunavir-bound protease structure were used as design targets. In the case of the RT–RH-bound protease, the inactivating D25N mutations were reversed by building aspartate residues directly on top of the crystallographic asparagines. To create a singly protonated protease structure, the re-activated aspartate in the A chain was protonated on the Oδ2 atom such that it formed a hydrogen bonding interaction with Asp25B across the dimer interface. For both of these protease structures, parse radii and charges55 were assigned for solvation and electrostatic calculations, while charmm22 parameters62 were assigned for computing van der Waals interactions with potential ligands.
Preparation of scaffold and functional group libraries
An initial 3-D structure for the amprenavir/darunavir scaffold (Table 1, top) was created using GaussView 363 (using hydrogen atoms at the attachment points). For the first-round library, 3-D structures for 2,327 carboxylic acids and 379 primary amines were obtained from the ZINC database32 in December 2004 for subsequent attachment to the R1 and R2 sites, respectively. Compounds obtained from the ZINC database were limited to the vendors Sigma–Aldrich, Maybridge, and Ryan Scientific. 2-D structures for 274 sulfonyl chlorides were obtained for the R3 position directly from the Sigma–Aldrich and Maybridge catalogs in December 2004, as they were not present in the ZINC database at the time of retrieval. For the second-round library, carboxylic acids for the R1 position that contained a hydroxyl or carbonyl group alpha, beta, or gamma to the acid were obtained from the Sigma–Aldrich catalog through substructure searching. Additionally, all carboxylic acids present in the Sigma–Aldrich building-blocks library were options at R1, for a total of 1105 acids. R2 groups consisted of all primary aliphatic amines from the Sigma–Aldrich catalog that did not contain any additional nitrogen or oxygen atoms (161 total). The sulfonyl chloride library used at the R3 position was the same as that used in the first round. In addition, all selected functional groups for both rounds of design were required to have four rotatable bonds or fewer, ignoring the bond to the reactive group that will eventually be removed. Initial 3-D structures for the R groups needed to reconstruct amprenavir and darunavir were built by hand using GaussView 3.
Structures were converted from 2-D to 3-D (if necessary), and 3-D structures were sampled in ring conformations, trigonal nitrogen inversions, tautomeric states, and protonation states using the program LigPrep from Schrödinger, Inc. using the default settings. At this stage, carboxylate groups were removed from members of the R1 library, amines were removed from members of the R2 library, and the sulfonyl chloride moiety was removed from members of the R3 library to facilitate attachment to the scaffold. In all cases, the removed groups were replaced by a hydrogen atom designated for attachment. Geometries for all scaffolds and functional groups were optimized using quantum mechanical calculations at the RHF/6–31G* level of theory as implemented in the program Gaussian98.64 Partial atomic charges were calculated from the quantum mechanically derived electrostatic potential (RHF/6–31G*) using the RESP methodology.65,66 Molecular mechanics parameters for all scaffolds and functional groups were derived from the charmm22 parameter set using an automated atom type assignment procedure, and radii for continuum electrostatic calculations were taken from the parse parameter set.55 Conformational ensembles were calculated for the scaffold and all functional groups by exhaustively sampling dihedral angles about each rotatable bond (every 30° starting at 0° for sp3-sp3 or sp2-sp3 linkages, and every 45° starting at 0° for sp2-sp2 linkages), and removing self-intersecting or identical configurations.
Calculation of the substrate and maximal envelopes
To generate the substrate envelope, the five HIV-1 protease–substrate peptide complexes were simultaneously aligned on all Cα atoms using the program profit.67 Spheres of radius 1.5 Å were placed on a cubic lattice of dimension 0.5 Å that surrounded the superimposed substrate peptides. Spheres were accepted if their center was simultaneously within 1.0 Å of any non-hydrogen atom in at least 3 substrates and if they would have a favorable van der Waals interaction with the protease structure. Spheres were also accepted if they were within 3.5 Å of the side chain of Asn25 (inactivated catalytic residue) in either monomer to ensure that designed inhibitors would be permitted to interact with these non-mutable residues (even though the substrates themselves do not). A more tolerant definition of the substrate envelope, where sphere centers only needed to be within 1.0 Å of a non-hydrogen atom in one substrate peptide, was utilized for some calculations in the first-round of design as well. For the first round of design, the envelope was placed back into a protease structure derived from a complex with the largest and tightest binding substrate peptide,68 RT–RH (PDB accession code 1KJG). The orientation of the envelope inside the protease was the same as the one used for substrate superposition. For the second round of design, the substrate envelope was transferred to a darunavir-bound HIV-1 protease structure (PDB accession code 1T3R) by using profit to align all Cα atoms with the envelope-containing protease structure from the first round. The resulting location of the substrate envelope was used in the context of the darunavir-bound structure, and any substrate envelope spheres that clashed with the protein were removed. In addition to the substrate envelope, a maximal envelope that filled the central four pockets of the darunavir-bound HIV-1 protease active site was generated by assigning a van der Waals radius of 1.5 Å and well depth of –0.1 kcal/mol to each envelope sphere and minimizing their energy using charmm with the charmm22 van der Waals potential, keeping the protease structure fixed.
Computational inverse inhibitor design
In order to design HIV-1 protease inhibitors that do not exceed the substrate envelope, we applied a novel computational ligand design technique based on an inverse approach. The inverse design technique takes as input a protein structure and a ligand envelope placed in the binding site, defined by a collection of spheres. On a cubic lattice of dimension 0.125 Å placed within the envelope spheres, grid-based van der Waals energies69,70 were calculated for all charmm22 atom types using the charmm22 force field.62 Electrostatic interaction and desolvation potentials were calculated on a cubic lattice of dimension 0.5 Å, also placed within the ligand envelope. These potentials were calculated by sequentially charging each grid point to a value of 1e keeping all other grid points at zero charge and protein atoms at their parameterized values, and solving the linearized Poisson–Boltzmann equation both in a bound state, where the envelope is bound to the protease, and in an unbound state where the envelope spheres are taken as the ligand geometry, defining the low-dielectric region. Electrostatic interaction potentials with the protein were stored for each grid point, and electrostatic desolvation potentials, computed as the change in solvation potential upon binding for all grid points when one grid point is charged, were stored in a square matrix dimensioned whose size was the number of grid points squared. For any charge values at the grid points, the electrostatic binding free energy was calculated using a matrix equation.71 This formalism was taken directly from charge optimization theory,71–73 and the major approximation made here is that all potential ligands will be initially evaluated using the envelope shape rather than the true molecular geometry. All linearized Poisson–Boltzmann calculations were performed using a locally modified version of the DelPhi computer program74,75 at a 129×129×129 grid resolution with focusing boundary conditions.76 The molecular surface was used to represent the dielectric boundary, and a dielectric constant of 4 was used for the molecular interior while 80 was used in the solvent region. An ionic strength of 0.145 M with a Stern layer of 2.0 Å surrounded all molecules. A radius of 1.5 Å was used for the envelope spheres.
In the next phase of the inverse computational ligand design procedure, the scaffold conformational ensemble was discretely placed throughout the ligand envelope by enumerating translational and rotational space. Uniform steps of 0.25 Å were used for translational sampling and angular rotational steps around the x, y, and z axes were chosen such that the arc length swept out by the atom furthest from the geometric center was 1.0 Å. Scaffold placements were accepted if all atom centers were contained within the ligand envelope and if they made the appropriate hydrogen bonding interactions with the protease (hydroxyl–Asp25 and carbonyl–flap water interactions were required). For each attachment point on each scaffold placement, the appropriate discrete functional group ensemble was attached one member at a time, sampling discretely about the newly formed bond. By linearly interpolating van der Waals energies from and projecting partial atomic charges to the grid points, it was possible to calculate the independent contribution each discrete functional group made to the overall calculated binding free energy. If a functional group atom exceeded the ligand envelope, clashed with the scaffold (van der Waals σ cutoff), or buried a hydrogen bonding group without making a hydrogen bond, that conformation was excluded from further consideration. Next, all non-intersecting pairs of discrete functional groups were attached to the scaffold, and the indirect contribution to the solvation free energy was computed using the grid-based desolvation matrix. These self and pairwise energies are constructed such that they sum to the total calculated energy for the molecule. This formalism makes the functional group search problem analogous to the inverse protein design problem,77–82 and allows the efficient and guaranteed combinatorial search algorithms dead-end elimination (DEE)79–81 and A*83 to be utilized to identify global optimal functional group configurations, as well as an ordered list of near-optimal configurations. An in-house implementation of the DEE and A* algorithms was utilized that implements several algorithmic enhancements.84–87 For each scaffold placement, an energy-ordered list of structures for each of 1000 unique molecules was generated. These results were pooled across all scaffold placements to create a master list of compounds with high predicted affinity that remain inside the specified envelope.
One approximation made in the pairwise additive scoring function used for the combinatorial search is that binding electrostatics was evaluated using the envelope shape rather than the inhibitor molecular surface. To overcome this limitation, the highest scoring structures from the combinatorial search were hierarchically re-evaluated in energetic models of increasing accuracy, aimed at using the true shape of the inhibitor in electrostatic binding calculations. The most accurate energy function used was a combined molecular mechanics and Poisson–Boltzmann/Surface Area (PBSA) model,55 where the free energy of ligand binding was estimated by the sum of direct van der Waals interaction with the receptor calculated using the charmm22 force field,62 an electrostatic binding free energy calculated by solving the linearized Poisson–Boltzmann equation in both the bound and unbound states using the true molecular surface, and a surface area burial term. Continuum electrostatic calculations were performed as described above for grid potentials, but using a 257×257×257 grid size. A surface tension of 5 cal/Å2 was used for the surface area burial term.55 In the rigid binding model used here, there were no covalent contributions to binding. All compounds proposed for synthesis were among the highest scoring compounds in this most sophisticated energetic model after hierarchical re-evaluation.
Comparison of predicted to experimental binding energetics
In order to compare calculated with experimentally determined binding affinities, structures for the synthesized inhibitors were derived from inverse design calculations performed in the context of the maximal shape within the darunavir-bound protease structure. The maximal shape was selected for this comparison because the lowest energy configuration for the designed inhibitors might exceed the envelope. These calculations used a minimal functional group library that contained the necessary functional groups to cover the designed inhibitors as well as the clinical inhibitors amprenavir and darunavir. Calculated binding affinities for the compounds were taken directly from the most accurate energetic model used in the inverse design procedure, the combined molecular-mechanics and PBSA model as described above. In the case that an inhibitor was designed multiple times in the inverse design procedure, the best score was chosen to represent its energy.
To calculate experimental binding free energies from inhibition constants (Ki), we assumed that the inhibition constant was equal to the dissociation constant (Kd = Ki), and used the relationship .
Comparison of predicted to experimental structures
In order to compare predicted and experimentally determined structures, predicted complexes were superimposed on crystal structures by minimizing the RMSD between the coordinates of Cα atoms in the protease using the program profit.67 After superposition, the RMSD between non-hydrogen atoms in the inhibitors was measured and the structures analyzed.
Experimental Methods
Chemistry
General
Proton (1H NMR) and carbon nuclear magnetic resonance (13C NMR) spectra were recorded with a Varian Mercury 400 MHz NMR spectrometer operating at 400 MHz for 1H and 100 MHz for 13C NMR. Chemical shifts are reported in ppm (δ scale) relative to the solvent signal, and coupling constant (J) values are reported in Hertz. Data are represented as follows: chemical shift, multiplicity (s = singlet, d = doublet, t = triplet, q = quartet, m = multiplet, br = broad, dd = doublet of doublet), coupling constant in Hz, and integration. High-resolution mass spectra (HRMS) were recorded on a Waters Q-TOF Premier mass spectrometer by direct infusion of solutions of each compound using electrospray ionization (ESI) in positive mode. Low-resolution mass spectra were obtained using a Waters Alliance HT/Micromass ZQ system (ESI). All reactions were performed in oven-dried round bottomed or modified Schlenk flasks fitted with rubber septa under N2 atmosphere, unless otherwise noted. All final coupling reactions were carried out at 0.5 mmol scale unless stated otherwise. Air- and moisture-sensitive liquids and solutions were transferred via syringe or stainless steel cannula. Organic solutions were concentrated under reduced pressure by rotary evaporation at 35–40° C. Flash and column chromatography was performed using silica gel (230–400 mesh, Merck KGA). Analytical thin-layer chromatography (TLC) was performed using silica gel (60 F-254) coated aluminum plates (Merck KGA) and spots were visualized by exposure to ultraviolet light (UV) and/or exposure to an acidic solution of p-anisaldehyde (anisaldehyde) followed by brief heating. Dichloromethane was dried over P2O5 and distilled, tetrahydrofuran (THF) was distilled from sodium/benzophenone, and anhydrous N,N-dimethylformamide was purchased from Aldrich and used as received. All other reagents and solvents were purchased from commercial sources and used as received.
Synthesis of designed protease inhibitor libraries
Typical procedure for the synthesis of (R)-(Hydroxyethylamino)sulfonamides
N-[(1S,2R)-2-Hydroxy-3-[(2S)-2-methylbutyl]amino]-1-(phenylmethyl)propyl]-carbamic acid-1,1-dimethylethyl ester (17)
A solution of the chiral epoxide, (1S,2S)-(1-oxiranyl-2-phenylethyl)carbamic acid tert-butyl ester 1, (2.634 g, 10 mmol) in EtOH (50 mL) was added to the (S)-2-methylbutan-1-amine (0.872 g, 10 mmol) and the mixture was heated at 80° C for 3 hours. After cooling to room temperature, solvents were removed under reduced pressure. The residue was purified by recrystallization from EtOAc–hexanes (1:4) mixture to provide the product 17 (3.16 g, 90%) as white solid: 1H NMR (400 MHz, CDCl3) δ 7.31–7.27 (m, 2H), 7.24–7.18 (m, 3H), 4.70 (d, J = 9.6 Hz, 1H), 3.80 (m, 1H), 3.44 (dd, J = 6.0, 5.6 Hz, 1H), 2.98 (dd, J = 14.0, 4.8 Hz, 1H), 2.85 (dd, J = 13.6, 8.0 Hz, 1H), 2.67 (d, J = 3.6 Hz, 2H), 2.50 (dd, J = 12.0, 6.0 Hz, 1H), 2.38 (dd, J = 11.6, 6.8 Hz, 1H), 1.48 (m, 1H), 1.39 (m, 1H), 1.36 (s, 9H), 1.14 (m, 1H), 0.91–0.86 (m, 6H); 13C NMR (100 MHz, CDCl3) δ 156.11, 138.17, 129.78, 128.61 (3C), 126.53, 79.54, 70.82, 56.23, 54.38, 51.63, 36.94, 35.14, 28.25 (3C), 27.55, 17.77, 11.55. HRMS (ESI) m/z: Calcd for C20H35N2O3 [M + H]+ 351.2648; found 351.2610.
N-[(1S,2R)-2-Hydroxy-3-[[(4-methoxyphenyl)sulfonyl][(2S)-2-methylbutyl]amino]-1-(phenylmethyl)propyl]-carbamic acid-1,1-dimethylethyl ester (22)
To an ice-cooled solution of the secondary amine 17 (1.753 g, 5 mmol) in CH2Cl2 (20 mL) was added an aqueous solution of Na2CO3 (0.85 g, 8 mmol in 5 mL H2O) followed by the slow addition of 4-methoxyphenylsulfonyl chloride (1.04 g, 5 mmol) solution in CH2Cl2 (5 mL). After 15 minutes, the reaction mixture was warmed to ambient temperature and stirred until no starting material was detected by TLC. The reaction mixture was diluted with CH2Cl2 and layers were separated. The organic extract was washed with saturated aqueous NaCl solution, dried (Na2SO4), filtered and evaporated under reduced pressure. The residue was purified by flash chromatography on silica gel using EtOAc–hexanes (1:4) mixture as eluent to provide pure product 22 (2.50 g, 96%) as white foamy solid: 1H NMR (400 MHz, CDCl3) δ 7.72–7.68 (m, 2H), 7.31–7.19 (m, 6H), 6.99–6.95 (m, 2H), 4.61 (d, J = 6.8 Hz, 1H), 3.90 (m, 1H), 3.87 (s, 3H), 3.77 (br s, 2H), 3.10–2.92 (m, 5H), 2.77 (dd, J = 12.8, 7.2 Hz, 1H), 1.51–1.45 (m, 1H), 1.34 (s, 9H), 1.09–1.02 (m, 1H), 0.84 (t, J = 7.6 Hz, 3H, overlapping signal), 0.83 (t, J = 6.4 Hz, 3H, overlapping signal); 13C NMR (100 MHz, CDCl3) δ 163.21, 156.22, 137.99, 130.08, 129.83 (2C), 129.73 (2C), 128.71 (2C), 126.66, 114.52 (2C), 79.91, 72.87, 57.49, 55.85, 54.75, 53.89, 35.66, 33.59, 28.49 (3C), 26.67, 17.13, 11.28. HRMS (ESI) m/z: Calcd for C27H41N2O6S [M + H]+ 521.2685; found 521.2699.
Typical procedure for the coupling reactions (Method A)
3-Hydroxy-N-[(1S,2R)-2-hydroxy-3-[[(3-methoxyphenyl)sulfonyl](2-thienylmethyl)amino]-1-(phenylmethyl)propyl]-2,4,5-trifluoro-benzamide (11a)
To a solution of the N-[(1S,2R)-2-hydroxy-3-[[(3-methoxyphenyl)sulfonyl](2-thienylmethyl)amino]-1-(phenylmethyl)propyl]-carbamic acid tert-butyl ester33 (0.274 g, 0.5 mmol) in CH2Cl2 (15 mL) was added trifluoroacetic acid (TFA) (5 mL) and the mixture was stirred at room temperature for 1 hour. Solvents were removed under reduced pressure, and the residue was dissolved in toluene (4 mL) and again evaporated under reduced pressure to provide the free amine as pale yellow gummy solid. To an ice-cooled solution of 2,4,5-trifluoro-3-hydroxybenzoic acid (0.115 g, 0.6 mmol) in a mixture of DMF–CH2Cl2 (1:1) (5 mL) were added EDCI (0.115 g, 0.6 mmol) and HOBt (0.092 g, 0.6 mmol) under dry N2 atmosphere. After stirring 15 minutes, a solution of the above deprotected amine in DMF-CH2Cl2 mixture (1:1) (5 mL) was slowly added followed by the addition of DIPEA (0.17 mL, 1 mmol). The reaction mixture was warmed to room temperature and stirred until reaction was complete (monitored by TLC). Small amounts of H2O and CH2Cl2 were added and layers were separated. The organic extract was washed with saturated aqueous NaCl solution, dried (Na2SO4), filtered and evaporated under reduced pressure. The residue was purified by flash chromatography on silica gel using EtOAc–hexanes (3:2) mixture as eluent to provide the target compound (0.252 g, 81%) as creamy solid: 1H NMR (400 MHz, CDCl3) δ 7.40 (t, J = 8.0 Hz, 1H), 7.33 (m, 1H), 7.28–7.24 (m, 4H), 7.22–7.18 (m, 4H), 7.15 (dd, J = 5.2, 1.2 Hz, 1H), 7.11 (m, 1H), 6.83 (dd, J = 3.6, 1.2 Hz, 1H), 6.78 (dd, J = 5.2, 3.6 Hz, 1H), 6.62 (dd, J = 8.8, 1.2 Hz, 1H), 4.59 (s, 2H), 4.31 (m, 1H), 3.85–3.77 (m, 2H, overlapping signal), 3.83 (s, 3H), 3.28 (dd, J = 14.8, 4.0 Hz, 1H), 3.21 (dd, J = 14.8, 7.6 Hz, 1H), 2.99 (d, J = 6.8 Hz, 2H); 13C NMR (100 MHz, CDCl3) δ 162.30, 160.25, 139.84, 138.19, 137.27, 130.64, 129.57 (2C), 128.85 (2C), 128.41, 127.05, 126.98, 126.95, 119.64, 119.47, 112.52, 108.59, 108.38, 72.08, 55.94, 54.76, 51.42, 48.26, 35.36. HRMS (ESI) m/z: Calcd for C29H28F3N2O6S2 [M + H]+ 621.1341; found 621.1324.
Typical procedure for the coupling reactions (Method B)
(2S)-2-(Acetylamino)-N-[(1S,2R)-2-hydroxy-3-[[(4-methoxyphenyl)sulfonyl](2-methylpropyl)amino]-1-(phenylmethyl)propyl]-3-methyl-butanamide (27c)
To a solution of the N -[(1S,2R)-2-Hydroxy-3-[[(4-methoxyphenyl)sulfonyl](2-methylpropyl)amino]-1-(phenylmethyl)propyl]-carbamic acid tert-butyl ester33 (0.254 g, 0.5 mmol) in CH2Cl2 (15 mL) was added TFA (5 mL) and the mixture was stirred at room temperature for 1 hour. Solvents were removed under reduced pressure and the residue was dissolved in CH2Cl2, washed with 10% aq. NaHCO3 solution, dried (Na2SO4), filtered, and evaporated under reduced pressure to provide the free amine as white solid. To an ice-cooled solution of this amine in a mixture of H2O–CH2Cl2 (1:1) (12 mL) were added N-Ac-Val-OH (0.096 g, 0.6 mmol) followed by HOBt (0.092 g, 0.6 mmol) and EDCI (0.115 g, 0.6 mmol) under N2 atmosphere. The reaction mixture was stirred at 0–4 °C until the reaction was complete (monitored by TLC). A small amount of CH2Cl2 was added and layers were separated. The organic extract was washed with saturated aqueous NaCl solution, dried (Na2SO4), filtered and evaporated under reduced pressure. The residue was purified by flash chromatography on silica gel using EtOAc to provide the target compound (0.233 g, 85%) as white solid: 1H NMR (400 MHz, CDCl3) δ 7.72 (m, 2H), 7.29–7.17 (m, 5H), 6.98 (m, 2H), 6.32 (d, J = 8.4 Hz, 1H), 5.65 (d, J = 8.0 Hz, 1H), 4.22 (m, 1H), 4.10 (dd, J = 8.0, 6.0 Hz, 1H), 4.0 (d, J = 3.2 Hz, 1H), 3.87 (s, 3H), 3.83 (m, 1H), 3.11–3.0 (m, 3H), 2.95–2.87 (m, 2H), 2.80 (dd, J = 13.2, 6.8 Hz, 1H), 2.01 (m, 1H), 1.94 (s, 3H), 1.83 (m, 1H), 0.88 (t, J = 6.8 Hz, 6H), 0.83 (d, J = 6.8 Hz, 3H), 0.73 (d, J = 6.8 Hz, 3H); 13C NMR (100 MHz, CDCl3) δ 171.81, 170.45, 163.25, 137.94, 130.19, 129.70 (2C), 129.59 (2C), 128.69 (2C), 126.74, 114.58 (2C), 72.80, 59.09, 58.93, 55.85, 54.22, 53.62, 35.75, 30.48, 27.45, 23.47, 20.32, 20.14, 19.47, 17.95. HRMS (ESI) m/z: Calcd for C28H42N3O6S [M + H]+ 548.2794; found 548.2766. Synthesis and characterization data for additional designed compounds is provided in the Supporting Information.
HIV-1 protease inhibition assays
The HIV-1 protease inhibitory activities of all newly designed inhibitors were determined by a fluorescence resonance energy transfer (FRET) method.33,34 Protease substrate, (Arg-Glu(EDANS)-Ser-Gln-Asn-Tyr-Pro-Ile-Val-Gln-Lys(DABCYL)-Arg) was purchased from Molecular Probes. The energy transfer donor (EDANS) and acceptor (DABCYL) dyes are labeled at two ends of the peptide, respectively, to perform FRET. Fluorescence measurements were carried out on a fluorescence spectrophotometer (Photon Technology International) at 30° C. Excitation and emission wavelengths were set at 340 nm and 490 nm, respectively. Each reaction was recorded for about 10 min. The expression, isolation, and purification of wild-type and mutant HIV-1 proteases used for crystallization and binding experiments were carried out as previously described.88 Wild-type HIV-1 protease (Q7K) and its MDR variants M1 (L10I, G48V, I54V, L63P, V82A), M2 (D30N, L63P, N88D), M3 (L10I, L63P, A71V, G73S, I84V, L90M), and M4 (I50V, A71V) were desalted through PD-10 columns (Amersham Biosciences). Sodium acetate (20 mM, pH 5) was used as elution buffer. Apparent protease concentrations were around 50 nM estimated by UV spectrophotometry at 280 nm. All inhibitors were dissolved in dimethylsulfoxide (DMSO) and diluted to appropriate concentrations. Protease (2 µL) and inhibitor (2 µL) or DMSO were mixed and incubated for 20–30 min at room temperature before initializing the substrate cleavage reaction. For all experiments, 150 µL of 1 µM substrate were used in substrate buffer [0.1 M sodium acetate, 1 M sodium chloride, 1 mM ethylenediaminetetraacetic acid (EDTA), 1 mM dithiothreitol (DTT), 2% DMSO, and 1 mg/mL bovine serum albumin (BSA) with an adjusted pH 4.7]. Inhibitor binding dissociation constant (Ki) values were obtained by nonlinear regression fitting (GraFit 5, Erithacus software) to the plot of initial velocity as a function of inhibitor concentrations based on the Morrison equation.89 The initial velocities were derived from the linear range of reaction curves.
Crystallography of inhibitor–protease complexes
A solution of wild-type protease (concentration 1.2–1.8 mg/ml) was equilibrated with 3-fold molar excess of inhibitor for at least one hour prior to crystallization. Crystals were grown by the hanging drop vapor diffusion method. The reservoir solution consisted of 126 mM phosphate buffer at pH 6.2, 63 mM sodium citrate, and ammonium sulfate in a range of 24 to 29%. Rod shaped crystals were obtained in 2–3 days.
The crystals were mounted within Hampton cryoloops and flash frozen over a nitrogen stream. Intensity data were collected at –80 °C on an in-house Rigaku X-ray generator equipped with an R-axis IV image plate. About 180 frames were collected per crystal with an angular separation of 1° and no overlap between frames. The data processing of the frames was carried out using the programs DENZO and ScalePack,90,91 respectively. Data collection statistics are listed in Table 4.
The crystal structures were solved and refined with the programs within the CCP4 interface.92 Structure solution was obtained with the molecular replacement package AMoRe,93 with 1F7A22 as the starting model. Upon obtaining the rotation and translation solutions, the molecular replacement phases were further improved using ARP/wARP94 to build solvent molecules into the unaccounted regions of electron density. Model building was performed using the interactive graphics programs O95 and COOT.96 Conjugate gradient refinement using REFMAC597 was performed by incorporating the Schomaker and True-blood tensor formulation of TLS (translation, libration, screw-rotation) parameters.98–100 The working R (Rfactor) and its cross validation (Rfree) were monitored throughout the refinement. The refinement statistics are also shown in Table 4.
Supplementary Material
Table 2.
Experimental Ki values for the binding of a second-round substrate envelope inhibitor library to the wild-type HIV-1 protease. The dashed line on each functional group indicates the bond that is broken to generate a fragment suitable for attachment to the (R)-(hydroxyethylamino)sulfonamide scaffold (top).
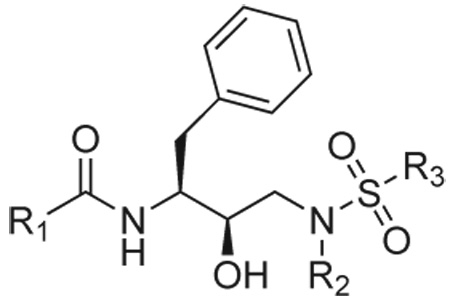 | |||||||
|---|---|---|---|---|---|---|---|
| Ki (nM) | R1 |  |
 |
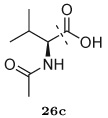 |
 |
 |
 |
| R3 | R2 | ||||||
 |
 |
27a (MIT-2-KB-83) 0.14 |
27b (MIT-2-KB-84) 0.24 |
27c (MIT-2-KB-86) 0.084 |
27d (MIT-2-KB-92) 1.9 |
27e (MIT-2-KC-09) 0.17 |
27f (MIT-2-KC-17) 0.37 |
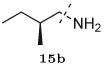 |
29a (MIT-2-AD-89) 0.12 |
29b‡ (MIT-2-AD-86) 0.062 |
29c (MIT-2-AE-06) 0.033 |
29d (MIT-2-AD-87) 0.62 |
29e (MIT-2-KC-14) 0.21 |
29f (MIT-2-KC-23) 0.34 |
|
|
31a (MIT-2-KB-88) 1.5 |
31b (MIT-2-KB-89) 4.2 |
31c (MIT-2-KB-90) 0.038 |
31d (MIT-2-KB-91) 2.5 |
31e (MIT-2-KC-11) 0.79 |
31f (MIT-2-KC-18) 0.86 |
||
 |
 |
28a‡ (MIT-2-KB-98 0.027 |
28b (MIT-2-KB-99) 0.12 |
28c (MIT-2-KB-100) 0.099 |
28d (MIT-2-KC-01) 0.29 |
28e (MIT-2-KC-13) 0.12 |
28f (MIT-2-KC-21) 0.13 |
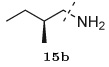 |
30a‡ (MIT-2-AD-93) 0.036 |
30b (MIT-2-AD-92) 0.063 |
30c (MIT-2-AE-07) 0.057 |
30d‡ (MIT-2-AD-94) 0.063 |
30e (MIT-2-KC-19) 0.13 |
30f (MIT-2-KC-22) 0.067 |
|
 |
32a (MIT-2-KC-05) 0.31 |
32b (MIT-2-KC-06) 1.6 |
32c‡ (MIT-2-KC-08) 0.014 |
32d (MIT-2-KC-07) 0.82 |
32e (MIT-2-KC-12) 0.21 |
32f (MIT-2-KC-24) 0.70 |
|
Compounds denoted with a ‡ indicate that a crystal structure has been solved of the complex.
Acknowledgements
We gratefully acknowledge Ellen A. Nalivaika for providing wild-type HIV-1 protease and variants thereof, the AIDS Research and Reference Reagent Program (NIAD, NIH) for reference protease inhibitors, and Kaneka USA for generous gifts of chiral epoxides. This project has benefited greatly from discussions at the NIH’s annual Structural Biology of AIDS meeting. This work was partially supported by the National Institutes of General Medical Sciences of the NIH (GM066524 [PI: CAS; co-PIs BT, TMR, MKG, Ronald Swanstrom, and Robert Shafer] and GM065418 to BT).
Footnotes
References
- 1.Pastan I, Gottesman M, Kahn CR, Flier J, Eder P. New Eng. J. Med. 1987;316:1388–1393. doi: 10.1056/NEJM198705283162207. [DOI] [PubMed] [Google Scholar]
- 2.Larder BA, Kemp SD. Science. 1989;246:1155–1158. doi: 10.1126/science.2479983. [DOI] [PubMed] [Google Scholar]
- 3.Cohen ML. Science. 1992;257:1050–1055. doi: 10.1126/science.257.5073.1050. [DOI] [PubMed] [Google Scholar]
- 4.Telenti A, Imboden P, Marchesi F, Lowrie D, Cole S, Colston MJ, Matter L, Schopfer K, Bodmer T. Lancet. 1993;341:647–650. doi: 10.1016/0140-6736(93)90417-f. [DOI] [PubMed] [Google Scholar]
- 5.Tisdale M, Kemp SD, Parry NR, Larder BA. Proc. Natl. Acad. Sci. U.S.A. 1993;90:5653–5656. doi: 10.1073/pnas.90.12.5653. [DOI] [PMC free article] [PubMed] [Google Scholar]
- 6.Condra JH, et al. Nature. 1995;374:569–571. doi: 10.1038/374569a0. [DOI] [PubMed] [Google Scholar]
- 7.Gold HS, Moellering RC. New Eng. J. Med. 1996;335:1445–1453. doi: 10.1056/NEJM199611073351907. [DOI] [PubMed] [Google Scholar]
- 8.Whitney CG, Farley MM, Hadler J, Harrison LH, Lexau C, Reingold A, Lefkowitz L, Cieslak PR, Cetron M, Zell ER, Jorgensen JH, Schuchat A. New Eng. J. Med. 2000;343:1917–1924. doi: 10.1056/NEJM200012283432603. [DOI] [PubMed] [Google Scholar]
- 9.Gottesman MM, Pastan I. Ann. Rev. Biochem. 1993;62:385–427. doi: 10.1146/annurev.bi.62.070193.002125. [DOI] [PubMed] [Google Scholar]
- 10.Nikaido H. Science. 1994;264:382–388. doi: 10.1126/science.8153625. [DOI] [PubMed] [Google Scholar]
- 11.Tantillo C, Ding JP, Jacobomolina A, Nanni RG, Boyer PL, Hughes SH, Pauwels R, Andries K, Janssen PAJ, Arnold E. J. Mol. Biol. 1994;243:369–387. doi: 10.1006/jmbi.1994.1665. [DOI] [PubMed] [Google Scholar]
- 12.Hochhaus A, Kreil S, Corbin AS, Rosee PL, Muller MC, Lahaye T, Hanfstein B, Schoch C, Cross N, Berger U, Gschaidmeier H, Druker BJ, Hehlmann R. Leukemia. 2002;16:2190–2196. doi: 10.1038/sj.leu.2402741. [DOI] [PubMed] [Google Scholar]
- 13.Gubareva LV, Bethell R, Hart GJ, Murti KG, Penn CR, Webster RG. J. Virol. 1996;70:1818–1827. doi: 10.1128/jvi.70.3.1818-1827.1996. [DOI] [PMC free article] [PubMed] [Google Scholar]
- 14.Allen MI, Deslauriers M, Andrews CW, Tipples GA, Walters KA, Tyrrell DLJ, Brown N, Condreay LD. Hepatology. 1998;27:1670–1677. doi: 10.1002/hep.510270628. [DOI] [PubMed] [Google Scholar]
- 15.Kim EE, Baker CT, Dwyer MD, Murcko MA, Rao BG, Tung RD, Navia MA. J. Am. Chem. Soc. 1995;117:1181–1182. [Google Scholar]
- 16.Turner SR, et al. J. Med. Chem. 1998;41:3467–3476. doi: 10.1021/jm9802158. [DOI] [PubMed] [Google Scholar]
- 17.Shah NP, Tran C, Lee FY, Chen P, Norris D, Sawyers CL. Science. 2004;305:399–401. doi: 10.1126/science.1099480. [DOI] [PubMed] [Google Scholar]
- 18.Surleraux DLNG, Tahri A, Verschueren WG, Pille GME, de Kock HA, Jonckers THM, Peeters A, Meyer SD, Azijn H, Pauwels R, de Bethune MP, King NM, Prabu-Jeyabalan M, Schiffer CA, Wigerinck PBTP. J. Med. Chem. 2005;48:1813–1822. doi: 10.1021/jm049560p. [DOI] [PubMed] [Google Scholar]
- 19.Larder BA, Hertogs K, Bloor S, van den Eynde C, DeCian W, Wang YY, Freimuth WW, Tarpley G. AIDS. 2000;14:1943–1948. doi: 10.1097/00002030-200009080-00009. [DOI] [PubMed] [Google Scholar]
- 20.Partaledis JA, Yamaguchi K, Tisdale M, Blair EE, Falcione C, Maschera B, Myers RE, Pazhanisamy S, Futer O, Cullinan AB, Stuver CM, Byrn RA, Livingston DJ. J. Virol. 1995;69:5228–5235. doi: 10.1128/jvi.69.9.5228-5235.1995. [DOI] [PMC free article] [PubMed] [Google Scholar]
- 21.Maguire M, Shortino D, Klein A, Harris W, Manohitharajah V, Tisdale M, Elston R, Yeo J, Randall S, Xu F, Parker H, May J, Snowden W. Antimicrob. Agents Chemother. 2002;46:731–738. doi: 10.1128/AAC.46.3.731-738.2002. [DOI] [PMC free article] [PubMed] [Google Scholar]
- 22.Prabu-Jeyabalan M, Nalivaika E, Schiffer CA. Structure. 2002;10:369–381. doi: 10.1016/s0969-2126(02)00720-7. [DOI] [PubMed] [Google Scholar]
- 23.King NM, Prabu-Jeyabalan M, Nalivaika EA, Wigerinck P, de Bethune MP, Schiffer CA. J. Virol. 2004;78:12012–12021. doi: 10.1128/JVI.78.21.12012-12021.2004. [DOI] [PMC free article] [PubMed] [Google Scholar]
- 24.King NM, Prabu-Jeyabalan M, Nalivaika EA, Schiffer CA. Chem. Biol. 2004;11:1333–1338. doi: 10.1016/j.chembiol.2004.08.010. [DOI] [PubMed] [Google Scholar]
- 25.Tuske S, et al. Nat. Struct. Mol. Biol. 2004;11:469–474. doi: 10.1038/nsmb760. [DOI] [PubMed] [Google Scholar]
- 26.Kirkpatrick P. Nat. Rev. Drug Discov. 2004;3:100. doi: 10.1038/nrd1387. [DOI] [PubMed] [Google Scholar]
- 27.Coffin JM. Science. 1995;267:483–489. doi: 10.1126/science.7824947. [DOI] [PubMed] [Google Scholar]
- 28.Prabu-Jeyabalan M, Nalivaika E, Schiffer CA. J. Mol. Biol. 2000;301:1207–1220. doi: 10.1006/jmbi.2000.4018. [DOI] [PubMed] [Google Scholar]
- 29.Chellappan S, Kairys V, Fernandes MX, Schiffer CA, Gilson MK. Proteins. 2007;68:561–567. doi: 10.1002/prot.21431. [DOI] [PubMed] [Google Scholar]
- 30.Chellappan S, Reddy GSKK, Ali A, Nalam MNL, Anjum SG, Cao H, Kairys V, Fernandes MX, Altman MD, Tidor B, Rana TM, Schiffer CA, Gilson MK. Chem. Biol. Drug Des. 2007;69:298–313. doi: 10.1111/j.1747-0285.2007.00514.x. [DOI] [PubMed] [Google Scholar]
- 31.Ohtaka H, Velazquez-Campoy A, Xie D, Freire E. Protein Sci. 2002;11:1908–1916. doi: 10.1110/ps.0206402. [DOI] [PMC free article] [PubMed] [Google Scholar]
- 32.Irwin JJ, Shoichet BK. J. Chem. Inf. Mod. 2005;45:177–182. doi: 10.1021/ci049714. [DOI] [PMC free article] [PubMed] [Google Scholar]
- 33.Ali A, Reddy GSKK, Cao H, Anjum SG, Nalam MNL, Schiffer CA, Rana TM. J. Med. Chem. 2006;49:7342–7356. doi: 10.1021/jm060666p. [DOI] [PubMed] [Google Scholar]
- 34.Matayoshi ED, Wang GT, Krafft GA, Erickson J. Science. 1990;247:954–958. doi: 10.1126/science.2106161. [DOI] [PubMed] [Google Scholar]
- 35.Young SD, et al. J. Med. Chem. 1992;35:1702–1709. doi: 10.1021/jm00088a004. [DOI] [PubMed] [Google Scholar]
- 36.Murray CW, Baxter CA, Frenkel AD. J. Comput. Aid. Mol. Des. 1999;13:547–562. doi: 10.1023/a:1008015827877. [DOI] [PubMed] [Google Scholar]
- 37.Ho G-J, Emerson KM, Mathre DJ, Shuman RF, Grabowski EJJ. J. Org. Chem. 1995;60:3569–3570. [Google Scholar]
- 38.Cheng T-J, Brik A, Wong C-H, Kan C-C. Antimicrob. Agents Chemother. 2004;48:2437–2447. doi: 10.1128/AAC.48.7.2437-2447.2004. [DOI] [PMC free article] [PubMed] [Google Scholar]
- 39.Wu TD, Schiffer CA, Gonzales MJ, Taylor J, Kantor R, Chou SW, Israelski D, Zolopa AR, Fessel WJ, Shafer RW. J. Virol. 2003;77:4836–4847. doi: 10.1128/JVI.77.8.4836-4847.2003. [DOI] [PMC free article] [PubMed] [Google Scholar]
- 40.Hoffman NG, Schiffer CA, Swanstrom R. Virology. 2003;314:536–548. doi: 10.1016/s0042-6822(03)00484-7. [DOI] [PubMed] [Google Scholar]
- 41.Kempf DJ, et al. Proc. Natl. Acad. Sci. U. S. A. 1995;92:2484–2488. doi: 10.1073/pnas.92.7.2484. [DOI] [PMC free article] [PubMed] [Google Scholar]
- 42.Craig JC, Duncan IB, Hockley D, Grief C, Roberts NA, Mills JS. Antiviral Res. 1991;16:295–305. doi: 10.1016/0166-3542(91)90045-s. [DOI] [PubMed] [Google Scholar]
- 43.Vacca JP, et al. Proc. Natl. Acad. Sci. U. S. A. 1994;91:4096–4100. doi: 10.1073/pnas.91.9.4096. [DOI] [PMC free article] [PubMed] [Google Scholar]
- 44.Kaldor SW, et al. J. Med. Chem. 1997;40:3979–3985. doi: 10.1021/jm9704098. [DOI] [PubMed] [Google Scholar]
- 45.Sham HL, et al. Antimicrob. Agents Chemother. 1998;42:3218–3224. doi: 10.1128/aac.42.12.3218. [DOI] [PMC free article] [PubMed] [Google Scholar]
- 46.Robinson BS, Riccardi KA, Gong Y-F, Guo Q, Stock DA, Blair WS, Terry BJ, Deminie CA, Djang F, Colonno RJ, Lin P-F. Antimicrob. Agents Chemother. 2000;44:2093–2099. doi: 10.1128/aac.44.8.2093-2099.2000. [DOI] [PMC free article] [PubMed] [Google Scholar]
- 47.Doyon L, Tremblay S, Bourgon L, Wardrop E, Cordingley MG. Antiviral Res. 2005;68:27–35. doi: 10.1016/j.antiviral.2005.07.003. [DOI] [PubMed] [Google Scholar]
- 48.Baxter JD, Schapiro JM, Boucher CAB, Kohlbrenner VM, Hall DB, Scherer JR, Mayers DL. J. Virol. 2006;80:10794–10801. doi: 10.1128/JVI.00712-06. [DOI] [PMC free article] [PubMed] [Google Scholar]
- 49.Mahalingam B, Louis JM, Hung J, Harrison RW, Weber IT. Proteins. 2001;43:455–464. doi: 10.1002/prot.1057. [DOI] [PubMed] [Google Scholar]
- 50.Vega S, Kang L-W, Velazquez-Campoy A, Kiso Y, Amzel LM, Freire E. Proteins. 2004;55:594–602. doi: 10.1002/prot.20069. [DOI] [PubMed] [Google Scholar]
- 51.Rose RB, Craik CS, Stroud RM. Biochemistry. 1998;37:2607–2621. doi: 10.1021/bi9716074. [DOI] [PubMed] [Google Scholar]
- 52.Scott WRP, Schiffer CA. Structure. 2000;8:1259–1265. doi: 10.1016/s0969-2126(00)00537-2. [DOI] [PubMed] [Google Scholar]
- 53.Piana S, Carloni P, Rothlisberger U. Protein Sci. 2002;11:2393–2402. doi: 10.1110/ps.0206702. [DOI] [PMC free article] [PubMed] [Google Scholar]
- 54.Perryman AL, Lin JH, McCammon JA. Protein Sci. 2004;13:1108–1123. doi: 10.1110/ps.03468904. [DOI] [PMC free article] [PubMed] [Google Scholar]
- 55.Sitkoff D, Sharp KA, Honig B. J. Phys. Chem. 1994;98:1978–1988. [Google Scholar]
- 56.Kuhn B, Gerber P, Schulz-Gasch T, Stahl M. J. Med. Chem. 2005;48:4040–4048. doi: 10.1021/jm049081q. [DOI] [PubMed] [Google Scholar]
- 57.Chen W, Chang C-E, Gilson MK. J. Am. Chem. Soc. 2006;128:4675–4684. doi: 10.1021/ja056600l. [DOI] [PubMed] [Google Scholar]
- 58.Chang C-E, Chen W, Gilson MK. Proc. Nat. Acad. Sci. USA. 2007;104:1534–1539. doi: 10.1073/pnas.0610494104. [DOI] [PMC free article] [PubMed] [Google Scholar]
- 59.Berman H, Westbrook J, Feng Z, Gilliland G, Bhat T, Weissig H, Shindyalov I, Bourne P. Nucleic Acids Research. 2000;28:235–242. doi: 10.1093/nar/28.1.235. [DOI] [PMC free article] [PubMed] [Google Scholar]
- 60.Brünger AT, Karplus M. Proteins. 1988;4:148–156. doi: 10.1002/prot.340040208. [DOI] [PubMed] [Google Scholar]
- 61.Brooks BR, Bruccoleri RE, Olafson BD, States DJ, Swaminathan S, Karplus M. J. Comput. Chem. 1983;4:187–217. [Google Scholar]
- 62.Momany FA, Rone R. J. Comput. Chem. 1992;13:888–900. [Google Scholar]
- 63.RD, Keith T, Millam J, Eppinnett K, Hovell WL, Gilliland R. GaussView, Version 3.09. Shawnee Mission, KS: Semichem, Inc; 2003. [Google Scholar]
- 64.Frisch MJ, et al. Gaussian 98. Pittsburgh, PA: Gaussian, Inc; 1998. [Google Scholar]
- 65.Bayly CI, Cieplak P, Cornell WD, Kollman PA. J. Phys. Chem. 1993;97:10269–10280. [Google Scholar]
- 66.Green DF, Tidor B. J. Phys. Chem. B. 2003;107:10261–10273. [Google Scholar]
- 67.Martin ACR. http://www.bioinf.org.uk/software/profit/.
- 68.Altman MD, Nalivaika EA, Prabu-Jeyabalan M, Schiffer CA, Tidor B. Proteins. 2008;70:678–694. doi: 10.1002/prot.21514. [DOI] [PMC free article] [PubMed] [Google Scholar]
- 69.Meng EC, Shoichet BK, Kuntz ID. J. Comput. Chem. 1992;13:505–524. [Google Scholar]
- 70.Luty BA, Wasserman ZR, Stouten PFW, Hodge CN, Zacharias M, McCammon JA. J. Comput. Chem. 1995;16:454–464. [Google Scholar]
- 71.Kangas E, Tidor B. J. Chem. Phys. 1998;109:7522–7545. [Google Scholar]
- 72.Lee LP, Tidor B. J. Chem. Phys. 1997;106:8681–8690. [Google Scholar]
- 73.Kangas E, Tidor B. Phys. Rev. E. 1999;59:5958–5961. doi: 10.1103/physreve.59.5958. [DOI] [PubMed] [Google Scholar]
- 74.Gilson MK, Honig B. Proteins. 1988;4:7–18. doi: 10.1002/prot.340040104. [DOI] [PubMed] [Google Scholar]
- 75.Nicholls A, Honig B. J. Comput. Chem. 1991;12:435–445. [Google Scholar]
- 76.Gilson MK, Sharp KA, Honig BH. J. Comput. Chem. 1987;9:327–335. [Google Scholar]
- 77.Drexler KE. Proc. Natl. Acad. Sci. U.S.A. 1981;78:5275–5278. doi: 10.1073/pnas.78.9.5275. [DOI] [PMC free article] [PubMed] [Google Scholar]
- 78.Pabo C. Nature. 1983;301:200–200. doi: 10.1038/301200a0. [DOI] [PubMed] [Google Scholar]
- 79.Desmet J, Demaeyer M, Hazes B, Lasters I. Nature. 1992;356:539–542. doi: 10.1038/356539a0. [DOI] [PubMed] [Google Scholar]
- 80.Dahiyat BI, Mayo SL. Protein Sci. 1996;5:895–903. doi: 10.1002/pro.5560050511. [DOI] [PMC free article] [PubMed] [Google Scholar]
- 81.Dahiyat BI, Mayo SL. Science. 1997;278:82–87. doi: 10.1126/science.278.5335.82. [DOI] [PubMed] [Google Scholar]
- 82.Street AG, Mayo SL. Struct. Fold. Des. 1999;7:R105–R109. doi: 10.1016/s0969-2126(99)80062-8. [DOI] [PubMed] [Google Scholar]
- 83.Leach AR, Lemon AP. Proteins. 1998;33:227–239. doi: 10.1002/(sici)1097-0134(19981101)33:2<227::aid-prot7>3.0.co;2-f. [DOI] [PubMed] [Google Scholar]
- 84.Gordon DB, Mayo SL. Structure. 1999;7:1089–1098. doi: 10.1016/s0969-2126(99)80176-2. [DOI] [PubMed] [Google Scholar]
- 85.Pierce NA, Spriet JA, Desmet J, Mayo SL. J. Comput. Chem. 2000;21:999–1009. [Google Scholar]
- 86.Gordon DB, Hom GK, Mayo SL, Pierce NA. J. Comput. Chem. 2003;24:232–243. doi: 10.1002/jcc.10121. [DOI] [PubMed] [Google Scholar]
- 87.Looger LL, Dwyer MA, Smith JJ, Hellinga HW. Nature. 2003;423:185–190. doi: 10.1038/nature01556. [DOI] [PubMed] [Google Scholar]
- 88.King NM, Melnick L, Prabu-Jeyabalan M, Nalivaika EA, Yang SS, Gao Y, Nie XY, Zepp C, Heefner DL, Schiffer CA. Protein Sci. 2002;11:418–429. doi: 10.1110/ps.25502. [DOI] [PMC free article] [PubMed] [Google Scholar]
- 89.Greco WR, Hakala MT. J. Biol. Chem. 1979;254:12104–12109. [PubMed] [Google Scholar]
- 90.Minor W. XDISPLAYF program. West Layfayette, Indiana: Purdue University; 1993. [Google Scholar]
- 91.Otwinowski Z, Minor W. Meth. Enzymol. 1997;276:307–326. doi: 10.1016/S0076-6879(97)76066-X. [DOI] [PubMed] [Google Scholar]
- 92.Bailey S. Acta Crystallogr. D. 1994;50:760–763. [Google Scholar]
- 93.Navaza J. Acta Crystallogr. A. 1994;50:157–163. [Google Scholar]
- 94.Morris RJ, Perrakis A, Lamzin VS. Acta Crystallogr. D. 2002;58:968–975. doi: 10.1107/s0907444902005462. [DOI] [PubMed] [Google Scholar]
- 95.Jones TA, Bergdoll M, Kjeldgaard MO. A macromolecular modeling environment. In: Bugg C, Ealick S, editors. Crystallographic and Modeling Methods in Molecular Design. Berlin: Springer–Verlag; 1990. pp. 189–195. [Google Scholar]
- 96.Emsley P, Cowtan K. Acta Crystallogr. D. 2004;60:2126–2132. doi: 10.1107/S0907444904019158. [DOI] [PubMed] [Google Scholar]
- 97.Murshudov GN, Vagin AA, Dodson EJ. Acta Crystallogr D. 1997;53:240–255. doi: 10.1107/S0907444996012255. [DOI] [PubMed] [Google Scholar]
- 98.Schomaker V, Trueblood KN. Acta Crystallogr. B. 1968;24:63–76. [Google Scholar]
- 99.Kuriyan J, Weis WI. Proc. Natl. Acad. Sci. U.S.A. 1991;88:2773–2777. doi: 10.1073/pnas.88.7.2773. [DOI] [PMC free article] [PubMed] [Google Scholar]
- 100.Tickle IJ, Moss DS. IUCr99 Computing School. London: IUCr; 1999. Modelling rigid-body thermal motions in macromolecular crystal structure refinement. [Google Scholar]
Associated Data
This section collects any data citations, data availability statements, or supplementary materials included in this article.