Abstract
Fluorescence spectroscopy is an important tool for the characterization of protein folding. Often, a protein is labeled with appropriate fluorescent donor and acceptor probes and folding-induced changes in Förster Resonance Energy Transfer (FRET) are monitored. However, conformational changes of the protein potentially affect fluorescence properties of both probes, thereby profoundly complicating interpretation of FRET data. In this study, we assess the effects protein folding has on fluorescence properties of Alexa Fluor 488 (A488), which is commonly used as FRET donor. Here, A488 is covalently attached to Cys69 of apoflavodoxin from Azotobacter vinelandii. Although coupling of A488 slightly destabilizes apoflavodoxin, the three-state folding of this protein, which involves a molten globule intermediate, is unaffected. Upon folding of apoflavodoxin, fluorescence emission intensity of A488 changes significantly. To illuminate the molecular sources of this alteration, we applied steady state and time-resolved fluorescence techniques. The results obtained show that tryptophans cause folding-induced changes in quenching of Alexa dye. Compared to unfolded protein, static quenching of A488 is increased in the molten globule. Upon populating the native state both static and dynamic quenching of A488 decrease considerably. We show that fluorescence quenching of Alexa Fluor dyes is a sensitive reporter of conformational changes during protein folding.
Introduction
The manner by which proteins attain their functional conformation has been a major puzzle in Biochemistry since the seminal experiments of Anfinsen [1]. Combinations of theory, simulation and experiment have led to the concept of funnel-shaped folding energy landscapes [2], [3], [4]. In this concept, unfolded protein molecules descend along a funnel describing the free energy of folding, until the folding molecules reach the state that has the lowest free energy, which is the native state. Presence of kinetic traps and barriers in a folding energy landscape can lead to population of partially folded or misfolded states in the ensemble of folding molecules. The corresponding folding intermediates may form en route to the native state (i.e., they are on-pathway), or may require significant unfolding before the native state can be reached (i.e., they are off-pathway). Often, these intermediates are molten globules. Molten globules are ensembles of interconverting conformers with significant amounts of secondary structure, but lack the tertiary packing characteristics of native proteins [5], [6]. Formation of these aggregation-prone molten globules is linked to the development of various devastating pathologies [7], [8].
Various approaches exist to experimentally tackle protein folding [9]. Frequently, fluorescence spectroscopy is chosen, because this technique is versatile and very sensitive. Several fluorescence read-outs can be used to track protein folding [10], [11]. For instance, fluorescence intensity of tryptophan residues reports on folding-induced changes in the polarity of the microenvironment of these residues. Emission spectra can shift to shorter or longer wavelengths upon folding, and fluorescence anisotropy is folding-state dependent [12], [13]. Upon appropriate labeling of proteins with bright fluorescent dyes, such as Alexa fluorophores [14], even folding of single-molecules can be detected [15], [16], [17], [18].
Through recording of changes in FRET, folding-induced conformational alterations can be monitored [19], [20]. FRET is the distance dependent transfer of electronic excitation energy from an excited donor fluorophore to an acceptor chromophore through non-radiative dipole-dipole coupling [21], [22]. The efficiency of FRET depends on the inverse 6th power of the distance between donor and acceptor. Introduction of an acceptor fluorophore in the vicinity (i.e., up to ∼10 nm) of a donor fluorophore establishes an additional relaxation path for the excited donor, resulting in a decreased fluorescence lifetime of the donor. Regarding FRET studies, ideally, only changes in inter-dye distance lead to altered fluorescence properties of donor and acceptor. However, apart from FRET, changes in protein conformation potentially also affect fluorescence intensities and lifetimes of the probes involved.
Often, Alexa Fluor 488 (A488) is used as donor fluorophore in FRET-detected protein folding (see e.g., [17], [23], [24]), since it is photostable, readily excited at 488 nm, and has a high fluorescence quantum yield. In this study, we assess the effects protein folding has on fluorescence properties of A488 that is covalently attached to Cys69 of apoflavodoxin from A. vinelandii. This protein is referred to as A488-apoflavodoxin (Fig. 1). Based on extensive stopped-flow fluorescence spectroscopy data, we showed that apoflavodoxin kinetic folding is described by [25], [26]:
| (Scheme1) |
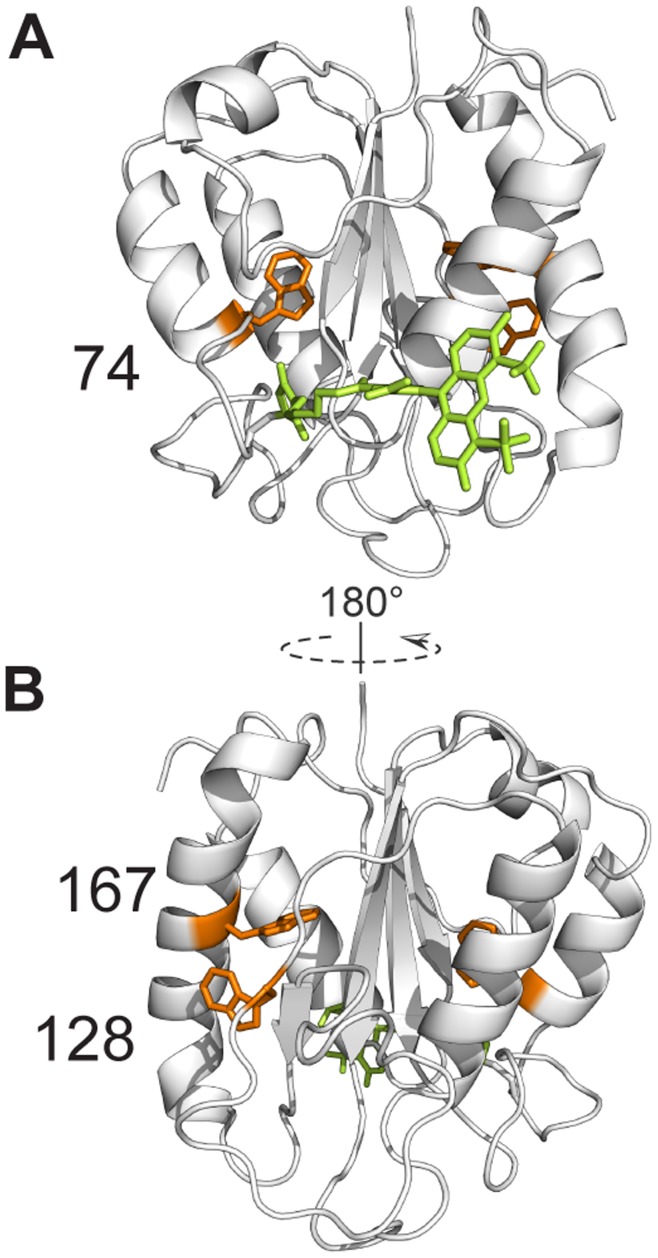
Figure 1. Cartoon model of donor-only labeled apoflavodoxin (i.e., flavodoxin without FMN).
A488 is shown in bright green and is attached to residue 69. Flavodoxin’s three tryptophan residues (i.e., Trp74, Trp128 and Trp167) are shown in orange. The model in B is rotated by 180 degrees along the z-axis, compared to the model shown in A. Cartoon models are generated with PyMOL (Schrödinger, LLC, Palo Alto, Ca, USA) using the crystal structure of A. vinelandii flavodoxin (pdb ID 1YOB [41]) and the molecular structure of A488, as provided by Invitrogen. Apoflavodoxin strongly resembles flavodoxin, except for dynamic disorder in the flavin-binding region.
Analysis of kinetic folding data shows that on-pathway intermediate Ion is highly unstable [25]. Due to its extremely low population, this folding state is not detected in equilibrium folding experiments (i.e., experiments in which denaturant is added to apoflavodoxin and subsequently the protein is allowed to reach thermodynamic equilibrium before acquisition of spectroscopic data). In contrast, because off-pathway intermediate Ioff is stable, this folding state significantly populates in equilibrium folding experiments. Hence, equilibrium folding of apoflavodoxin is described by:
| (Scheme2) |
Non-covalent binding of flavin mononucleotide (FMN) to native apoflavodoxin is the last step in flavodoxin folding and during global unfolding of flavodoxin release of FMN happens first [27]. Flavodoxin functions in A. vinelandii as a one-electron transporter with a strongly negative redox potential [28]. NMR spectroscopy revealed that the off-pathway character of Ioff arises from formation of native and non-native helices in unfolded apoflavodoxin and their subsequent non-native docking [29], [30], [31]. Ioff is a molten globule, and aggregates severely under conditions that mimic macromolecular crowding inside cells [23].
Here, we show that fluorescence of A488 increases significantly upon folding of A488-apoflavodoxin. This observation potentially affects FRET data of folding-induced conformational changes and their interpretation. To illuminate the molecular sources of the changes in fluorescence quenching, we use steady state and time-resolved fluorescence spectroscopy.
Materials and Methods
Engineering, Expression and Purification of Flavodoxin
Wild-type flavodoxin (i.e., flavodoxin containing Cys69 as single cysteine residue) was expressed in Escherichia coli TG2 cells, grown in Terrific Broth medium, and was purified according to well-established procedures [32]. To avoid oxidation of cysteine, dithiothreitol (DTT) was present during protein purification.
The buffer used in all experiments with purified protein was 100 mM potassium pyrophosphate, pH 6.0, unless otherwise mentioned.
Labeling of Cys69 with A488
To optimize accessibility of Cys69 for labeling, flavodoxin was unfolded in 6 M guanidine hydrochloride (GuHCl; Fluka), 100 mM potassium pyrophosphate, pH 7.0. Subsequent addition of 10-fold molar excess of Alexa Fluor 488 C5 maleimide (i.e., A488 (Invitrogen)), for a period exceeding 60 minutes, led to labeling of Cys69. The resulting A488 labeled apoflavodoxin molecules (A488-apoflavodoxin) were separated from unreacted label, FMN and GuHCl, using gel filtration with a Superdex75 10/30 HR column (Pharmacia). To determine the concentration of dye-labeled protein stock, absorption spectra were acquired on an HP-8453 diode array spectrophotometer. Dye-labeled protein stock was divided into 50 µL aliquots, frozen in liquid nitrogen, and stored at −80°C.
To assess the quality of A488-apoflavodoxin, we followed fluorescence quenching of FMN. Upon binding to the protein, fluorescence of FMN severely quenches. In addition, we acquired far-UV circular dichroism (CD) spectra of apoflavodoxin and A488-apoflavodoxin.
Denaturant-dependent Equilibrium Folding
Steady-state fluorescence and circular dichroism (CD) were used to follow denaturant-dependent equilibrium folding of A488-apoflavodoxin. Each data point was acquired at 25°C using 2 µM protein in the appropriate GuHCl concentration. Steady-state fluorescence measurements were done on a Cary Eclipse fluorescence spectrophotometer (Varian). Several combinations of excitation and emission wavelengths were used. Tryptophan fluorescence was measured at 330, 340, 350 and 360 nm, upon excitation at 280 nm. A488 was excited at 475 nm and 493 nm, and fluorescence emission was measured at 515 nm. Fluorescence signals were recorded for 7.125 seconds and averaged. Excitation and emission slits were set to a width of 5 nm. CD signals were acquired by use of a J715 spectropolarimeter (Jasco). Denaturant-dependent protein folding was followed in a 1 mm quartz cuvette by measuring ellipticities at 222, 225 and 255 nm, and the corresponding signal was averaged over 3 min/wavelength with a 1s data interval. The averaged ellipticity at 255 nm was subtracted from the averaged ellipticities measured at 222 and 225 nm.
We also acquired time-resolved fluorescence of a denaturant-dependent equilibrium folding series of 62.5 nM dye-labeled apoflavodoxin. Use was made of the time-correlated single photon counting set-up described elsewhere [33]. Pulse duration was 0.2 ps, pulse energies were at the pJ level and the repetition rate of pulses was 3.8×10⁶ Hz. Decay curves were constructed by collecting photons in 4096 channels of a multi-channel analyzer using a channel time spacing of 5.0 ps. A488 fluorescence lifetimes were measured using excitation at 450 nm, the fluorescence emission was filtered through a 512.2±13.4 nm interference filter with a 3 mm GG 475 cut-off filter (all filters are from Schott, Mainz, Germany). Background fluorescence was measured using the same conditions. The dynamic instrumental response function was determined using a freshly made solution of erythrosine B in water as reference compound (OD450 nm is 0.1; the fluorescence lifetime τ is 89 ps at 20°C [33]). Fluorescence decay curves were analyzed using the TRFA data processor (SSTCenter, Minsk, Belarus).
To avoid protein adsorbing to surfaces, Tween-20 was added to all solutions to a final concentration of 0.0035% (w/v). This addition does not affect apoflavodoxin stability, since no change in thermal midpoint of apoflavodoxin unfolding is observed. Prior to measurements, samples stood for 16 to 24 hours in the dark at 25°C, and were at equilibrium. Refractometry was used to determine the GuHCl concentration in each individual sample [34].
Thermodynamic Analysis of Equilibrium Folding Data
A three-state model (equations 1 to 5), was globally fitted to equilibrium folding data of A488-apoflavodoxin, monitored by fluorescence emission of tryptophan and of A488, and by far-UV CD, using ProFit (QuantumSoft, Zürich, Switzerland):
| (1) |
| (2) |
| (3) |
 |
(4) |
| (5) |
in which U, I and N represent unfolded protein, off-pathway folding intermediate and native apoflavodoxin, respectively, Kij is the equilibrium constant of the i-j equilibrium, mij is the constant that describes the denaturant concentration-dependence of Kij, superscript 0 designates the parameter at zero denaturant concentration, [D] is the denaturant concentration, fi is the fractional population of state i at a particular denaturant concentration, Yobs is the observed spectroscopic signal, ai is the spectroscopic property of state i at zero denaturant concentration, and bi is the constant describing the denaturant concentration-dependence of the spectroscopic signal of state i.
The denaturant-dependence of the spectroscopic parameters of the off-pathway folding intermediate (bI in equation 5 cannot be accurately determined because the corresponding folding state populates only in a small range of GuHCl concentrations. Therefore bI is set to zero in the global fit procedure [25]. Each individual data point was weighted by the square of the corresponding standard error during the global fit procedure.
Results and Discussion
Alexa Fluor 488 Fluorescence is a Reporter of Apoflavodoxin Folding
To optimize accessibility of Cys69, we unfold flavodoxin in 6 M guanidine hydrochloride. Subsequent addition of A488 leads to labeling of this amino acid residue. Upon removal of denaturant, unfolded A488-apoflavodoxin autonomously folds to native dye-labeled apoprotein, because apoflavodoxin unfolding is reversible [32]. Subsequent addition of FMN leads to full reconstitution of dye-labeled holoprotein and severe quenching of FMN fluorescence intensity (data not shown). Hence, coupling of A488 to Cys69, which resides in the flavin-binding region of the protein, does not impede the ability of apoflavodoxin to bind the FMN cofactor. Far-UV CD spectra of A488-apoflavodoxin and apoflavodoxin are similar (data not shown), which further substantiates that the conformational properties of A488-apoflavodoxin and apoflavodoxin are alike.
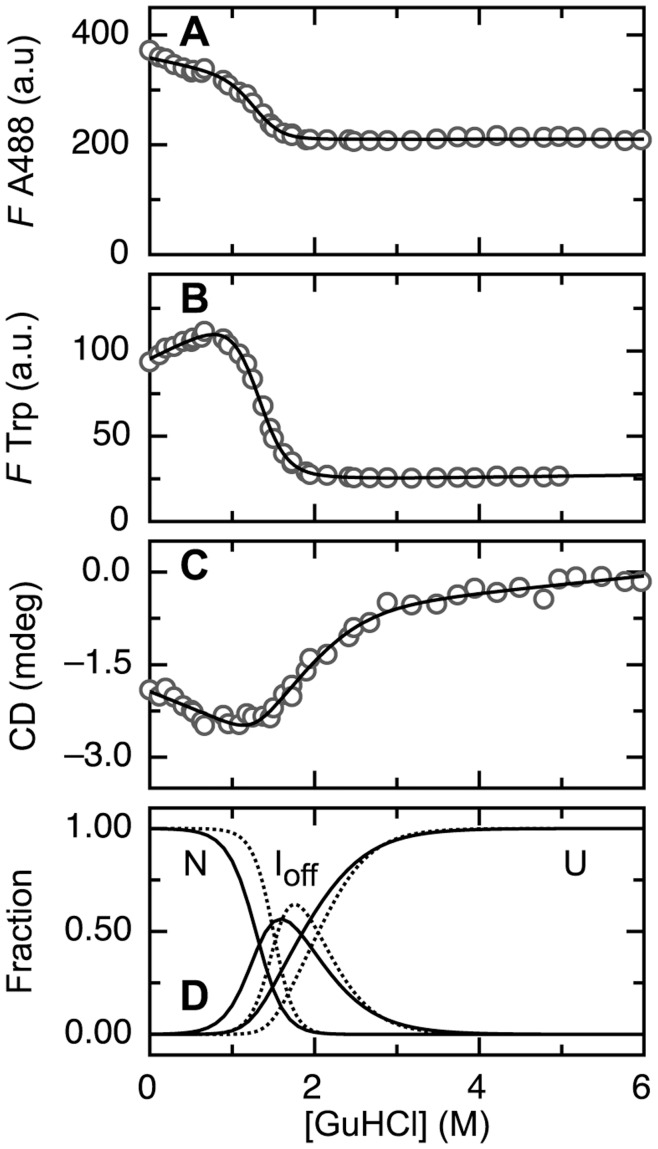
We determined denaturant-dependent folding curves of 2 µM A488-apoflavodoxin by acquiring (i) fluorescence emission of A488 at 515 nm (upon excitation at 475 (Fig. 2A) and 493 nm, respectively), (ii) tryptophan fluorescence at 330 (Fig. 2B), 340, 350 and 360 nm (upon excitation at 280 nm), and (iii) CD at 222 (Fig. 2C) and 225 nm. Fluorescence emission of A488 tracks folding of A488-apoflavodoxin (Fig. 2A), because quenching of this fluorescence changes significantly upon going from unfolded A488-apoflavodoxin in 6 M GuHCl to native dye-labeled protein at 0 M denaturant. The folding curve obtained by CD (Fig. 2C) has a transition midpoint that lies at higher concentration of denaturant than the midpoints of the folding curves obtained by fluorescence (Figs. 2A, B) (i.e., 1.84±0.53 and 1.33±0.06 M GuHCl, respectively). This observation implies involvement of a stable intermediate during folding of A488-apoflavodoxin, just as happens for apoflavodoxin folding.
Figure 2. An intermediate populates during denaturant-dependent equilibrium folding of A488-apoflavodoxin.
(A) Fluorescence emission intensity of A488 at 515 nm upon excitation at 475 nm. (B) Fluorescence emission intensity of tryptophan at 330 nm upon excitation at 280 nm. (C) CD at 222 nm. Solid lines in panels A to C are the result of a global fit of a three-state model of equilibrium folding to all data acquired (see Materials and Methods and Results sections). (D) Denaturant-dependence of the populations of native (N), off-pathway intermediate (Ioff) and unfolded (U) A488-apoflavodoxin (solid lines) and of apoflavodoxin (dotted lines), respectively. Protein concentration is 2 µM in 100 mM potassium pyrophosphate, pH 6.0, and data are recorded at 25°C.
The three-state model for thermodynamic analysis of apoflavodoxin folding (equations 1–5) fits the above-mentioned folding data (Fig. 2). The corresponding thermodynamic parameters (Table 1) show that coupling of A488 to Cys69 predominantly destabilizes native apoflavodoxin. Analogous to modifying cysteine by this attachment, the stability of native apoflavodoxin decreases upon mutating amino acid residues [13], [30], [31], [32]. Yet, just as observed here for A488-apoflavodoxin, folding occurs according to a three-state model, because this is a typical feature of proteins with a flavodoxin-like fold [35].
Table 1. Thermodynamic parameters extracted from a global fit of a three-state model to folding data of apoflavodoxin [25] and of A488-apoflavodoxin (see Fig. 2 and Results section).
| Apoflavodoxin | A488-apoflavodoxin | Apoflavodoxin | A488-apoflavodoxin | ||
| ΔGUI (kcal/mol) | 3.74±0.49 | 2.67±0.62 | mUI (kcal mol−1 M−1) | −1.83±0.19 | −1.45±0.25 |
| ΔGIN (kcal/mol) | 6.70±0.17 | 4.27±0.13 | mIN (kcal mol−1 M−1) | −4.40±0.11 | −3.21±0.12 |
| ΔGUN (kcal/mol) | 10.45±0.52 | 6.94±0.63 | mUN (kcal mol−1 M−1) | −6.23±0.23 | −4.66±0.28 |
ΔGij is the difference in free energy between species i and j at 0 M denaturant, and mij is the dependence of ΔGij on denaturant concentration. Errors shown are standard errors.
The Folding Intermediate of A488-apoflavodoxin is a Molten Globule
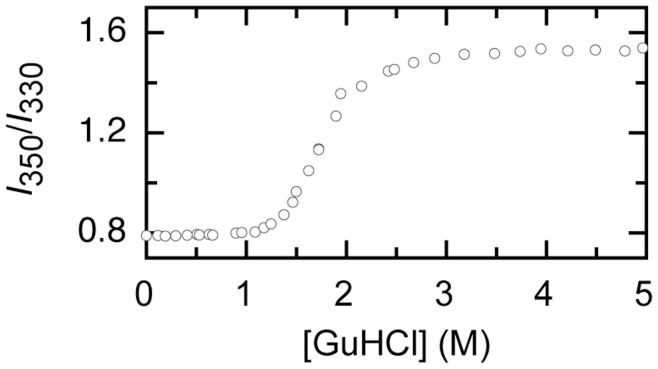
Tryptophan fluorescence acquired at 330 nm of A488-folding intermediate and of unfolded A488-apoflavodoxin, both in absence of denaturant, are calculated to be 30% and 24% of the tryptophan fluorescence value that characterizes native A488-labeled protein, respectively. Upon unfolding of apoflavodoxin, λmax of tryptophan fluorescence emission shifts from 329 nm to 352 nm [25]. For A488-apoflavodoxin we measured tryptophan fluorescence at 330, 340, 350 and 360 nm. Due to the expected red shift of λmax upon A488-apoflavodoxin unfolding, the ratio of tryptophan fluorescence emission at 350 nm to the corresponding value at 330 nm (i.e., I350/I330) should increase, as Fig. 3 indeed demonstrates. Comparison of Figs. 2D and 3 shows that at the denaturant concentration where Ioff populates maximally, λmax must be higher than the value that characterizes native apoflavodoxin. At 1.6 M GuHCl the ratio I350/I330 has not reached the value that characterizes unfolded protein (Fig. 3). Hence, the intermediate lacks the tertiary side-chain packing characteristics of native A488-apoflavodoxin. Thus, tryptophans of the folding intermediate likely experience a less hydrophobic environment than in native protein. At about 1.8 M GuHCl virtually no native apoflavodoxin molecules are present as judged from fluorescence data (Fig. 2B), but still a significant CD signal is observed (Fig. 2C). Thus, the folding intermediate has a substantial amount of secondary structure, but lacks the tertiary side-chain packing of natively folded apoflavodoxin. This observation is typical for a molten globule-like intermediate. Most likely, just as for apoflavodoxin, the intermediate observed during folding of A488-apoflavodoxin is a molten globule.
Figure 3. Upon GuHCl-dependent unfolding of A488-apoflavodoxin the ratio of tryptophan fluorescence emission at 350 nm to the corresponding value at 330 nm (i.e., I350/I330) alters.
Identification of the Sources that Cause Folding-induced Changes in Quenching of A488 Fluorescence
Fluorescence of A488 alters significantly upon folding of A488-apoflavodoxin (Fig. 2A). This phenomenon is due to changes in dynamic and/or static quenching of A488 fluorescence. Static quenching is the result of a non-fluorescent ground-state complex between a fluorophore and quencher that pertains during the excited state lifetime of the fluorophore. When this complex absorbs light it immediately returns to the ground state without emission of a photon. Fluorescence quantum yield QD of fluorophores that do not form a complex with quencher is unperturbed. In contrast, dynamic quenching results from transient collisional encounters between a fluorophore and quencher during the lifetime of the excited state, and is a time-dependent process [36]. Thus, dynamic quenching introduces an additional non-radiative decay path from the excited state of A488, and as a result, QD as well as the Förster distance R0 decrease. Hence, to be able to quantitatively analyze inter-dye distances in FRET studies of protein folding requires identification of the mechanisms that cause quenching of donor dye, as this study reports for A488. In FRET studies of protein folding one should therefore determine for each folding species whether static and/or dynamic quenching affects fluorescence intensity of donor, and, if necessary, adjust R0. In the following, we describe how to experimentally identify the sources that cause folding-induced changes in quenching of A488 fluorescence emission of A488-apoflavodoxin.
Dynamic quenching causes a proportional decrease of fluorescence lifetime and intensity of the fluorophore involved. The Stern-Volmer equation describes collisional quenching of fluorescence:
| (6) |
in which τ0 and τ are fluorescence lifetimes and F0 and F are the fluorescence intensities in the absence and presence of quencher, respectively, KD is the Stern-Volmer quenching constant (KD = kqτ0, in which kq is the bimolecular quenching constant [36]), and [Q] is the concentration of quencher.
In contrast, when static quenching is the source of diminished fluorescence intensity, no decrease in fluorescence lifetime is detected [36], because only fluorescent molecules are observed. Therefore, in case of static quenching:
| (7) |
Thus, by comparing the ratio of fluorescence intensities in the absence and the presence of quencher, versus the ratio of their corresponding fluorescence lifetimes, the sources for quenching of a fluorophore can be identified [37].
With respect to elucidating the contributions of static and dynamic quenching in folding-induced changes of A488 fluorescence, we measured A488 fluorescence intensity decay I(t) of dye-labeled apoflavodoxin at various denaturant concentrations. By using a sum of discrete exponentials with lifetimes τi and amplitudes αi, a global fit to the data is made according to:
| (8) |
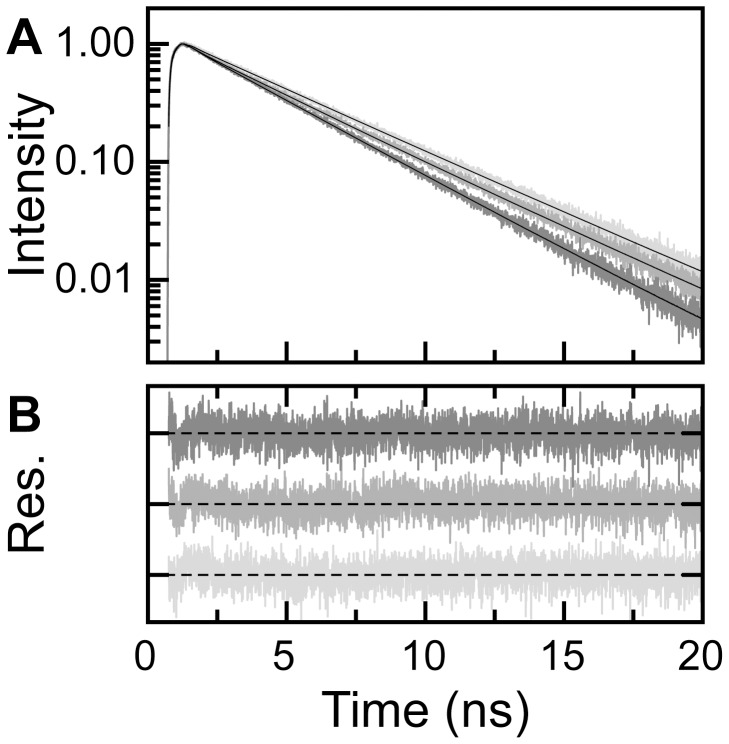
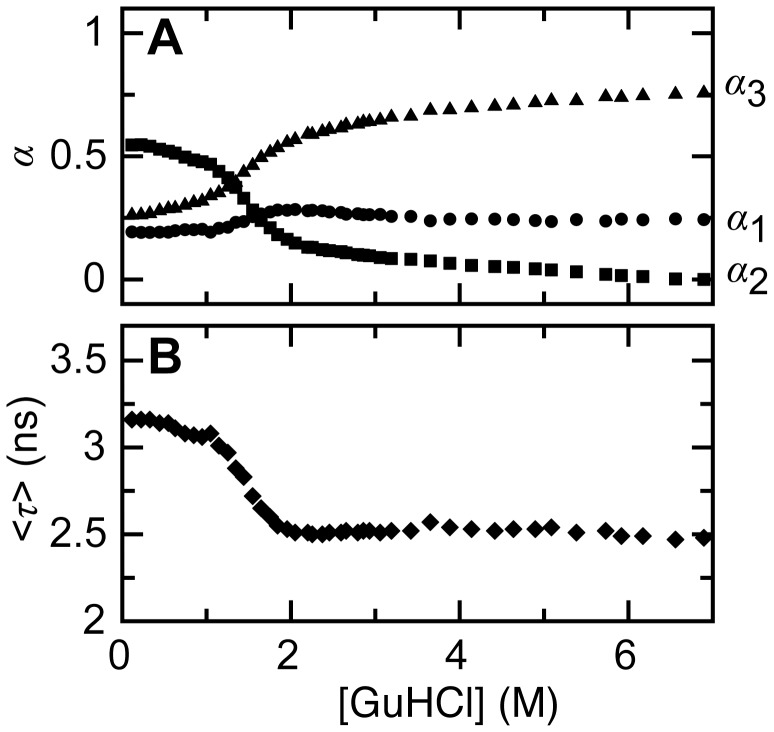
with g(t) the instrumental response function used for deconvolution of the measured signal. Figure 4 shows examples of A488 fluorescence intensity decay curves obtained for A488-apoflavodoxin. Across the whole denaturant range used, three fluorescence lifetimes (i.e., τ1 = 0.349, τ2 = 4.150, and τ3 = 3.161 ns) describe the decay of A488 fluorescence of dye-labeled apoflavodoxin (global χ2 = 1.077). The corresponding amplitudes track the folding of A488-apoflavodoxin (Fig. 5A). Because A488 fluorescence decay is tri-exponential, we need to use the amplitude average fluorescence lifetime [37]:
| (9) |
as substitute for fluorescence life times in equation 6. Figure 5B shows that <τ> tracks folding of A488-apoflavodoxin.
Figure 4. Examples of fluorescence intensity decay curves of A488-apoflavodoxin.
(A) Normalized fluorescence decay of A488 of dye-labeled apoflavodoxin at 0.1, 1.5 and 6.9 M denaturant (light grey to dark grey, respectively). Solid lines show the results of a tri-exponential fit of equation 8 to the data. (B) Weighted residuals of the fits.
Figure 5. Denaturant-dependencies of normalized amplitudes and average lifetime of the tri-exponential fluorescence decay curves of A488 of dye-labeled apoflavodoxin.
(A) Denaturant-dependence of normalized amplitudes α1 (red diamonds), α2 (blue squares) and α3 (orange dots). Corresponding fluorescence lifetimes are: τ1 = 0.439 ns, τ2 = 4.150 ns, and τ3 = 3.161 ns. (B) Denaturant-dependence of average lifetime <τ>. To calculate <τ>, equation 9 is used.
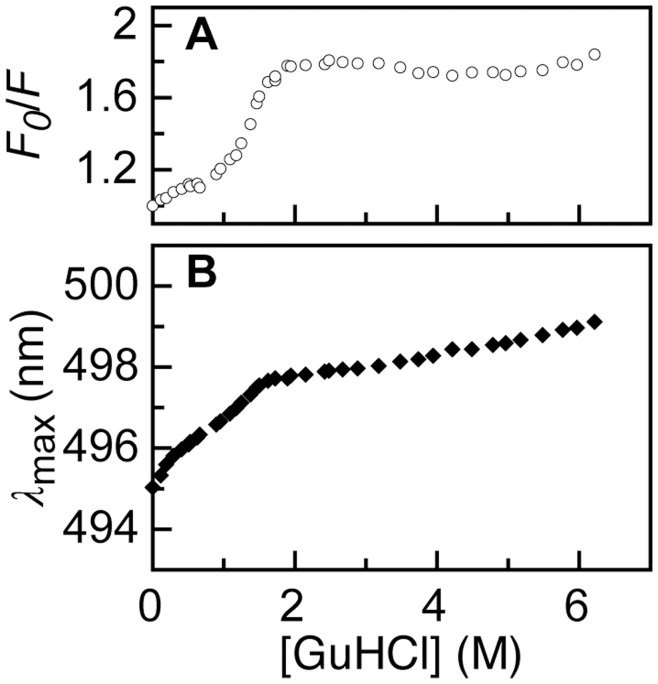
We define F0 and <τ0> as fluorescence intensity and amplitude average fluorescence lifetime of native A488-apoflavodoxin at the lowest denaturant concentration used, respectively. Figure 2A shows that the native baseline of the A488 fluorescence-detected folding curve of apoflavodoxin, which encompasses the GuHCl range of 0 to about 0.7 M, has a rather steep negative slope. As a result, for native protein F0/F changes markedly in this denaturant range (Fig. 6A). In contrast, the amplitude average fluorescence lifetime decreases only slightly in the native baseline (Fig. 5B). To elucidate the origin of the change of F0/F in the native baseline we note that the absorption maximum of A488 shifts from 495 to 499 nm upon going from 0 to 6 M GuHCl (Fig. 6B). This 4 nm shift causes a ∼10% decrease in molar extinction coefficient of A488, and thus in efficiency of excitation of A488 at 475 nm, which is the wavelength used to acquire the data of Fig. 2A. In addition, the fluorescence emission maximum shifts slightly to longer wavelength upon increasing GuHCl concentration.
Figure 6. Denaturant-dependencies of F0/F and absorption maximum of A488-apoflavodoxin.
(A) Denaturant-dependence of F0/F of A488-apoflavodoxin, using the data of Fig. 2A. (B) The absorption maximum λ max of A488-apoflavodoxin shifts from 495 to 499 nm upon going from 0 to 6 M GuHCl.
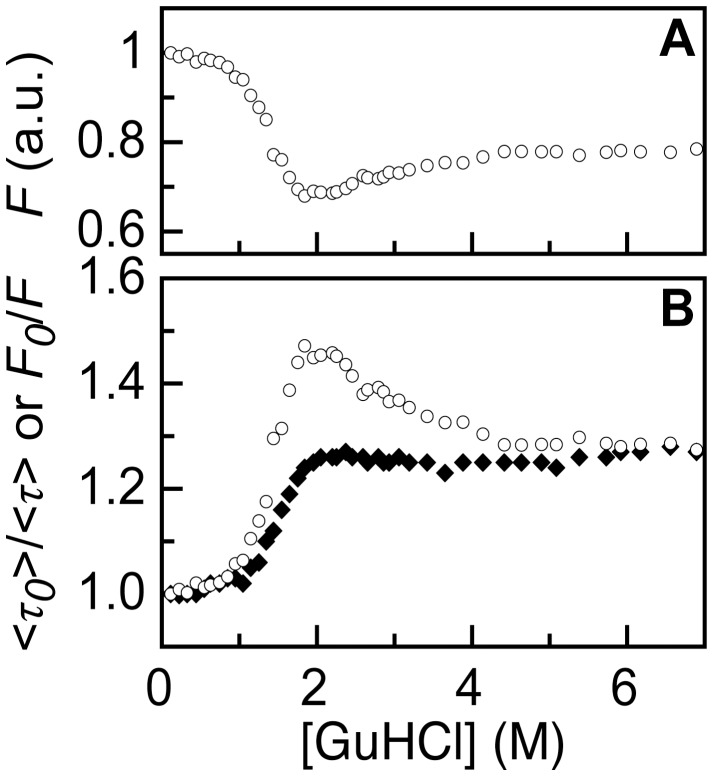
To avoid both phenomena that cause the change of A488 fluorescence in the native baseline of Fig. 2A and the corresponding increase of F0/F, we determine F0/F by exciting A488 at its fluorescence excitation maximum and record fluorescence at the fluorescence emission maximum of A488 [37]. Figure 7A shows the results of this experiment and Fig. 7B reports the corresponding denaturant dependence of F0/F. Using the fluorescence lifetime data of Fig. 5B, we establish the denaturant dependence of <τ0>/<τ>, which is shown in Fig. 7B. By comparing the denaturant dependencies of F0/F and <τ0>/<τ>, the changes in static and dynamic quenching of A488 fluorescence during folding of dye-labeled apoflavodoxin can now be identified.
Figure 7. Tracking of changes in static and dynamic quenching of A488 fluorescence upon folding of A488-apoflavodoxin.
(A) Denaturant dependence of A488 fluorescence F. A488 is excited at its denaturant-dependent fluorescence excitation maximum and A488 fluorescence is recorded at its denaturant-dependent fluorescence emission maximum. (B) Denaturant dependence of F0/F (open dots) and <τ0>/<τ> (filled diamonds), calculated from the data in panel (A) and Fig. 5B, respectively.
Dynamic and Static Quenching of A488 Fluorescence Tracks Protein Folding
Recently, fluorescence emission of Alexa dyes was measured as function of the concentration of the 20 naturally occurring L-amino acids [38]. Tryptophan, tryrosine, methionine, and histidine residues were identified as quenchers of A488. Fluorescence quenching of Alexa 488 originates from photoinduced electron transfer [38], [39] and typically occurs when the distance between fluorophore and quencher is wihin a few Ångstroms. In case of static quenching, quencher and fluorophores are at van der Waals contact distances and photoinduced electron transfer becomes ultrafast [40]. Tryptophan and tyrosine cause similar dynamic quenching of A488. Compared to these amino acids, quenching by methionine and histidine is marginal. In addition, only tryptophan causes considerable static quenching of A488 [38]. Flavodoxin does not contain histidine residues, has one methionine residue (Met30), three tryptophan residues (i.e., Trp74, Trp128 and Trp167), and five tyrosine residues (i.e., Tyr47, Tyr102, Tyr106, Tyr114 and Tyr133). Of these residues, Trp74 most likely causes folding-induced changes in quenching of A488 fluorescence, because this residue is nearest to Cys69 and shielded from solvent in native A488-apoflavodoxin (Fig. 1).
Comparison of the denaturant-dependencies of <τ0>/<τ> and F0/F reveals that the native baselines of both folding curves have slopes that are equally shallow (Fig. 6B). Thus, addition of denaturant hardly affects A488 fluorescence of native dye-labeled apoflavodoxin. Figure 7B shows that random coil A488-apoflavodoxin, which exists above 6 M GuHCl [29], has similar <τ0>/<τ>- and F0/F-values, which are both larger than the corresponding values that characterize native protein. Thus, dynamic quenching of A488 in random coil protein is larger than in native apoflavodoxin.
Upon decreasing denaturant concentration from 6 to 2 M GuHCl, F0/F increases considerably, while <τ0>/<τ> barely alters (Fig. 7B). Apoflavodoxin’s molten globule forms in this denaturant range, whereas the native state of the protein does not populate yet. Consequently, compared to unfolded protein, only static quenching of A488 is enhanced in this folding intermediate. Figure 7B shows that static quenching of A488 exclusively tracks formation of apoflavodoxin’s molten globule. Both static and dynamic quenching of A488 decreases considerably upon increasing the population of the native state by lowering GuHCl concentration below 2 M (Fig. 7B). Clearly, the results of this work show that A488 fluorescence is a sensitive reporter of protein folding.
Acknowledgments
We thank Arie van Hoek for help in acquisition of time-resolved fluorescence data.
Funding Statement
The Netherlands Organization for Scientific Research (NWO) supported this work. The funders had no role in study design, data collection and analysis, decision to publish, or preparation of the manuscript.
References
- 1. Anfinsen CB (1973) Principles that govern the folding of protein chains. Science 181: 223–230. [DOI] [PubMed] [Google Scholar]
- 2. Dill KA, Chan HS (1997) From Levinthal to pathways to funnels. Nat Struct Mol Biol 4: 10–19. [DOI] [PubMed] [Google Scholar]
- 3. Bryngelson JD, Onuchic JN, Socci ND, Wolynes PG (1995) Funnels, pathways, and the energy landscape of protein folding: a synthesis. Proteins Struct Funct Bioinf 21: 167–195. [DOI] [PubMed] [Google Scholar]
- 4. Dinner AR, Sali A, Smith LJ, Dobson CM, Karplus M (2000) Understanding protein folding via free-energy surfaces from theory and experiment. Trends Biochem Sci 25: 331–339. [DOI] [PubMed] [Google Scholar]
- 5. Ptitsyn OB (1995) Molten globule and protein folding. Adv Protein Chem 47: 83–229. [DOI] [PubMed] [Google Scholar]
- 6. Arai M, Kuwajima K (2000) Role of the molten globule state in protein folding. Adv Protein Chem 53: 209–282. [DOI] [PubMed] [Google Scholar]
- 7. Dobson CM (2003) Protein folding and misfolding. Nature 426: 884–890. [DOI] [PubMed] [Google Scholar]
- 8. Vendruscolo M, Paci E, Dobson CM, Karplus M (2001) Three key residues form a critical contact network in a protein folding transition state. Nature 409: 641–645. [DOI] [PubMed] [Google Scholar]
- 9. Ohgushi M, Wada A (1983) ‘Molten-globule state’: a compact form of globular proteins with mobile side-chains. FEBS Lett 164: 21–24. [DOI] [PubMed] [Google Scholar]
- 10. Eftink MR (1994) The use of fluorescence methods to monitor unfolding transitions in proteins. Biophys J 66: 482–501. [DOI] [PMC free article] [PubMed] [Google Scholar]
- 11. Kuznetsova IM, Turoverov KK, Uversky VN (2004) Use of the phase diagram method to analyze the protein unfolding-refolding reactions: Fishing out the “invisible” intermediates. Journal of Proteome Research 3: 485–494. [DOI] [PubMed] [Google Scholar]
- 12. Visser NV, Westphal AH, van Hoek A, van Mierlo CP, Visser AJ, et al. (2008) Tryptophan-tryptophan energy migration as a tool to follow apoflavodoxin folding. Biophys J 95: 2462–2469. [DOI] [PMC free article] [PubMed] [Google Scholar]
- 13. Laptenok SP, Visser NV, Engel R, Westphal AH, van Hoek A, et al. (2011) A general approach for detecting folding intermediates from steady-state and time-resolved fluorescence of single-tryptophan-containing proteins. Biochemistry 50: 3441–3450. [DOI] [PubMed] [Google Scholar]
- 14. Panchuk-Voloshina N, Haugland RP, Bishop-Stewart J, Bhalgat MK, Millard PJ, et al. (1999) Alexa dyes, a series of new fluorescent dyes that yield exceptionally bright, photostable conjugates. J Histochem Cytochem 47: 1179–1188. [DOI] [PubMed] [Google Scholar]
- 15. Deniz AA, Laurence TA, Beligere GS, Dahan M, Martin AB, et al. (2000) Single-molecule protein folding: Diffusion fluorescence resonance energy transfer studies of the denaturation of chymotrypsin inhibitor 2. Proc Natl Acad Sci USA 97: 5179–5184. [DOI] [PMC free article] [PubMed] [Google Scholar]
- 16. Rhoades E, Cohen M, Schuler B, Haran G (2004) Two-state folding observed in individual protein molecules. J Am Chem Soc 126: 14686–14687. [DOI] [PubMed] [Google Scholar]
- 17. Schuler B, Lipman EA, Eaton WA (2002) Probing the free-energy surface for protein folding with single-molecule fluorescence spectroscopy. Nature 419: 743–747. [DOI] [PubMed] [Google Scholar]
- 18. Deniz AA, Dahan M, Grunwell JR, Ha TJ, Faulhaber AE, et al. (1999) Single-pair fluorescence resonance energy transfer on freely diffusing molecules: Observation of Forster distance dependence and subpopulations. Proc Natl Acad Sci USA 96: 3670–3675. [DOI] [PMC free article] [PubMed] [Google Scholar]
- 19. Haas E, Katchalski-Katzir E, Steinberg IZ (1978) Brownian-Motion of Ends of Oligopeptide Chains in Solution as Estimated by Energy-Transfer between Chain Ends. Biopolymers 17: 11–31. [Google Scholar]
- 20. Amir D, Haas E (1987) Estimation of Intramolecular Distance Distributions in Bovine Pancreatic Trypsin-Inhibitor by Site-Specific Labeling and Nonradiative Excitation Energy-Transfer Measurements. Biochemistry 26: 2162–2175. [DOI] [PubMed] [Google Scholar]
- 21. Förster T (1948) Zwischenmolekulare Energiewanderung Und Fluoreszenz. Ann Phys 2: 55–75. [Google Scholar]
- 22. Stryer L, Haugland RP (1967) Energy transfer: a spectroscopic ruler. Proc Natl Acad Sci USA 58: 719–726. [DOI] [PMC free article] [PubMed] [Google Scholar]
- 23. Engel R, Westphal AH, Huberts DH, Nabuurs SM, Lindhoud S, et al. (2008) Macromolecular crowding compacts unfolded apoflavodoxin and causes severe aggregation of the off-pathway intermediate during apoflavodoxin folding. J Biol Chem 283: 27383–27394. [DOI] [PubMed] [Google Scholar]
- 24. Rhoades E, Gussakovsky E, Haran G (2003) Watching proteins fold one molecule at a time. Proc Natl Acad Sci USA 100: 3197–3202. [DOI] [PMC free article] [PubMed] [Google Scholar]
- 25. Bollen YJ, Sanchéz IE, van Mierlo CP (2004) Formation of on- and off-pathway intermediates in the folding kinetics of Azotobacter vinelandii apoflavodoxin. Biochemistry 43: 10475–10489. [DOI] [PubMed] [Google Scholar]
- 26. Bollen YJ, Kamphuis MB, van Mierlo CP (2006) The folding energy landscape of apoflavodoxin is rugged: Hydrogen exchange reveals nonproductive misfolded intermediates. Proc Natl Acad Sci USA 103: 4095–4100. [DOI] [PMC free article] [PubMed] [Google Scholar]
- 27. Bollen YJ, Nabuurs SM, van Berkel WJ, van Mierlo CP (2005) Last in, first out: The role of cofactor binding in flavodoxin folding. J Biol Chem 280: 7836–7844. [DOI] [PubMed] [Google Scholar]
- 28. Steensma E, Heering HA, Hagen WR, Van Mierlo CP (1996) Redox properties of wild-type, Cys69Ala, and Cys69Ser Azotobacter vinelandii flavodoxin II as measured by cyclic voltammetry and EPR spectroscopy. Eur J Biochem 235: 167–172. [DOI] [PubMed] [Google Scholar]
- 29. Nabuurs SM, Westphal AH, van Mierlo CP (2008) Extensive formation of off-pathway species during folding of an α-β parallel protein is due to docking of (non)native structure elements in unfolded molecules. J Am Chem Soc 130: 16914–16920. [DOI] [PubMed] [Google Scholar]
- 30. Nabuurs SM, Westphal AH, aan den Toorn M, Lindhoud S, van Mierlo CP (2009) Topological switching between an α-β parallel protein and a remarkably helical molten globule. J Am Chem Soc 131: 8290–8295. [DOI] [PubMed] [Google Scholar]
- 31. Nabuurs SM, de Kort BJ, Westphal AH, van Mierlo CP (2009) Non-native hydrophobic interactions detected in unfolded apoflavodoxin by paramagnetic relaxation enhancement. Eur Biophys J 39: 689–698. [DOI] [PMC free article] [PubMed] [Google Scholar]
- 32. van Mierlo CP, van Dongen WM, Vergeldt F, van Berkel WJ, Steensma E (1998) The equilibrium unfolding of Azotobacter vinelandii apoflavodoxin II occurs via a relatively stable folding intermediate. Protein Sci 7: 2331–2344. [DOI] [PMC free article] [PubMed] [Google Scholar]
- 33. Borst JW, Hink MA, van Hoek A, Visser AJ (2005) Effects of refractive index and viscosity on fluorescence and anisotropy decays of enhanced cyan and yellow fluorescent proteins. J Fluoresc 15: 153–160. [DOI] [PubMed] [Google Scholar]
- 34.Nozaki Y (1972) The preparation of guanidine hydrochloride. Methods Enzymol 26. [DOI] [PubMed]
- 35. Bollen YJ, van Mierlo CP (2005) Protein topology affects the appearance of intermediates during the folding of proteins with a flavodoxin-like fold. Biophys Chem 114: 181–189. [DOI] [PubMed] [Google Scholar]
- 36.Lakowicz JR (2006) Principles of fluorescence spectroscopy. New York: Springer Verlag. 954 p.
- 37. Sillen A, Engelborghs Y (1998) The correct use of “average” fluorescence parameters. Photochem Photobiol 67: 475–486. [Google Scholar]
- 38. Chen H, Ahsan SS, Santiago-Berrios MB, Abruna HD, Webb WW (2010) Mechanisms of quenching of Alexa fluorophores by natural amino acids. J Am Chem Soc 132: 7244–7245. [DOI] [PMC free article] [PubMed] [Google Scholar]
- 39. Choi J, Kim S, Tachikawa T, Fujitsuka M, Majima T (2011) Unfolding dynamics of cytochrome c revealed by single-molecule and ensemble-averaged spectroscopy. Phys Chem Chem Phys 13: 5651–5658. [DOI] [PubMed] [Google Scholar]
- 40. Zhong DP, Zewail AH (2001) Femtosecond dynamics of flavoproteins: Charge separation and recombination in riboflavine (vitamin B-2)-binding protein and in glucose oxidase enzyme. Proc Natl Acad Sci USA 98: 11867–11872. [DOI] [PMC free article] [PubMed] [Google Scholar]
- 41. Alagaratnam S, van Pouderoyen G, Pijning T, Dijkstra BW, Cavazzini D, et al. (2005) A crystallographic study of Cys69Ala flavodoxin II from Azotobacter vinelandii: structural determinants of redox potential. Protein Sci 14: 2284–2295. [DOI] [PMC free article] [PubMed] [Google Scholar]


