

Abstract
The study of intracellular transport pathways at epithelial cell barriers that line diverse tissue sites is fundamental to understanding tissue homeostasis. A major impediment to investigating such processes at the subcellular level has been the lack of imaging approaches that support fast three-dimensional (3D) tracking of cellular dynamics in thick cellular specimens. Here, we report significant advances in multifocal plane microscopy and demonstrate 3D single molecule tracking of rapid protein dynamics in a 10 micron thick live epithelial cell monolayer. We have investigated the transferrin receptor (TfR) pathway, which is not only essential for iron delivery but is also of importance for targeted drug delivery across cellular barriers at specific body sites, such as the brain that is impermeable to blood-borne substances. Using multifocal plane microscopy, we have discovered a cellular process of intercellular transfer involving rapid exchange of Tf molecules between two adjacent cells in the monolayer. Furthermore, 3D tracking of Tf molecules at the lateral plasma membrane has led to the identification of different modes of endocytosis and exocytosis, which exhibit distinct temporal and intracellular spatial trajectories. These results reveal the complexity of the 3D trafficking pathways in epithelial cell barriers. The methods and approaches reported here can enable the study of fast 3D cellular dynamics in other cell systems and models, and underscore the importance of developing advanced imaging technologies to study such processes.
Introduction
Protein transport within and across cells is an essential process for maintaining normal cellular function. The study of intracellular trafficking pathways is of fundamental importance to understanding the molecular basis of multiple diseases that are caused by defects in these processes (1,2). Consequently, understanding complex intracellular trafficking processes is a common theme in many areas of biomedical research. Examples include analyses of the endosomal recycling and secretory pathways, and the study of protein transport across cellular barriers such as epithelial cell monolayers (3,4).
The analysis of three-dimensional (3D) intracellular trafficking pathways merits the use of single-molecule imaging techniques. This approach enables the study of individual transport pathways, which suffer from averaging when imaged through conventional 3D microscopy techniques (5–7). However, 3D single molecule tracking poses several challenges, especially in thick cell samples such as a cell monolayer that is ∼10 μm thick (8). Specifically, we require a methodology that not only supports reliable 3D tracking of fast moving single molecules across significant depths, but also enables the imaging of the cellular environment with which the single molecules interact. Current approaches to 3D single molecule tracking (9–12) are not well suited for studying the trafficking pathways in a cell monolayer, because they have restricted imaging depth, poor temporal resolution, and the ability to track only a few molecules at one time.
Here, we demonstrate that multifocal plane microscopy (MUM), a multiplane 3D imaging modality developed in our laboratory (13–15), overcomes these limitations and enables 3D single molecule tracking in thick cellular samples. Specifically, MUM not only supports rapid 3D tracking of several molecules at the same time across a depth of 10 μm, but it also allows multicolor imaging. This has enabled us to carry out 3D single molecule tracking in addition to the 3D imaging of the cellular environment (lateral plasma membrane) with which the molecules interact.
To exemplify the capabilities of the new methodology, we have mapped the 3D trafficking pathways of the transferrin receptor (TfR) using quantum dot-labeled single Tf molecules (Tf-QD molecules) in an in vitro model of the blood cerebrospinal fluid barrier (BCSFB) comprising an epithelial cell monolayer. The BCSFB regulates protein/solute transport between the blood and the cerebrospinal fluid, which bathes the brain and the spinal cord (16). The TfR plays a central role in iron homeostasis in the body by mediating the binding and uptake of iron transporters such as Tf (17) and ferritin H-chain (18). Therapeutically, the TfR pathway is extensively targeted for the delivery of drugs, genes, and macromolecules to the brain (19,20), and is of relevance to understanding the beneficial effects of iron clearance seen in animal models of brain disorders such as multiple sclerosis (21,22).
The use of MUM has led to an unexpected finding of a cellular process, intercellular transfer, which involves cargo exchange between two adjacent cells in the monolayer. Strikingly, the process occurs rapidly (t < 1 s) and Tf molecules can traverse significant depths (∼2–6 μm) across the monolayer. We also present a detailed characterization of Tf endocytosis and exocytosis at the lateral plasma membrane, which has been notoriously difficult to image due to several technical limitations. Our results reveal two modes (termed sliding and orthogonal) of endocytosis and exocytosis, which are characterized by their distinct intracellular trafficking itineraries.
The observations made in this study would not have been possible without the 3D single-molecule detection and the multiplane imaging capabilities of MUM at extended depths, which are essential for the unambiguous identification and tracking of these rapid 3D trafficking events. Thus, the present results not only provide insights into the intracellular trafficking pathways that occur in epithelial cell monolayers, but also highlight the importance of 3D imaging technologies that can capture complex and rapid single-molecule dynamics.
Materials and Methods
Regents and antibodies
Biotinylated holo-transferrin, unlabeled holo-transferrin, Apolipoprotein A-I, rat tail collagen-I, and laminin were purchased from Sigma (St. Louis, MO). Paraformaldehyde was purchased from Electron Microscopy Sciences (Hatfield, PA). Mouse anti-ZO-1 antibody (#33-9100; 1:150 dilution), mouse anti-occludin antibody (#33-1500; 1:75 dilution), Qdot655 streptavidin conjugate, Alexa Fluor-labeled proteins (cholera toxin B and holo-Tf), and all secondary antibody conjugates (1:750-fold dilution) were purchased from Invitrogen (Carlsbad, CA). Clathrin heavy chain antibody (#AB2731; 1:1000 dilution) was purchased from Abcam (Cambridge, MA).
Cell culture
The rodent choroid plexus epithelial cell line Z310 (23) was generously provided by Dr. Wei Zheng (Purdue University, West Lafayette, IN) and was maintained as described previously (23). For imaging studies, phenol-red free DMEM was used and the glass coverslips were coated with either rat tail collagen I or laminin.
Transcytosis assay
Z310 cells were plated on Costar filter inserts (Corning, Corning, NY) and cultured as described previously (23). The inserts were prepulsed with 10 μM holo-Tf or medium only at the input side and incubated at 37°C for 45 min. Biotinylated Tf (bTf) was then added to the input side such that the final concentration of bTf was 0.1 μM and the filters were incubated at 37°C for 90 min. At the end of 90 min, the amount of Tf in the medium at the output side was assessed using ELISA.
Reverse transcriptase-polymerase chain reaction (RT-PCR)
Total RNA was isolated from Z310 cells using RNA-Bee (Tel-test) and standard methods. Purified RNA was reverse transcribed with AMV reverse transcriptase (Promega, Madison, WI) and oligo-dT primers. The various forward and reverse primers used for cDNA synthesis are as follows: rTfRI forward 5′-AGCAGAGGTGGCCGGTCAGTTCAT-3′, rTfRI reverse 5′-AAACTCATTGTCAATATTCCAAATGTC-3′; rMegalin forward 5′-AGGTCGGGGGCTGATGTGAACATGGAC-3″, rMegalin reverse 5′-TACGTCGGAATCTTCTTTAACGAGATT-3′; rCubilin forward-5′-GGCCGTGTTTGATGGCCCGA-3′; rCubilin reverse 5′-CCTGGGGCCACGCGAATGTT-3′; rβ2m forward 5′-ATGGCTCGCTCGGTGACCGTGATCTTT-3′, rβ2m reverse 5′- TTACATGTCTCGGTCCCAGGTGACGGT-3′. PCRs were run for 30 cycles under standard conditions and the PCR products were analyzed on 1% agarose gels.
Tf uptake and recycling experiments
Z310 cells were grown either sparsely or to full confluence in 24-well plates. The cells were pulsed with fluorescently labeled holo-transferrin (0.1 μM) for 30 min and chased for different time points in the presence of unlabeled holo-Tf. In some wells, before the Tf pulse the cells were incubated with either unlabeled holo-Tf (1 μM) or Apolipoprotein A-I (1 μM) for 30 min. At the end of the indicated chase time periods, the cells were washed twice with ice-cold phosphate buffered saline (PBS) containing 0.1% sodium azide. Cells were then removed from the wells by trypsinization, washed with medium followed by ice-cold PBS, and analyzed by flow cytometry using LSRII or FACScalibur (Becton Dickinson, Franklin Lakes, NJ).
An analogous protocol was used for the Tf-QD recycling experiments. Z310 cells were grown on glass coverslips and were surface labeled on ice with either Tf-QD as described below (see Sample preparation section) or with Tf-Alexa 488 (0.1 μM) for 10 min. The cells were washed with ice-cold PBS and then incubated with prewarmed medium for the indicated times to allow for internalization and recycling of Tf. The cells were then harvested and analyzed by flow cytometry using LSRII (Becton Dickinson).
Immunofluorescence microscopy
Z310 cells were grown to confluence on glass coverslips and fixed with 1.7% paraformaldehyde and permeablized with 0.02% saponin, each for 10 min at room temperature. The cells were preblocked with 4% bovine serum albumin, stained with primary antibodies, blocked with goat serum, and finally counter-stained with secondary antibody conjugates. Each incubation step was for 25 min at room temperature. The cells were imaged using a Zeiss Axiovert 200M widefield epifluorescence microscope with filter sets (Chroma Technologies, Battlebro, VT) that are specific for eGFP/Alexa488 (filter set #41017) and Alexa555 (filter set #41002b).
Z-stack imaging
A z-stack experiment was carried out with QDs adsorbed on a glass coverslip to evaluate the 4-plane MUM setup. The objective was moved in steps of 0.5 microns using a piezo nanopositioner (PI-USA, Auburn, MA) and at each piezo position 20 images of the QD sample were simultaneously acquired in the four distinct focal planes.
Sample preparation
Z310 cells were plated on #1.5 high performance Zeiss coverslips that were coated with either rat tail-collagen I or laminin. The cells were grown to confluence in phenol-red free DMEM containing 4% FCS. Before imaging, the medium was changed to phenol-red free DMEM containing no serum. The cells were cooled on ice, pulsed with medium containing 0.5 μg/ml cholera toxin B Alexa488 conjugate and 1.25–2.5 nM biotinylated human holo-Tf for 10 min on ice, washed in ice-cold serum free DMEM and then pulsed with 0.25–0.5 nM QD655 streptavidin conjugate (dialyzed to remove sodium azide) for 10 min on ice. The cells were washed in ice-cold serum free DMEM, prewarmed serum free DMEM was then added, and MUM imaging was immediately started. During imaging, the cell sample was maintained at 37°C by using an objective warmer (Bioptechs, Butler, PA) and a dish warmer (stable-z system; Bioptechs). Each dish was imaged for 20 min.
Multifocal plane microscopy
Imaging experiments were carried out on a Zeiss Axiovert 200 microscope setup that was configured to simultaneously image four distinct focal planes (13–15). This was achieved by placing the cameras at specific, calibrated distances from the tube lens. The exposure time was set to 75 msec and the images were acquired at a frame rate of 10 frames/s. Acquired data were processed and analyzed using the software package MIATool (24) as described previously (13,15). The events were manually identified and independently verified by two different observers.
Two different MUM imaging configurations were used to acquire the data (Fig. 1 A). In the first configuration, the images were acquired with a 63× 1.4 NA Zeiss Plan apochromat objective lens and the light from the cell sample was split among four identical charge-coupled device cameras (iXon DU897-BV; Andor Technologies, South Windsor, CT). In this configuration, the spacing d12, d23, and d34 (see Fig. 1 A) between the focal planes is 1.3, 1.6, and 1.55 microns, respectively. In the second configuration, the images were acquired with a 40× 1.4 NA Zeiss plan apochromat objective lens. The collected light was split among two OCRA-ER cameras (Hamamatsu, Bridgewater, NJ) and two Andor cameras (iXon DU897-DV). The spacing d12, d23, and d34 between the focal planes are 2.18, 2.4, and 2 microns, respectively.
Figure 1.
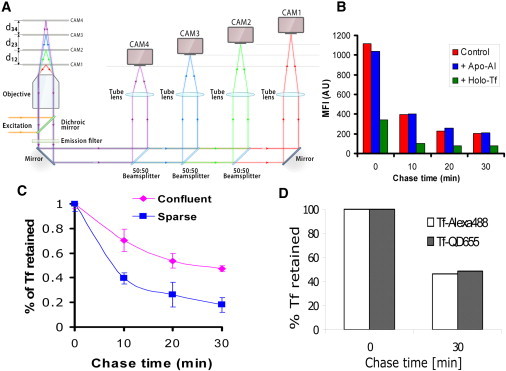
Tf uptake and recycling in Z310 cells. (A) The schematic shows the principle and layout of MUM. The sample is illuminated by either the 488 nm laser line or the 635 nm laser line by reflecting light off a dichroic mirror. The fluorescence signal from the sample is passed through a dual emission filter and then split equally into four light paths using 50:50 beam splitters. In each light path, the fluorescence signal is focused onto an imaging detector positioned at a specific calibrated distance from the tube lens. This allows for the simultaneous imaging of multiple focal planes, which in turn facilitates fast 3D visualization and 3D tracking of cellular events in live-cells. (B) TfR-dependent Tf recycling: The panel shows the background adjusted mean fluorescence intensity of Z310 cells pulsed with 0.1 μM fluorescently labeled Tf and pretreated with or without Holo Tf (1 μM) or Apo AI (1 μM) and chased for different times. The results are representative of three independent experiments. (C) Effect of Z310 cell confluence on Tf recycling. The panel shows the fraction of Tf retained as a function of the chase time in Z310 cells that were either sparsely distributed or were confluent. The results are representative of three independent experiments. (D) Results of a pulse-chase experiment carried out in Z310 cells with Tf-QD molecules and Alexa488-labeled Tf (Tf-Alexa488) molecules. The figure shows that the extent of Tf retained in cells at the end of two different chase times for Tf-QD and Tf-Alexa488 are similar. The results are representative of three independent experiments.
In both configurations, the bottom plane (i.e., the plane corresponding to cam 1 in Fig. 1 A) was positioned ∼2–2.5 microns above the coverslip. The QDs were excited by a 635 nm diode laser (OptoEngine LLC, Midvale, UT) and the Alexa Fluor 488 was excited by either a 488 nm Ar ion multiline laser (Laser Physics, Salt Lake City, UT) or by a 488 nm diode laser (Blue Sky Research, Milpitas, CA). The QD signal was continuously captured in a time-lapse manner in all four cameras. The Alexa Fluor 488 signal was captured once every 25 or 50 frames. To minimize photobleaching and phototoxicity, the 488 nm laser line was turned off while imaging the QDs. Similarly, the 635 nm laser line was turned off while imaging Alexa Fluor 488. Laser illumination to the sample was controlled through external shutters that were placed in front of each laser unit. The synchronization of the different shutters and cameras, and image capture were controlled using custom written software in the C programming language.
MUMLA
Previously, we developed the MUM localization algorithm (MUMLA) for 3D single molecule tracking with a two plane MUM setup (15). Here, we extend MUMLA to support 3D single molecule tracking in a four plane MUM setup. We first select a pair of focal plane images that contains the brightest signal from the QD. A small region of interest containing the QD image is then selected from these images and is fit to a pair of 3D point spread function profiles given by
where θ = z0 denotes the z-location of the QD, (x01,y01) and (x02,y02) denote the center of the QD image in the two regions of interest (ROIs), Ck and Cl denote the kth and lth pixel in the 1st and 2nd ROIs, respectively, k,l = 1,…,N, where N denotes the total number of pixels in the ROI, α = 2 π na/λ, na denotes the numerical aperture of the objective lens, λ denotes the wavelength of the detected photons, M1 and M2 denote the magnification at the two focal planes, A denotes the photon detection rate, t denotes the exposure time, c is a constant that is set to 1, δzf denotes the spacing between the two focal planes, and W denotes the phase aberration term. Here, we set the phase aberration term to be
where noil and toil denote the refractive index and thickness of the immersion oil, respectively, ng and tg denote the refractive index and thickness of the glass coverslip, respectively, ns denotes the refractive index of the sample, zf denotes the camera spacing in the image space, and variables with d in their subscript denote the design values. We note that the above phase aberration term corresponds to the Gibson-Lanni model (25) of the 3D point spread function profile.
In some data sets due to a weak signal in one or more planes, MUMLA was carried out on a summed image pair (Sk, Dk), where for a given time point tk, Sk (and similarly Dk) is created by adding images acquired at time points k-2, k-1, k, and k + 1 for that particular focal plane. The curve fitting was carried out using the maximum likelihood estimation algorithm as described previously (15). All computations were carried out in MATLAB (The MathWorks, Natick, MA) programming language. For display purposes, the 3D trajectory is color-coded to indicate time and is overlaid with the cell boundaries that are imaged at the four focal planes. The cell boundaries are generated by manually segmenting the plasma membrane images in the different focal planes that are captured at the start of the event of interest.
Results
In vitro model of the BCSFB
The primary focus of this study is to investigate the 3D intracellular TfR pathways at the single-molecule level in an epithelial cell monolayer. For this purpose, we have established an in vitro model of the BCSFB by using the choroid plexus epithelial cell line Z310 (23). When grown to confluence on glass coverslips, Z310 cells exhibit a polarized phenotype with appropriate localization of the tight junction proteins ZO-1 and Occludin (Fig. S1 A in the Supporting Material). Z310 cells are known to express the TfR (26). The expression of cubulin, which has been shown in some epithelial cells to lead to the lysosomal degradation of Tf (27), was also assessed. The uptake and recycling of fluorescently labeled Tf (Tf-Alexa488) was specifically inhibited by excess unlabeled Tf, but not by the cubulin ligand, Apolipoprotein A-I, which inhibits cubilin-mediated Tf uptake (27) (Fig. 1 B). RT-PCR experiments also demonstrated that Z310 cells have transcripts for TfR but not for cubilin (Fig. S1 B). These results indicate that TfR is the primary receptor for Tf in these cells. Transport assays carried out on filter-grown Z310 cell monolayers show TfR-dependent bidirectional transcytosis of Tf (Fig. S1 C), consistent with prior in vivo studies on Tf transport at the BCSFB (28,29).
To image the 3D intracellular trafficking pathways of Tf bound to TfR in our model system, QD-labeled Tf has been used throughout the studies. To minimize the presence of multivalent (biotimylated) Tf bound to streptavidin-coated QDs that might perturb the Tf trafficking pathway, a two-step procedure to label Tf molecules with QD on the cell surface was developed (see Materials and Methods). The cells were incubated with a low concentration (1.25–2.5 nM) of biotinylated Tf on ice, washed, and then incubated with a four- to fivefold lower concentration of QDs on ice. Of importance, the resulting sparse distribution of Tf on the cell surface combined with the low labeling ratio of QD/Tf resulted in QD-labeled Tf that recycles at the same rate as Alexa 488-labeled Tf (Fig. 1 D).
Multifocal plane microscopy
We have introduced an imaging configuration that allows for fast, multicolor excitation and the simultaneous imaging at four distinct focal planes (see Methods). Fig. 1 A shows the principle of MUM, where the fluorescence collected from the sample is split into different light paths, and each path contains a detector that is positioned at a specific calibrated distance from the tube lens. This enables the simultaneous imaging of multiple focal planes within a sample. To demonstrate that this MUM setup can indeed image single QDs over significant depths, z-stack experiments showed QD detection up to a depth of 10 μm (Fig. S2). To ensure that the QD movement is continuously monitored when it traverses an imaging depth of 10 μm, the spacings between the focal planes were optimized such that QDs were always visible in one or more planes when they move across the different focal planes (see Movie S1).
To obtain 3D trajectories of the QDs, the MUM localization algorithm MUMLA (15) was modified to enable 3D localization and tracking across these extended depths (Fig. S3). For the specific imaging conditions considered in Fig. S3 A, the z-localization accuracy of MUMLA is in the range of 25–40 nm for the entire tracking depth (Fig. S3 B). The performance of MUMLA, and in general the limit of the z-localization accuracy for MUM depends on several factors such as the expected number of detected photons, magnification, pixel size, numerical aperture of the objective lens, etc. (15,30). Of importance, the limit of the z-localization accuracy can be improved by collecting more photons from the point source (15,30).
Intercellular transfer of Tf-QD molecules between adjacent cells
Using MUM we have tracked the 3D dynamics of Tf-QD molecules across different depths in a live-cell monolayer. A total of 224 cell data sets were analyzed for this study. We have discovered a cellular process of intercellular transfer (n = 28 events), in which exocytosis of a Tf-QD molecule from one cell (donor) is followed by endocytosis of the same Tf-QD molecule by the adjacent cell (recipient) in the monolayer (Fig. 2, Movie S2). The Tf-QD molecules can travel a significant distance, i.e., up to depths of 2–6 μm (n = 13 events), in the recipient cell in a highly directional manner. A distinguishing feature of intercellular transfer is that the Tf-QD molecule has a very short residence time (<1s) on the plasma membrane before being internalized into the recipient cell (see Table S1). Interestingly, clathrin staining of the cell monolayer led to the frequent observation of paired clathrin spots on apposed cells (Fig. 3). Combined with the knowledge that clathrin can be involved in both endo- and exocytosis (31,32) and the significant colocalization between clathrin and Tf in Z310 cell monolayers (Fig. S4 A), this suggests that these are sites for intercellular transfer.
Figure 2.

Intercellular transfer of Tf molecules in Z310 cell monolayer. Panel A shows the overlay of the segmented plasma membrane channel (green) and the Tf-QD channel (gray scale) that was acquired from a live-cell monolayer using a 4-plane MUM setup. Each image in the montage corresponds to a distinct focal plane within the Z310 monolayer. The Tf-QD molecule of interest (red arrow) is pseudocolored in blue for visualization. Scale bar = 5 μm. Panels B and C show the X-Y projection and the full 3D trajectory, respectively, of the Tf-QD molecule highlighted in A. The trajectories are color-coded to indicate time. The Tf QD molecule is initially seen inside one cell (donor). The molecule then moves toward the lateral plasma membrane and undergoes exocytosis. The molecule is then immediately endocytosed by the adjacent cell (recipient) in the monolayer. The internalization occurs through the sliding mode of endocytosis in the recipient, which is consistent with the long-range intracellular transport observed for this molecule (see Movie S2).
Figure 3.

Clathrin distribution in a Z310 cell monolayer. The figure shows the image of a Z310 cell monolayer that was labeled with Cholera Toxin B (green) and stained with an antibody against clathrin heavy chain (red). The boxed region (yellow box) in the overlay image shows a single cell in the monolayer. Numerous clathrin-coated structures (white and blue arrows) can be seen to be budding out from the plasma membrane. In some cases, we see paired clathrin spots (blue arrows), i.e., structures that are on the apposing plasma membranes of adjacent cells and face each other. Scale bar = 5 μm.
Role of intercellular transfer in Tf transport
We hypothesized that intercellular transfer is a mechanism to retain cargo within the monolayer. Because cell-cell contact is implicitly required for intercellular transfer, we investigated whether this process could affect the transport properties of a cell-monolayer by examining the retention of Tf in Z310 cells at different levels of confluence. We found that as the confluence increases from sparsely distributed cells to a tight monolayer, the cell-associated levels of Tf increase (Fig. 1 D). In a confluent monolayer, the presence of cell-cell contacts would favor intercellular transfer. Hence, Tf molecules are retained in cells in the monolayer for longer periods of time than in sparsely distributed cells, where the absence of cell-cell contacts allows faster release of Tf from the cells.
Tf exo/endocytosis with long plasma membrane residence time
By contrast with the endocytic events seen in intercellular transfer in which Tf-QD molecules exhibit brief plasma membrane residence following an exocytic event, we also observe endocytosis (Fig. 4, Movie S3 and Movie S4) where before internalization Tf-QD molecules are on the lateral plasma membrane for extended periods of time (∼6–20 s; n = 47 events; see Table S1). In none of these events did exocytosis of the Tf-QD molecule from the adjacent cell occur before its long plasma membrane residence over the duration of imaging. In Fig. 4, the Tf-QD molecule moves randomly on the lateral plasma membrane that is characteristic of receptor-bound cargo on the cell membrane (15). After endocytosis the Tf-QD molecule moves in a highly directional manner toward the cell interior.
Figure 4.

Different modes of endocytosis from the lateral plasma membrane. Panels A and D show the overlay of the segmented plasma membrane channel (green) and the Tf-QD channel (gray scale) that was acquired from a live-cell monolayer using a 4-plane MUM setup. Each image corresponds to a distinct focal plane within the Z310 monolayer. The Tf-QD molecule of interest (red arrow) is pseudocolored in blue for visualization. Panels B and C (panels E and F) show the X-Y projection and the full 3D trajectory, respectively, of the Tf-QD molecule highlighted in A (D). Panels A–C shows the results for the orthogonal mode of endocytosis. Here, the Tf-QD molecule (red arrow) is initially seen to be randomly diffusing along the lateral plasma membrane and the internalization step is characterized by QD movement that is perpendicular to the lateral plasma membrane (see panel B). Panels D–F shows the results for the sliding mode of endocytosis. Here also, the molecule is initially seen to be on the plasma membrane but exhibits limited movement. The internalization step is characterized by long-range movement in close proximity to the plasma membrane (see panel E). Panels A and D are individual frames taken from Movies S3 and S4, respectively. Scale bar = 5 μm. The trajectories in panels, B, C, E, and F are color-coded to indicate time.
We also imaged exocytic events (n = 10 events) where the Tf-QD molecule persists on the lateral plasma membrane after exocytosis that are not followed by (i.e., within 1 s) endocytosis in an adjacent cell (Fig. S5, Movie S5, see Table S1). Here, the Tf-QD molecule traffics from the cell interior in a highly directional manner and merges with the lateral plasma membrane. In relatively rare events (2 out of 10 events), exocytosis of a Tf-QD molecule, which is then reendocytosed in the same cell within 1 s was also detected (Fig. S6, Movie S6).
3D dynamics of Tf-QD molecules along the exo/endocytic pathway
Tf-QD molecules on the exo/endocytic pathway exhibit distinct intracellular 3D trajectories, allowing endo- and exocytosis to be classified into orthogonal and sliding modes. In the orthogonal endocytic mode (n = 40 events), the Tf-QD molecule moves perpendicular to the plasma membrane after internalization (Fig. 4, A–C, and Movie S3). In many cases (16 out of 40 events), the Tf-QD molecule rapidly traffics toward an intracellular structure that contains numerous Tf-QD molecules (Movie S3). This structure is presumably an endosomal compartment.
In the sliding endocytic mode (n = 35 events), the Tf-QD molecule moves parallel to and in close proximity to the plasma membrane in a highly directional manner after internalization (Fig. 4, D–F, Movie S4). In addition to trafficking to an endosomal compartment (10 events), some of the Tf molecules undergoing sliding endocytosis exhibit long-range motion across the depth of the monolayer (8 events, Movie S4). In the latter case, the final destination of the Tf-QD molecules could not be ascertained as they did not merge with any Tf-QD+ structure inside the cell. These Tf-QD molecules displayed uninterrupted movement and departed from the effective viewing depth of the MUM setup, indicating that these molecules are on the transcytotic pathway.
Analogous to endocytosis, we observe orthogonal and sliding modes in the exocytic pathway (Fig. S5 and Fig. S6), where the Tf-QD molecule moves from the cell-interior and then either merges with the lateral plasma membrane or moves parallel to and in close proximity to the lateral plasma membrane before merging with it. Of 38 exocytosis events analyzed, 16 events are of the sliding type and 22 are of the orthogonal type.
Discussion
Intracellular trafficking pathways are known to play an important role in regulating macromolecular transport. However, to date, efforts to understand these pathways have been limited due to the lack of cellular imaging approaches that enable rapid 3D imaging of these processes. Here, we have implemented a MUM configuration that enables the 3D tracking of single Tf-QD molecules in a 10 μm thick live epithelial cell monolayer. This in turn has allowed us to delineate different spatiotemporal dynamics of cellular events, which is not possible through ensemble measurements.
The results presented here emphasize the importance of using single-molecule approaches to investigate cellular dynamics, especially in thick cellular samples. Imaging approaches that study cellular events in bulk suffer from averaging effects and therefore cannot probe the heterogeneous nature of trafficking processes. Moreover, the 3D visualization and tracking of some processes such as protein transport across significant depths may be problematic due to the presence of a large amount of fluorescent signal in the cell sample, which typically overwhelms the signal from the event of interest. Single-molecule approaches, on the other hand, offer the selectivity and sensitivity to visualize fast cellular dynamics in 3D. In the current study, the implementation of MUM to analyze single molecule behavior in thick cell samples has enabled the identification of cellular processes such as intercellular transfer. Furthermore, we have analyzed the heterogeneity of the endocytic/exocytic pathways at the lateral plasma membrane. This approach has also allowed the 3D imaging of events along the transcytotic pathway, which has to date been limited to electron microscopy techniques (32) that lack dynamic information on cellular processes.
The development of 3D single molecule tracking techniques has primarily focused on the accurate 3D localization of single molecules (9–12). Although this is critical for conferring 3D tracking capability, these approaches have overlooked other considerations that are important for 3D tracking within a cellular context. Classical z-stack imaging approaches (33) that sequentially image one focal plane at a time are relatively slow and are therefore unsuitable for the analysis of fast 3D cellular events such as intercellular transfer. Confocal/two-photon techniques (10,12) that track particles by scanning a focused spot can cover a depth of 10 μm, but cannot reliably track the particle of interest if it gets close to other particles, which frequently occurs in a cellular environment as seen here. Moreover, these techniques do not image the cellular environment, which we have shown to be important for identifying cellular events such as endocytosis/exocytosis. Techniques that make use of depth encoding schemes (9,11) have tracking depths of 2–4 μm and significantly altered point spread function profiles. These limitations make the visualization of the cellular environment a challenge even if substantial postprocessing of the data is carried out. The MUM setup reported here therefore represents a major advance in 3D cellular imaging and 3D single molecule tracking technology that overcomes these limitations.
The use of QDs, which are bright and photostable fluorescent labels, has been essential in our studies, as it has enabled the visualization of the trajectories of single Tf molecules for extended periods of time (∼ minutes). This would not be possible with single fluorescent proteins/dyes, because they not only photobleach within a few seconds, but are also significantly less bright than QDs. Consequently, the detection of these fluorescent proteins and dyes is problematic, and this is exacerbated in thick cellular samples. Moreover, estimating the 3D position of these labels becomes a major challenge, as the limit of the 3D localization accuracy for MUM exhibits inverse square root dependence on the expected number of detected photons (15,30). In our experiments, some of the images detected less photon from the QDs due to the blinking behavior of these labels. However, QD blinking was relatively infrequent especially when the QD was inside the cell. As a result, this did not significantly affect the ability to detect or track in 3D the cellular events studied here.
Our observations of the rapid transit of Tf molecules across adjacent lateral plasma membranes during intercellular transfer and the subsequent long-range transport in the recipient cell highlights the spatio-temporal complexity of cellular events in an epithelial cell monolayer. An important question arises as to what are the functions of intercellular transfer? Protein trafficking has classically been modeled at epithelial cell barriers in terms of three fundamental processes (3,4), i.e., internalized cargo such as Tf is either recycled (Fig. 1 B), transcytosed (Fig. S1), or degraded. Through intercellular transfer, Tf molecules endocytosed by the recipient cell would be treated as nascent cargo, allowing them to persist in that cell until they are recycled or transcytosed. Therefore, we propose intercellular transfer to be another cellular process, which could play an important role in regulating protein transport in polarized epithelia by facilitating the gradual release of receptor-bound cargo from cells.
Intercellular transfer might also play a role in transcellular transport. It has been reported that only a small fraction of the choroid-plexus epithelial cells, which form the BCSFB, are active in transporting cargo across the barrier (34). Thus, intercellular transfer might also be a sampling mechanism to identify the cellular environment that is permissive for transcytosis, consistent with our observation of long-range transport of Tf-QD molecules in the recipient cell (Fig. 2).
Are the Tf molecules that undergo intercellular transfer iron-loaded (holo) or iron-free (apo), and why does the exchange of Tf molecules occur rapidly? If Tf is of the apo form, the recipient would then have to rely on fluid-phase endocytosis to mediate the rapid uptake of Tf, which is unlikely given the poor pinocytic activity exhibited by the choroid plexus epithelial cells (16) (see also Fig. S4 B). It has been reported that these epithelial cells are capable of releasing iron-loaded Tf (29), suggesting that the Tf molecule undergoing intercellular transfer is likely to be of the holo form. The fast transfer of Tf molecules during intercellular transfer would also be consistent with this concept; as such transfer minimizes the exposure of Tf to the extracellular space containing numerous free, competing holo-Tf molecules. This also lends support for the suggestion that intercellular transfer occurs at the site of paired clathrin spots on the lateral plasma membranes of apposed cells (Fig. 3). These structures could act as a conduit to assist in receptor-mediated endocytosis of Tf in the recipient cell, which would be consistent with prior observations demonstrating a requirement for clathrin in internalizing cell surface receptors from the plasma membrane of an adjacent, contacting cell (35,36).
Recent studies have revealed novel mechanisms of cell-cell communication involving tunneling nanotubes (37,38) and exosomes (39). These processes mediate long-range transport between cells that are not in contact with one another and are relatively slow (∼102–103 s). In addition, the transfer of plasma membrane receptors between adjacent, contacting cells has been reported, for example, in leukocytes (40) and in tumor cells (36,41,42). The intercellular transfer that we observe is spatially and temporally distinct from these processes, because it occurs over a very fast time scale (t < 1 s) and involves rapid exchange of internalized cargo between adjacent cells in a polarized cell monolayer.
The use of total internal reflection fluorescence microscopy has afforded excellent sensitivity to study endo/exocytic dynamics near the plasma membrane proximal to the coverslip (43,44) even at the single molecule level (45,46). However, the shallow excitation of total internal reflection fluorescence microscopy precludes the imaging of events that occur distal to the coverslip (>200 nm) and deep inside the cell. Thus, not surprisingly, 3D imaging of endocytosis (exocytosis) at the lateral plasma membrane, which extends several microns above the coverslip in polarized epithelia, has remained elusive. The use of MUM has enabled us to carry out a detailed characterization of exo/endocytosis at the lateral plasma membrane, based on plasma membrane residence time and intracellular trajectories.
Prior studies have shown that the early sorting and trafficking of different cell-surface receptors is predetermined at the endocytosis step (47), possibly due to the diversity of the endocytic adaptor proteins that can associate with these receptors (48). Our observation of the distinct intracellular itineraries in orthogonal and sliding endocytic modes shows that differential trafficking can in fact occur for the same receptor, indicating the existence of unique sorting mechanisms at the lateral plasma membrane. The Tf-QD dynamics that we have imaged on the lateral plasma membrane before endocytosis, which range from extensive motion across multiple focal planes (Fig. 4, D–F), to restricted movement (Fig. 4, A–C), are consistent with the presence of free and confined regions at the intercellular spaces of polarized epithelial cells. Taken together, these results demonstrate that 3D endo/exocytic dynamics at the lateral plasma membrane is both spatially and temporally heterogeneous.
The fast internalization of Tf molecules (t < 1 s) that we observe in our intercellular transfer and endocytic events is consistent with other studies that have investigated endocytic dynamics at the single-molecule level in live cells (12,15). By contrast, time constants in the range of 20–40 s for clathrin mediated endocytosis have been reported (49,50). However, it is important to note that in our experiments, we image the clathrin cargo (i.e., Tf-TfR complex) as opposed to clathrin. Clathrin structures on the plasma membrane can be dynamic and mobile indicating that a Tf-TfR complex could therefore become associated with a clathrin structure and continue to diffuse on the plasma membrane while the clathrin-coated pit continues to grow. The apparent discrepancy in internalization rates also underscores the importance of using single-molecule techniques to provide new insights into cellular processes that are inaccessible through other approaches.
In conclusion, we have discovered a cellular process of intercellular transfer in a live epithelial cell monolayer involving rapid exchange of Tf molecules between two adjacent cells. We have also carried out a detailed analysis of Tf endo/exocytosis at the lateral plasma membrane. Central to all of our studies is the use of the 3D imaging modality, MUM, which enables fast 3D single molecule tracking in a 10 micron thick cell monolayer. The current results provide much needed insight into the 3D intracellular trafficking mechanisms of polarized epithelia. Furthermore, these results underscore the importance of developing imaging technologies to support the 3D visualization of rapid cellular events at the single-molecule level.
Acknowledgments
We thank Taiyoon Lee for help with data analysis.
This research was supported in part by the National Institutes of Health (R01 GM085575 and R01 AI039167) and a postdoctoral fellowship to S.R. from the National Multiple Sclerosis Society (FG-1798-A-1).
Contributor Information
Raimund J. Ober, Email: ober@utdallas.edu.
E. Sally Ward, Email: sally.ward@utsouthwestern.edu.
Supporting Material
References
- 1.Futerman A.H., van Meer G. The cell biology of lysosomal storage disorders. Nat. Rev. Mol. Cell Biol. 2004;5:554–565. doi: 10.1038/nrm1423. [DOI] [PubMed] [Google Scholar]
- 2.Rubinsztein D.C. The roles of intracellular protein-degradation pathways in neurodegeneration. Nature. 2006;443:780–786. doi: 10.1038/nature05291. [DOI] [PubMed] [Google Scholar]
- 3.Rodriguez-Boulan E., Kreitzer G., Müsch A. Organization of vesicular trafficking in epithelia. Nat. Rev. Mol. Cell Biol. 2005;6:233–247. doi: 10.1038/nrm1593. [DOI] [PubMed] [Google Scholar]
- 4.Rojas R., Apodaca G. Immunoglobulin transport across polarized epithelial cells. Nat. Rev. Mol. Cell Biol. 2002;3:944–955. doi: 10.1038/nrm972. [DOI] [PubMed] [Google Scholar]
- 5.Hua W., Sheff D., Mellman I. Vectorial insertion of apical and basolateral membrane proteins in polarized epithelial cells revealed by quantitative 3D live cell imaging. J. Cell Biol. 2006;172:1035–1044. doi: 10.1083/jcb.200512012. [DOI] [PMC free article] [PubMed] [Google Scholar]
- 6.Kreitzer G., Schmoranzer J., Rodriguez-Boulan E. Three-dimensional analysis of post-Golgi carrier exocytosis in epithelial cells. Nat. Cell Biol. 2003;5:126–136. doi: 10.1038/ncb917. [DOI] [PubMed] [Google Scholar]
- 7.Paladino S., Pocard T., Zurzolo C. GPI-anchored proteins are directly targeted to the apical surface in fully polarized MDCK cells. J. Cell Biol. 2006;172:1023–1034. doi: 10.1083/jcb.200507116. [DOI] [PMC free article] [PubMed] [Google Scholar]
- 8.Schuck S., Simons K. Controversy fuels trafficking of GPI-anchored proteins. J. Cell Biol. 2006;172:963–965. doi: 10.1083/jcb.200603015. [DOI] [PMC free article] [PubMed] [Google Scholar]
- 9.Holtzer L., Meckel T., Schmidt T. Nanometric 3D tracking of individual quantum dots in cells. Appl. Phys. Lett. 2007;90:053902-1–053902-3. [Google Scholar]
- 10.Levi V., Ruan Q., Gratton E. 3-D particle tracking in a two-photon microscope: application to the study of molecular dynamics in cells. Biophys. J. 2005;88:2919–2928. doi: 10.1529/biophysj.104.044230. [DOI] [PMC free article] [PubMed] [Google Scholar]
- 11.Thompson M.A., Casolari J.M., Moerner W.E. Three-dimensional tracking of single mRNA particles in Saccharomyces cerevisiae using a double-helix point spread function. Proc. Natl. Acad. Sci. USA. 2010;107:17864–17871. doi: 10.1073/pnas.1012868107. [DOI] [PMC free article] [PubMed] [Google Scholar]
- 12.Wells N.P., Lessard G.A., Werner J.H. Time-resolved three-dimensional molecular tracking in live cells. Nano Lett. 2010;10:4732–4737. doi: 10.1021/nl103247v. [DOI] [PMC free article] [PubMed] [Google Scholar]
- 13.Prabhat P., Gan Z., Ward E.S. Elucidation of intracellular recycling pathways leading to exocytosis of the Fc receptor, FcRn, by using multifocal plane microscopy. Proc. Natl. Acad. Sci. USA. 2007;104:5889–5894. doi: 10.1073/pnas.0700337104. [DOI] [PMC free article] [PubMed] [Google Scholar]
- 14.Prabhat P., Ram S., Ober R.J. Simultaneous imaging of different focal planes in fluorescence microscopy for the study of cellular dynamics in three dimensions. IEEE Trans. Nanobioscience. 2004;3:237–242. doi: 10.1109/tnb.2004.837899. [DOI] [PMC free article] [PubMed] [Google Scholar]
- 15.Ram S., Prabhat P., Ober R.J. High accuracy 3D quantum dot tracking with multifocal plane microscopy for the study of fast intracellular dynamics in live cells. Biophys. J. 2008;95:6025–6043. doi: 10.1529/biophysj.108.140392. [DOI] [PMC free article] [PubMed] [Google Scholar]
- 16.Abbott N.J., Patabendige A.A., Begley D.J. Structure and function of the blood-brain barrier. Neurobiol. Dis. 2010;37:13–25. doi: 10.1016/j.nbd.2009.07.030. [DOI] [PubMed] [Google Scholar]
- 17.Giannetti A.M., Halbrooks P.J., Björkman P.J. The molecular mechanism for receptor-stimulated iron release from the plasma iron transport protein transferrin. Structure. 2005;13:1613–1623. doi: 10.1016/j.str.2005.07.016. [DOI] [PubMed] [Google Scholar]
- 18.Li L., Fang C.J., Seaman W.E. Binding and uptake of H-ferritin are mediated by human transferrin receptor-1. Proc. Natl. Acad. Sci. USA. 2010;107:3505–3510. doi: 10.1073/pnas.0913192107. [DOI] [PMC free article] [PubMed] [Google Scholar]
- 19.Shin S.U., Friden P., Morrison S.L. Transferrin-antibody fusion proteins are effective in brain targeting. Proc. Natl. Acad. Sci. USA. 1995;92:2820–2824. doi: 10.1073/pnas.92.7.2820. [DOI] [PMC free article] [PubMed] [Google Scholar]
- 20.Yu Y.J., Zhang Y., Dennis M.S. Boosting brain uptake of a therapeutic antibody by reducing its affinity for a transcytosis target. Sci. Transl. Med. 2011;3:84ra44. doi: 10.1126/scitranslmed.3002230. [DOI] [PubMed] [Google Scholar]
- 21.Adamo A.M., Paez P.M., Soto E.F. Remyelination after cuprizone-induced demyelination in the rat is stimulated by apotransferrin. Exp. Neurol. 2006;198:519–529. doi: 10.1016/j.expneurol.2005.12.027. [DOI] [PubMed] [Google Scholar]
- 22.LeVine S.M., Maiti S., Pedchenko T.V. Apoferritin attenuates experimental allergic encephalomyelitis in SJL mice. Dev. Neurosci. 2002;24:177–183. doi: 10.1159/000065694. [DOI] [PubMed] [Google Scholar]
- 23.Zheng W., Zhao Q. Establishment and characterization of an immortalized Z310 choroidal epithelial cell line from murine choroid plexus. Brain Res. 2002;958:371–380. doi: 10.1016/s0006-8993(02)03683-1. [DOI] [PMC free article] [PubMed] [Google Scholar]
- 24.Chao J., Ward E.S., Ober R.J. A software framework for the analysis of complex microscopy image data. IEEE Trans. Inf. Technol. Biomed. 2010;14:1075–1087. doi: 10.1109/TITB.2010.2049024. [DOI] [PMC free article] [PubMed] [Google Scholar]
- 25.Gibson S.F., Lanni F. Diffraction by a circular aperture as a model for three-dimensional optical microscopy. J. Opt. Soc. Am. A. 1989;6:1357–1367. doi: 10.1364/josaa.6.001357. [DOI] [PubMed] [Google Scholar]
- 26.Li G.J., Zhao Q., Zheng W. Alteration at translational but not transcriptional level of transferrin receptor expression following manganese exposure at the blood-CSF barrier in vitro. Toxicol. Appl. Pharmacol. 2005;205:188–200. doi: 10.1016/j.taap.2004.10.003. [DOI] [PMC free article] [PubMed] [Google Scholar]
- 27.Kozyraki R., Fyfe J., Moestrup S.K. Megalin-dependent cubilin-mediated endocytosis is a major pathway for the apical uptake of transferrin in polarized epithelia. Proc. Natl. Acad. Sci. USA. 2001;98:12491–12496. doi: 10.1073/pnas.211291398. [DOI] [PMC free article] [PubMed] [Google Scholar]
- 28.Banks W.A., Kastin A.J., Augereau G. Studies of the slow bidirectional transport of iron and transferrin across the blood-brain barrier. Brain Res. Bull. 1988;21:881–885. doi: 10.1016/0361-9230(88)90021-4. [DOI] [PubMed] [Google Scholar]
- 29.Ueda F., Raja K.B., Bradbury M.W. Rate of 59Fe uptake into brain and cerebrospinal fluid and the influence thereon of antibodies against the transferrin receptor. J. Neurochem. 1993;60:106–113. doi: 10.1111/j.1471-4159.1993.tb05828.x. [DOI] [PubMed] [Google Scholar]
- 30.Ram S., Prabhat P., Ober R.J. Improved single particle localization accuracy with dual objective multifocal plane microscopy. Opt. Express. 2009;17:6881–6898. doi: 10.1364/oe.17.006881. [DOI] [PMC free article] [PubMed] [Google Scholar]
- 31.Conner S.D., Schmid S.L. Regulated portals of entry into the cell. Nature. 2003;422:37–44. doi: 10.1038/nature01451. [DOI] [PubMed] [Google Scholar]
- 32.He W., Ladinsky M.S., Björkman P.J. FcRn-mediated antibody transport across epithelial cells revealed by electron tomography. Nature. 2008;455:542–546. doi: 10.1038/nature07255. [DOI] [PMC free article] [PubMed] [Google Scholar]
- 33.Arhel N., Genovesio A., Charneau P. Quantitative four-dimensional tracking of cytoplasmic and nuclear HIV-1 complexes. Nat. Methods. 2006;3:817–824. doi: 10.1038/nmeth928. [DOI] [PubMed] [Google Scholar]
- 34.Knott G.W., Dziegielewska K.M., Saunders N.R. Albumin transfer across the choroid plexus of South American opossum (Monodelphis domestica) J. Physiol. 1997;499:179–194. doi: 10.1113/jphysiol.1997.sp021919. [DOI] [PMC free article] [PubMed] [Google Scholar]
- 35.Gumpert A.M., Varco J.S., Falk M.M. Double-membrane gap junction internalization requires the clathrin-mediated endocytic machinery. FEBS Lett. 2008;582:2887–2892. doi: 10.1016/j.febslet.2008.07.024. [DOI] [PMC free article] [PubMed] [Google Scholar]
- 36.Piehl M., Lehmann C., Falk M.M. Internalization of large double-membrane intercellular vesicles by a clathrin-dependent endocytic process. Mol. Biol. Cell. 2007;18:337–347. doi: 10.1091/mbc.E06-06-0487. [DOI] [PMC free article] [PubMed] [Google Scholar]
- 37.Chauveau A., Aucher A., Davis D.M. Membrane nanotubes facilitate long-distance interactions between natural killer cells and target cells. Proc. Natl. Acad. Sci. USA. 2010;107:5545–5550. doi: 10.1073/pnas.0910074107. [DOI] [PMC free article] [PubMed] [Google Scholar]
- 38.Gousset K., Schiff E., Zurzolo C. Prions hijack tunnelling nanotubes for intercellular spread. Nat. Cell Biol. 2009;11:328–336. doi: 10.1038/ncb1841. [DOI] [PubMed] [Google Scholar]
- 39.Al-Nedawi K., Meehan B., Rak J. Intercellular transfer of the oncogenic receptor EGFRvIII by microvesicles derived from tumour cells. Nat. Cell Biol. 2008;10:619–624. doi: 10.1038/ncb1725. [DOI] [PubMed] [Google Scholar]
- 40.Davis D.M. Intercellular transfer of cell-surface proteins is common and can affect many stages of an immune response. Nat. Rev. Immunol. 2007;7:238–243. doi: 10.1038/nri2020. [DOI] [PubMed] [Google Scholar]
- 41.Levchenko A., Mehta B.M., Larson S.M. Intercellular transfer of P-glycoprotein mediates acquired multidrug resistance in tumor cells. Proc. Natl. Acad. Sci. USA. 2005;102:1933–1938. doi: 10.1073/pnas.0401851102. [DOI] [PMC free article] [PubMed] [Google Scholar]
- 42.Pasquier J., Galas L., Le Foll F. Different modalities of intercellular membrane exchanges mediate cell-to-cell p-glycoprotein transfers in MCF-7 breast cancer cells. J. Biol. Chem. 2012;287:7374–7387. doi: 10.1074/jbc.M111.312157. [DOI] [PMC free article] [PubMed] [Google Scholar]
- 43.Holz R.W., Axelrod D. Secretory granule behaviour adjacent to the plasma membrane before and during exocytosis: total internal reflection fluorescence microscopy studies. Acta Physiol. (Oxf.) 2008;192:303–307. doi: 10.1111/j.1748-1716.2007.01818.x. [DOI] [PubMed] [Google Scholar]
- 44.Merrifield C.J., Feldman M.E., Almers W. Imaging actin and dynamin recruitment during invagination of single clathrin-coated pits. Nat. Cell Biol. 2002;4:691–698. doi: 10.1038/ncb837. [DOI] [PubMed] [Google Scholar]
- 45.Böcking T., Aguet F., Kirchhausen T. Single-molecule analysis of a molecular disassemblase reveals the mechanism of Hsc70-driven clathrin uncoating. Nat. Struct. Mol. Biol. 2011;18:295–301. doi: 10.1038/nsmb.1985. [DOI] [PMC free article] [PubMed] [Google Scholar]
- 46.Ober R.J., Martinez C., Ward E.S. Exocytosis of IgG as mediated by the receptor, FcRn: an analysis at the single-molecule level. Proc. Natl. Acad. Sci. USA. 2004;101:11076–11081. doi: 10.1073/pnas.0402970101. [DOI] [PMC free article] [PubMed] [Google Scholar]
- 47.Tosoni D., Puri C., Di Fiore P.P. TTP specifically regulates the internalization of the transferrin receptor. Cell. 2005;123:875–888. doi: 10.1016/j.cell.2005.10.021. [DOI] [PubMed] [Google Scholar]
- 48.Doherty G.J., McMahon H.T. Mechanisms of endocytosis. Annu. Rev. Biochem. 2009;78:857–902. doi: 10.1146/annurev.biochem.78.081307.110540. [DOI] [PubMed] [Google Scholar]
- 49.Ehrlich M., Boll W., Kirchhausen T. Endocytosis by random initiation and stabilization of clathrin-coated pits. Cell. 2004;118:591–605. doi: 10.1016/j.cell.2004.08.017. [DOI] [PubMed] [Google Scholar]
- 50.Loerke D., Mettlen M., Schmid S.L. Cargo and dynamin regulate clathrin-coated pit maturation. PLoS Biol. 2009;7:e57. doi: 10.1371/journal.pbio.1000057. [DOI] [PMC free article] [PubMed] [Google Scholar]
Associated Data
This section collects any data citations, data availability statements, or supplementary materials included in this article.