

Abstract
Striatal-enriched protein tyrosine phosphatase (STEP) is highly expressed in striatal projection neurons, the neuronal population most affected in Huntington's disease. Here, we examined STEP expression and phosphorylation, which regulates its activity, in N-terminal exon-1 and full-length mutant huntingtin mouse models. R6/1 mice displayed reduced STEP protein levels in the striatum and cortex, whereas its phosphorylation was increased in the striatum, cortex, and hippocampus. The early increase in striatal STEP phosphorylation levels correlated with a deregulation of the protein kinase A pathway, and decreased calcineurin activity at later stages further contributes to an enhancement of STEP phosphorylation and inactivation. Accordingly, we detected an accumulation of phosphorylated ERK2 and p38, two targets of STEP, in R6/1 mice striatum at advanced stages of the disease. Activation of STEP participates in excitotoxic-induced cell death. Because Huntington's disease mouse models develop resistance to excitotoxicity, we analyzed whether decreased STEP activity was involved in this process. After intrastriatal quinolinic acid (QUIN) injection, we detected higher phosphorylated STEP levels in R6/1 than in wild-type mice, suggesting that STEP inactivation could mediate neuroprotection in R6/1 striatum. In agreement, intrastriatal injection of TAT–STEP increased QUIN-induced cell death. R6/2, Tet/HD94, and HdhQ7/Q111 mice striatum also displayed decreased STEP protein and increased phosphorylation levels. In Tet/HD94 mice striatum, mutant huntingtin transgene shutdown reestablished STEP expression. In conclusion, the STEP pathway is severely downregulated in the presence of mutant huntingtin and may participate in compensatory mechanisms activated by striatal neurons that lead to resistance to excitotoxicity.
Introduction
Striatal-enriched protein tyrosine phosphatase (STEP), encoded by the Ptpn5 gene, is a brain-specific phosphatase involved in neuronal signal transduction. STEP is enriched in the striatum (Lombroso et al., 1991) and expressed at lower levels in the cortex, hippocampus, and amygdala (Boulanger et al., 1995). STEP mRNA is alternatively spliced into the membrane-associated STEP61 and the cytosolic STEP46 (Bult et al., 1997). Both isoforms are expressed in the striatum, whereas the hippocampus and cortex only express STEP61 (Boulanger et al., 1995).
STEP activity is regulated through phosphorylation/dephosphorylation of a serine residue within its kinase interacting motif domain. Stimulation of dopamine D1 receptors (D1Rs) activates the cAMP-dependent protein kinase A (PKA) (Stoof and Kebabian, 1981), which phosphorylates STEP46 and STEP61, thereby inactivating them (Paul et al., 2000). In contrast, glutamate stimulation of NMDA receptors (NMDARs) results in the dephosphorylation and activation of STEP through a calcineurin/PP1 pathway (Paul et al., 2003; Valjent et al., 2005). Once activated, STEP dephosphorylates the glutamate receptor subunits NR2B (Pelkey et al., 2002; Snyder et al., 2005; Braithwaite et al., 2006) and GluR2 (Zhang et al., 2008), leading to their endocytosis, and the kinases ERK1/2 (extracellular signal-regulated kinase 1/2), p38, and Fyn, thereby controlling the duration of their signal (Pulido et al., 1998; Nguyen et al., 2002; Muñoz et al., 2003; Paul et al., 2003).
Striatal projection neurons are specially affected in Huntington's disease (HD) (Reiner et al., 1988), a dominantly inherited neurodegenerative disorder caused by an abnormal expansion of a CAG codon in exon-1 of the huntingtin (htt) gene (The Huntington's Disease Collaborative Research Group, 1993). The enrichment of STEP in these neurons, together with its role in the regulation of key substrates implicated in neuronal function, suggest that STEP may play a role in the pathophysiology of HD. In fact, previous studies show decreased mRNA levels of STEP in the caudate nucleus and cortex of HD patients (Hodges et al., 2006) and in the striatum of R6 mice (Luthi-Carter et al., 2000; Desplats et al., 2006). Moreover, both dopaminergic and glutamatergic systems, which regulate STEP activity, are affected in HD patients and mouse models (Jakel and Maragos, 2000; Fan and Raymond, 2007; André et al., 2010).
Excitotoxicity has been proposed to contribute to the selective loss of striatal projection neurons in HD (for review, see Pérez-Navarro et al., 2006; Fan and Raymond, 2007). However, mouse models of HD develop resistance to excitotoxicity (Hansson et al., 1999, 2001; Jarabek et al., 2004; Torres-Peraza et al., 2008; Graham et al., 2009), and we have shown previously that reduced levels of calcineurin expression and activity could participate in this phenomenon (Xifró et al., 2009). Interestingly, disruption of STEP activity leads to the activation of ERK1/2 signaling and attenuates excitotoxic-induced cell death in the hippocampus (Choi et al., 2007). Thus, in the present study, we sought to investigate STEP protein expression and activity in several mouse models of HD and to analyze whether STEP acts downstream of calcineurin to regulate cell survival after a striatal excitotoxic lesion.
Materials and Methods
HD mouse models.
Wild-type (WT) HdhQ7/Q7 and heterozygous mutant HdhQ7/Q111 knock-in mice (C57BL/6 background) were obtained from matings between male and female HdhQ7/Q111 heterozygous mice as described previously (Wheeler et al., 1999). R6/1 and R6/2 heterozygous transgenic mice (B6CBA background) expressing exon-1 mutant huntingtin (mhtt) with 145 (Giralt et al., 2009) and 115 CAG repeats, respectively, were obtained from The Jackson Laboratory. Conditional Tet/HD94 mice (CBA× C57BL/6 background) express a chimeric mouse/human exon-1 mhtt with 94 CAG repeats under the control of the bidirectional tetO responsive promoter (Yamamoto et al., 2000). To turn off mhtt expression, 17-month-old wild-type and Tet/HD94 mice were treated with doxycycline in drinking water during 5 months (2 mg/ml for 4 months, followed by 0.5 mg/ml for 1 month; gene-OFF group) (Díaz-Hernández et al., 2005). Some animals were left without intervention (gene-ON group). All mice used in the present study were housed together in numerical birth order in groups of mixed genotypes, and data were recorded for analysis by microchip mouse number. Experiments were conducted in a blind-coded manner with respect to genotype. R6 and Tet/HD94 mice were genotyped by PCR as described previously (Mangiarini et al., 1996; Yamamoto et al., 2000). Knock-in mice were genotyped by a two-way PCR using the primer pairs Hdh Up (5′ CCT GGA AAA GCT GAT GAA GG) and Hdh Down (5′ TGG ACA GGG AAC AGT GTT GC 3′) for wild-type htt and CAG1 (5′ATG AAG GCC TTC GAG TCC CTC AAG TCC TTC 3′) and HU3 (5′ GGC GGC TGA GGA AGC TGA GGA 3′) for mhtt. The animals were housed with access to food and water ad libitum in a colony room kept at 19–22°C and 40–50% humidity, under a 12 h light/dark cycle. All animal-related procedures were in accordance with the National Institutes of Health Guide for the Care and Use of Laboratory Animals and approved by the local animal care committee of the Universitat de Barcelona (99/01) and the Generalitat de Catalunya (99/1094).
Total protein extraction.
The animals were deeply anesthetized and killed by decapitation at the age of 4, 8, 12, 20, or 30 weeks (wild-type and R6/1), 12 weeks (wild-type and R6/2), 8 months (HdhQ7/Q7 and HdhQ7/Q111 knock-in mice), or 22 months (wild-type, gene-ON, and gene-OFF Tet/HD94 mice). Quinolinic acid (QUIN)-lesioned mice were killed 1 or 4 h after QUIN injection. The brain was quickly removed, and the striatum, cortex, and hippocampus were dissected out and homogenized in lysis buffer containing 1% Triton X-100, 50 mm Tris-HCl, pH 7.5, 10 mm EGTA, 150 mm NaCl, protease inhibitors (2 mm phenylmethylsulphonyl fluoride, 10 μg/μl aprotinin, and 1 μg/μl leupeptin), and phosphatase inhibitors (2 mm Na3VO4 and 100 mm NaF). Samples were centrifuged at 16,100 × g for 20 min at 4°C, the supernatants were collected, and the protein concentration was determined using the Dc protein assay kit (Bio-Rad).
Western blot analysis.
Proteins were denatured in 62.5 mm Tris-HCl, pH 6.8, 2% (w/v) SDS, 10% glycerol, 140 mm β-mercaptoethanol, and 0.1% (w/v) bromophenol blue, heated at 100°C for 5 min, and resolved in denaturing polyacrylamide gels. For pNR1 (Ser897) analysis, the samples were denatured in a 170 mm phosphate buffer, pH 7, with 2.5% (w/v) SDS, 10% glycerol, 3.2 mm dithiothreitol, and 0.1% (w/v) bromophenol blue. Proteins were transferred to nitrocellulose membranes (Whatman Schleicher & Schuell) and washed twice in Tris-buffered saline containing 0.1% Tween 20 (TBS-T). After blocking (TBS-T solution plus 5% bovine serum albumin and 5% skimmed milk) at room temperature for 1 h, the membranes were blotted overnight at 4°C with the following primary antibodies: anti-STEP (23E5; 1:1000) and anti-phosphoERK2 (pERK) (Tyr204; 1:1000) from Santa Cruz Biotechnology); anti-panERK (1:5000), anti-p-p38, anti-p38, and anti-phospho-dopamine- and cAMP-regulated phosphoprotein-32 kDa (pDARPP-32) (Thr34; 1:1000) from Cell Signaling Technology; anti-DARPP-32 (1:1000; BD Biosciences); anti-pNR1 (Ser897; 1:1000; Millipore); and anti-pSTEP (1:1000) (Paul et al., 2003). Incubation with a mouse monoclonal antibody against α-tubulin (1:100,000; Sigma) was performed to obtain loading controls. After primary antibody incubation, the membranes were washed with TBS-T and incubated for 1 h at room temperature with the appropriated horseradish peroxidase-conjugated secondary antibody (1:2000; Promega), and the reaction was finally visualized with the Western Blotting Luminol Reagent (Santa Cruz Biotechnology). Western blot replicates were scanned and quantified using a computer-assisted densitometric analysis (Gel-Pro Analyzer, version 4; Media Cybernetics).
Quantitative PCR assay.
Total RNA was extracted from 8- and 20-week-old wild-type and R6/1 striatal samples, and cDNA was synthesized as described previously (García-Martínez et al., 2007). The cDNA was then analyzed by quantitative (Q)-PCR using the following TaqMan Gene Expression Assays (Applied Biosystems): 18S (Hs99999901_s1) and STEP (Mm00479063_m1) as described previously (Saavedra et al., 2010). The data were analyzed and quantified using the Comparative Quantitation Analysis program of the MxProTM Q-PCR analysis software version 3.0 (Stratagene) with the 18S gene expression as internal loading control. Results were expressed as percentage of wild-type values.
Pharmacological treatments and excitotoxic lesion.
Wild-type mice (12-week-old) were injected intraperitoneally with FK-506 (5 mg/kg; dissolved in cremophor; Sigma) or vehicle (cremophor) and killed 2.5 h later. Papaverine (30 mg/kg; dissolved in water; Sigma) or vehicle (water) was injected intraperitoneally into 12-week-old wild-type mice, and animals were killed by decapitation 10 min after injection. The striatum was removed and stored at −80°C until being processed for protein extraction and Western blot analysis as above. QUIN was intrastriatally injected at the following coordinates relative to bregma: anteroposterior (AP), +0.6 mm; mediolateral (ML), +2 mm; and 2.7 mm below the dural surface with the incisor bar at 3 mm above the interaural line in 12-week-old (see Fig. 5, 10 nmol) and 25 ± 3-week-old [see Fig. 7, 20 nmol and supplemental Fig. 3, 10 nmol (available at www.jneurosci.org as supplemental material)] mice as described previously (Xifró et al., 2009).
Figure 5.

A, B, Regulation of STEP and ERK2 signaling after intrastriatal QUIN injection. pSTEP61 (A) pSTEP46 (B), and pERK2 (C) levels were analyzed by Western blot of protein extracts obtained from the striatum of 12-week-old WT and R6/1 mice, 1 and 4 h after an intrastriatal injection of vehicle or QUIN (10 nmol). Representative immunoblots show protein levels of pSTEP61, STEP61, and α-tubulin (A), pSTEP46, STEP46, and α-tubulin (B), and pERK2, ERK2, and α-tubulin (C) in WT and R6/1 striatum, 1 and 4 h after QUIN injection. Values (obtained by densitometric analysis of Western blot data) are expressed as percentage of the contralateral vehicle-injected WT striatum (pSTEP61/STEP61 ratio, pSTEP46/STEP46 ratio, or pERK2/ERK2 ratio, after normalization with α-tubulin), and data shown are the mean ± SEM (n = 7–9). Data were analyzed by two-way ANOVA, followed by Bonferroni's post hoc test. *p < 0.05, **p < 0.01, and ***p < 0.001 compared with vehicle-injected contralateral WT striatum. WT, Vehicle-injected WT striatum; WT + QUIN, QUIN-injected WT striatum; R6/1, vehicle-injected R6/1 striatum; R6/1 + QUIN, QUIN-injected R6/1 striatum.
Figure 7.
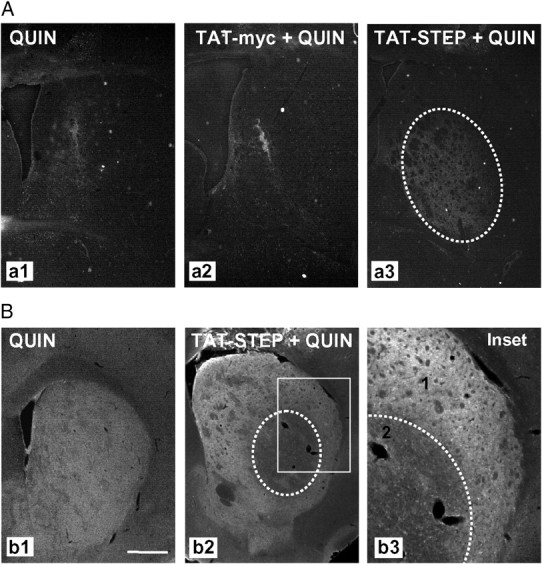
Intrastriatal TAT–STEP injection increases QUIN-induced cell death in R6/1 mice striatum. Control peptide (TAT–myc) or TAT–STEP was intrastriatally injected in R6/1 mice 1 h before intrastriatal QUIN injection. A, Cell death was assessed by Fluoro-Jade staining 24 h after QUIN injection. Representative photomicrographs show the striatal area occupied by Fluoro-Jade-positive cells in R6/1 mice striatum injected with QUIN (a1), TAT–myc plus QUIN (a2), or TAT–STEP plus QUIN (a3). B, Immunohistochemical staining against pERK2 was performed 24 h after QUIN injection in R6/1 mice striatum with or without previous injection of TAT–STEP. Representative images showing the striatum in all the conditions analyzed. In the inset, note the distinct pERK2 immunoreactivity in non-injured (1) and injured (2) striatal cells. Scale bar, 500 μm.
Intrastriatal injection of TAT–STEP or TAT–myc control peptide.
We inserted the trans-activating transduction (TAT) nucleotide sequence (TAC-GGT-CGT-AAAAAA-CGT-CGT-CAG-CGT-CGT-CGT) at the N terminal of the STEP46 cDNA, subcloned it in pTrcHis–TOPO expression vector, and transformed it into Escherichia coli, Top10 (Invitrogen). Six histidines and a myelocytomatosis virus (myc) tag were added to the C terminus to purify the fusion protein and to track it in vivo, respectively. Fusion proteins were induced with isopropyl-β-d-thiogalactopyranoside and affinity purified. Single bands on Westerns blots with myc and STEP antibodies were used as an indication of purity. The peptides were synthesized by the core facility at Yale University (New Haven, CT). One hour before intrastriatal QUIN injection (10 nmol in wild-type mice and 20 nmol in R6/1 mice) in 25 ± 3-week-old mice TAT–STEP or TAT–myc (both 4 μm in 0.5 μl) was intrastriatally injected at the following coordinates relative to bregma: AP, +0.6 mm; ML, +2 mm; and 2.7 mm below the dural surface with the incisor bar at 3 mm above the interaural line. To evaluate the possible toxicity of TAT–STEP, 25 ± 3-week-old wild-type mice received an intrastriatal injection of PBS alone or TAT–STEP (4 μm in 0.5 μl) 1 h before PBS injection.
Fluoro-Jade staining.
Twenty-four hours after intrastriatal QUIN injection, with or without previous TAT-peptide infusion, mice (n = 4–5 for each condition) were deeply anesthetized and immediately perfused transcardially with saline, followed by 4% paraformaldehyde/phosphate buffer. Brains were removed and postfixed for 1–2 h in the same solution, cryoprotected by immersion in 30% sucrose/PBS, and then frozen in dry ice-cooled isopentane. Serial coronal cryostat sections (30 μm) through the whole striatum were collected on silane-coated slides. Striatal sections were processed for Fluoro-Jade staining (Histo-Chem Inc.) as described previously (Schmued et al., 1997). Sections stained with Fluoro-Jade were visualized on a computer, and the border of the lesion was outlined using the Computer-Assisted Stereology Toolbox (CAST) software (Olympus). The volume of the lesion was estimated by multiplying the sum of all the sectional areas (square micrometer) by the distance between successive sections (240 μm), as described previously (Pérez-Navarro et al., 2000).
Immunohistochemistry.
Serial coronal sections (30 μm) were obtained as described for Fluoro-Jade staining and processed for free-floating immunohistochemistry for myc and/or pERK2. The sections were washed three times in PBS and permeabilized/blocked by incubating with PBS containing 0.3% Triton X-100 and 3% normal goat serum (Pierce) for 15 min at room temperature. After three washes, the brain slices were incubated overnight at 4°C under continuous agitation with mouse anti-myc (1:200) and/or rabbit anti-pERK2 (1:250), both from Santa Cruz Biotechnology, in a PBS with 0.02% sodium azide buffer. After primary antibody incubation, slices were washed three times and then incubated 2 h under continuous agitation at room temperature with cyanine (Cy) 3 goat anti-mouse or Cy3 goat anti-rabbit for simple immunolabeling, or with Cy3 goat anti-rabbit and Cy2 goat anti-mouse for double labeling (all 1:300; Jackson ImmunoResearch). No signal was detected in controls incubated in the absence of the primary antibody. pERK2 immunoreactivity was quantified using freeware NIH ImageJ version 1.33 by Wayne Rasband (National Institutes of Health, Bethesda, MD). Integrated optical density (IOD) values were obtained by delineating the lesioned and nonlesioned striatal areas.
Statistical analysis.
Statistical analysis was performed using the Student's t test or the one- or two-way ANOVA, followed by Bonferroni's post hoc test as appropriate and indicated in the figure legends. A 95% confidence interval was used and values of p < 0.05 were considered as statistically significant.
Results
STEP61 and STEP46 levels are decreased in the striatum of R6/1 mice
We first analyzed the expression of STEP61 and STEP46 in the striatum of R6/1 mice to determine whether STEP protein levels were changed in striatal cells expressing N-terminal exon-1 mhtt. To this end, we performed Western blot of striatal protein extracts obtained from 4-, 8-, 12-, 20-, and 30-week-old mice. STEP61 (Fig. 1A) and STEP46 (Fig. 1B) protein levels were unchanged in R6/1 mice at 4 weeks of age compared with wild-type animals. In contrast, STEP61 (Fig. 1A) and STEP46 (Fig. 1B) protein levels were significantly decreased in the striatum of 8-week-old R6/1 mice, a reduction that was maintained in 12-, 20-, and 30-week-old animals.
Figure 1.
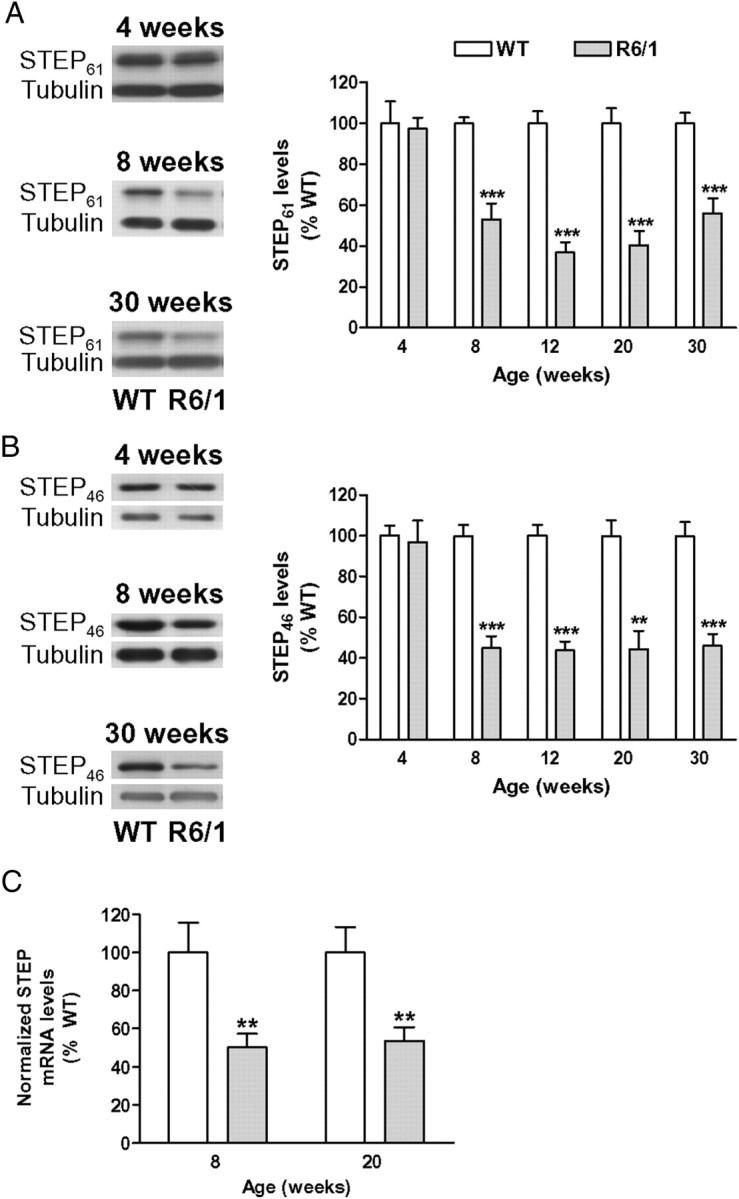
STEP protein and mRNA levels are decreased in the striatum of R6/1 mice. STEP protein levels (A, B) were analyzed by Western blot of protein extracts obtained from the striatum of WT and R6/1 mice at different stages of the disease progression (from 4 to 30 weeks of age). A, B, Representative immunoblots show the protein levels of STEP61, STEP46, and α-tubulin in WT and R6/1 mice at 4, 8, and 30 weeks of age. The graphs show the decrease in striatal STEP61 (A) and STEP46 (B) protein levels in R6/1 mice with respect to their littermate controls at different stages of the disease progression. Values (obtained by densitometric analysis of Western blot data) are expressed as percentage of WT mice (STEP61 or STEP46/α-tubulin ratio) and shown as mean ± SEM (n = 9). C, Graph showing STEP mRNA levels analyzed by Q-PCR in the striatum of 8- and 20-week-old WT and R6/1 mice. Results were normalized to the 18S gene expression, expressed as percentage of WT values, and shown as mean ± SEM (n = 5–7 for each genotype). Data were analyzed by Student's t test. **p < 0.01 and ***p < 0.001 compared with WT mice.
To determine whether the decrease in striatal STEP levels was associated with a downregulation of mRNA expression, we performed Q-PCR. Consistent with reduced STEP protein levels at 8 weeks, Q-PCR analysis revealed a reduction in STEP mRNA levels in the striatum of R6/1 mice (50 ± 7% of wild-type levels) (Fig. 1C). A similar decrease in striatal STEP mRNA levels was found in samples from 20-week-old R6/1 mice (Fig. 1C). These data indicate that, in the presence of mhtt, both STEP mRNA and protein levels are reduced in the striatum, a decrease that is sustained during the disease progression.
Progressive increase of STEP phosphorylation in the striatum of R6/1 mice
Because STEP ability to bind to and dephosphorylate its substrates is regulated through phosphorylation, we looked at pSTEP61 and pSTEP46 levels to evaluate STEP activity in R6/1 mice striatum. As shown in Figure 2A, 8- and 12-week-old R6/1 mice showed an approximately threefold increase in striatal pSTEP61 levels that progressively increased at later stages of the disease. In contrast, striatal pSTEP46 levels were only increased in 30-week-old R6/1 mice (Fig. 2B). These results indicate that STEP phosphorylation increases with age and suggest that its activity progressively decreases in the striatum of R6/1 mice.
Figure 2.

A, B, STEP phosphorylation is increased in the striatum of R6/1 mice. pSTEP61 (A) and pSTEP46 (B) levels were analyzed by Western blot of protein extracts obtained from the striatum of WT and R6/1 mice at different stages of the disease progression (from 4 to 30 weeks of age). Representative immunoblots show protein levels of pSTEP61, pSTEP46, STEP61, STEP46, and α-tubulin in WT and R6/1 mice at 4, 8, and 30 weeks of age. The graphs show striatal pSTEP levels in R6/1 mice with respect to their littermate controls at different stages of the disease progression. Values (obtained by densitometric analysis of Western blot data) are expressed as percentage of age-matched WT mice (pSTEP61/STEP61 or pSTEP46/STEP46 ratio after normalization with α-tubulin) and shown as mean ± SEM (n = 4–7). Data were analyzed by Student's t test. *p < 0.05, **p < 0.01, and ***p < 0.001 compared with WT mice; ##p < 0.01 and ###p < 0.001 compared with 12-week-old R6/1 mice; and +p < 0.05 compared with 20-week-old R6/1 mice.
Alterations in STEP expression and phosphorylation in R6/1 mice are not restricted to the striatum
To determine whether the reduction of STEP protein levels and activation was a general mechanism triggered by neurons in response to mhtt expression, STEP61 protein and phosphorylation levels were determined in the cortex and hippocampus of R6/1 mice at different stages of the disease. Although cortical STEP61 levels were decreased, no changes were found in hippocampal STEP61 protein levels (supplemental Table 1, available at www.jneurosci.org as supplemental material). In contrast, and as observed in the striatum, cortical and hippocampal pSTEP61 levels were significantly increased in R6/1 mice from 8 to 30 weeks of age (supplemental Table 1, available at www.jneurosci.org as supplemental material). Together, these data indicate that, in the presence of mhtt, STEP protein expression is regulated in a region-dependent manner, whereas the effect on STEP phosphorylation is more widespread.
Increased STEP phosphorylation in the striatum of R6/1 mice correlates with increased pERK2 and p-p38 levels at late stages of disease progression
If the phosphorylation/inactivation of STEP in R6/1 mice is physiologically relevant, then STEP targets should be more phosphorylated in these animals. To address this question, we next examined pERK2 and p-p38 levels in the striatum of R6/1 mice from 8 to 30 weeks of age. Neither pERK2 (Fig. 3A) nor p-p38 (Fig. 3B) levels were significantly altered in 8- or 12-week-old R6/1 mice. In contrast, there was a significant increase in both pERK2 (Fig. 3A) and p-p38 (Fig. 3B) levels in the striatum of 20- and 30-week-old R6/1 mice compared with age-matched wild-type animals. These data support the idea that the loss of STEP activity is progressive in R6/1 striatum.
Figure 3.
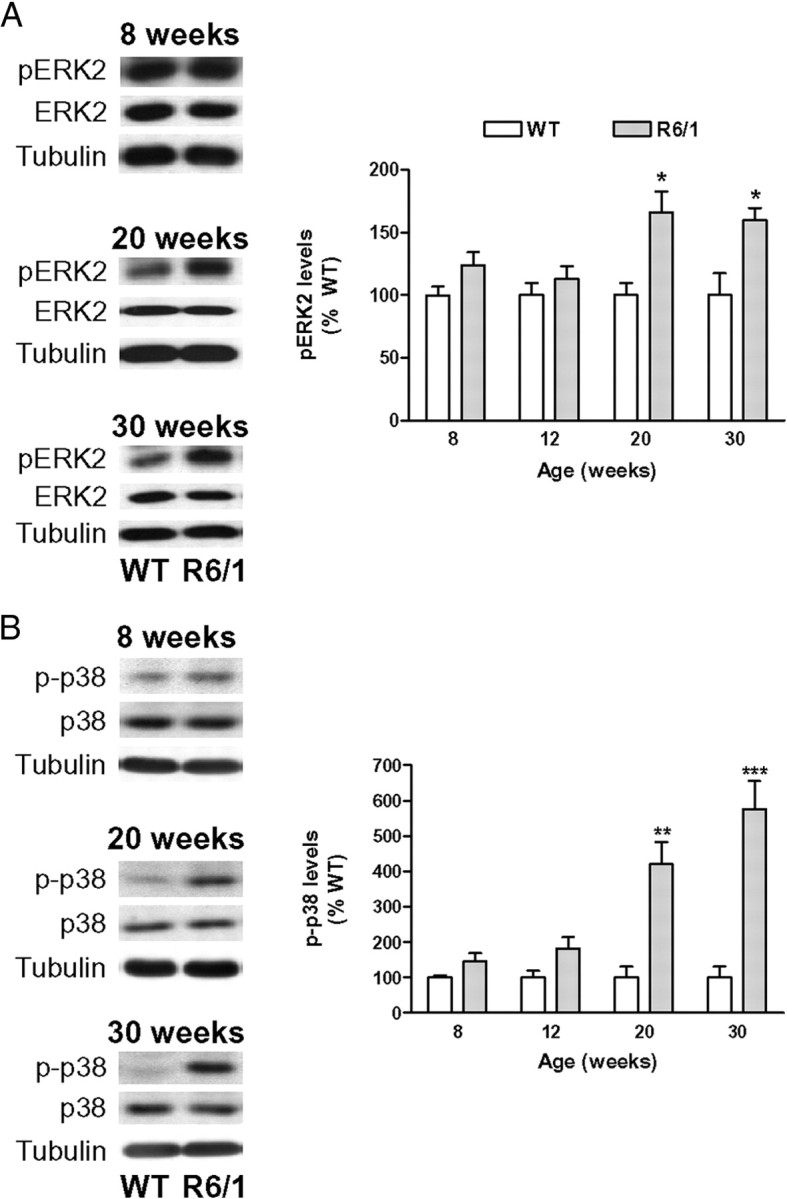
pERK2 and p-p38 levels are increased in the striatum of R6/1 mice. pERK2 (A) and p-p38 (B) levels were analyzed by Western blot of protein extracts obtained from the striatum of 8- to 30-week-old WT and R6/1 mice. Representative immunoblots show protein levels of pERK2, ERK2, p-p38, p38, and α-tubulin in WT and R6/1 mice at 8, 20, and 30 weeks of age. The graphs show that the striatal levels of pERK2 and p-p38 are significantly increased in R6/1 mice with respect to their littermate controls at 20 and 30 weeks of age. Values (obtained by densitometric analysis of Western blot data) are expressed as percentage of age-matched WT mice (pERK2/ERK2 and p-p38/p38 ratio after normalization with α-tubulin) and shown as mean ± SEM (n = 6). Data were analyzed by Student's t test. *p < 0.05, **p < 0.01, and ***p < 0.001 compared with WT mice.
The accumulation of pSTEP correlates with a deregulation of PKA and calcineurin pathways in the striatum of R6/1 mice
The phosphorylation levels of STEP are regulated by PKA-dependent phosphorylation and calcineurin-dependent dephosphorylation (Paul et al., 2000, 2003). Because calcineurin activity in the striatum of R6/1 mice is not reduced until 16 weeks of age (Xifró et al., 2009), we examined whether the increase in pSTEP61 levels observed in the striatum of 8- and 12-week-old R6/1 mice (Fig. 2A) was attributable to altered PKA activity. To address this issue, we analyzed two additional PKA substrates: (1) the NMDAR subunit NR1 (Ser897) (Tingley et al., 1997) and (2) DARPP-32 (Thr34) (Hemmings et al., 1984). Striatal NR1 protein levels are not altered in the striatum of R6/1 mice during the disease progression (Torres-Peraza et al., 2008), and it is not dephosphorylated by calcineurin (Lee, 2006). Conversely, like STEP, DARPP-32 mRNA and protein levels are downregulated in the presence of mhtt (Luthi-Carter et al., 2000; van Dellen et al., 2000), and it is dephosphorylated by calcineurin (Halpain et al., 1990). The levels of pNR1 (Ser897) were not altered in the striatum of R6/1 mice at 4 weeks of age, whereas we observed a comparable increase in pNR1 (Ser897) levels in 12- and 30-week-old R6/1 mice striatum (Fig. 4A). Similarly to pSTEP61 and pNR1 (Ser897), pDARPP-32 (Thr34) levels were not altered at 4 weeks of age, whereas its levels were progressively enhanced in the striatum of R6/1 mice, with the highest increase observed at 30 weeks of age (Fig. 4B). Because calcineurin dephosphorylates pDARPP-32 (Halpain et al., 1990) but not pNR1 (Lee, 2006), these results suggest that the early changes in pSTEP61, pNR1, and pDARPP-32 levels in the striatum of R6/1 mice are caused by a deregulation in the PKA pathway, which at later stages of the disease progression operates together with reduced calcineurin activity to additionally enhance STEP61 and DARPP-32 phosphorylation.
Figure 4.
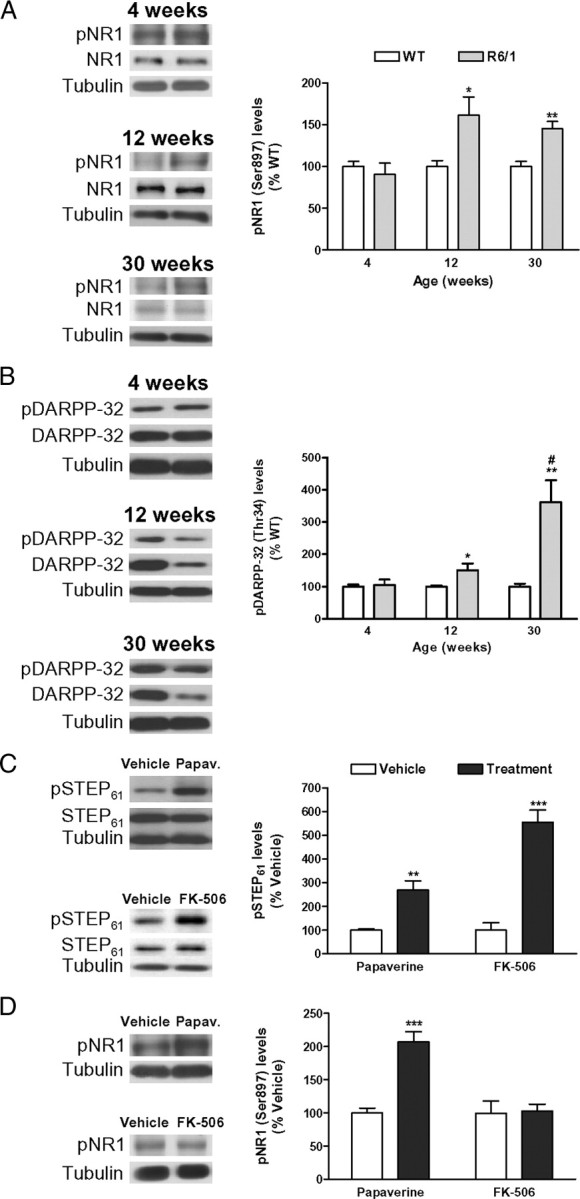
Regulation of NR1, DARPP-32, and STEP phosphorylation in the striatum. A, B, The phosphorylation levels of a specific PKA residue on NR1 (Ser897) (A) and on DARPP-32 (Thr34) (B) were analyzed by Western blot of protein extracts obtained from the striatum of WT and R6/1 mice at 4, 12, and 30 weeks of age. Representative immunoblots are presented. The graphs show increased levels of pNR1 (Ser897) (A) and pDARPP-32 (Thr34) (B) in R6/1 mice with respect to their littermate controls at different stages of the disease progression. Values (obtained by densitometric analysis of Western blot data) are expressed as percentage of age-matched WT mice [pNR1 (Ser897)/NR1 ratio or pDARPP-32 (Thr34)/DARPP-32 ratio after normalization with α-tubulin] and shown as mean ± SEM (n = 8). Data were analyzed by Student's t test. *p < 0.05 and **p < 0.01 compared with WT mice; and #p < 0.05 compared with 12-week-old R6/1 mice. C, PKA activation or calcineurin inhibition increases pSTEP61 levels in the striatum. Twelve-week-old WT mice (n = 6 for each condition) received an intraperitoneal injection of vehicle, papaverine (30 mg/kg; Papav.), or FK-506 (5 mg/kg), and striatal pSTEP61 levels were analyzed by Western blot (10 min after papaverine and 2.5 h after FK-506 injection). Representative immunoblots show protein levels of pSTEP61, STEP61, and α-tubulin in all conditions examined. Values (obtained by densitometric analysis of Western blot data) are expressed as percentage of vehicle-injected mice (pSTEP61/STEP61 ratio after normalization with α-tubulin) and shown as mean ± SEM. D, PKA activation, but not calcineurin inhibition, increases pNR1 (Ser897) levels in the striatum. Twelve-week-old WT mice (n = 6 for each condition) received an intraperitoneal injection of vehicle, papaverine (30 mg/kg; Papav.), or FK-506 (5 mg/kg), and striatal pNR1 (Ser897) levels were analyzed by Western blot. Representative immunoblots show protein levels of pNR1 (Ser897) and α-tubulin in all conditions examined. Values (obtained by densitometric analysis of Western blot data) are expressed as percentage of vehicle-injected mice [pNR1 (Ser897)/α-tubulin ratio] and shown as mean ± SEM. Data were analyzed by Student's t test. **p < 0.01 and ***p < 0.001 compared with vehicle-injected mice.
To explore this possibility, we examined pSTEP61 and pNR1 (Ser897) levels in wild-type mice after acute modulation of PKA or calcineurin activity. To activate PKA, we inhibited phosphodiesterases (PDEs), the enzymes responsible for cAMP hydrolysis. For that we used papaverine, an inhibitor of the PDE10A (Siuciak et al., 2006), an isoform that is enriched in striatal medium spiny neurons (Fujishige et al., 1999; Seeger et al., 2003; Xie et al., 2006). To inhibit calcineurin activity, we used FK-506 (Xifró et al., 2009). Both papaverine and FK-506 treatment induced an increase in pSTEP61 levels in the striatum of wild-type mice (Fig. 4C). We also observed increased pNR1 (Ser897) levels after papaverine injection, whereas calcineurin inhibition had no effect on pNR1 (Ser897) levels (Fig. 4D). Altogether, these findings indicate that both PKA and calcineurin deregulation contribute to enhance STEP phosphorylation in the presence of mhtt.
Regulation of STEP and ERK2 signaling after an excitotoxic stimulus to the striatum
Intrastriatal injection of the NMDAR agonist QUIN has been extensively used as a model of HD (Schwarcz et al., 2010). We recently reported that activation of calcineurin promotes QUIN-induced excitotoxic cell death in the striatum (Xifró et al., 2009). Because the stimulation of NMDARs activates STEP in a calcineurin-dependent manner (Paul et al., 2003), we next examined whether STEP acts as a calcineurin target after an excitotoxic stimulus to the striatum. In wild-type mice, there was a reduction in pSTEP61 (Fig. 5A) and pSTEP46 (Fig. 5B) levels 1 h after intrastriatal QUIN injection that returned to control values at 4 h. These results are consistent with our previous results showing a twofold increase in calcineurin activity 1 h after intrastriatal QUIN injection with no differences from nonlesioned striatum at 4 h (Xifró et al., 2009). Because STEP61 can be cleaved by calpain after a rapid influx of Ca2+ during glutamate receptor stimulation leading to the appearance of a lower-molecular-weight inactive isoform, STEP33 (Nguyen et al., 1999; Xu et al., 2009), we analyzed whether this process occurred in QUIN-injected striatum. We found no changes in STEP61 or STEP33 levels either 1 or 4 h after QUIN injection in wild-type mice striatum (supplemental Fig. 1, available at www.jneurosci.org as supplemental material). Consistent with ERK activation during synaptic NMDAR stimulation (Ivanov et al., 2006; Léveillé et al., 2008; Xu et al., 2009), 1 h after intrastriatal QUIN injection, there was an increase in pERK2 levels that returned to basal levels at 4 h after injection (Fig. 5C). In accordance with STEP dephosphorylation and activation 1 h after QUIN injection, we also observed a reduction in p-p38 levels (76 ± 7% compared with the vehicle-injected side; p = 0.0095) that returned to control levels 4 h after QUIN injection.
R6 mouse models gradually develop resistance to excitotoxicity induced by QUIN (Hansson et al., 2001), and reduced calcineurin activity accounts for R6/1 mice resistance to excitotoxicity (Xifró et al., 2009). Because our results show a dynamic regulation of STEP and ERK1/2 activity after intrastriatal QUIN injection in wild-type animals, we hypothesized that this signaling cascade could be modified in the presence of exon-1 mhtt and thereby account for the resistance to excitotoxicity reported in these animals. Thus, we analyzed pSTEP and pERK2 levels after QUIN injection in R6/1 mice at 12 weeks of age, when they are resistant to excitotoxicity. In contrast to that observed in wild-type animals, in R6/1 mice neither pSTEP61 (Fig. 5A) nor pSTEP46 (Fig. 5B) levels were altered 1 or 4 h after QUIN injection. These results are consistent with the previous finding that calcineurin activity after QUIN injection in R6/1 mice is significantly lower than that observed in wild-type mice and constant between 1 and 4 h after injection (Xifró et al., 2009). No changes in STEP61 or STEP33 levels were found after intrastriatal QUIN injection in R6/1 mice either (supplemental Fig. 1, available at www.jneurosci.org as supplemental material). We also observed increased pERK2 levels 1 h after intrastriatal QUIN injection in R6/1 mice, which were comparable with those registered in wild-type animals (296 ± 49% compared with wild-type contralateral side). However, in contrast to wild-type mice, in R6/1 animals pERK2 levels remained significantly elevated 4 h after intrastriatal QUIN injection (Fig. 5C). These results indicate that, despite a similar activation of the ERK pro-survival pathway in wild-type and R6/1 mice after intrastriatal QUIN injection, ERK signaling is more prolonged in resistant R6/1 than in vulnerable wild-type mice. In contrast, p-p38 levels were unchanged 1 and 4 h after intrastriatal QUIN injection in R6/1 mice (data not shown), a result consistent with no significant changes in pSTEP levels (Fig. 5A,B).
Our hypothesis was that enhanced activity of the ERK pathway, at least in part as a result of the lack of STEP activation, may participate in the reduced neuronal loss observed after QUIN injection in R6/1 mice. To address this possibility, we analyzed pERK2 levels in wild-type mice after treatment with FK-506 or papaverine, because inhibition of calcineurin (Xifró et al., 2009) or PDE10A (Giampà et al., 2009) prevents QUIN-induced cell death in the striatum. Consistent with STEP inactivation (Fig. 4C), treatment with papaverine or FK-506 increased pERK2 levels in the striatum (Fig. 6), thus suggesting that increased STEP inactivation in R6/1 striatum can mediate resistance to excitotoxicity through the maintenance of ERK signaling.
Figure 6.

Inhibition of PDE10A or calcineurin increases pERK2 levels in the striatum. Twelve-week-old wild-type mice (n = 6 for each condition) received an intraperitoneal injection of vehicle, papaverine (30 mg/kg; Papav.), or FK-506 (5 mg/kg), and striatal pERK2 levels were analyzed by Western blot (10 min after papaverine and 2.5 h after FK-506 injection). Representative immunoblots show protein levels of pERK2, ERK2, and α-tubulin in all the conditions examined. Values (obtained by densitometric analysis of Western blot data) are expressed as percentage of vehicle-injected mice (pERK2/ERK2 ratio after normalization with α-tubulin) and expressed as mean ± SEM. Data were analyzed by Student's t test. *p < 0.05 and **p < 0.01 compared with vehicle-injected mice.
Intrastriatal injection of TAT–STEP peptide increases QUIN-induced cell death
Older R6/1 mice are more resistant to excitotoxicity than younger animals (Hansson et al., 2001) and, interestingly, have significantly higher striatal levels of phosphorylated/inactive STEP (Figs. 2, 3). Thus, to directly clarify the relationship between STEP activity and vulnerability versus resistance to excitotoxicity, we next infused TAT–STEP or TAT–myc in the striatum of 25 ± 3-week-old wild-type and R6/1 mice 1 h before intrastriatal injection of PBS or QUIN. To confirm that TAT–STEP was taken up by striatal cells at the moment of QUIN injection, we performed a staining with anti-myc antibody 1 h after TAT–STEP intrastriatal infusion. As shown in supplemental Figure 2B (available at www.jneurosci.org as supplemental material), TAT–STEP was detected in cells surrounding the site of injection. Intrastriatal injection of TAT–STEP plus vehicle did not induce cell death in the striatum of wild-type mice as assessed by Fluoro-Jade staining (supplemental Fig. 2C, available at www.jneurosci.org as supplemental material). In R6/1 mice striatum, cell death induced by QUIN injection was not modified by the infusion of the control peptide TAT–myc (80 ± 16% with respect to QUIN-injected R6/1 striatum) (Fig. 7Aa2). In contrast, infusion of TAT–STEP before intrastriatal QUIN injection increased the volume of the lesion compared with that registered in R6/1 mice receiving the control peptide plus QUIN injection (308 ± 62% with respect to QUIN-injected R6/1 striatum; p = 0.0337, Student's t test) (Fig. 7Aa3). Immunohistochemical analysis revealed that pERK2 levels were decreased (IOD, 63 ± 4% compared with nonlesioned area; p = 0.0027, Student's t test) in the striatal region in which cells undergo cell death (Fig. 7Bb3). Similarly, in wild-type mice, infusion of TAT–STEP increased the volume of the lesion compared with that observed in mice receiving the control peptide plus QUIN injection (supplemental Fig. 3A,B, available at www.jneurosci.org as supplemental material). Furthermore, reduced levels of pERK2 were detected in striatal cells localized in the penumbra zone and containing TAT–STEP (supplemental Fig. 3C, available at www.jneurosci.org as supplemental material). These data demonstrate that STEP increases neuronal vulnerability to excitotoxic stimuli and further support the involvement of STEP reduced levels and activity in R6/1 resistance to excitotoxicity.
STEP and pSTEP levels are also modified in the striatum of R6/2 and HdhQ7/Q111 mice
To investigate whether changes in STEP and pSTEP levels are a common feature in striatal cells expressing mhtt, we analyzed them in mice expressing different forms of mhtt: R6/2 mice, which express N-terminal exon-1 mhtt and show earlier onset and more severe symptoms than R6/1 mice (Mangiarini et al., 1996), and knock-in HdhQ7/Q111 mice that show late onset and slow progression of the disease (Wheeler et al., 1999). As observed in the striatum of R6/1 mice, STEP61 and STEP46 levels were reduced in 12-week-old R6/2 (Fig. 8A) and 8-month-old HdhQ7/Q111 (Fig. 8B) mice. Additionally, both R6/2 (Fig. 8A) and HdhQ7/Q111 (Fig. 8B) mice showed increased striatal levels of phosphorylated, inactive, STEP61. In contrast, pSTEP46 levels were increased in the striatum of R6/2 animals (Fig. 8A) but remained unchanged in HdhQ7/Q111 mice (Fig. 8B). These results indicate that the downregulation of STEP protein and increased phosphorylation are found in the striatum of the three HD mouse models analyzed. Moreover, these data support the idea that the alteration of pSTEP46 levels occurs only at late stages of the disease (30-week-old R6/1 and 12-week-old R6/2 mice versus 8-month-old HdhQ7/Q111).
Figure 8.
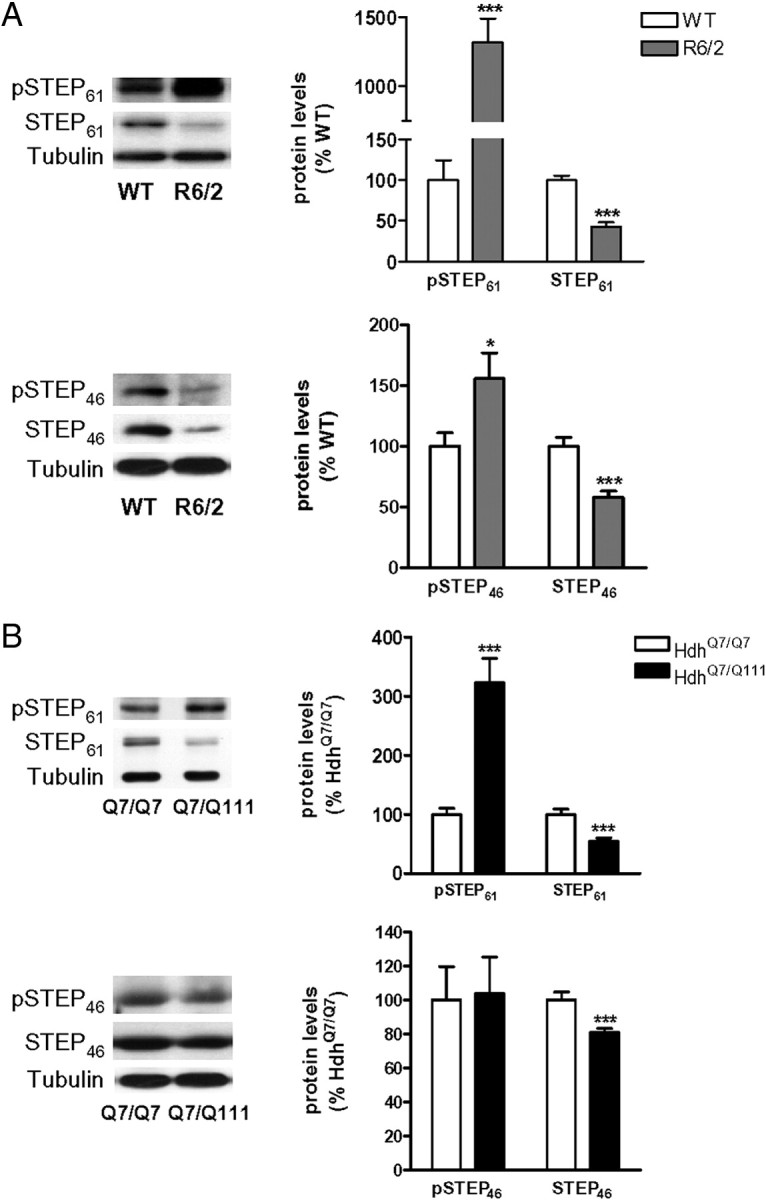
Alterations of STEP and pSTEP levels in the striatum of R6/2 and HdhQ7/Q111 mice. A, B, pSTEP61, pSTEP46, STEP61, and STEP46 levels were analyzed by Western blot of protein extracts obtained from the striatum of WT and R6/2 mice at 12 weeks of age (A) and from 8-month-old HdhQ7/Q7 and knock-in HdhQ7/Q111 mice (B). Representative immunoblots show the protein levels of pSTEP61, pSTEP46, STEP61, STEP46, and α-tubulin in WT, HdhQ7/Q7, R6/2, and HdhQ7/Q111 mice. Values (obtained by densitometric analysis of Western blot data) are expressed as percentage of WT/HdhQ7/Q7 mice (pSTEP/STEP ratio after normalization with α-tubulin and STEP/α-tubulin ratio, respectively) and shown as mean ± SEM (n = 5–8). Data were analyzed by Student's t test. *p < 0.05 and ***p < 0.001 compared with WT or HdhQ7/Q7 mice, respectively.
Changes in STEP expression are reverted by suppressing the mhtt transgene expression in Tet/HD94 mice striatum
To determine whether STEP downregulation depends on the continuous expression of mhtt, we quantified STEP protein levels in the striatum of Tet/HD94 mice. Striatal STEP protein levels were examined in 22-month-old mice from three different groups: wild-type, Tet/HD94 with no pharmacological intervention (gene-ON), and Tet/HD94 after 5 months of doxycycline administration that turns off the expression of the mhtt transgene (gene-OFF). As observed in the striatum of the two other exon-1 models analyzed here (R6/1 and R6/2) (Figs. 1, 8A, respectively), STEP61 and STEP46 protein levels were significantly decreased in the Tet/HD94 gene-ON group when compared with wild-type animals (Fig. 9A). By suppressing transgene expression, STEP61 and STEP46 protein levels were no longer different from wild-type mice (Fig. 9A).
Figure 9.

Changes in STEP expression but not in STEP phosphorylation are reverted by suppressing the mhtt transgene expression in Tet/HD94 mice striatum. pSTEP61, STEP61, and STEP46 protein levels were analyzed by Western blot in the striatum of 22-month-old WT and Tet/HD94 mice, either with no pharmacological intervention (Gene-ON) or after 5 months of mhtt transgene shutdown by doxycycline administration (Gene-OFF). A, B, The graphs show the densitometric measures of STEP61 and STEP46 normalized to α-tubulin (A) and the pSTEP61/STEP ratio after normalization with α-tubulin (B). Results are expressed as percentages of WT ± SEM. Data were analyzed by one-way ANOVA, followed by Bonferroni's post hoc test. *p < 0.05 compared with WT mice; #p < 0.05 compared with Tet/HD94 gene-ON mice.
We also determined the levels of pSTEP61 and pSTEP46 in the striatum of these mice. Tet/HD94 mice expressing mhtt showed increased levels of pSTEP61 (Fig. 9B), but not of pSTEP46 (data not shown), when compared with wild-type values. In contrast to that observed for STEP protein levels, 5 months after mhtt shutdown pSTEP61 levels were only partially reverted to wild-type levels (Fig. 9B).
Discussion
In the present study, we show that STEP protein and activity are reduced in the presence of mhtt in vivo. In the R6/1 mouse striatum, STEP hyperphosphorylation occurs early in the disease process and correlates with a deregulation of the PKA pathway, which at later stages cooperates with a reduction in calcineurin activity to further inactivate STEP. Decreased STEP protein and activity were also detected in the striatum of R6/2, Tet/HD94, and HdhQ7/Q111 mice. In addition, we show that STEP acts downstream of calcineurin after an excitotoxic stimulus and that inactivation of STEP is one of the mechanisms involved in neuronal dysfunction leading to resistance to excitotoxicity in R6/1 mice striatum.
In the presence of mhtt, STEP is regulated at two different levels, expression and phosphorylation, suggesting that both effects could synergistically reduce STEP activity. The downregulation of STEP protein is brain region specific as select combinations of trans-acting factors and coactivators can contribute to both gene- and tissue-specific effects of mhtt (Gomez et al., 2006). After mhtt shutdown in Tet/HD94 mice striatum, we observed a reestablishment of STEP protein to wild-type levels. This finding, together with the fact that R6/1 mice develop motor symptoms at ∼15–21 weeks of age (Mangiarini et al., 1996) and that STEP levels are already decreased at 8 weeks of age, suggest altered transcription of the STEP gene as a direct result of mhtt expression. However, we cannot rule out that mhtt might also regulate STEP expression by an indirect mechanism. In agreement with our results, a previous report showed that STEP mRNA levels are decreased to a similar extent in 10- and 24-week-old R6/1 mice striatum (Desplats et al., 2006). Furthermore, STEP mRNA levels are also decreased in the brain of HD patients (Hodges et al., 2006), suggesting that reduced STEP expression could be involved in the pathogenesis of HD.
STEP inactivation in R6/1 mice occurred in all brain regions analyzed. The levels of pSTEP are regulated by PKA-dependent phosphorylation and calcineurin/PP1-dependent dephosphorylation (Paul et al., 2000, 2003; Valjent et al., 2005). Reduced calcineurin levels in the striatum of R6/1 mice were observed from 16 weeks of age (Xifró et al., 2009), thus suggesting that changes in pSTEP61 levels at early stages could be linked to a deregulation of the PKA pathway. Accordingly, the phosphorylation level of other PKA substrates, DARPP-32 (Thr34) (Hemmings et al., 1984) and NR1 (Ser897) (Tingley et al., 1997), was significantly increased in the striatum of R6/1 mice at 12 weeks of age. Similarly, previous reports also showed increased striatal levels of pNR1 (Ser897) in R6 mice at this age (Ariano et al., 2005; Torres-Peraza et al., 2008). At later stages of the disease, the deregulation of the PKA pathway is accompanied by a reduction in calcineurin activity as evidenced by an even more robust elevation of pSTEP61 and pDARPP-32 (Thr34) levels, together with a significant increase in pSTEP46 levels in the striatum of R6/1 mice.
STEP phosphorylation occurs after stimulation of D1Rs (Paul et al., 2000), whose reduced expression is a hallmark of HD (Cha et al., 1998; Jakel and Maragos, 2000; Ariano et al., 2002). However, despite D1R loss, D1R agonist-induced immediate early genes mRNA levels are significantly increased in the striatum of R6/2 mice, suggesting that mhtt may enhance the sensitivity of D1R-mediated signaling (Spektor et al., 2002). Accordingly, D1R-mediated toxicity is increased in HD cellular models (Tang et al., 2007; Paoletti et al., 2008). In addition, enhanced levels of D5R and elevations in intracellular cAMP staining have been shown in the striatum of HD mouse models (Ariano et al., 2002, 2005). In the presence of mhtt, parallel changes in other components of the cAMP/PKA pathway, such as PDEs, can also be involved in a PKA-dependent increase in pSTEP levels. Indeed, PDE10A expression, which is enriched in striatal projection neurons (Fujishige et al., 1999; Seeger et al., 2003; Xie et al., 2006), is reduced in R6 mice striatum (Hebb et al., 2004; Hu et al., 2004; Desplats et al., 2006) and in the caudate–putamen of HD patients (Hebb et al., 2004). Altogether, these changes could cooperate to enhance cAMP/PKA-dependent phosphorylation and inactivation of STEP.
The progressive inactivation of STEP in the striatum of R6/1 mice correlated with the accumulation of pERK2 and p-p38 at late stages of the disease, consistent with previous findings in R6 (Liévens et al., 2002; Gianfriddo et al., 2004; Roze et al., 2008; Torres-Peraza et al., 2008) and STEP knock-out (Venkitaramani et al., 2009; Xu et al., 2009) mice. The absence of changes in pERK2 and p-p38 levels at early stages suggests that, under baseline conditions, a high inactivation of STEP is necessary to impact on the phosphorylation level of its targets. Accordingly, both in vitro and in vivo studies show that STEP activity is low under basal conditions (Paul et al., 2003; Valjent et al., 2005). Moreover, hippocampal pERK1/2 levels are increased in STEP knock-out but not in STEP+/− mice (Venkitaramani et al., 2009). However, we cannot rule out that the presence of mhtt may also affect mechanisms activating ERK and p38. Activation of the ERK pathway is neuroprotective in multiple HD models (Apostol et al., 2006; Maher et al., 2011). Thus, despite higher p-p38 levels (Gianfriddo et al., 2004; present results), increased ERK signaling in the striatum of R6/1 (present results) and R6/2 (Liévens et al., 2002; Roze et al., 2008) mice, in addition to high levels of activation of the phosphatidylinositol 3-kinase (PI3K)/Akt pathway (Saavedra et al., 2010), could participate in delaying striatal cell death because R6 mice show no significant cell loss (Mangiarini et al., 1996).
The development of resistance to NMDAR-induced excitotoxicity in R6/1 mice raises the possibility that the activation of intracellular pathways after NMDAR stimulation might be differentially regulated in the presence of mhtt. Actually, activation of the PI3K/Akt pathway may participate in the reduced neuronal loss observed after QUIN injection in R6/1 mice striatum (Saavedra et al., 2010). Here, we show higher and unaltered pSTEP levels after intrastriatal QUIN injection in R6/1 consistent with lower calcineurin activation than in wild-type mice, which, importantly, correlates with reduced cell death (Xifró et al., 2009) and more sustained ERK signaling. Activation of extrasynaptic NMDARs in primary cortical neurons leads to calpain-mediated proteolysis of STEP61 and p38 activation (Xu et al., 2009). Here, we observed STEP dephosphorylation but not STEP61 cleavage or p38 activation after intrastriatal QUIN injection, which, together with ERK2 activation, suggests a preferential stimulation of synaptic NMDARs. YAC128 mice show an imbalance between synaptic and extrasynaptic NMDARs (Okamoto et al., 2009; Milnerwood et al., 2010). However, these mice develop resistance to excitotoxicity with age (Graham et al., 2009), and those studies were performed in vulnerable mice. Thus, it is likely that increased extrasynaptic NMDARs during excitotoxicity-sensitive stages might increase STEP61 cleavage to STEP33, enabling higher activation of p38 than in wild-type mice. In contrast, in resistant mice other mechanisms should regulate striatal cell survival in response to excitotoxicity, and the present results suggest an important role for STEP regulation of ERK activity. Accumulating evidence shows that increases in ERK activity are neuroprotective (Irving et al., 2000; Almeida et al., 2005; Jiang et al., 2005; Choi et al., 2007). In agreement, pharmacological inhibition of calcineurin or PDE10A, which leads to decreased STEP activity with subsequent increase in pERK2 levels (present results), is protective against QUIN-induced excitotoxicity in the striatum (Giampà et al., 2009; Xifró et al., 2009). In addition, a higher level of tonic STEP activity in hilar interneurons of the hippocampus renders them highly vulnerable to excitotoxic-induced cell death, whereas blockade of STEP activity with FK-506 allows ERK activation and confers protection against excitotoxicity (Choi et al., 2007). Therefore, our results showing low striatal STEP levels and activity (increased pSTEP levels) in R6/1 mice are in agreement with their reduced vulnerability to excitotoxicity. This hypothesis is supported by the observation that TAT–STEP infusion increases QUIN-induced cell death in the striatum.
In conclusion, we show that mhtt regulates STEP expression in selected brain regions and exerts a broader effect on the regulation of STEP phosphorylation. Increased STEP phosphorylation caused by altered kinase (PKA) and phosphatase (calcineurin) activities may lead to neuronal dysfunction and participate in the development of resistance to excitotoxicity in HD mouse models (supplemental Fig. 4, available at www.jneurosci.org as supplemental material). Although alterations in the STEP pathway occur in other neurodegenerative conditions, such as Alzheimer's disease (AD), changes described here are specific to HD because STEP protein levels and activity are elevated in AD (Chin et al., 2005; Kurup et al., 2010; Zhang et al., 2010), whereas PKA activity is reduced (Gong et al., 2006) and calcineurin activity is enhanced (Kuchibhotla et al., 2008). Because genetic reduction of STEP levels reverses cognitive and cellular deficits in AD mice (Zhang et al., 2010), the modulation of STEP levels might be a good therapeutic strategy. However, given the lack of data about the regulation of STEP gene expression, we cannot propose a therapeutic approach to restore STEP expression in HD. Therefore, we suggest that modulation of the PKA activity could be a therapeutic approach, at least at early stages.
Footnotes
This work was supported by Fondo de Investigaciones Sanitarias [Instituto de Salud Carlos III, PI071183 (E.P.-N.) and Redes Temáticas de Investigación Cooperativa Sanitaria Grant RD06/0010/0006], Ministerio de Educación y Ciencia Grant SAF2008-04360 (J.A.), and Generalitat de Catalunya Grant 2009SGR-00326. P.J.L. was supported by National Institutes of Health Grants MH01527 and MH52711. A.S. was supported by Fundação para a Ciência e Tecnologia (Portugal) Postdoctoral Fellowship SFRH/BPD/47435/2008, and Centro de Investigación Biomédica en Red sobre Enfermedades Neurodegenerativas (Spain). A.G. and L.R. are fellows of Ministerio de Educación y Ciencia (Spain). X.X. had a postdoctoral contract from Fondo de Investigaciones Sanitarias (Instituto de Salud Carlos III). We thank Dr. M. MacDonald (Massachusetts General Hospital, Boston, MA) for HdhQ7/Q7 and HdhQ7/Q111 mice. We also thank Ana López, Maria Teresa Muñoz, and Cristina Herranz for technical assistance and Dr. Amèrica Jiménez and the staff of the animal care facility (Facultat de Medicina, Universitat de Barcelona, Barcelona, Spain) for their help.
References
- Almeida RD, Manadas BJ, Melo CV, Gomes JR, Mendes CS, Grãos MM, Carvalho RF, Carvalho AP, Duarte CB. Neuroprotection by BDNF against glutamate-induced apoptotic cell death is mediated by ERK and PI3-kinase pathways. Cell Death Differ. 2005;12:1329–1343. doi: 10.1038/sj.cdd.4401662. [DOI] [PubMed] [Google Scholar]
- André VM, Cepeda C, Levine MS. Dopamine and glutamate in Huntington's disease: a balancing act. CNS Neurosci Ther. 2010;16:163–178. doi: 10.1111/j.1755-5949.2010.00134.x. [DOI] [PMC free article] [PubMed] [Google Scholar]
- Apostol BL, Illes K, Pallos J, Bodai L, Wu J, Strand A, Schweitzer ES, Olson JM, Kazantsev A, Marsh JL, Thompson LM. Mutant huntingtin alters MAPK signaling pathways in PC12 and striatal cells: ERK1/2 protects against mutant huntingtin-associated toxicity. Hum Mol Genet. 2006;15:273–285. doi: 10.1093/hmg/ddi443. [DOI] [PubMed] [Google Scholar]
- Ariano MA, Aronin N, Difiglia M, Tagle DA, Sibley DR, Leavitt BR, Hayden MR, Levine MS. Striatal neurochemical changes in transgenic models of Huntington's disease. J Neurosci Res. 2002;68:716–729. doi: 10.1002/jnr.10272. [DOI] [PubMed] [Google Scholar]
- Ariano MA, Wagle N, Grissell AE. Neuronal vulnerability in mouse models of Huntington's disease: membrane channel protein changes. J Neurosci Res. 2005;80:634–645. doi: 10.1002/jnr.20492. [DOI] [PubMed] [Google Scholar]
- Boulanger LM, Lombroso PJ, Raghunathan A, During MJ, Wahle P, Naegele JR. Cellular and molecular characterization of a brain-enriched protein tyrosine phosphatase. J Neurosci. 1995;15:1532–1544. doi: 10.1523/JNEUROSCI.15-02-01532.1995. [DOI] [PMC free article] [PubMed] [Google Scholar]
- Braithwaite SP, Adkisson M, Leung J, Nava A, Masterson B, Urfer R, Oksenberg D, Nikolich K. Regulation of NMDA receptor trafficking and function by striatal-enriched tyrosine phosphatase (STEP) Eur J Neurosci. 2006;23:2847–2856. doi: 10.1111/j.1460-9568.2006.04837.x. [DOI] [PubMed] [Google Scholar]
- Bult A, Zhao F, Dirkx R, Jr, Raghunathan A, Solimena M, Lombroso PJ. STEP: a family of brain-enriched PTPs. Alternative splicing produces transmembrane, cytosolic and truncated isoforms. Eur J Cell Biol. 1997;72:337–344. [PubMed] [Google Scholar]
- Cha JH, Kosinski CM, Kerner JA, Alsdorf SA, Mangiarini L, Davies SW, Penney JB, Bates GP, Young AB. Altered brain neurotransmitter receptors in transgenic mice expressing a portion of an abnormal human huntington disease gene. Proc Natl Acad Sci U S A. 1998;95:6480–6485. doi: 10.1073/pnas.95.11.6480. [DOI] [PMC free article] [PubMed] [Google Scholar]
- Chin J, Palop JJ, Puoliväli J, Massaro C, Bien-Ly N, Gerstein H, Scearce-Levie K, Masliah E, Mucke L. Fyn kinase induces synaptic and cognitive impairments in a transgenic mouse model of Alzheimer's disease. J Neurosci. 2005;25:9694–9703. doi: 10.1523/JNEUROSCI.2980-05.2005. [DOI] [PMC free article] [PubMed] [Google Scholar]
- Choi YS, Lin SL, Lee B, Kurup P, Cho HY, Naegele JR, Lombroso PJ, Obrietan K. Status epilepticus-induced somatostatinergic hilar interneuron degeneration is regulated by striatal enriched protein tyrosine phosphatase. J Neurosci. 2007;27:2999–3009. doi: 10.1523/JNEUROSCI.4913-06.2007. [DOI] [PMC free article] [PubMed] [Google Scholar]
- Desplats PA, Kass KE, Gilmartin T, Stanwood GD, Woodward EL, Head SR, Sutcliffe JG, Thomas EA. Selective deficits in the expression of striatal-enriched mRNAs in Huntington's disease. J Neurochem. 2006;96:743–757. doi: 10.1111/j.1471-4159.2005.03588.x. [DOI] [PubMed] [Google Scholar]
- Díaz-Hernández M, Torres-Peraza J, Salvatori-Abarca A, Morán MA, Gómez-Ramos P, Alberch J, Lucas JJ. Full motor recovery despite striatal neuron loss and formation of irreversible amyloid-like inclusions in a conditional mouse model of Huntington's disease. J Neurosci. 2005;25:9773–9781. doi: 10.1523/JNEUROSCI.3183-05.2005. [DOI] [PMC free article] [PubMed] [Google Scholar]
- Fan MM, Raymond LA. N-methyl-d-aspartate (NMDA) receptor function and excitotoxicity in Huntington's disease. Prog Neurobiol. 2007;81:272–293. doi: 10.1016/j.pneurobio.2006.11.003. [DOI] [PubMed] [Google Scholar]
- Fujishige K, Kotera J, Michibata H, Yuasa K, Takebayashi S, Okumura K, Omori K. Cloning and characterization of a novel human phosphodiesterase that hydrolyzes both cAMP and cGMP (PDE10A) J Biol Chem. 1999;274:18438–18445. doi: 10.1074/jbc.274.26.18438. [DOI] [PubMed] [Google Scholar]
- García-Martínez JM, Pérez-Navarro E, Xifró X, Canals JM, Díaz-Hernández M, Trioulier Y, Brouillet E, Lucas JJ, Alberch J. BH3-only proteins Bid and Bim(EL) are differentially involved in neuronal dysfunction in mouse models of Huntington's disease. J Neurosci Res. 2007;85:2756–2769. doi: 10.1002/jnr.21258. [DOI] [PubMed] [Google Scholar]
- Giampà C, Patassini S, Borreca A, Laurenti D, Marullo F, Bernardi G, Menniti FS, Fusco FR. Phosphodiesterase 10 inhibition reduces striatal excitotoxicity in the quinolinic acid model of Huntington's disease. Neurobiol Dis. 2009;34:450–456. doi: 10.1016/j.nbd.2009.02.014. [DOI] [PubMed] [Google Scholar]
- Gianfriddo M, Melani A, Turchi D, Giovannini MG, Pedata F. Adenosine and glutamate extracellular concentrations and mitogen-activated protein kinases in the striatum of Huntington transgenic mice. Selective antagonism of adenosine A2A receptors reduces transmitter outflow. Neurobiol Dis. 2004;17:77–88. doi: 10.1016/j.nbd.2004.05.008. [DOI] [PubMed] [Google Scholar]
- Giralt A, Rodrigo T, Martín ED, Gonzalez JR, Milà M, Ceña V, Dierssen M, Canals JM, Alberch J. Brain-derived neurotrophic factor modulates the severity of cognitive alterations induced by mutant huntingtin: involvement of phospholipase Cgamma activity and glutamate receptor expression. Neuroscience. 2009;158:1234–1250. doi: 10.1016/j.neuroscience.2008.11.024. [DOI] [PubMed] [Google Scholar]
- Gomez GT, Hu H, McCaw EA, Denovan-Wright EM. Brain-specific factors in combination with mutant huntingtin induce gene-specific transcriptional dysregulation. Mol Cell Neurosci. 2006;31:661–675. doi: 10.1016/j.mcn.2005.12.004. [DOI] [PubMed] [Google Scholar]
- Gong B, Cao Z, Zheng P, Vitolo OV, Liu S, Staniszewski A, Moolman D, Zhang H, Shelanski M, Arancio O. Ubiquitin hydrolase Uch-L1 rescues beta-amyloid-induced decreases in synaptic function and contextual memory. Cell. 2006;126:775–788. doi: 10.1016/j.cell.2006.06.046. [DOI] [PubMed] [Google Scholar]
- Graham RK, Pouladi MA, Joshi P, Lu G, Deng Y, Wu NP, Figueroa BE, Metzler M, André VM, Slow EJ, Raymond L, Friedlander R, Levine MS, Leavitt BR, Hayden MR. Differential susceptibility to excitotoxic stress in YAC128 mouse models of Huntington disease between initiation and progression of disease. J Neurosci. 2009;29:2193–2204. doi: 10.1523/JNEUROSCI.5473-08.2009. [DOI] [PMC free article] [PubMed] [Google Scholar]
- Halpain S, Girault JA, Greengard P. Activation of NMDA receptors induces dephosphorylation of DARPP-32 in rat striatal slices. Nature. 1990;343:369–372. doi: 10.1038/343369a0. [DOI] [PubMed] [Google Scholar]
- Hansson O, Petersén A, Leist M, Nicotera P, Castilho RF, Brundin P. Transgenic mice expressing a Huntington's disease mutation are resistant to quinolinic acid-induced striatal excitotoxicity. Proc Natl Acad Sci U S A. 1999;96:8727–8732. doi: 10.1073/pnas.96.15.8727. [DOI] [PMC free article] [PubMed] [Google Scholar]
- Hansson O, Guatteo E, Mercuri NB, Bernardi G, Li XJ, Castilho RF, Brundin P. Resistance to NMDA toxicity correlates with appearance of nuclear inclusions, behavioural deficits and changes in calcium homeostasis in mice transgenic for exon 1 of the huntington gene. Eur J Neurosci. 2001;14:1492–1504. doi: 10.1046/j.0953-816x.2001.01767.x. [DOI] [PubMed] [Google Scholar]
- Hebb AL, Robertson HA, Denovan-Wright EM. Striatal phosphodiesterase mRNA and protein levels are reduced in Huntington's disease transgenic mice prior to the onset of motor symptoms. Neuroscience. 2004;123:967–981. doi: 10.1016/j.neuroscience.2003.11.009. [DOI] [PubMed] [Google Scholar]
- Hemmings HC, Jr, Greengard P, Tung HY, Cohen P. DARPP-32, a dopamine-regulated neuronal phosphoprotein, is a potent inhibitor of protein phosphatase-1. Nature. 1984;310:503–505. doi: 10.1038/310503a0. [DOI] [PubMed] [Google Scholar]
- Hodges A, Strand AD, Aragaki AK, Kuhn A, Sengstag T, Hughes G, Elliston LA, Hartog C, Goldstein DR, Thu D, Hollingsworth ZR, Collin F, Synek B, Holmans PA, Young AB, Wexler NS, Delorenzi M, Kooperberg C, Augood SJ, Faull RL, Olson JM, Jones L, Luthi-Carter R. Regional and cellular gene expression changes in human Huntington's disease brain. Hum Mol Genet. 2006;15:965–977. doi: 10.1093/hmg/ddl013. [DOI] [PubMed] [Google Scholar]
- Hu H, McCaw EA, Hebb AL, Gomez GT, Denovan-Wright EM. Mutant huntingtin affects the rate of transcription of striatum-specific isoforms of phosphodiesterase 10A. Eur J Neurosci. 2004;20:3351–3363. doi: 10.1111/j.1460-9568.2004.03796.x. [DOI] [PubMed] [Google Scholar]
- Irving EA, Barone FC, Reith AD, Hadingham SJ, Parsons AA. Differential activation of MAPK/ERK and p38/SAPK in neurones and glia following focal cerebral ischaemia in the rat. Brain Res Mol Brain Res. 2000;77:65–75. doi: 10.1016/s0169-328x(00)00043-7. [DOI] [PubMed] [Google Scholar]
- Ivanov A, Pellegrino C, Rama S, Dumalska I, Salyha Y, Ben-Ari Y, Medina I. Opposing role of synaptic and extrasynaptic NMDA receptors in regulation of the extracellular signal-regulated kinases (ERK) activity in cultured rat hippocampal neurons. J Physiol. 2006;572:789–798. doi: 10.1113/jphysiol.2006.105510. [DOI] [PMC free article] [PubMed] [Google Scholar]
- Jakel RJ, Maragos WF. Neuronal cell death in Huntington's disease: a potential role for dopamine. Trends Neurosci. 2000;23:239–245. doi: 10.1016/s0166-2236(00)01568-x. [DOI] [PubMed] [Google Scholar]
- Jarabek BR, Yasuda RP, Wolfe BB. Regulation of proteins affecting NMDA receptor-induced excitotoxicity in a Huntington's mouse model. Brain. 2004;127:505–516. doi: 10.1093/brain/awh058. [DOI] [PubMed] [Google Scholar]
- Jiang H, Zhang L, Koubi D, Kuo J, Groc L, Rodriguez AI, Hunter TJ, Tang S, Lazarovici P, Gautam SC, Levine RA. Roles of Ras-Erk in apoptosis of PC12 cells induced by trophic factor withdrawal or oxidative stress. J Mol Neurosci. 2005;25:133–140. doi: 10.1385/JMN:25:2:133. [DOI] [PubMed] [Google Scholar]
- Kuchibhotla KV, Goldman ST, Lattarulo CR, Wu HY, Hyman BT, Bacskai BJ. Abeta plaques lead to aberrant regulation of calcium homeostasis in vivo resulting in structural and functional disruption of neuronal networks. Neuron. 2008;59:214–225. doi: 10.1016/j.neuron.2008.06.008. [DOI] [PMC free article] [PubMed] [Google Scholar]
- Kurup P, Zhang Y, Xu J, Venkitaramani DV, Haroutunian V, Greengard P, Nairn AC, Lombroso PJ. Aβ-mediated NMDA receptor endocytosis in Alzheimer's disease involves ubiquitination of the tyrosine phosphatase STEP61. J Neurosci. 2010;30:5948–5957. doi: 10.1523/JNEUROSCI.0157-10.2010. [DOI] [PMC free article] [PubMed] [Google Scholar]
- Lee HK. Synaptic plasticity and phosphorylation. Pharmacol Ther. 2006;112:810–832. doi: 10.1016/j.pharmthera.2006.06.003. [DOI] [PMC free article] [PubMed] [Google Scholar]
- Léveillé F, El Gaamouch F, Gouix E, Lecocq M, Lobner D, Nicole O, Buisson A. Neuronal viability is controlled by a functional relation between synaptic and extrasynaptic NMDA receptors. FASEB J. 2008;22:4258–4271. doi: 10.1096/fj.08-107268. [DOI] [PubMed] [Google Scholar]
- Liévens JC, Woodman B, Mahal A, Bates GP. Abnormal phosphorylation of synapsin I predicts a neuronal transmission impairment in the R6/2 Huntington's disease transgenic mice. Mol Cell Neurosci. 2002;20:638–648. doi: 10.1006/mcne.2002.1152. [DOI] [PubMed] [Google Scholar]
- Lombroso PJ, Murdoch G, Lerner M. Molecular characterization of a protein-tyrosine-phosphatase enriched in striatum. Proc Natl Acad Sci U S A. 1991;88:7242–7246. doi: 10.1073/pnas.88.16.7242. [DOI] [PMC free article] [PubMed] [Google Scholar]
- Luthi-Carter R, Strand A, Peters NL, Solano SM, Hollingsworth ZR, Menon AS, Frey AS, Spektor BS, Penney EB, Schilling G, Ross CA, Borchelt DR, Tapscott SJ, Young AB, Cha JH, Olson JM. Decreased expression of striatal signaling genes in a mouse model of Huntington's disease. Hum Mol Genet. 2000;9:1259–1271. doi: 10.1093/hmg/9.9.1259. [DOI] [PubMed] [Google Scholar]
- Maher P, Dargusch R, Bodai L, Gerard PE, Purcell JM, Marsh JL. ERK activation by the polyphenols fisetin and resveratrol provides neuroprotection in multiple models of Huntington's disease. Hum Mol Genet. 2011;20:261–270. doi: 10.1093/hmg/ddq460. [DOI] [PMC free article] [PubMed] [Google Scholar]
- Mangiarini L, Sathasivam K, Seller M, Cozens B, Harper A, Hetherington C, Lawton M, Trottier Y, Lehrach H, Davies SW, Bates GP. Exon 1 of the HD gene with an expanded CAG repeat is sufficient to cause a progressive neurological phenotype in transgenic mice. Cell. 1996;87:493–506. doi: 10.1016/s0092-8674(00)81369-0. [DOI] [PubMed] [Google Scholar]
- Milnerwood AJ, Gladding CM, Pouladi MA, Kaufman AM, Hines RM, Boyd JD, Ko RW, Vasuta OC, Graham RK, Hayden MR, Murphy TH, Raymond LA. Early increase in extrasynaptic NMDA receptor signaling and expression contributes to phenotype onset in Huntington's disease mice. Neuron. 2010;65:178–190. doi: 10.1016/j.neuron.2010.01.008. [DOI] [PubMed] [Google Scholar]
- Muñoz JJ, Tárrega C, Blanco-Aparicio C, Pulido R. Differential interaction of the tyrosine phosphatases PTP-SL, STEP and HePTP with the mitogen-activated protein kinases ERK1/2 and p38alpha is determined by a kinase specificity sequence and influenced by reducing agents. Biochem J. 2003;372:193–201. doi: 10.1042/BJ20021941. [DOI] [PMC free article] [PubMed] [Google Scholar]
- Nguyen TH, Paul S, Xu Y, Gurd JW, Lombroso PJ. Calcium-dependent cleavage of striatal enriched tyrosine phosphatase (STEP) J Neurochem. 1999;73:1995–2001. [PubMed] [Google Scholar]
- Nguyen TH, Liu J, Lombroso PJ. Striatal enriched phosphatase 61 dephosphorylates Fyn at phosphotyrosine 420. J Biol Chem. 2002;277:24274–24279. doi: 10.1074/jbc.M111683200. [DOI] [PubMed] [Google Scholar]
- Okamoto S, Pouladi MA, Talantova M, Yao D, Xia P, Ehrnhoefer DE, Zaidi R, Clemente A, Kaul M, Graham RK, Zhang D, Vincent Chen HS, Tong G, Hayden MR, Lipton SA. Balance between synaptic versus extrasynaptic NMDA receptor activity influences inclusions and neurotoxicity of mutant huntingtin. Nat Med. 2009;15:1407–1413. doi: 10.1038/nm.2056. [DOI] [PMC free article] [PubMed] [Google Scholar]
- Paoletti P, Vila I, Rifé M, Lizcano JM, Alberch J, Ginés S. Dopaminergic and glutamatergic signaling crosstalk in Huntington's disease neurodegeneration: the role of p25/cyclin-dependent kinase 5. J Neurosci. 2008;28:10090–10101. doi: 10.1523/JNEUROSCI.3237-08.2008. [DOI] [PMC free article] [PubMed] [Google Scholar]
- Paul S, Snyder GL, Yokakura H, Picciotto MR, Nairn AC, Lombroso PJ. The dopamine/D1 receptor mediates the phosphorylation and inactivation of the protein tyrosine phosphatase STEP via a PKA-dependent pathway. J Neurosci. 2000;20:5630–5638. doi: 10.1523/JNEUROSCI.20-15-05630.2000. [DOI] [PMC free article] [PubMed] [Google Scholar]
- Paul S, Nairn AC, Wang P, Lombroso PJ. NMDA-mediated activation of the tyrosine phosphatase STEP regulates the duration of ERK signaling. Nat Neurosci. 2003;6:34–42. doi: 10.1038/nn989. [DOI] [PubMed] [Google Scholar]
- Pelkey KA, Askalan R, Paul S, Kalia LV, Nguyen TH, Pitcher GM, Salter MW, Lombroso PJ. Tyrosine phosphatase STEP is a tonic brake on induction of long-term potentiation. Neuron. 2002;34:127–138. doi: 10.1016/s0896-6273(02)00633-5. [DOI] [PubMed] [Google Scholar]
- Pérez-Navarro E, Canudas AM, Akerund P, Alberch J, Arenas E. Brain-derived neurotrophic factor, neurotrophin-3, and neurotrophin-4/5 prevent the death of striatal projection neurons in a rodent model of Huntington's disease. J Neurochem. 2000;75:2190–2199. doi: 10.1046/j.1471-4159.2000.0752190.x. [DOI] [PubMed] [Google Scholar]
- Pérez-Navarro E, Canals JM, Ginés S, Alberch J. Cellular and molecular mechanisms involved in the selective vulnerability of striatal projection neurons in Huntington's disease. Histol Histopathol. 2006;21:1217–1232. doi: 10.14670/HH-21.1217. [DOI] [PubMed] [Google Scholar]
- Pulido R, Zúñiga A, Ullrich A. PTP-SL and STEP protein tyrosine phosphatases regulate the activation of the extracellular signal-regulated kinases ERK1 and ERK2 by association through a kinase interaction motif. EMBO J. 1998;17:7337–7350. doi: 10.1093/emboj/17.24.7337. [DOI] [PMC free article] [PubMed] [Google Scholar]
- Reiner A, Albin RL, Anderson KD, D'Amato CJ, Penney JB, Young AB. Differential loss of striatal projection neurons in Huntington disease. Proc Natl Acad Sci U S A. 1988;85:5733–5737. doi: 10.1073/pnas.85.15.5733. [DOI] [PMC free article] [PubMed] [Google Scholar]
- Roze E, Betuing S, Deyts C, Marcon E, Brami-Cherrier K, Pagès C, Humbert S, Mérienne K, Caboche J. Mitogen- and stress-activated protein kinase-1 deficiency is involved in expanded-huntingtin-induced transcriptional dysregulation and striatal death. FASEB J. 2008;22:1083–1093. doi: 10.1096/fj.07-9814. [DOI] [PubMed] [Google Scholar]
- Saavedra A, García-Martínez JM, Xifró X, Giralt A, Torres-Peraza JF, Canals JM, Díaz-Hernández M, Lucas JJ, Alberch J, Pérez-Navarro E. PH domain leucine-rich repeat protein phosphatase 1 contributes to maintain the activation of the PI3K/Akt pro-survival pathway in Huntington's disease striatum. Cell Death Differ. 2010;17:324–335. doi: 10.1038/cdd.2009.127. [DOI] [PubMed] [Google Scholar]
- Schmued LC, Albertson C, Slikker W., Jr Fluoro-Jade: a novel fluorochrome for the sensitive and reliable histochemical localization of neuronal degeneration. Brain Res. 1997;751:37–46. doi: 10.1016/s0006-8993(96)01387-x. [DOI] [PubMed] [Google Scholar]
- Schwarcz R, Guidetti P, Sathyasaikumar KV, Muchowski PJ. Of mice, rats and men: Revisiting the quinolinic acid hypothesis of Huntington's disease. Prog Neurobiol. 2010;90:230–245. doi: 10.1016/j.pneurobio.2009.04.005. [DOI] [PMC free article] [PubMed] [Google Scholar]
- Seeger TF, Bartlett B, Coskran TM, Culp JS, James LC, Krull DL, Lanfear J, Ryan AM, Schmidt CJ, Strick CA, Varghese AH, Williams RD, Wylie PG, Menniti FS. Immunohistochemical localization of PDE10A in the rat brain. Brain Res. 2003;985:113–126. doi: 10.1016/s0006-8993(03)02754-9. [DOI] [PubMed] [Google Scholar]
- Siuciak JA, Chapin DS, Harms JF, Lebel LA, McCarthy SA, Chambers L, Shrikhande A, Wong S, Menniti FS, Schmidt CJ. Inhibition of the striatum-enriched phosphodiesterase PDE10A: a novel approach to the treatment of psychosis. Neuropharmacology. 2006;51:386–396. doi: 10.1016/j.neuropharm.2006.04.013. [DOI] [PubMed] [Google Scholar]
- Snyder EM, Nong Y, Almeida CG, Paul S, Moran T, Choi EY, Nairn AC, Salter MW, Lombroso PJ, Gouras GK, Greengard P. Regulation of NMDA receptor trafficking by amyloid-beta. Nat Neurosci. 2005;8:1051–1058. doi: 10.1038/nn1503. [DOI] [PubMed] [Google Scholar]
- Spektor BS, Miller DW, Hollingsworth ZR, Kaneko YA, Solano SM, Johnson JM, Penney JB, Jr, Young AB, Luthi-Carter R. Differential D1 and D2 receptor-mediated effects on immediate early gene induction in a transgenic mouse model of Huntington's disease. Brain Res Mol Brain Res. 2002;102:118–128. doi: 10.1016/s0169-328x(02)00216-4. [DOI] [PubMed] [Google Scholar]
- Stoof JC, Kebabian JW. Opposing roles for D-1 and D-2 dopamine receptors in efflux of cyclic AMP from rat neostriatum. Nature. 1981;294:366–368. doi: 10.1038/294366a0. [DOI] [PubMed] [Google Scholar]
- Tang TS, Chen X, Liu J, Bezprozvanny I. Dopaminergic signaling and striatal neurodegeneration in Huntington's disease. J Neurosci. 2007;27:7899–7910. doi: 10.1523/JNEUROSCI.1396-07.2007. [DOI] [PMC free article] [PubMed] [Google Scholar]
- The Huntington's Disease Collaborative Research Group. A novel gene containing a trinucleotide repeat that is expanded and unstable on Huntington's disease chromosomes. Cell. 1993;72:971–983. doi: 10.1016/0092-8674(93)90585-e. [DOI] [PubMed] [Google Scholar]
- Tingley WG, Ehlers MD, Kameyama K, Doherty C, Ptak JB, Riley CT, Huganir RL. Characterization of protein kinase A and protein kinase C phosphorylation of the N-methyl-d-aspartate receptor NR1 subunit using phosphorylation site-specific antibodies. J Biol Chem. 1997;272:5157–5166. doi: 10.1074/jbc.272.8.5157. [DOI] [PubMed] [Google Scholar]
- Torres-Peraza JF, Giralt A, García-Martínez JM, Pedrosa E, Canals JM, Alberch J. Disruption of striatal glutamatergic transmission induced by mutant huntingtin involves remodeling of both postsynaptic density and NMDA receptor signaling. Neurobiol Dis. 2008;29:409–421. doi: 10.1016/j.nbd.2007.10.003. [DOI] [PubMed] [Google Scholar]
- Valjent E, Pascoli V, Svenningsson P, Paul S, Enslen H, Corvol JC, Stipanovich A, Caboche J, Lombroso PJ, Nairn AC, Greengard P, Hervé D, Girault JA. Regulation of a protein phosphatase cascade allows convergent dopamine and glutamate signals to activate ERK in the striatum. Proc Natl Acad Sci U S A. 2005;102:491–496. doi: 10.1073/pnas.0408305102. [DOI] [PMC free article] [PubMed] [Google Scholar]
- van Dellen A, Welch J, Dixon RM, Cordery P, York D, Styles P, Blakemore C, Hannan AJ. N-Acetylaspartate and DARPP-32 levels decrease in the corpus striatum of Huntington's disease mice. Neuroreport. 2000;11:3751–3757. doi: 10.1097/00001756-200011270-00032. [DOI] [PubMed] [Google Scholar]
- Venkitaramani DV, Paul S, Zhang Y, Kurup P, Ding L, Tressler L, Allen M, Sacca R, Picciotto MR, Lombroso PJ. Knockout of striatal enriched protein tyrosine phosphatase in mice results in increased ERK1/2 phosphorylation. Synapse. 2009;63:69–81. doi: 10.1002/syn.20608. [DOI] [PMC free article] [PubMed] [Google Scholar]
- Wheeler VC, Auerbach W, White JK, Srinidhi J, Auerbach A, Ryan A, Duyao MP, Vrbanac V, Weaver M, Gusella JF, Joyner AL, MacDonald ME. Length-dependent gametic CAG repeat instability in the Huntington's disease knock-in mouse. Hum Mol Genet. 1999;8:115–122. doi: 10.1093/hmg/8.1.115. [DOI] [PubMed] [Google Scholar]
- Xie Z, Adamowicz WO, Eldred WD, Jakowski AB, Kleiman RJ, Morton DG, Stephenson DT, Strick CA, Williams RD, Menniti FS. Cellular and subcellular localization of PDE10A, a striatum-enriched phosphodiesterase. Neuroscience. 2006;139:597–607. doi: 10.1016/j.neuroscience.2005.12.042. [DOI] [PMC free article] [PubMed] [Google Scholar]
- Xifró X, Giralt A, Saavedra A, García-Martínez JM, Díaz-Hernández M, Lucas JJ, Alberch J, Pérez-Navarro E. Reduced calcineurin protein levels and activity in exon-1 mouse models of Huntington's disease: role in excitotoxicity. Neurobiol Dis. 2009;36:461–469. doi: 10.1016/j.nbd.2009.08.012. [DOI] [PubMed] [Google Scholar]
- Xu J, Kurup P, Zhang Y, Goebel-Goody SM, Wu PH, Hawasli AH, Baum ML, Bibb JA, Lombroso PJ. Extrasynaptic NMDA receptors couple preferentially to excitotoxicity via calpain-mediated cleavage of STEP. J Neurosci. 2009;29:9330–9343. doi: 10.1523/JNEUROSCI.2212-09.2009. [DOI] [PMC free article] [PubMed] [Google Scholar]
- Yamamoto A, Lucas JJ, Hen R. Reversal of neuropathology and motor dysfunction in a conditional model of Huntington's disease. Cell. 2000;101:57–66. doi: 10.1016/S0092-8674(00)80623-6. [DOI] [PubMed] [Google Scholar]
- Zhang Y, Venkitaramani DV, Gladding CM, Zhang Y, Kurup P, Molnar E, Collingridge GL, Lombroso PJ. The tyrosine phosphatase STEP mediates AMPA receptor endocytosis after metabotropic glutamate receptor stimulation. J Neurosci. 2008;28:10561–10566. doi: 10.1523/JNEUROSCI.2666-08.2008. [DOI] [PMC free article] [PubMed] [Google Scholar]
- Zhang Y, Kurup P, Xu J, Carty N, Fernandez SM, Nygaard HB, Pittenger C, Greengard P, Strittmatter SM, Nairn AC, Lombroso PJ. Genetic reduction of striatal-enriched tyrosine phosphatase (STEP) reverses cognitive and cellular deficits in an Alzheimer's disease mouse model. Proc Natl Acad Sci U S A. 2010;107:19014–19019. doi: 10.1073/pnas.1013543107. [DOI] [PMC free article] [PubMed] [Google Scholar]