

Abstract
Single-cell microscopy studies have the potential to provide an unprecedented view of gene expression with exquisite spatial and temporal sensitivity. However, there is a challenge to connect the holistic cellular view with a reductionist biochemical view. In particular, experimental efforts to characterize the in vivo regulation of transcription have focused primarily on measurements of the dynamics of transcription factors and chromatin modifying factors. Such measurements have elucidated the transient nature of many nuclear interactions. In the last few years, experimental approaches have emerged which allow for interrogation of the output of transcription at the single-molecule, single-cell level. Here, I summarize the experimental results and models which aim to provide an integrated view of transcriptional regulation.
A cellular approach is necessary to understand the interplay between transcription factors, chromatin modifying enzymes, RNA polymerases, splicing factors, ribosomes, nucleases, and proteases, which are only a few of the major players which control the complement of mRNA and protein in the cell. In recent years, single-cell imaging has played a vital role in elucidating the rules by which these pathways control gene expression. The benefit of imaging intact cells is that one is able to see the integrated picture of gene regulation. The disadvantage of imaging is that it can be difficult to interrogate specific biochemical mechanisms. In this review, I focus on what imaging studies tell us about the nature of these biochemical interactions as they occur in the cell. In particular, I will focus on transcription as a primary regulatory step in gene expression and will relate what is known about the ‘upstream’ regulators of transcription to the ‘downstream’ products of transcription.
Over the past decade, single-cell imaging in both living and fixed cells has solidified two major principles of gene expression: 1) many interactions between upstream regulatory molecules and chromatin are transient (on the order of seconds) [1-2] and 2) downstream gene expression products display considerable variation from cell to cell [3-4]. These two principles are not axiomatically consistent with each other: models which account for dynamic behavior of upstream regulators place necessary limitations on downstream gene expression variation. Or, stated another way, the observation of expression dynamics places constraints both on the nuclear dynamics of regulators and indeed the number of regulators involved in modulating the gene. In this way, the dynamic ‘signature’ of a gene may be an important indication of how the gene is regulated. Recently, several groups have reported real-time imaging studies of gene expression in bacteria, yeast and higher eukaryotes which indicate that although these signatures depend on the gene and the organism, there are also general principles which seem to apply across genes [5-8]. In sum, we are only beginning to understand the role that expression dynamics might play in determining phenotype or how interactions between regulatory molecules and DNA might encode such dynamics.
Imaging gene expression in single cells
The heterogeneous nature of gene expression on the cellular level has been observed in the microscope for several decades. Early studies using β-galactosidase as a fluorogenic readout for lacZ expression indicated that when the lacZ reporter gene was driven off of the promoter of interest, one observed cells which showed lacZ enzymatic activity and those which did not. After T-cell activation, a bimodal distribution of expression was observed with the quantitative distribution changing with integration site of the reporter [9]. Likewise, increasing levels of T-cell activation corresponded to increasing the fraction of active cells, but not increased levels within those cells [10]. Similarly, single-cell imaging of MMTV promoter activity demonstrated that increasing concentration of steroid results in an increasing fraction of responsive cells rather than a homogeneous increase in levels within all cells [11]. Furthermore, MMTV-driven genes were observed to have a refractory period in gene expression that is not due to down-regulation of receptors but likely to “resetting” the chromatin template [12]. Thus, snapshots of gene activity were appreciated to be single time points in an evolving landscape of discontinuous gene expression, where active periods were separated by inactive periods [13]. This view was confirmed by extending the study of gene expression heterogeneity into the time dimension with luciferase reporters [14]. Finally, a mathematical grounding for these observations was developed by Peccoud and Ycart [15], who assumed that expression heterogeneity originated in the act of transcription.
So from these earlier studies, we know that: gene expression is heterogeneous, transcription can display an “on” or “off” behavior, there can be a lower limit to the duration of the off period (“refractory period”), integration site is important, and digital dose responses in single cells can masquerade as analog dose response across a population. Over the last 20 years, however, the interpretation and implications of these phenomena have remained frustratingly opaque. Recently, through the development of a suite of new experimental tools, one is able to visualize gene expression at earlier stages (by imaging RNA in addition to protein) [5-6,16-23], at higher time resolution (by using sensitive reporters with short lifetimes in the cell) [7-8], and under more physiological conditions (by looking at genes under endogenous regulation) [6,8,16,24] (Box1, Figure 1). These data are increasingly analyzed in terms of the two-state model of transcription which is emerging as a “standard model of gene expression”. Although this description is only phenomenological it provides a standard platform for comparing experimental results.
Box 1. Experimental Methods for Determining Transcription Dynamics.
To observe transcription at the single-cell level, recent approaches have relied on both direct and indirect measurements. The only direct measurement of transcriptional activity is observing pre-mRNA synthesis at the active locus. Indirect methods consist of measuring cellular mRNA and/or protein product and inferring transcriptional dynamics with mathematical modeling.
Fluorescence in situ hybridization (FISH)
The FISH technique relies on fluorescently-labeled DNA oligos hybridized to RNA in fixed cells. This methodology is capable of detecting single RNAs, allowing one both to count the number of total mRNA in the cell and also determine the number of nascent pre-mRNA at the active transcription site [75]. The advantage of this approach is that one can observe endogenous transcripts. Moreover, it is possible to record the probability distribution of gene expression which contains a great deal of information about the dynamics of transcription [3].
MS2 and PP7 RNA-binding proteins
These proteins are bacteriophage capsid proteins which bind a specific RNA stem-loop structure with high affinity. They have been extensively modified for imaging RNA in living cells [76-77]. The system consists of two parts: 1) the reporter construct which contains a DNA cassette coding for multimerized RNA stem loops (typically ~ 24 stem loops) and 2) the constitutively expressed MS2 or PP7 capsid protein which is tagged with a fluorescent protein. When the reporter gene stem loop region is transcribed, the capsid protein binds the RNA with high affinity, resulting in an active transcription site which appears as a bright fluorescent spot above the background. The advantage of this system is that pre-mRNA synthesis dynamics can be directly observed at the single-gene, single-RNA level.
Destabilized Reporter Proteins
These genetically encoded reporters are engineered to have a short half-life (~ 20 minutes) in the cell [8,78]. Long-lived protein reporters can obscure the dynamics of transcription, so by using de-stabilized GFP and luciferase one can recover upstream kinetics with the added benefit of the amplification which comes from the translation of many protein copies from a single mRNA. The advantage of this system is the ability to visualize the full gamut of gene expression control which results in a particular protein level.
Figure 1.
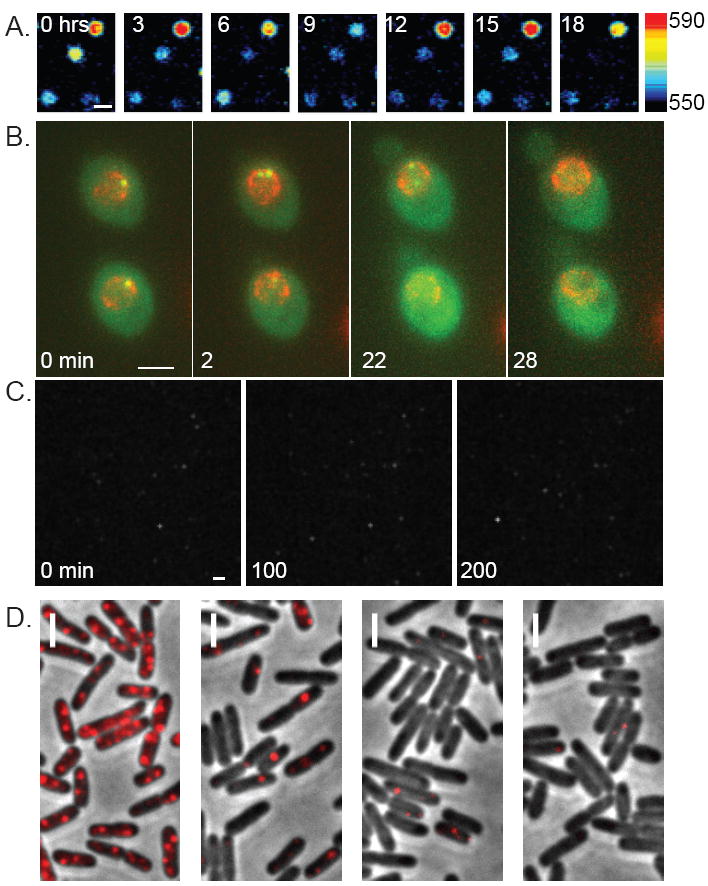
Single-Cell Gene Expression. A) Dynamics of the prolactin promoter in rat pituitary cells observed by measuring the activity of a luciferase reporter (Scale=25 μm). [7]. B) Live-cell visualization of transcription of the POL1 gene in S. cerevisae using the PP7 system (Scale=3μm) [6]. C) Time-lapse imaging of CCAAT-luciferase in the H1 NIH-3T3 cell line (Scale=20 μm) [8]. D) Single molecule FISH of Plac promoter gene expression level in E. coli (Scale=2 μm) [5].
Downstream dynamics: the Two-State Model
The two-state model posits that a gene will toggle between inactive and active states, with transcripts being produced only during the active state (Figure 2). A special case of this general model is the instance where the transitions between active and inactive states and also the transcript initiation events from the active state are each controlled by single rate-limiting steps. This case corresponds to the “Random Telegraph Model” as introduced for transcription by Peccoud and Ycart [15,25-27]. The telegraph model is a discrete, stochastic description of gene expression which takes into account the probabilistic nature of mRNA synthesis and decay and the subsequent translation of mRNA into protein. Thus, it is a mathematical description which accounts for both the mean and the variation of gene expression.
Figure 2.
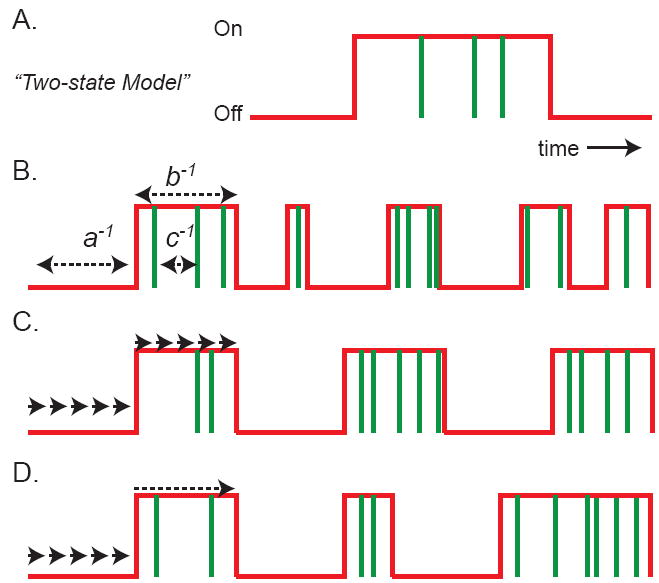
The two-state model of gene expression. A) The promoter activity (red line) toggles between two states, “off” and “on”. During the active state (promoter “on”), transcripts are produced, indicated by vertical green lines. B) A special case of the two-state model is the random telegraph model, where the rates of transition and transcription initiation are all determined by single rate-limiting steps (a, b, c), resulting in average intervals of a-1, b-1, c-1. Rate constants a, b, c are units of inverse time, but often the RNA decay rate in the cytosol is used to normalize these rates to produce unit-less quantities. The “burst parameter” is the number of transcripts produced per active state (c/b). Frequency modulation results from changing a; burst-size modulation results from changing either c or b; transcription rate modulation results from changing c. C) The opposite extreme of the telegraph model is the case where transitions are determined by many sequential steps, none of which are rate limiting. Each “step” is depicted by an arrow. D) The intermediate case is one in which activation requires many steps, corresponding to sequential activation or ordered recruitment, but the de-activation is determined by a single rate-limiting step. This scheme is consistent with the observation that transcription in higher eukaryotes is hard to turn on but easy to turn off.
The two-state model can be used to infer transcription dynamics from steady state distribution of mRNA and protein, and it can also be used to classify transcription dynamics from live-cell studies. Initial studies in slime mold, bacteria, and mammalian cells determined that transcription was best-described by transcriptional bursting [22,26,28]. Recent work in Dictyostelium, demonstrated that the frequency of transcriptional bursting is not only variable over the population but is also a heritable trait dependent on histone methylation [17]. In contrast, a cAMP-responsive gene showed remarkable stability in bursting kinetics over a range of doses [19]. Importantly, the duration of the active period was exponentially distributed, suggesting a single rate-limiting biochemical step for turning the gene off. This same observation of exponentially distributed active periods has now been made on a number of genes and seems to be one of the few universal features of eukaryotic transcription, as described below.
The duration of active and inactive states of the gene provides important clues about the factors which control transcription. Indeed, it is the experimental ability to place precise limits on these transcription dynamics with imaging which has increased dramatically in recent years. For example, two recent studies in mammalian cells used destabilized gene reporters to infer the dynamics of the gene through a combination of numerical modeling and time-lapse microscopy. Harper et al. looked at a luciferase reporter gene driven from the prolactin promoter in rat pituitary cells and observed pulsatile transcription with a period of 11 hours (~ 4 hours on and ~ 7 hours off). A similar study considered a range of luciferase reporters integrated into NIH 3T3 cells or primary mouse fibroblasts [8]. It is the first study to interrogate gene expression dynamics on a scale which allowed comparison across eukaryotic genes, leading to the conclusion that kinetic signatures were highly gene-specific. Both studies observed changes in transcriptional timing after disrupting chromatin [7-8], as observed previously [17,26,29]). Notably, in both studies the active state durations followed exponential distributions, suggesting that there is a single rate-limiting step for disabling active transcription in higher eukaryotes [7-8]. Also, both studies observed a refractory period during the inactive state. Experimentally, this refractory period is observed as a reset period after the gene turns off: there is an interval of time where transcription cannot turn back on once it has shut down. This refractory period is not observed in yeast [6] or bacteria [5] and may be a feature of a more complicated regulatory process.
The two-state model has now been broadly used to classify gene expression, resulting in descriptions where the frequency varies [30-34], the burst size varies [5,26,29,35-36], both vary [8,17], or the transcription rate varies [6,37]. There is no universal law of gene expression.
Indeed in yeast, transcriptional regulation follows a much simpler kinetic scheme. For many genes, a two-state description is unnecessary: the distribution of mRNA per cell is indistinguishable from a Poisson distribution, which suggests that mRNA levels are set by single rate-limiting biochemical steps for both transcription and decay [6,37-38]. In the only extant study to actually observe the relationship between an upstream transcription factor and a downstream transcription rate, we recently showed that the initiation rate of the POL1 promoter was consistent with the nuclear search times of the activator Mbp1p[6]. Moreover, by directly observing single gene transcription, we showed that there is no memory between initiation events as would be expected in a gene which shows bursting transcription. Thus, there is clear evidence that the dynamics of transcription differ between organisms and genes, raising the question about how downstream dynamics are determined by upstream factors.
Upstream dynamics: the Model of Promoter Progression
At the molecular level, the affinity of a DNA-binding transcription factor for a cognate binding sequence is of course key to understanding the role of that factor in regulation [39], but the kinetic components which make up the affinity (the on-rate and off-rate) are critical in dictating the mechanism of combinatorial assembly of transcription complexes [40]. Efforts to measure upstream dynamics have led to a seeming contradiction in timescales: biochemical methods such as ChIP, which probe interactions between nuclear proteins and chromatin, suggest slower dynamics (minutes to hours) than microscopy methods such as fluorescence recovery after photobleaching (FRAP) (seconds to minutes) [1-2,41-42]. The model which has been proposed to unify these different timescales is the model of “Promoter Progression” (aka “Return to Template” [43] or “Transcriptional Ratchet” [44]) which is related to an earlier model called “Kinetic Synergism” [45]. In the model of promoter progression, transient interactions between regulators and chromatin lead to stable changes in the chromatin template which accumulate over time until the promoter becomes active (Figure 3). There are two essential features of this model: 1) assembly of the active transcription complex is sequential and 2) the chromatin template is necessary for mediating the effects of sequential assembly. One implication of such a mechanism is that the number of upstream sequential steps has a profound impact on the kinetics of transcription. Several examples from yeast and higher eukaryotes illustrate the connection between promoter progression and transcriptional regulation.
Figure 3.
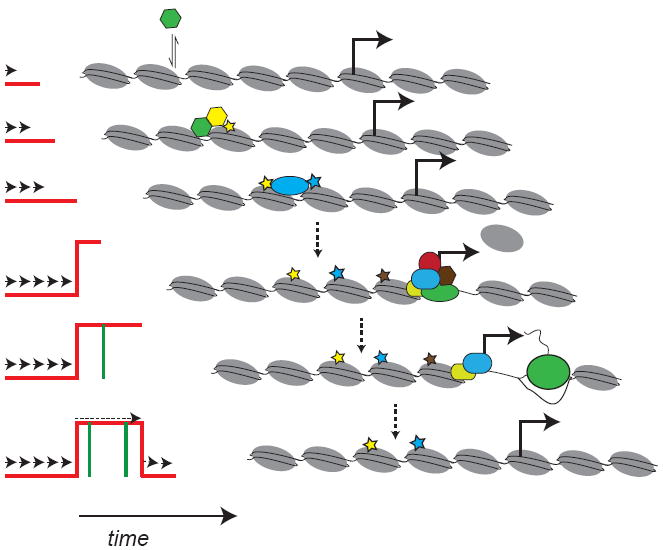
A hypothetical view of the relationship between nuclear dynamics and transcriptional regulation. The left column depicts the activity of the gene as a two-state process, and the right column is a schematic of corresponding events occurring at the gene. The model of promoter progression relies on fast activator dynamics (i.e. green hexagon coming on and off chromatin), resulting in recruitment of chromatin modifying enzymes (yellow hexagon), leading to meta-stable modifications of chromatin (yellow star). Many such sequential events result in a particular set of modifications (yellow, blue, brown stars), ending in recruitment of the basal transcription machinery and initiation of transcription (elongating RNAPII = green oval). The gene transitions to an inactive state after loss of an activating chromatin mark (i.e. the brown star) or possibly by turnover of the nucleosome.
Identifying the actual sequence of events during gene activation and then establishing the method of recruitment has turned out to be a surprisingly difficult task [46]. What is meant by the mechanism of “recruitment” in the context of ordered recruitment? An example of multi-step, ordered recruitment is the activation of the HO gene which encodes an endonuclease involved in yeast mating type switching. In that case, the activator Swi5p recruits the Swi/Snf chromatin remodeling complex, which exposes a binding site for the heterodimeric SBF complex (Swi4p/Swi6p) [47-49]. The first activator results in chromatin modifications (both nucleosome remodeling and histone acetylation) resulting in recruitment of a second activator which binds DNA and then recruits the basal transcription machinery. This alternating process – activator, chromatin modification, activator – is in principle the basis for promoter progression. What live-cell microscopy studies of transcription factor mobility suggest is that chromatin binding is too short for Swi5p to be present at the same time as SBF. For example, the closely related complex MBF was shown to have an interval between encounters of ~ 60 s and a dwell time of ~ 1 s in vivo [6]. The rate for two such factors acting independently to co-associate on the template is approximately once every 40 minutes. The net result is that recruitment which occurs purely through the interaction between two activators is extremely inefficient, necessitating a role for longer-lived chromatin modifications in mediating the effects of activators in multi-step processes.
Perhaps, the best example of fast and slow timescales on a single gene is the interaction of the Ace1p activator with the CUP1 promoter which exists as a natural tandem array of ~ 10 copies in yeast [50]. The activator has a fast dwell time on the tandem array of ~ 2 min, but also shows cycling on the array with a period of ~ 40 minutes in living cells. The authors determined that the slow cycling is due to the number of accessible promoters, while the fast cycling is due to the interaction of the activator with an individual promoter. In fact, Karpova et al. measured a direct interaction in vivo between Ace1p and the ATP-dependent chromatin remodeler Rsc2p using FRET and also showed that slow-cycling was abolished by a rsc2 deletion. Thus, this system demonstrates all the essential features of promoter progression: fast interactions between the activator and DNA resulting in direct recruitment of chromatin-modifying enzymes leading to slow dynamics in transcriptional behavior.
While the cases studied in yeast suggest sequential activation schemes with one or a few steps between sequence-specific activator binding and transcriptional activity, higher eukaryotic gene regulation is likely to involve many more steps. For example, time-resolved ChIP experiments on the estrogen-responsive genes TFF1 [51], reveal sequential activation involving the estrogen receptor, co-activators, co-repressors, histone acetyl-transferases, histone deacetylases, DNA methyltransferases, ATP-dependent chromatin remodelers, proteasomes, chaperones, general transcription factors, and more. The complex choreography of these factors results in a system which exhibits pronounced cycling of transcriptional activity with a period of approximately 45 minutes under conditions where the cells are synchronized through estradiol starvation or inhibitors such as α-amanitin or doxorubicin[52]. It has not yet been possible to observe transcriptional activity from such a gene in living cells, so the physiological relevance of such oscillations remains mysterious.
Integrated Model: What is the relationship between upstream factors and downstream dynamics?
It is precisely the dynamic interplay between DNA-binding factors, chromatin modifications and transcription that live-cell studies can illuminate. The model of promoter progression seeks to explain ordered, combinatorial recruitment of factors in the context of highly dynamic interactions between these same factors and DNA. The model relies on an intimate relationship between sequence-specific activators and chromatin modifying factors, where transient dwell times of activators can result in stable modifications of chromatin [53]. An extreme interpretation of the promoter-progression model is that no two factors are ever present on the template at the same time, which is of course in direct opposition to the notion of a holoenzyme view in which large complexes are parked on chromatin.
One implication of sequential activation is that there can be an appreciable time between the binding of the activator and the actual induction of transcription. This delay is one interpretation of the refractory time observed in single-cell microscopy studies [7-8]. The gene is alternating between active and inactive states, but after the gene transitions to an inactive period, there is a minimum length of time before transcription can be observed again. The refractory period, then, would reflect the sequence of states the promoter must progress through before RNAPII can transcribe the gene. In an extreme case, if the number of intermediate states is large, one can observe cyclic behavior in the absence of any feedback mechanisms [54]. It is tempting to speculate that in lower organisms the number of states would be small (or one), which is why no refractory period is observed in S. cerevisae and E. coli [5-6], while the number of states increases in higher organisms or for heavily regulated genes. In yeast, for example, the transcripts of many genes are Poisson-distributed [37-38,55-56], which is incompatible with multi-step activation. Interestingly, mating type switching in yeast is often described as a paradigm for a developmentally regulated gene, even though it is present in a single-cell eukaryote, and that gene displays clear evidence of multi-step activation. In the opposite extreme, metazoan stem cells exhibit global, low-level transcriptional activity [57], making their expression mechanism superficially more “yeast-like”. Loss of pluripotency and lineage specification correlates with a reduction of the actively transcribed portion of the genome, but those genes which are transcribed may also acquire the type of sequential activation described above. How the kinetics of transcription change during differentiation is unknown.
Once the gene is active, the period of activity is most likely set by the stability of a chromatin mark. So far, all studies of pulsatile transcription have observed an active state whose lifetime shows an exponential distribution in time [7-8,19]. These data suggest the active state shuts down by a single rate-limiting step. The time scales observed for the active state are consistent with measured stability of histones. For example, using a pulsed labeling strategy to measure genome-wide nucleosome turnover in Drosophila, Deal et al. measured a mean lifetime of ~ 1 hour [58]. In single HeLa cell FRAP measurements, the core components of the histone octamer show fluorescence recovery on the order of hours [59], in contrast to linker histone H1 which exchanges very rapidly [60]. Although these measurements do not measure the stability of a particular histone mark per se, the fact that histones turnover on the hour time scale sets an upper-limit for the duration of the active state [61]. The synergy between chromatin remodeling and transcription factor binding can also be reproduced in vitro, resulting in active and inactive transcriptional periods which bear a strong resemblance to those observed in single cells [62-63]. Of course, depending on the gene and the organism, intermediate strategies may be adopted. For instance, when TFIIH-YFP is expressed at endogenous levels in a knock-in mouse, the turnover of this general transcription factor is high in proliferating cells but low in non-proliferating cells, indicating that some protein-DNA interactions can be long-lived [64].
Summary
In yeast and bacteria, transcription seems to be dominated by single rate-limiting steps. These genes, in a sense, are easy to turn on. In contrast, the composite picture which emerges in higher eukaryotes is that genes are hard to turn on but easy to turn off (Figure 2D). In this sense, the nucleus is hostile to transcription, especially in differentiated metazoan cells which exhibit long refractory periods. Moreover, the rate of transcription is an emergent property of the sequence of events and not determined by any particular step in the sequence. In other words, if transcriptional activation is achieved by sequential recruitment of factors, then highly regulated genes (many steps) will by nature exhibit pulsatile transcription. The on/off behavior of transcription is a necessary consequence of promoter progression. One question is: does the cell exploit this pulsatility which is hard-wired in the mechanism of transcription? There is increasing evidence that the dynamics of upstream regulatory factors contain information that influences downstream expression [65-69]. Likewise, if bimodal expression is the rule and not the exception, it becomes necessary to re-assess how traditional dose-response curves reflect the actual biochemical events occurring at the promoter [70-71]. One potential consequence of pulsatile gene expression is that cells in a tissue might need to maintain de-synchronization between cells so that the population response in the tissue is stable over time [72-73].
At present, single-cell expression studies have focused on transcription, primarily because of the centrality of transcription in gene expression, but also because the tools now exist to study transcription at the single molecule, single gene level. Part of the difficulty lies in observing upstream and downstream dynamics simultaneously in the same cell. Moreover, while one can selectively label a gene of interest, it has thus far not been possible to selectively observe histone modification or even nucleosome dynamics on that gene in the fluorescence microscope. Ultimately, a comprehensive understanding of expression dynamics will also require methodology to interrogate other aspects of the central dogma in single cells, such as mRNA decay and translation. With such tools in place one might equally invoke pulsatile RNA degradation or bursts of translation to explain the post-transcriptional variation observed in bulk assays [74]. However, these central regulatory processes have not been directly observed in cells.
Acknowledgments
Thanks to A Coulon, Y Dalal, I Golding, and K Willis for critical reading of the manuscript. D Suter, I Golding, and C Harper kindly provided original images for Figure 1. DRL is supported by the Intramural Research Program of the NIH, National Cancer Institute, Center for Cancer Research.
Footnotes
Publisher's Disclaimer: This is a PDF file of an unedited manuscript that has been accepted for publication. As a service to our customers we are providing this early version of the manuscript. The manuscript will undergo copyediting, typesetting, and review of the resulting proof before it is published in its final citable form. Please note that during the production process errors may be discovered which could affect the content, and all legal disclaimers that apply to the journal pertain.
References
- 1.Darzacq X, Yao J, Larson D, Causse S, Bosanac L, de Turris V, Ruda V, Lionnet T, Zenklusen D, Guglielmi B, et al. Imaging Transcription in Living Cells. Annual Review of Biophysics. 2009;38:173–196. doi: 10.1146/annurev.biophys.050708.133728. [DOI] [PMC free article] [PubMed] [Google Scholar]
- 2.Hager GL, McNally JG, Misteli T. Transcription Dynamics. Molecular Cell. 2009;35:741–753. doi: 10.1016/j.molcel.2009.09.005. [DOI] [PMC free article] [PubMed] [Google Scholar]
- 3.Larson D, Singer R, Zenklusen D. A single molecule view of gene expression. Trends in Cell Biology. 2009;19:630–637. doi: 10.1016/j.tcb.2009.08.008. [DOI] [PMC free article] [PubMed] [Google Scholar]
- 4.Raj A, van Oudenaarden A. Nature, Nurture, or Chance: Stochastic Gene Expression and Its Consequences. Cell. 2008;135:216–226. doi: 10.1016/j.cell.2008.09.050. [DOI] [PMC free article] [PubMed] [Google Scholar]
- 5.So L-h, Ghosh A, Zong C, Sepulveda LA, Segev R, Golding I. General properties of transcriptional time series in Escherichia coli. Nat Genet. 2011 doi: 10.1038/ng.821. advance online publication. These authors examined expression levels for 20 different promoters in bacteria using single molecule FISH. They observed that expression level is varied by modulating the gene off-rate, resulting in a change in the duration of transcriptional bursts. The generality of this observation across many different genes suggests that the observed two-state kinetics involves non-specific features such as DNA topology rather than off-rate of a sequence-specific DNA-binding factor. [DOI] [PMC free article] [PubMed] [Google Scholar]
- 6.Larson DR, Zenklusen D, Wu B, Chao JA, Singer RH. Real-Time Observation of Transcription Initiation and Elongation on an Endogenous Yeast Gene. Science. 2011;332:475–478. doi: 10.1126/science.1202142. The authors use single RNA visualization to observe initiation and elongation of an endogenous yeast gene. This study is the first to directly measure a transcription initiation rate independent of downstream processes such as RNA decay or translation. [DOI] [PMC free article] [PubMed] [Google Scholar]
- 7.Harper CV, Finkenstädt B, Woodcock DJ, Friedrichsen S, Semprini S, Ashall L, Spiller DG, Mullins JJ, Rand DA, Davis JRE, et al. Dynamic Analysis of Stochastic Transcription Cycles. PLoS Biol. 2011;9:e1000607. doi: 10.1371/journal.pbio.1000607. This study observed transcription fluctuations over extremely long periods of time (~ 11 hours). In addition, they provide compelling evidence for a long refractory period of 3 hours. The use of luciferase reporters results in a sensitive, linear assay for single-cell gene expression. [DOI] [PMC free article] [PubMed] [Google Scholar]
- 8.Suter DM, Molina N, Gatfield D, Schneider K, Schibler U, Naef F. Mammalian Genes Are Transcribed with Widely Different Bursting Kinetics. SCIENCE. 2011;332:472–474. doi: 10.1126/science.1198817. Using luciferase reporter genes, the authors measure transcription kinetics for a number of endogenous promoters in mammalian cells. They also do a systematic study of a simple promoter design: the NF-Y binding site (CCAAT) upstream of a TATA box. They observe that bursting increases with the number and/or affinity of the binding sites. The burst size increase was due to an increase in the number of transcripts produced during an on-time, because the duration of the on-time was unaffected. [DOI] [PubMed] [Google Scholar]
- 9.Fiering S, Northrop JP, Nolan GP, Mattila PS, Crabtree GR, Herzenberg LA. Single cell assay of a transcription factor reveals a threshold in transcription activated by signals emanating from the T-cell antigen receptor. Genes & Development. 1990;4:1823–1834. doi: 10.1101/gad.4.10.1823. [DOI] [PubMed] [Google Scholar]
- 10.Karttunen J, Shastri N. Measurement of ligand-induced activation in single viable T cells using the lacZ reporter gene. Proceedings of the National Academy of Sciences. 1991;88:3972–3976. doi: 10.1073/pnas.88.9.3972. [DOI] [PMC free article] [PubMed] [Google Scholar]
- 11.Ko MS, Nakauchi H, Takahashi N. The dose-dependence of glucocorticoid-inducioble gene exprssion results from the change in the number of transcriptionally active templates. EMBO J. 1990;9:2835–2842. doi: 10.1002/j.1460-2075.1990.tb07472.x. The authors demonstrate that the population dose-response curve for a MMTV-driven reporter gene is composed of a digital response in single cells. They also demonstrate that expression heterogeneity exists even in isogenic populations. [DOI] [PMC free article] [PubMed] [Google Scholar]
- 12.Archer TK, Lee HL, Cordingley MG, Mymryk JS, Fragoso G, Berard DS, Hager GL. DIFFERENTIAL STEROID-HORMONE INDUCTION OF TRANSCRIPTION FROM THE MOUSE MAMMARY-TUMOR VIRUS PROMOTER. Molecular Endocrinology. 1994;8:568–576. doi: 10.1210/mend.8.5.8058066. [DOI] [PubMed] [Google Scholar]
- 13.Ross IL, Browne CM, Hume DA. Transcription of individual genes in eukaryotic cells occurs randomly and infrequently. Immunol Cell Biol. 1994;72:177–185. doi: 10.1038/icb.1994.26. In this theoretical article, the authors suggest that periods of inactivity might be substantial, that active transcription complexes might be short-lived in vivo, and that serial recruitment of transcription factors is necessary to generate an active transcription complex. [DOI] [PubMed] [Google Scholar]
- 14.White MR, Masuko M, Amet L, Elliott G, Braddock M, Kingsman AJ, Kingsman SM. Real-time analysis of the transcriptional regulation of HIV and hCMV promoters in single mammalian cells. Journal of Cell Science. 1995;108:441–455. doi: 10.1242/jcs.108.2.441. [DOI] [PubMed] [Google Scholar]
- 15.Peccoud J, Ycart B. Markovian Modeling of Gene-Product Synthesis. Theoretical Population Biology. 1995;48:222–234. This theoretical study lays much of the mathematical groundwork for understanding stochastic transcription. [Google Scholar]
- 16.Lionnet T, Czaplinski K, Darzacq X, Shav-Tal Y, Wells AL, Chao JA, Park HY, de Turris V, Lopez-Jones M, Singer RH. A transgenic mouse for in vivo detection of endogenous labeled mRNA. Nat Meth. 2011;8:165–170. doi: 10.1038/nmeth.1551. [DOI] [PMC free article] [PubMed] [Google Scholar]
- 17.Muramoto T, Müller I, Thomas G, Melvin A, Chubb JR. Methylation of H3K4 Is Required for Inheritance of Active Transcriptional States. Current Biology. 2010;20:397–406. doi: 10.1016/j.cub.2010.01.017. Dictyostelium has proven to be an excellent model system for dissecting the role of pulsatile transcription during development. Here, the authors demonstrate that histone methylation (H3K4Me) can influence the persistence of transcriptional fluctuations from one generation to the next. [DOI] [PubMed] [Google Scholar]
- 18.Rafalska-Metcalf IU, Powers SL, Joo LM, LeRoy G, Janicki SM. Single Cell Analysis of Transcriptional Activation Dynamics. PLoS ONE. 2010;5:e10272. doi: 10.1371/journal.pone.0010272. [DOI] [PMC free article] [PubMed] [Google Scholar]
- 19.Stevense M, Muramoto T, Müller I, Chubb JR. Digital nature of the immediate-early transcriptional response. Development. 2010;137:579–584. doi: 10.1242/dev.043836. [DOI] [PMC free article] [PubMed] [Google Scholar]
- 20.Yunger S, Rosenfeld L, Garini Y, Shav-Tal Y. Single-allele analysis of transcription kinetics in living mammalian cells. Nat Meth. 2010;7:631–633. doi: 10.1038/nmeth.1482. [DOI] [PubMed] [Google Scholar]
- 21.Darzacq X, Shav-Tal Y, de Turris V, Brody Y, Shenoy SM, Phair RD, Singer RH. In vivo dynamics of RNA polymerase II transcription. Nat Struct Mol Biol. 2007;14:796–806. doi: 10.1038/nsmb1280. [DOI] [PMC free article] [PubMed] [Google Scholar]
- 22.Golding I, Paulsson J, Zawilski SM, Cox EC. Real-Time Kinetics of Gene Activity in Individual Bacteria. Cell. 2005;123:1025–1036. doi: 10.1016/j.cell.2005.09.031. [DOI] [PubMed] [Google Scholar]
- 23.Janicki SM, Tsukamoto T, Salghetti SE, Tansey WP, Sachidanandam R, Prasanth KV, Ried T, Shav-Tal Y, Bertrand E, Singer RH, et al. From Silencing to Gene Expression: Real-Time Analysis in Single Cells. Cell. 2004;116:683–698. doi: 10.1016/s0092-8674(04)00171-0. [DOI] [PMC free article] [PubMed] [Google Scholar]
- 24.Grunwald D, Singer RH. In vivo imaging of labelled endogenous [bgr]-actin mRNA during nucleocytoplasmic transport. Nature. 2010;467:604–607. doi: 10.1038/nature09438. [DOI] [PMC free article] [PubMed] [Google Scholar]
- 25.Pedraza JM, Paulsson J. Effects of Molecular Memory and Bursting on Fluctuations in Gene Expression. SCIENCE. 2008;319:339–343. doi: 10.1126/science.1144331. [DOI] [PubMed] [Google Scholar]
- 26.Raj A, Peskin CS, Tranchina D, Vargas DY, Tyagi S. Stochastic mRNA Synthesis in Mammalian Cells. PLoS Biol. 2006;4:e309. doi: 10.1371/journal.pbio.0040309. This work was the first to quantitatively analyze expression heterogeneity at the single-cell, single-molecule level in mammalian cells. The authors also present a full analytical solution for the random telegraph model of transcription. [DOI] [PMC free article] [PubMed] [Google Scholar]
- 27.Shahrezaei V, Swain PS. Analytical distributions for stochastic gene expression. Proceedings of the National Academy of Sciences. 2008;105:17256–17261. doi: 10.1073/pnas.0803850105. [DOI] [PMC free article] [PubMed] [Google Scholar]
- 28.Chubb JR, Trcek T, Shenoy SM, Singer RH. Transcriptional Pulsing of a Developmental Gene. Current Biology. 2006;16:1018–1025. doi: 10.1016/j.cub.2006.03.092. [DOI] [PMC free article] [PubMed] [Google Scholar]
- 29.Batenchuk C, St-Pierre S, Tepliakova L, Adiga S, Szuto A, Kabbani N, Bell John C, Baetz K, Kærn M. Chromosomal Position Effects Are Linked to Sir2-Mediated Variation in Transcriptional Burst Size. BIOPHYSICAL JOURNAL. 2011;100:L56–L58. doi: 10.1016/j.bpj.2011.04.021. [DOI] [PMC free article] [PubMed] [Google Scholar]
- 30.Bar-Even A, Paulsson J, Maheshri N, Carmi M, O’Shea E, Pilpel Y, Barkai N. Noise in protein expression scales with natural protein abundance. Nat Genet. 2006;38:636–643. doi: 10.1038/ng1807. [DOI] [PubMed] [Google Scholar]
- 31.Becskei A, Kaufmann BB, van Oudenaarden A. Contributions of low molecule number and chromosomal positioning to stochastic gene expression. Nat Genet. 2005;37:937–944. doi: 10.1038/ng1616. [DOI] [PubMed] [Google Scholar]
- 32.Blake WJ, Kaern M, Cantor CR, Collins JJ. Noise in eukaryotic gene expression. Nature. 2003;422:633–637. doi: 10.1038/nature01546. [DOI] [PubMed] [Google Scholar]
- 33.Newman JRS, Ghaemmaghami S, Ihmels J, Breslow DK, Noble M, DeRisi JL, Weissman JS. Single-cell proteomic analysis of S. cerevisiae reveals the architecture of biological noise. Nature. 2006;441:840–846. doi: 10.1038/nature04785. [DOI] [PubMed] [Google Scholar]
- 34.Raser JM, O’Shea EK. Control of Stochasticity in Eukaryotic Gene Expression. Science. 2004;304:1811–1814. doi: 10.1126/science.1098641. [DOI] [PMC free article] [PubMed] [Google Scholar]
- 35.Singh A, Razooky B, Cox CD, Simpson ML, Weinberger LS. Transcriptional Bursting from the HIV-1 Promoter Is a Significant Source of Stochastic Noise in HIV-1 Gene Expression. BIOPHYSICAL JOURNAL. 2010;98:L32–L34. doi: 10.1016/j.bpj.2010.03.001. [DOI] [PMC free article] [PubMed] [Google Scholar]
- 36.Skupsky R, Burnett JC, Foley JE, Schaffer DV, Arkin AP. HIV Promoter Integration Site Primarily Modulates Transcriptional Burst Size Rather Than Frequency. PLoS Comput Biol. 2010;6:e1000952. doi: 10.1371/journal.pcbi.1000952. [DOI] [PMC free article] [PubMed] [Google Scholar]
- 37.Zenklusen D, Larson DR, Singer RH. Single-RNA counting reveals alternative modes of gene expression in yeast. Nat Struct Mol Biol. 2008;15:1263–1271. doi: 10.1038/nsmb.1514. [DOI] [PMC free article] [PubMed] [Google Scholar]
- 38.Lionnet T, Wu B, Grünwald D, Singer RH, Larson DR. Nuclear physics: quantitative single-cell approaches to nuclear organization and gene expression. Cold Spring Harb Symp Quant Biol. 2010;75:113–126. doi: 10.1101/sqb.2010.75.057. [DOI] [PMC free article] [PubMed] [Google Scholar]
- 39.Segal E, Widom J. From DNA sequence to transcriptional behaviour: a quantitative approach. Nat Rev Genet. 2009;10:443–456. doi: 10.1038/nrg2591. [DOI] [PMC free article] [PubMed] [Google Scholar]
- 40.Coulon A, Gandrillon O, Beslon G. On the spontaneous stochastic dynamics of a single gene: complexity of the molecular interplay at the promoter. BMC Systems Biology. 2010;4(2) doi: 10.1186/1752-0509-4-2. [DOI] [PMC free article] [PubMed] [Google Scholar]
- 41.Mueller F, Wach P, McNally JG. Evidence for a Common Mode of Transcription Factor Interaction with Chromatin as Revealed by Improved Quantitative Fluorescence Recovery after Photobleaching. Biophysical Journal. 2008;94:3323–3339. doi: 10.1529/biophysj.107.123182. [DOI] [PMC free article] [PubMed] [Google Scholar]
- 42.McNally JG, Müller WG, Walker D, Wolford R, Hager GL. The Glucocorticoid Receptor: Rapid Exchange with Regulatory Sites in Living Cells. SCIENCE. 2000;287:1262–1265. doi: 10.1126/science.287.5456.1262. The authors measured the exchange of the glucocorticoid receptor on a tandem MMTV array by fluorescence photobleaching recovery. This work was the first to suggest that interactions between proteins and chromatin are highly dynamic. [DOI] [PubMed] [Google Scholar]
- 43.Hager G, Elbi C, Johnson T, Voss T, Nagaich A, Schiltz R, Qiu Y, John S. Chromatin dynamics and the evolution of alternate promoter states. Chromosome Research. 2006;14:107–116. doi: 10.1007/s10577-006-1030-0. [DOI] [PubMed] [Google Scholar]
- 44.Metivier R, Reid G, Gannon F. Transcription in four dimensions: nuclear receptor-directed initiation of gene expression. EMBO Reports. 2006;7:161–167. doi: 10.1038/sj.embor.7400626. [DOI] [PMC free article] [PubMed] [Google Scholar]
- 45.Herschlag D, Johnson FB. Synergism in transcriptional activation: a kinetic view. Genes & Development. 1993;7:173–179. doi: 10.1101/gad.7.2.173. This review formulated an early version of the kinetic model of transcription as opposed to an equilibrium thermodynamic model. The authors postulate that synergism between two activators does not necessarily require physical interaction on the template. [DOI] [PubMed] [Google Scholar]
- 46.Green MR. Eukaryotic Transcription Activation: Right on Target. Molecular Cell. 2005;18:399–402. doi: 10.1016/j.molcel.2005.04.017. [DOI] [PubMed] [Google Scholar]
- 47.Cosma MP. Ordered Recruitment: Gene-Specific Mechanism of Transcription Activation. Molecular Cell. 2002;10:227–236. doi: 10.1016/s1097-2765(02)00604-4. [DOI] [PubMed] [Google Scholar]
- 48.Cosma MP, Tanaka T, Nasmyth K. Ordered Recruitment of Transcription and Chromatin Remodeling Factors to a Cell Cycle- and Developmentally Regulated Promoter. Cell. 1999;97:299–311. doi: 10.1016/s0092-8674(00)80740-0. [DOI] [PubMed] [Google Scholar]
- 49.Gkikopoulos T, Havas KM, Dewar H, Owen-Hughes T. SWI/SNF and Asf1p Cooperate To Displace Histones during Induction of the Saccharomyces cerevisiae HO Promoter. Mol Cell Biol. 2009;29:4057–4066. doi: 10.1128/MCB.00400-09. [DOI] [PMC free article] [PubMed] [Google Scholar]
- 50.Karpova TS, Kim MJ, Spriet C, Nalley K, Stasevich TJ, Kherrouche Z, Heliot L, McNally JG. Concurrent Fast and Slow Cycling of a Transcriptional Activator at an Endogenous Promoter. Science. 2008;319:466–469. doi: 10.1126/science.1150559. This study is the first to demonstrate the connection between upstream dynamics and downstream transcriptional regulation. Not only do the authors measure dwell times of an activator on an endogenous tandem array, but they also measure transcriptional output of the array. In addition, they observe a direct interaction between the activator Ace1p and the chromatin remodeler Rsc2p and show how this interaction results in slow cycling of the promoter. [DOI] [PubMed] [Google Scholar]
- 51.Reid G, Gallais R, Métivier R. Marking time: The dynamic role of chromatin and covalent modification in transcription. The International Journal of Biochemistry & Cell Biology. 2009;41:155–163. doi: 10.1016/j.biocel.2008.08.028. [DOI] [PubMed] [Google Scholar]
- 52.Métivier R, Penot G, Hübner MR, Reid G, Brand H, Kos M, Gannon F. Estrogen Receptor-[alpha] Directs Ordered, Cyclical, and Combinatorial Recruitment of Cofactors on a Natural Target Promoter. Cell. 2003;115:751–763. doi: 10.1016/s0092-8674(03)00934-6. [DOI] [PubMed] [Google Scholar]
- 53.Qiu Y, Stavreva DA, Luo Y, Indrawan A, Chang M, Hager GL. Dynamic Interaction of HDAC1 with a Glucocorticoid Receptor-regulated Gene Is Modulated by the Activity State of the Promoter. Journal of Biological Chemistry. 2011;286:7641–7647. doi: 10.1074/jbc.M110.185488. [DOI] [PMC free article] [PubMed] [Google Scholar]
- 54.Lemaire V, Lee C, Lei J, Metivier R, Glass L. Sequential recruitment and combinatorial assembling of multiprotein complexes in transcriptional activation. Phys Rev Lett. 2006;96:198102. doi: 10.1103/PhysRevLett.96.198102. [DOI] [PubMed] [Google Scholar]
- 55.Gandhi SJ, Zenklusen D, Lionnet T, Singer RH. Transcription of functionally related constitutive genes is not coordinated. Nat Struct Mol Biol. 2011;18:27–34. doi: 10.1038/nsmb.1934. [DOI] [PMC free article] [PubMed] [Google Scholar]
- 56.Silverman S, Petti A, Slavov N, Parsons L, Briehof R, Thiberge S, Zenklusen D, Gandhi S, Larson D, Singer R, et al. Metabolic cycling in single yeast cells from unsynchronized steady-state populations limited on glucose or phosphate. Proceedings of the National Academy of Sciences of the United States of America. 2010;107:6946–6951. doi: 10.1073/pnas.1002422107. [DOI] [PMC free article] [PubMed] [Google Scholar]
- 57.Efroni S, Duttagupta R, Cheng J, Dehghani H, Hoeppner DJ, Dash C, Bazett-Jones DP, Le Grice S, McKay RDG, Buetow KH, et al. Global Transcription in Pluripotent Embryonic Stem Cells. Cell Stem Cell. 2008;2:437–447. doi: 10.1016/j.stem.2008.03.021. [DOI] [PMC free article] [PubMed] [Google Scholar]
- 58.Deal RB, Henikoff JG, Henikoff S. Genome-Wide Kinetics of Nucleosome Turnover Determined by Metabolic Labeling of Histones. SCIENCE. 2010;328:1161–1164. doi: 10.1126/science.1186777. [DOI] [PMC free article] [PubMed] [Google Scholar]
- 59.Kimura H, Cook PR. Kinetics of Core Histones in Living Human Cells. The Journal of Cell Biology. 2001;153:1341–1354. doi: 10.1083/jcb.153.7.1341. [DOI] [PMC free article] [PubMed] [Google Scholar]
- 60.Misteli T, Gunjan A, Hock R, Bustin M, Brown DT. Dynamic binding of histone H1 to chromatin in living cells. Nature. 2000;408:877–881. doi: 10.1038/35048610. [DOI] [PubMed] [Google Scholar]
- 61.Dion MF, Kaplan T, Kim M, Buratowski S, Friedman N, Rando OJ. Dynamics of Replication-Independent Histone Turnover in Budding Yeast. SCIENCE. 2007;315:1405–1408. doi: 10.1126/science.1134053. [DOI] [PubMed] [Google Scholar]
- 62.Li G, Margueron R, Hu G, Stokes D, Wang Y-H, Reinberg D. Highly Compacted Chromatin Formed In Vitro Reflects the Dynamics of Transcription Activation In Vivo. Molecular Cell. 2010;38:41–53. doi: 10.1016/j.molcel.2010.01.042. [DOI] [PMC free article] [PubMed] [Google Scholar]
- 63.Nagaich AK, Walker DA, Wolford R, Hager GL. Rapid Periodic Binding and Displacement of the Glucocorticoid Receptor during Chromatin Remodeling. Molecular Cell. 2004;14:163–174. doi: 10.1016/s1097-2765(04)00178-9. [DOI] [PubMed] [Google Scholar]
- 64.Giglia-Mari G, Theil AF, Mari P-O, Mourgues S, Nonnekens J, Andrieux LO, de Wit J, Miquel C, Wijgers N, Maas A, et al. Differentiation Driven Changes in the Dynamic Organization of Basal Transcription Initiation. PLoS Biol. 2009;7:e1000220. doi: 10.1371/journal.pbio.1000220. This study measured the dynamics of TFIIH under endogenous regulation and observed changes in nuclear dynamics based on the cell type. These measurements point to the fact that there is a great diversity in protein-chromatin interactions and also raise the possibility that the so-called “general transcription factors” may function in a cell-type specific manner. [DOI] [PMC free article] [PubMed] [Google Scholar]
- 65.Ashall L, Horton CA, Nelson DE, Paszek P, Harper CV, Sillitoe K, Ryan S, Spiller DG, Unitt JF, Broomhead DS, et al. Pulsatile Stimulation Determines Timing and Specificity of NF-{kappa}B-Dependent Transcription. Science. 2009;324:242–246. doi: 10.1126/science.1164860. [DOI] [PMC free article] [PubMed] [Google Scholar]
- 66.Cai L, Dalal CK, Elowitz MB. Frequency-modulated nuclear localization bursts coordinate gene regulation. Nature. 2008;455:485–490. doi: 10.1038/nature07292. [DOI] [PMC free article] [PubMed] [Google Scholar]
- 67.Lahav G, Rosenfeld N, Sigal A, Geva-Zatorsky N, Levine AJ, Elowitz MB, Alon U. Dynamics of the p53-Mdm2 feedback loop in individual cells. Nat Genet. 2004;36:147–150. doi: 10.1038/ng1293. [DOI] [PubMed] [Google Scholar]
- 68.Stavreva DA, Wiench M, John S, Conway-Campbell BL, McKenna MA, Pooley JR, Johnson TA, Voss TC, Lightman SL, Hager GL. Ultradian hormone stimulation induces glucocorticoid receptor-mediated pulses of gene transcription. 2009;11:1093–1102. doi: 10.1038/ncb1922. [DOI] [PMC free article] [PubMed] [Google Scholar]
- 69.Sung M-H, Salvatore L, De Lorenzi R, Indrawan A, Pasparakis M, Hager GL, Bianchi ME, Agresti A. Sustained Oscillations of NF-ÎoB Produce Distinct Genome Scanning and Gene Expression Profiles. PLoS ONE. 2009;4:e7163. doi: 10.1371/journal.pone.0007163. [DOI] [PMC free article] [PubMed] [Google Scholar]
- 70.Ong KM, Blackford JA, Kagan BL, Simons SS, Chow CC. A theoretical framework for gene induction and experimental comparisons. Proceedings of the National Academy of Sciences. 2010;107:7107–7112. doi: 10.1073/pnas.0911095107. The authors examine the dose response of hormone-regulated genes at the single-cell level. They demonstrate how a diverse range of regulatory dynamics can result in the classic first-order Hill dose response curve. The implication of this work is that a first-order Hill response is not necessarily due simply to hormone binding as previously maintained but can arise from sequential activation when all the intermediates are short-lived. [DOI] [PMC free article] [PubMed] [Google Scholar]
- 71.Rosenfeld N, Young JW, Alon U, Swain PS, Elowitz MB. Gene Regulation at the Single-Cell Level. Science. 2005;307:1962–1965. doi: 10.1126/science.1106914. [DOI] [PubMed] [Google Scholar]
- 72.Newlands S, Levitt LK, Robinson CS, Karpf ABC, Hodgson VRM, Wade RP, Hardeman EC. Transcription occurs in pulses in muscle fibers. Genes & Development. 1998;12:2748–2758. doi: 10.1101/gad.12.17.2748. [DOI] [PMC free article] [PubMed] [Google Scholar]
- 73.Paszek P, Ryan S, Ashall L, Sillitoe K, Harper CV, Spiller DG, Rand DA, White MRH. Population robustness arising from cellular heterogeneity. Proceedings of the National Academy of Sciences. 2010;107:11644–11649. doi: 10.1073/pnas.0913798107. In this theoretical study, the authors propose a rationale for transcription periodicity in tissue. For the case of NF-κB signaling, they demonstrate how a dual negative feedback loop can determine the relative phase of oscillations between single cells. They hypothesize that the feedback loop elicits a homogeneous response in tissue even though the individual cellular response is pulsatile, resulting in minimization of population-level paracrine fluctuations. [DOI] [PMC free article] [PubMed] [Google Scholar]
- 74.Schwanhausser B, Busse D, Li N, Dittmar G, Schuchhardt J, Wolf J, Chen W, Selbach M. Global quantification of mammalian gene expression control. Nature. 2011;473:337–342. doi: 10.1038/nature10098. [DOI] [PubMed] [Google Scholar]
- 75.Femino AM, Fay FS, Fogarty K, Singer RH. Visualization of Single RNA Transcripts in Situ. Science. 1998;280:585–590. doi: 10.1126/science.280.5363.585. This study was the first to push RNA FISH to the single molecule level. The authors looked at both cellular RNA distributions and nascent pre-mRNA loading and motivated many of the questions which would be answered in later studies of single-molecule gene expression. [DOI] [PubMed] [Google Scholar]
- 76.Bertrand E, Chartrand P, Schaefer M, Shenoy SM, Singer RH, Long RM. Localization of ASH1 mRNA Particles in Living Yeast. Mol Cell. 1998;2:437–445. doi: 10.1016/s1097-2765(00)80143-4. [DOI] [PubMed] [Google Scholar]
- 77.Chao JA, Patskovsky Y, Almo SC, Singer RH. Structural basis for the coevolution of a viral RNA-protein complex. 2008;15:103–105. doi: 10.1038/nsmb1327. [DOI] [PMC free article] [PubMed] [Google Scholar]
- 78.Li X, Zhao X, Fang Y, Jiang X, Duong T, Fan C, Huang C-C, Kain SR. Generation of Destabilized Green Fluorescent Protein as a Transcription Reporter. Journal of Biological Chemistry. 1998;273:34970–34975. doi: 10.1074/jbc.273.52.34970. [DOI] [PubMed] [Google Scholar]