

Abstract
Large population studies show that polyunsaturated fatty acids are important for human health, but determining relationships between the health benefits and the fatty acid content has been hampered by the unavailability of labor-effective high-throughput technologies. An automated high throughput fatty acid analysis was developed from a previous procedure based on direct transesterification including the automation of chemical procedures, data acquisition and automatic data processing. The method was validated and applied to umbilical cord serum samples in an epidemiological study. The method was linear in the range of 1–600μg/mL serum with r2 ≥0.99. The within-run CV was <5.4% for 23 fatty acids and a range of recoveries over three concentrations were 76%~119% in a low-lipid matrix with the exception of 14:0. The fatty acid concentration as measured by the robotic method for human plasma was in good agreement with the Lepage & Roy method. The fatty acid profile in umbilical cord serum from American subjects(n=287) showed an average of 38.0%, 24.9%, 32.0% and 4.6% of total fatty acids for saturates, monounsaturates, n-6 and n-3 polyunsaturates, respectively. This is the first report of a complete, validated, cost-effective, automated, high throughput fatty acid measurement method along with application to a population-based study. Automated fatty acid analysis coupled with automated data processing greatly facilitates the high throughput, 72 samples transesterified in 6 hr, required for large population-based studies.
Keywords: Gas chromatography, Automation, Robotics, Fatty acid, Transesterification
INTRODUCTION
The content of dietary polyunsaturated fatty acids (PUFA) has been notably associated with human health as reported in several epidemiological studies[1–6] over the past ten years. In particular, inadequate n-3 PUFA have been implicated in suboptimal neural development [7], increased risk of cardiovascular disease [8], neurodegenerative diseases [9], psychiatric disorders [10], suboptimal IQ [2], as well as other public health related issues [11].
However, the dietary intake of PUFA was usually estimated using food frequency questionnaire [2] which can overestimate and/or underestimate food intake by 20% or more [12]. The relationships between health benefits and n-3 and n-6 PUFA intake and human blood fatty acid content are much needed. The development of the fingertip prick blood sampling [13] and microwave irradiation partial transesterification methodologies [14, 15] has greatly increased the potential for large scale screening of fatty acids in human blood. The further simplification of a one-step, direct transesterification method greatly increased the throughput of fatty acid assays for glycerophospholipids [16]. Nevertheless, the unavailability of automated methodology for labor-saving, high throughput, quantitative and cost-effective fatty acid analysis and the lack of automated data processing have limited the scope of complex n-6 and n-3 fatty acid related clinical studies.
Over the years, we have been developing several techniques to make large scale of fatty acid analysis feasible, including a fast gas chromatographic (GC) method [17] and a basic robotic system for the transesterification procedure [18]. This study further developed the robotic procedure and robotic operating script into working automated, high throughput method for 24 fatty acids in human plasma and serum, and created a Visual Basic Application (VBA) script to automate the data processing. Furthermore, we applied this automated, high throughput technology to umbilical cord serum as part of an epidemiological study.
MATERIALS AND METHODS
Chemicals and reagents
All chemicals were of analytical reagent grade and screened for interference with the baseline of chromatograms. Fatty acid standards were purchased from Nu-Chek Prep (Elysian, MN), including docosatrienoic ethyl ester (22:3n-3) as internal standard (ISTD) and GC reference standard GLC-462 containing 28 fatty acid methyl esters (FAME) of equal weight. GLC-462 was used as the source of individual fatty acid standard in the quality control (QC) samples and validation experiments. Acetyl chloride (Category # 114189) and decane were purchased from Sigma-Aldrich (St. Louis, MO). Toluene and hexane were from EMD Chemicals Inc. (Gibbstown, NJ). Methanol and pentane were from Burdick & Jackson (Muskegon, MI). Stock solutions of standards were prepared in bulk (1~20×) with the addition of butylated hydroxytoluene (BHT, 25 μg/mL) as antioxidant, aliquoted and stored at −80°C. All solvents were purchased commercially and used without further purification.
Low-lipid matrix
A low-lipid matrix was prepared from human serum. The serum lipids were removed using a method modified from Blix [19]; human serum was precipitated with pre-chilled acetone (1:6, by vol) while vortexing, and immediately centrifuged at 1,700 g for 3 min at 4°C. The supernatant fluid was saved and the precipitate was treated twice with the same volume of acetone at −20°C for 30 min. The pooled precipitates were freeze dried overnight, and stored at −80°C as a powder for further application in the subsequent experiments. The powder was termed a “low-lipid serum powder”. This powder was dissolved in 0.9% sodium chloride to form a matrix solution with a concentration of 30 mg/mL, containing 8.4% of the original total fatty acids of serum as determined by GC. This matrix solution was applied in QC samples and validation experiments. The supernatant collected as described above was dried under nitrogen, and the total lipid in dried residue was extracted using the Folch method [20]. An aliquot of the extracted total lipids was transesterified, stored at −80°C and used as a GC reference standard (Ref-LMBB07) along with Ref-462 to identify the retention time of FAME on chromatograms from unknown samples.
Quality control
Low-lipid matrix serum spiked with fatty acid standards at a low (20 μg of each fatty acid per mL sample), intermediate (100 μg) and high (300 μg) amounts served as QC samples. Reference samples were prepared from 200 mL human serum obtained from a single research blood donor in the Clinical Center of the National Institutes of Health, and then aliquoted and stored at −80°C. They were measured in 47 replicates in one run, and also in single runs in 12 separated experiments to obtain the mean value of each significant fatty acid. This sample served as a QC sample to monitor the assay performance with a physiological level of fatty acids.
Instrumentation
Automation liquid handling system
A Freedom Evo Instrument 200 (TECAN Trading AG, Switzerland) was utilized for automated liquid handling for the transesterification of fatty acids and operated via EVOware® software (v2.0, SP1, Patch3). It is referred to as The Robot, and the configuration was as described in detail in a previous report [18]. In brief, the robotic system equipped with a liquid handling arm (LiHa) is placed in a customized fume hood meeting performance criteria described in NIH Design Requirements Manual Chapter 6, Section 6–1–00 D.7.d. The robot components are, in order from left to right, a wash station, carriers for disposal tips and samples, reaction blocks, solvent troughs, and GC vial station on a 2 meter platform.
The optimal liquid handling parameters required to process each type of liquid, such as aspirate and dispense speeds, pump mechanics, the air gaps separated liquids, and the characteristics of liquids (viscosity, volume, conductivity) etc., were included in liquid class defined within the EVOware script. Each liquid class is identified by a generic name, such as Serum, Solution. In this assay, liquid classes were established for the blood sample and solutions involved during entire run. The liquid class named pressure monitored pipetting-Serum (PMP-Serum) was for sampling serum or plasma, which also included Clot Detection for possible clots in samples. PMP-Solutions A, B, C, D were for four types of solutions involved in various steps and their respective pipetting parameters. PMP-Extraction was for extracting FAME after direct transesterification through 25 repetitions of mixing by aspiration and dispensing. PMP-FAME was for transferring FAME from reaction test tubes to GC vials prior to being concentrated at 55°C. The system received preventive maintenance twice a year by the manufacturer and daily maintenance by the trained staff. Robotic pipetting accuracy was calibrated by weighing the deionized water pipetted under the same conditions as that setup for each liquid class. A routine practice was that 8 aliquots of solution A-Startup was retained and weighed periodically to verify the accuracy of the ISTD amount.
Gas chromatography
Three fast gas chromatograph (6890 Plus LAN) systems with flame ionization detectors (FID; Agilent Technologies, Inc.; Santa Clara, CA) coupled with customized fused-silica, narrow- bored high-efficiency DB-FFAP capillary columns (Agilent 127–32H2, 15 m × 0.1 mm I.D. × 0.1 μm film thickness) were employed for chromatographic separation and to acquire the signal of the FAME as reported previously [17]. GC inlet: 250°C (split ratio: 50:1), detector: FID (250°C) with hydrogen 40 mL/min, air 450 mL/min. Carrier gas: hydrogen with pressure of 355 kPa. Make-up gas: nitrogen constant at 10 mL/min. Temperature program: initially 150°C with a 0.25 min hold with ramp at 35°C/min to 200°C, further 8°C/min to 225°C with 3.2 min hold, and then 80°C/min to 245°C with a 9 min hold to bake off column. Twenty-four fatty acids were eluted in about 8 min in a total run of about 17 min. Typically, GC analyses were completed overnight or were run simultaneously with robotic derivatization for the next batch of samples.
With good sample preparation and chromatographic separation, all identified peaks were auto-integrated using the ChemStation (B.01.01) built-in integrator. The threshold values for integration parameters, including baseline correction, slope sensitivity, peak width, area reject, height reject, etc, were selected so as to integrate all signals on one chromatogram simultaneously. The merged peaks, sharing the same baseline, were integrated using non-Gaussian calculation. Manual integration was applied for very small peaks where the peak area was < 0.05 area unit.
Lepage and Roy fatty acids analysis
One-step direct transesterification developed by Lepage and Roy [21] was applied as a reference fatty acid method. Briefly, 100 μl of plasma or serum were added to 16 × 100 mm disposable borosilicate glass tubes placed in ice containing 1.6 mL of methanol, 0.4 mL of hexane, and 200 μl of acetyl chloride. Ten μg of 22:3n-3 ethyl ester was used as ISTD. The test tubes were capped under nitrogen, heated at 100°C for 60 min. Afterwards, the tubes were cooled on ice for 10 min and then neutralized by an addition of 5 mL of 6% of Na2CO3 solution followed by centrifugation at 1,700 g for 4 min. The upper phase containing FAME was collected and the volume was reduced to ~ 30 μl. A 1–3 μl aliquot was injected into GC inlet.
Automatic high throughput fatty acids analysis
Automation of plasma or serum fatty acid analysis, referred to as the robotic fatty acid assay, was developed from a previous procedure [18] based on Lepage & Roy’s direct transesterification in a one-step reaction [21]. The outline of the assay procedure for the current working method and the composition of the various solutions are presented in Figure 1. The robotic operation script is supplied as Supplemental Material 1.
Figure 1.
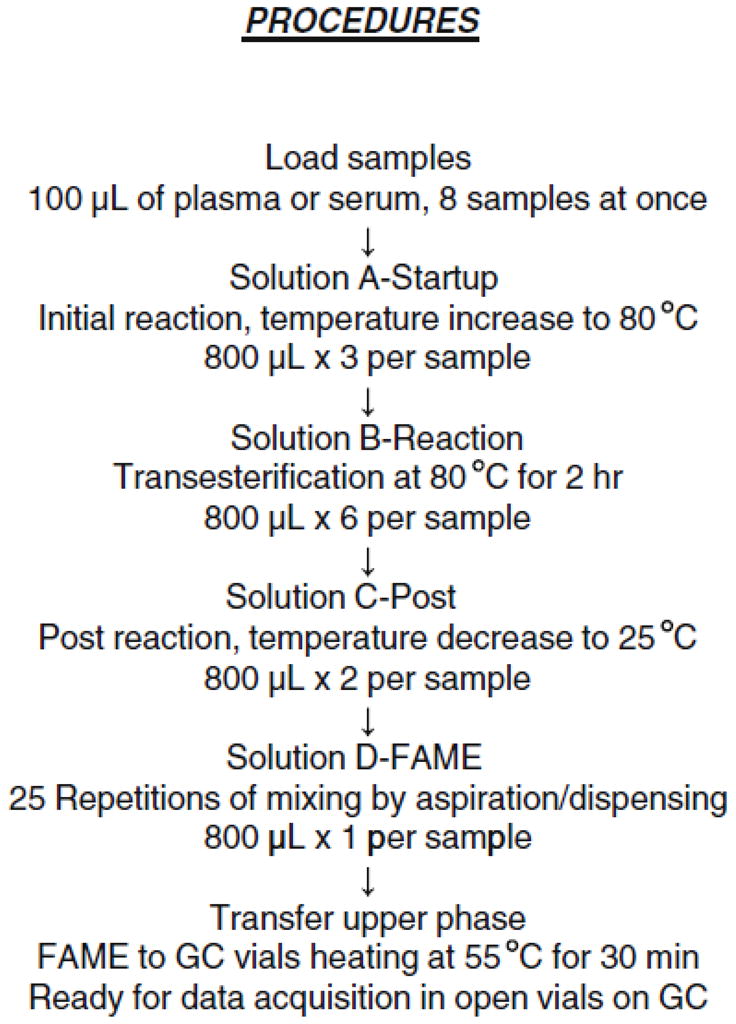
Outline of the robotic fatty acid analysis procedure. The compositions of four solutions are as followed. A-Startup: methanol (BHT 25 μg/mL): toluene: acetyl chloride (2.0:0.3:0.1; by vol) containing ISTD; B-Reaction: methanol: toluene: acetyl chloride (4.1:0.6:0.1); C-Post: methanol: water (1.4:0.2); D-FAME: decane: pentane (0.08:0.72). FAME, fatty acid methyl esters; GC, gas chromatography; BHT, butylated hydroxytoluene; ISTD, internal standard.
Solutions were freshly made, stored at room temperature within sealed containers and transferred to solvent troughs docked on the automation platform just before the start of the experiment. This guaranteed the accuracy of the concentrations of the ISTD and acetyl chloride. Acetyl chloride was added dropwise to prepare solutions at 0°C with continuous stirring. Solutions A-Startup, B-Reaction, D-FAME were modified from Stock solutions in the previous procedure [18]. Solution C-Post (methanol: water, 7: 1, by vol) was added for a complete reaction and as a key to balance the total reaction time among samples in various locations on the heating block. This also led to a better separation of upper decane/pentane phase containing FAME from the lower aqueous phase which made possible the transferring of the FAME solution to GC vials. BHT was applied as an antioxidant during open tube reactions and remained in the final FAME preparation.
Dissolved plasma or serum in containers was placed in Sample Carriers. Eight samples of 100 μl of plasma or serum were simultaneously loaded into 13 × 100 mm disposable borosilicate glass tubes preset in Reaction Heating Blocks, referred to as one set of samples. The transesterification reaction started after the addition of solution A-Startup followed by increasing the heating block temperature. The heating block was turned off prior to the addition of solution C-Post. The difference in reaction time between the first set of samples and the last was minimized. There is a maximal 1.6 min difference between two adjacent sets (n=8 per set) over a 3 hr total reaction period. The entire experimental time for the robotic transesterification procedure was nearly independent of the number of samples analyzed, which was about 6 hr for up to 72 samples.
Method validation
The validation and quality control for laboratory robotic fatty acid assay were established in part to be consistent with the Bioanalytical Method Validation in Guidance for Industry by FDA [22] and Clinical Laboratory Improvement Amendments of 1988 [23]. Precision, stability, linearity, recovery and accuracy were examined as follows.
The within-run precision was determined by analysis of 24 fatty acids in 47 replicates of the reference sample. The between-run precision was from one reference sample in each of 12 independent experiments over a 3 months period. The linearity was evaluated by spiking a known amount of fatty acid standard in the low-lipid serum preparation at the concentrations of 1, 5, 10, 25, 50, 100, 200, 400, 600μg/mL along with 10 μg of ISTD. The peak area ratios of fatty acid to ISTD were determined (endogenous fatty acid amounts from the low-lipid serum were subtracted) and plotted against the concentrations of the added fatty acid. Regression equations and coefficients were then generated. For routine assay, a one point calibration was applied. The recovery was assessed by spiking a known amount of fatty acid at 20 (low), 100 (intermediate) and 300 μg/mL (high) into the low-lipid serum solution with 8 replicates at each concentration. The accuracy was examined by comparing the repeated measurements of human plasma fatty acid concentration determined by the robotic method (n=96) with the Lepage & Roy method (n=16). The stability of FAME preparations of serum was examined at 1, 2, 3, 8, 12, 18, 24, 30, 60, 90 d after transesterification of 16 reference samples.
In addition, the accuracy and precision for robotic pipetting were also calibrated according to manufactures guidelines.
Epidemiological study and subjects
The samples were from the subjects recruited in the Tracking Health Related to Environmental Exposure (THREE) Study. This study was approved by Johns Hopkins University School of Medicine Institutional Review Board (Protocol # 04–04–22–02), reviewed under # NA_00028885 (June 02, 2009). Eligible subjects were singleton, live birth deliveries in the labor and delivery suite at the Johns Hopkins Hospital, Baltimore, Maryland area, during 26 November 2004 and 16 March 2005. Newborns with major congenital anomalies, or whose mother either gave birth to multiple children, or delivered a single child with an initial twin gestation with fetal loss at ≥20 weeks were excluded. Trained clinical staff collected blood from the umbilical cord vein of newborns immediately following delivery. Blood was stored at 4°C and within 3 hr serum was separated by centrifuging at 1,000 g for 15 min. Samples were centrifuged to obtain cord serum, aliquoted and stored at −80°C. Frozen samples were then shipped on dry ice to NIH for fatty acid analysis. Of the 300 samples in the study, 287 had a sufficient quantity of serum to be analyzed for fatty acids. Samples were anonymyzed so that they could not be linked back to the subjects’ identities. Further details regarding methods and population characteristics were reported in a previous publication [24].
Calculation and automated data processing
All the experiments or data described were performed using the robotic method unless otherwise indicated in the text. Data were expressed as the mean concentration ± standard deviation asμg of fatty acid per mL plasma or serum (μg/mL), or % of each fatty acid in total weight of the identified fatty acids in each sample (wt%). The fatty acid concentrations in the plasma/serum were calculated by comparing the integrated areas of each fatty acid peak with that of a known amount of ISTD. The percent difference (%Diff) of two experimental values was calculated by dividing the absolute difference of the two values by the average of the two values. Linear regression was analyzed using Microsoft® Excel 2003 (Microsoft Corp.; Seattle, WA). The descriptive frequencies analyses were performed in SPSS 13.0 for Windows (SPSS Inc.; Chicago, IL).
The data processing was performed as follows; a calibration table was established providing the GC information for each fatty acid of interest in the reference sample, including peak retention time, signal abundance, integrated area, ISTD amount, etc. According to the number and starting location of the double bonds in the fatty acid carbon chain, a unique identification code was assigned to each fatty acid in the order of elution, as illustrated in Figure 2A. The Agilent ChemStation software (B.01.01) applied this calibration table to identify fatty acids of interest in all samples in one offline or online sequence and generated a Summary Report in a text file for all data acquired for further calculation. The above Summary Reports were imported into an Excel spreadsheet. Fatty acid results were then automatically generated through macro programming (Supplemental Material 2) with Microsoft VBA 6.3 (Microsoft Corp; Seattle, WS), including both concentration (μg/mL) and the proportion of each fatty acid in total fatty acids (wt%).
Figure 2.

Gas chromatograms of fatty acid methyl esters from rat plasma using the robotic assay with (A) newly selected reagents; (B) previously employed reagents. A unique code was assigned to each identified fatty acid. A00 series represent saturates, B00 series for monosaturates, C00 series for n-6, D00 series for n-3, E00 series for n-9 polyunsaturates. A-i, A-ii, A-iii are insets for panel A. All identified peaks were auto-integrated using an Agilent ChemStation (B.01.01) built-in integrator. Integration parameters setup was: 1 for slope sensitivity, 0.02 for peak width, 0.05 for area reject, 0.3 for height reject, baseline correction sets advanced, and shoulders set off. FID, flame ionization detector.
RESULTS
Robotic high throughput fatty acid assay validation
Robotic pipetting accuracy and precision
The calibration parameters Offset and Factor for the robotic disposal tips were applied to calibrate the net volume specified in the robot script, expressed as Calibrated dilutor movement (actual volume) = (net volume × factor) + offset. The Factor for 100 μl is 1.0248, Offset as 0; for 2.4 mL is 1.079 and 0. With the calibrated volume, for pipetting of 100 μl sample, the within-run CV for 8 tips was 0.4% with volume 99.9± 0.4μl (mean± SD, n=5 for each of 8 tips); between-run CV for 5 tips was 0.2%, volume ranging from 99.2 to 100.3 μl (n=5). For pipetting 2.4 mL of Solution A, the intra CV was 0.1% with 2.407± 0.003 mL (n=6); inter CV 0.4%, volume ranging 2.405 to 2.411 mL (n=6).
Chromatographic interference
Noise on the GC chromatograms was significantly reduced in the current robotic method (Figure 2a) after having replaced the source of the acetyl chloride, the major contributor to the interference observed in Figure 2b. The chromatogram between 1 and 2.7 min in panel 2a is flatter and has many fewer noise peaks than in panel 2b. The flatter baseline improved the accuracy of automated integration of all peaks on one chromatogram and made it possible to automate data processing. In order to evaluate the introduction of extraneous peaks in the blank samples, extensive analyses were performed of all materials used (tubes, pipette tips, etc), all reagents and solvents and robotic conditions (temperature, duration of reactions, etc). It was determined that the acetyl chloride reagent was the source of the extraneous peaks and the issue was resolved by switching to a different reagent quality from the same supplier.
A custom, high efficiency capillary column with 10,000 theoretical plates (compared to 4,300 of a conventional column) gave good resolutions for the majority of fatty acid peaks after proper conditioning. The only partial peak co-elution noted were that of 16:1n-7 with an unidentified peak and 18:1n-9 with 18:1n-7, as presented in the insets to figure 2a.
Precision and stability
Measurements of within-run precision indicated a CV < 5.4% for the concentrations of the measured fatty acids with the exception of 14:0 (14%) (Table 1). Measurements of between-run precision indicated an average CV of 4.6 ± 2.0% (n=12) for the wt% of all measured fatty acids (except 14:0, 22:0 and 20:2n-6). The CV values were largely independent of fatty acid concentration, which ranged from 1–552 μg/mL serum. The stability of the resultant FAME preparation in decane over 90 d for PUFA and over 30 d for saturates and monounsaturates (stored at −80°C between injections) is presented in Table 1. It was noted that saturated fatty acids and some monounsaturates had decreased beyond 30 d after transmethylation possible due to evaporation during storage. The CV for PUFA concentrations over 90 d was 2.3± 0.8% with the exception of 5.6% for 20:2n-6, a very small peak that was more difficult to integrate properly. Minimal changes in fatty acid concentrations over a period of 30 d indicate that samples do not have to be analysed by GC immediately in case of short-term delays caused by GC malfunction or processing delays.
TABLE 1.
Precision, stability and recovery in robotic fatty acid analyses
| Analytes |
a Precision
|
b Stability
|
c Recovery of Fatty Acids, %
|
||||||
|---|---|---|---|---|---|---|---|---|---|
| Within-run (n=47) | Between-run (n=12) | 1–30 day (n=16) | Added μg fatty acid/sample (n=8) | ||||||
| μg/mL | CV(%) | wt% | CV(%) | μg/mL | CV(%) | 2 | 10 | 30 | |
|
|
|||||||||
| 14:0 | 23.3 ± 3.2 | 14 | 1.09 ± 0.17 | 16 | 25.7 ± 1.2 | 4.8 | 76.6 ± 21 | 88.1 ± 9 | 67.8 ± 11 |
|
| |||||||||
| 16:0 | 537.3 ± 29 | 5.3 | 21.2 ± 1.00 | 4.7 | 561.7 ± 28 | 5.0 | 90.7 ± 33 | 106.7 ± 11 | 86.1 ± 10 |
|
| |||||||||
| 18:0 | 183.8 ± 6.5 | 3.5 | 7.51 ± 0.28 | 3.7 | 187.9 ± 4.1 | 2.2 | 103.7 ± 16 | 118.6 ± 7 | 99.0 ± 6 |
|
| |||||||||
| 20:0 | 8.2 ± 0.2 | 2.0 | 0.34 ± 0.02 | 5.5 | 8.5 ± 0.2 | 2.9 | 100.5 ± 10 | 99.8 ± 2 | 95.9 ± 5 |
|
| |||||||||
| 22:0 | 17.5 ± 0.6 | 3.3 | 0.70 ± 0.09 | 12 | 18.6 ± 0.8 | 4.5 | 88.9 ± 7 | 92.6 ± 2 | 93.2 ± 6 |
|
| |||||||||
| 24:0 | 14.6 ± 0.5 | 3.2 | 0.59 ± 0.06 | 9.6 | 15.2 ± 0.6 | 3.9 | 77.6 ± 6 | 83.4 ± 2 | 85.8 ± 6 |
|
| |||||||||
| 16:1n-7 | 35.5 ± 1.9 | 5.4 | 1.53 ± 0.07 | 4.9 | 38.4 ± 1.4 | 3.7 | 92.4 ± 12 | 103.2 ± 7 | 86.6 ± 10 |
|
| |||||||||
| 18:1n-9 | 552.4 ± 20 | 3.6 | 23.4 ± 0.59 | 2.5 | 578.9 ± 13 | 2.3 | 105.3 ± 20 | 109.3 ± 8 | 97.1 ± 7 |
|
| |||||||||
| 18:1n-7 | 45.1 ± 1.6 | 3.5 | 1.88 ± 0.03 | 1.5 | 47.8 ± 1.7 | 3.6 | 103.5 ± 12 | 106.6 ± 6 | 93.2 ± 7 |
|
| |||||||||
| 20:1n-9 | 3.5 ± 0.1 | 3.8 | 0.14 ± 0.01 | 4.3 | 3.6 ± 0.1 | 4.1 | 96.2 ± 9 | 100.4 ± 2 | 96.9 ± 6 |
|
| |||||||||
| 22:1n-9 | 0.9 ± 0.05 | 5.2 | 0.04 ± 0.003 | 8.3 | 0.9 ± 0.03 | 3.6 | 86.0 ± 6 | 91.7 ± 1 | 92.3 ± 5 |
|
| |||||||||
| 24:1n-9 | 41.0 ± 1.0 | 2.5 | 1.68 ± 0.13 | 7.8 | 41.6 ± 0.3 | 0.8 | 76.2 ± 6 | 90.3 ± 2 | 91.2 ± 5 |
|
| |||||||||
| 1–90 day (n=16) | |||||||||
|
| |||||||||
| 18:2n-6 | 523.0 ± 20 | 3.8 | 22.0 ± 0.63 | 2.9 | 546.9 ± 11 | 2.0 | 107.6 ± 20 | 110.5 ± 9 | 95.4 ± 8 |
|
| |||||||||
| 18:3n-6 | 15.3 ± 0.6 | 3.9 | 0.64 ± 0.02 | 3.2 | 15.9 ± 0.3 | 1.6 | 96.5 ± 10 | 106.0 ± 6 | 94.8 ± 7 |
|
| |||||||||
| 20:2n-6 | 3.6 ± 0.2 | 4.6 | 0.17 ± 0.03 | 16 | 3.7 ± 0.2 | 5.6 | 96.0 ± 11 | 103.3 ± 3 | 98.0 ± 5 |
|
| |||||||||
| 20:3n-6 | 37.4 ± 0.8 | 2.3 | 1.53 ± 0.04 | 2.9 | 38.0 ± 0.3 | 0.9 | 98.1 ± 10 | 105.2 ± 4 | 98.0 ± 6 |
|
| |||||||||
| 20:4n-6 | 250.9 ± 6.6 | 2.6 | 10.3 ± 0.25 | 2.5 | 255.0 ± 2.0 | 0.8 | 104.1 ± 13 | 105.1 ± 5 | 96.2 ± 6 |
|
| |||||||||
| 22:4n-6 | 6.3 ± 0.1 | 1.9 | 0.26 ± 0.01 | 4.1 | 6.1 ± 0.1 | 2.0 | 89.1 ± 7 | 96.0 ± 1 | 93.8 ± 5 |
|
| |||||||||
| 22:5n-6 | 3.2 ± 0.1 | 1.9 | 0.10 ± 0.01 | 5.4 | 3.3 ± 0.1 | 2.9 | - | - | - |
|
| |||||||||
| 18:3n-3 | 6.8 ± 0.3 | 3.9 | 0.29 ± 0.01 | 3.7 | 7.2 ± 0.2 | 2.1 | 97.4 ± 10 | 104.7 ± 6 | 94.4 ± 7 |
|
| |||||||||
| 20:5n-3 | 24.3 ± 0.7 | 2.8 | 0.96 ± 0.04 | 4.3 | 24.7 ± 0.8 | 3.1 | 104.8 ± 12 | 108.9 ± 5 | 99.0 ± 6 |
|
| |||||||||
| 22:5n-3 | 16.8 ± 0.3 | 1.6 | 0.67 ± 0.04 | 5.5 | 16.5 ± 0.1 | 0.8 | 91.1 ± 7 | 98.1 ± 2 | 94.6 ± 5 |
|
| |||||||||
| 22:6n-3 | 70.8 ± 1.2 | 1.7 | 2.84 ± 0.14 | 4.8 | 69.7 ± 1.2 | 1.8 | 90.5 ± 7 | 98.2 ± 1 | 94.8 ± 5 |
|
| |||||||||
| 20:3n-9 | 7.2 ± 0.2 | 2.4 | 0.30 ± 0.01 | 4.3 | 7.4 ± 0.1 | 1.9 | - | - | - |
|
| |||||||||
| Total fatty acid | 2451 ± 89 | 3.6 | 2498 ± 90 | 3.6 | 94.2 ± 11 | 101.2 ± 4 | 92.9 ± 6 | ||
Reference samples (human serum) were employed in all experiments.
Data were expressed as mean ± SD.
Nu-Chek Prep standard mixture GLC-462 was used as the source of the fatty acid standard.
“-” indicates data were not available.
wt% indicates the proportion of fatty acid in total weight of the identified fatty acids in one sample.
Linearity
At the concentration range of 1–600 μg/mL of fatty acids, the r2 for the calibration curves were greater than 0.996 for PUFA and 0.995 or greater for monounsaturated and saturated fatty acids with the exceptions of 14:0 and 16:0, which were 0.985 and 0.991. As plotted in Figure 3, 20:4n-6 and 22:6n-3 are presented as the representatives of key PUFA along with examples of saturated (22:0) and monounsaturated (20:1n-9) fatty acids. The slope (a), intercept (b) and r2 for the other fatty acids are presented in the same figure. The established calibration curves cover the expected fatty acid concentration range in unknown plasma/serum samples. A few samples with higher concentrations were diluted and re-assayed to increase accuracy.
Figure 3.

Linear ranges for the robotic fatty acid assay. The area ratios (fatty acid peak referenced to the internal standard) were plotted against the added fatty acid concentrations of 1, 5, 10, 25, 50, 100, 200, 400, 600μg/mL. The regression lines, equations and r2 of 20:1n-9 and 22:0 were presented in panel A as the examples for the monounsaturates and saturates; 20:4n-6 and 22:6n-3 in panel B are examples for n-6 and n-3 polyunsaturates, respectively. The parameters for the remaining fatty acids are listed alongside the plots. a and b indicate coefficients for y = ax + b. PUFA, polyunsaturated fatty acids.
Recovery and accuracy
The recoveries ranged from 76% to 119% at low, medium, high concentrations for all fatty acids with except 14:0 which had a low recovery (68%) at the high concentration. For PUFA, an average of 97.5± 6.4%, 103.6± 4.8% and 95.9± 1.8% for low, intermediate, and high concentrations was observed, respectively (Table 1). The %Diff between the fatty acid concentrations in either decane or hexane was less than 2.5% (n=5 per group) for 22 fatty acids with the exception of 14:0 (4.7%) (22:5n-6, not available).
The fatty acid results from the accuracy assessment showed good agreement between the Lepage & Roy method and the robotic method except for some minor fatty acids, as presented in Table 2. The %Diff between lab bench analyses (n=16) and robotic replicates (n=96) was less than 5% for the mean values of total saturates, monounsaturates, n-6 highly unsaturated fatty acids (HUFA), n-3 HUFA and total fatty acids. %Diff was less than 10% for the most majority of fatty acids with exception of some minor fatty acids 22:0, 18:3n-6, 22:5n-6, 20:3n-9 (10~18%). The 20-and 22-carbon fatty acids with three or more double bonds are categorized as HUFA.
TABLE 2.
Comparison of repeated measurements of human plasma fatty acid concentrations obtained by either the robotic or Lepage & Roy method
| Analytes | Lepage&Roy
|
Robotic Assay
|
% Difference | ||
|---|---|---|---|---|---|
| n=16 | CV% | n=96 | CV% | ||
|
|
|
|
|||
| 14:0 | 21.1 ± 1.4 | 6.6 | 21.8 ± 1.7 | 7.7 | 3.2 |
|
| |||||
| 16:0 | 538.4 ± 29.0 | 5.4 | 532.5 ± 27.4 | 5.1 | 1.1 |
|
| |||||
| 18:0 | 184.4 ± 9.1 | 4.9 | 191.3 ± 8.8 | 4.6 | 3.7 |
|
| |||||
| 20:0 | 5.4 ± 0.3 | 4.7 | 6.0 ± 0.4 | 6.0 | 9.7 |
|
| |||||
| 22:0 | 17.8 ± 0.9 | 5.0 | 20.7 ± 1.1 | 5.1 | 15.2 |
|
| |||||
| 24:0 | 17.7 ± 0.9 | 4.9 | 18.4 ± 0.8 | 4.4 | 4.0 |
|
| |||||
| 16:1n-7 | 41.2 ± 1.9 | 4.7 | 39.5 ± 2.1 | 5.4 | 4.4 |
|
| |||||
| 18:1n-9 | 423.6 ± 20.7 | 4.9 | 399.8 ± 16.3 | 4.1 | 5.8 |
|
| |||||
| 18:1n-7 | 25.5 ± 1.3 | 5.2 | 25.6 ± 1.2 | 4.6 | 0.6 |
|
| |||||
| 20:1n-9 | 3.7 ± 0.2 | 5.2 | 3.7 ± 0.2 | 6.4 | 1.6 |
|
| |||||
| 22:1n-9 | 0.7 ± 0.1 | 12.7 | 2.5 ± 0.4 | 17.4 | - |
|
| |||||
| 24:1n-9 | 15.1 ± 0.7 | 4.6 | 16.1 ± 0.6 | 3.7 | 6.1 |
|
| |||||
| 18:2n-6 | 694.1 ± 34.2 | 4.9 | 654.6 ± 25.6 | 3.9 | 5.9 |
|
| |||||
| 18:3n-6 | 15.8 ± 0.6 | 4.0 | 14.3 ± 0.6 | 4.3 | 10.3 |
|
| |||||
| 20:2n-6 | 4.8 ± 0.2 | 4.8 | 4.8 ± 0.2 | 3.8 | 0.4 |
|
| |||||
| 20:3n-6 | 42.4 ± 2.0 | 4.7 | 42.2 ± 1.4 | 3.4 | 0.5 |
|
| |||||
| 20:4n-6 | 132.3 ± 6.3 | 4.7 | 130.3 ± 4.4 | 3.4 | 1.5 |
|
| |||||
| 22:4n-6 | 7.0 ± 0.4 | 5.1 | 7.2 ± 0.3 | 4.2 | 2.0 |
|
| |||||
| 22:5n-6 | 2.7 ± 0.2 | 5.6 | 3.2 ± 0.2 | 6.2 | 18.1 |
|
| |||||
| 18:3n-3 | 15.2 ± 0.8 | 4.9 | 14.8 ± 0.6 | 4.2 | 2.6 |
|
| |||||
| 20:5n-3 | 18.8 ± 0.8 | 4.3 | 19.0 ± 0.9 | 4.6 | 1.0 |
|
| |||||
| 22:5n-3 | 16.5 ± 0.8 | 4.6 | 16.7 ± 0.6 | 3.7 | 1.5 |
|
| |||||
| 22:6n-3 | 27.1 ± 1.3 | 4.6 | 27.1 ± 0.8 | 3.0 | 0.3 |
|
| |||||
| 20:3n-9 | 1.7 ± 0.1 | 4.2 | 1.9 ± 0.2 | 8.0 | 10.6 |
|
| |||||
| Summary Saturates | 785 ± 41 | 5.2 | 791 ± 38 | 4.8 | 0.8 |
|
| |||||
| Monosaturates | 510 ± 25 | 4.8 | 487 ± 20 | 4.0 | 4.5 |
|
| |||||
| n-6 HUFA | 184 ± 9 | 4.7 | 183 ± 6 | 3.3 | 0.8 |
|
| |||||
| n-3 HUFA | 62 ± 3 | 4.5 | 63 ± 2 | 3.2 | 0.6 |
|
| |||||
| Total fatty acid | 2271 ± 113 | 5.0 | 2214 ± 89 | 4.0 | 2.6 |
Data expressed as mean± SD (μg/mL).
Plasma was obtained from a donor at the NIH Clinical Center; 100 μl was used for each assay.
HUFA, highly unsaturated fatty acid, indicating 20C or 22C and ≥2 double bonds.
The percent difference was calculated by dividing the absolute difference of the two values from Lepage & Roy and the robotic method by the average of the two values.
Fatty acids profile of umbilical cord serum
The fatty acid profile of umbilical cord serum from 287 human neonates, as presented in Table 3, had an average of 452 μg/mL (range 272–802) for saturated fatty acids; 298μg/mL (149–613) for monounsaturated fatty acids; 380 μg/mL (195–636) for n-6 PUFA; 54 μg/mL (24–130) for n-3 PUFA. These fatty acid classes accounted for 38.0%, 24.9%, 32.0% and 4.6%, respectively, of all fatty acids measured. Among the essential fatty acids (EFA), the major n-3 fatty acid, docosahexaenoic acid (DHA; 22:6n-3) was 47 μg/mL (21–114), accounting for 4.0% of total fatty acids. Its precursor, 18:3n-3, was 1.8 μg/mL (0.4–18.2) accounting for 0.15% of all fatty acids. The concentrations (in μg/mL) of 20:5n-3 was 1.7 and 22:5n-3 was 3.3. However, arachidonic acid (AA; 20:4n-6) averaged 176 μg/mL (84–300), 15.0% of all fatty acids and its precursor, 18:2n-6, was 140 μg/mL (54–390), accounting for 11.6% of all acids. The concentrations (in μg/mL) of 20:3n-6 was 33.9 and 22:5n-6 was 12.9. The frequencies of concentration for each PUFA are presented in Figure 4 as histograms with their Gaussian curves. The percentage of n-3 fatty acids in total HUFA averaged 18.0± 3.5% with a range of 11.3 to 32.8%. In contrast, the % n-6 in HUFA was 79.7± 3.1% with the highest quintile as 83.5%, and the lowest at 74.9%. The ratio of 20:4n-6 to 20:3n-9 was significantly different between the upper (60.3) and lower (14.9) quintiles.
TABLE 3.
Fatty acid profile in total lipids of umbilical cord venous serum
| Analytes |
Concentration (μg/mL, n=287)
|
% of Total Fatty Acid (wt%, n=287)
|
|||||||
|---|---|---|---|---|---|---|---|---|---|
| Mean ± SD | Median | Min | Max | Mean ± SD | Median | Min | Max | ||
|
|
|
||||||||
| 14:0 | 6.6 ± 3.4 | 6.0 | 1.7 | 23.4 | 0.54 ± 0.22 | 0.53 | 0.20 | 2.52 | |
|
| |||||||||
| 16:0 | 293.7 ± 85.5 | 277.8 | 169.8 | 992.5 | 24.55 ± 1.28 | 24.43 | 20.76 | 29.51 | |
|
| |||||||||
| 18:0 | 118.1 ± 26.9 | 113.2 | 68.3 | 244.2 | 9.99 ± 0.90 | 10.05 | 5.34 | 12.85 | |
|
| |||||||||
| 20:0 | 7.5 ± 1.8 | 7.3 | 4.4 | 16.1 | 0.64 ± 0.12 | 0.64 | 0.29 | 1.01 | |
|
| |||||||||
| 22:0 | 13.2 ± 3.4 | 12.7 | 6.8 | 36.0 | 1.13 ± 0.22 | 1.12 | 0.59 | 1.79 | |
|
| |||||||||
| 24:0 | 13.1 ± 3.3 | 12.6 | 6.5 | 30.5 | 1.12 ± 0.25 | 1.10 | 0.53 | 2.71 | |
|
| |||||||||
| 16:1n-7 | 37.1 ± 13.9 | 34.4 | 12.2 | 100.1 | 3.08 ± 0.66 | 3.03 | 1.43 | 6.17 | |
|
| |||||||||
| 18:1n-9 | 200.8 ± 67.3 | 186.8 | 95.1 | 747.7 | 16.70 ± 2.02 | 16.44 | 11.34 | 23.43 | |
|
| |||||||||
| 18:1n-7 | 37.1 ± 10.2 | 35.5 | 20.8 | 74.9 | 3.12 ± 0.41 | 3.09 | 1.87 | 4.84 | |
|
| |||||||||
| 20:1n-9 | 1.1 ± 0.5 | 1.0 | 0.5 | 7.2 | 0.09 ± 0.02 | 0.09 | 0.05 | 0.20 | |
|
| |||||||||
| 22:1n-9 | 0.6 ± 0.4 | 0.5 | 0.3 | 3.7 | 0.05 ± 0.03 | 0.05 | 0.02 | 0.31 | |
|
| |||||||||
| 24:1n-9 | 21.2 ± 6.2 | 20.4 | 8.4 | 59.1 | 1.82 ± 0.45 | 1.80 | 0.52 | 3.67 | |
|
| |||||||||
| 18:2n-6 | 140.5 ± 65.2 | 128.0 | 54.2 | 938.6 | 11.61 ± 2.15 | 11.34 | 6.94 | 25.56 | |
|
| |||||||||
| 18:3n-6 | 4.2 ± 1.2 | 4.0 | 1.8 | 8.4 | 0.35 ± 0.07 | 0.35 | 0.19 | 0.61 | |
|
| |||||||||
| 20:2n-6 | 4.5 ± 1.7 | 4.1 | 2.1 | 13.1 | 0.38 ± 0.12 | 0.35 | 0.20 | 1.12 | |
|
| |||||||||
| 20:3n-6 | 33.9 ± 8.1 | 32.5 | 12.8 | 60.6 | 2.90 ± 0.56 | 2.87 | 1.41 | 5.44 | |
|
| |||||||||
| 20:4n-6 | 176.1 ± 38.0 | 173.5 | 83.7 | 300.4 | 14.99 ± 1.89 | 15.14 | 7.54 | 20.36 | |
|
| |||||||||
| 22:4n-6 | 8.0 ± 2.4 | 7.6 | 3.1 | 20.9 | 0.68 ± 0.15 | 0.67 | 0.31 | 1.15 | |
|
| |||||||||
| 22:5n-6 | 12.9 ± 4.8 | 12.6 | 3.6 | 31.2 | 1.10 ± 0.35 | 1.06 | 0.34 | 2.14 | |
|
| |||||||||
| 18:3n-3 | 1.8 ± 1.5 | 1.5 | 0.4 | 18.2 | 0.15 ± 0.07 | 0.13 | 0.04 | 0.50 | |
|
| |||||||||
| 20:5n-3 | 1.7 ± 1.0 | 1.5 | 0.4 | 7.9 | 0.15 ± 0.08 | 0.13 | 0.05 | 0.69 | |
|
| |||||||||
| 22:5n-3 | 3.3 ± 1.5 | 3.0 | 1.0 | 10.1 | 0.28 ± 0.11 | 0.26 | 0.09 | 0.73 | |
|
| |||||||||
| 22:6n-3 | 47.3 ± 13.6 | 45.5 | 20.7 | 113.9 | 4.04 ± 0.95 | 3.98 | 1.83 | 8.02 | |
|
| |||||||||
| 20:3n-9 | 6.3 ± 3.5 | 5.4 | 1.7 | 25.3 | 0.54 ± 0.27 | 0.47 | 0.12 | 1.69 | |
|
| |||||||||
| Summary Saturates | 452 ± 117 | 428 | 272 | 1317 | 38.0± 1.5 | 37.9 | 34.5 | 43.0 | |
|
| |||||||||
| Monosaturates | 298 ± 92 | 279 | 149 | 931 | 24.9± 2.8 | 24.6 | 18.4 | 32.8 | |
|
| |||||||||
| n-6 PUFA | 380 ± 100 | 368 | 195 | 1317 | 32.0± 2.4 | 32.0 | 25.3 | 36.9 | |
|
| |||||||||
| n-3 PUFA | 54 ± 16 | 52 | 24 | 130 | 4.6± 1.1 | 4.5 | 2.6 | 9.3 | |
|
| |||||||||
| n-6 HUFA | 231 ± 46 | 229 | 119 | 378 | 19.7± 2.1 | 19.8 | 9.8 | 25.1 | |
|
| |||||||||
| n-3 HUFA | 52 ± 15 | 50 | 23 | 127 | 4.5± 1.1 | 4.4 | 2.3 | 9.1 | |
|
| |||||||||
| n6/n3 HUFA | 4.6 ± 1.0 | 4.5 | 2.0 | 7.7 | 4.6± 1.0 | 4.5 | 2.0 | 7.7 | |
|
| |||||||||
| Total fatty acid | 1191 ± 306 | 1128 | 708 | 3672 | |||||
Data expressed as both concentration (ug/mL) and the proportion of each fatty acid in total fatty acid weight (wt%).
PUFA: polyunsaturated fatty acids.
HUFA: see footnote to Table 2c.
Figure 4.

The frequency distribution of polyunsaturated fatty acids (PUFA) in umbilical cord serum (n=287). The concentrations (μg/mL) or percentage of n-3 or n-6 in total highly unsaturated fatty acids (HUFA) was plotted as histograms with their normalized curves.
DISCUSSION
Here, for the first time, we demonstrated that a complete, validated, automated high throughput method for fatty acid analysis together with the utility of automated data processing can be applied to an observational epidemiology study as an initial step toward demonstrating utility in large population-based studies.
Robotic fatty acid analysis technical development
One of the major challenges of this automation assay was to replace traditional vortex mixing in bench-top assays with repeated aspiration and dispensing of the mixture. Our current system had difficulties with repeated cycles of aspiration/dispensing as error messages were generated. This could be remedied by changing the tip but this was a slow and expensive solution. This issue was resolved by lowering the under-pressure limit default setting by over 10-fold (from - 400 to -5000) during the repeated aspiration/dispensing cycle.
The pressure-based liquid level detection (pLLD) is configured for the liquid classes PMP-Serum and PMP-FAME. This detects the liquid surface through a change of pressure in the air gap between the sample and the system liquid when the pipette tip enters or exits the liquid. One difficulty with our robotic system was that pipetting solution D led to solution dripping and an inaccurate transfer. The dripping could be prevented by pre-rinsing the tip. However, this created a malfunction in the pLLD procedure. This issue was resolved by adding a 5 s delay following the pre-rinse, which allowed the recovery of pressure in the air gap and provided for normal pLLD.
Acetyl chloride was used as a catalyst for the transesterification with complete derivatization of non-esterified fatty acid, triacylglycerol, cholesterol ester, phospholipid, and sphingomyelin [21]. However, acetyl chloride generates HCl gas that corroded the robot mechanics and electronics. This corrosion was greatly reduced by several steps as follows: addition to two additional preventive maintenance procedures conducted by manufacturer, increasing the air flow of the fume hood enclosing the robot platform; wiping robotic mechanical parts with alcohol before and after assay; parking LiHa rest position near the ventilation exit; removing the used tips and solvent B-Reaction immediately after use. In the longer term, it would be desirable to find an alternative derivatizating reagent that is less volatile and/or to significantly reduce the reaction time in the open tube.
Method validation
A linearity with a regression fit with r2 ≥ 0.99 (Fig 3) demonstrated that this method could be applied for the measurement of endogenous fatty acids in plasma/serum samples over a wide range of concentrations. Good agreement was observed for the fatty acid concentrations determined by the robotic assay compared to those by the reference method with %Diff less than 10% for the majority of fatty acids and ≤ 2% for n-6 HUFA and n-3 HUFA except 22:5n-6 (Table 2). The much higher concentration for the very minor 22:1n-9 peak in the robotic assay was likely due to an error in peak identification in this specific experiment.
The within-run precision of < 5.4% (with the exception of 14:0 (14%)) is well within the range of 1.1~7.9% obtained by GC/FID fatty acid analysis [25] and 4~14% by gas chromatography-mass spectrometry (GC/MS) fatty acid analysis [26]. A higher between-run CV compared to the within-run was observed in this robotic method as 1.5~12% (with the exceptions of 14:0 and 20:2n-6 (16%)). It was in comparable to that observed for GC/MS fatty acid analysis (7–17%) [26].
The validation of fatty acid recoveries in plasma samples is inherently difficult due to the widely varying concentration of various fatty acids within a particular sample. For this reason, recovery experiments were performed at three different concentrations and a plasma matrix with a low lipid content was employed in order to make such an experiment possible. The recoveries thus obtained were comparable to those observed by Quehenberger [26] of 78–115% using a negative chemical ionization GC/MS approach.
Epidemiological study
The distributions of the various PUFA and the fatty acid compositions were given for the umbilical cord venous serum samples in Figure 4 and Table 3, respectively, from the Three Study conducted in Baltimore, Maryland. The average concentration of DHA in total lipids in umbilical cord serum was 47.3 ± 13.6 μg/mL (mean ± SD, n = 287) with a median of 45.5. It accounted for 4.0 ± 0.9 % of the weight of total fatty acids. This is in the range of DHA concentrations observed in the umbilical cord plasma/serum total lipids as analyzed by various manually processed fatty acid methods: 40.7 μg/mL (n=11) in the study by Gil-Sanchez et al [27], 49.9 (n=10) by Lewis [28], and 65.5 μg/mL (n=21) in the study by Denkins [29]. Similarly, for AA, the average concentration was 176 ± 38 μg/mL (15 ± 1.9 wt%) with a median of 174 (15 wt%) and this was again in the range between 79.3 μg/mL [28] and 271 μg/mL [29]. These values were comparable to those observed in other rather large studies of phospholipid DHA and AA content by Donahue et al [30] and Kohlboeck [31] as they reported the values of 4.2% (DHA) and 15.5% (AA) in Project Viva (n=449), 7.2% (DHA) and 18.0% (AA) in LISAplus Study (n=416). However, both DHA and AA were higher in wt% than the values reported by Pankiewicz [32] of 2.8% DHA and 9.9% AA in total lipids (n=38). The differences in DHA and AA contents are largely dependent on the dietary intake of PUFA among various populations studied and such variations are therefore expected.
Limitation
The robot capital cost, frequent maintenance and the requirement for operation by a well-trained chemist familiar with the operation of GC instruments as well as proficient with automated data calculation would be the major constraint for the establishment of this approach in an analytical laboratory. Multiple fast GC instruments coupled with high efficiency capillary columns are required to accommodate the larger number of samples that are generated. Manual pipetting would be needed for samples with a very limited volume.
GC/FID fatty acid assay is generally semi-quantitative since typically one or two internal standards are used for over 20 fatty acids which occur at a wide range of concentrations in a particular plasma sample. More rigorous quantitation may be achieved using a stable isotope labeled analog of a particular fatty acid as internal standard when coupled with GC/MS analysis [26]. In addition, other methodological improvements may also be included in the future. For example, automated sample tracking would speed up work flow, backflushing of the GC injector would serve to shorten the GC run time. The microwave irradiation could potentially reduce the heating and reaction times of transesterification and thus greatly increase the sample throughput and reduce the acid-induced mechanical damage to the robot arm. An automated solid phase extraction separation could be employed to generate fatty acid data for various lipid classes.
Present and future applications
In the present application, three fast GC instruments running overnight were needed to support the sample output from a single transesterifying robotic system. A single well-trained analyst could operate the robot and GC systems as well as process the data in an automated fashion. The sample output from a typical week was 360 samples analyzed.
This robotic assay has been applied to the fatty acid analyses of 1,600 human serum from active-duty military in a case-control study [33] and 9,581 blood samples from new-born infants and 7-yr old children in a large population study, the Avon Longitudinal Study of Parents and Children (ALSPAC) [34]. The integration of finger prick sampling, robotic derivatization and extraction, fast gas chromatography, and the automated data processing will greatly facilitate fatty acid research. Our present study provides a “proof of principle” that research scale laboratories can perform the thousands of assays per year necessary to support large scale population-based studies concerning the relationship of fatty acid composition to human health and disease.
Supplementary Material
Acknowledgments
This research was supported, in part, by the Intramural Research Program of the National Institute on Alcohol Abuse and Alcoholism, National Institutes of Health; and the National Oceanic and Atmospheric Administration. Thanks to Dr. Shui-Lin Niu for helping with the preparation of the low lipid serum, and Mr. Brian Brown for his assistance with manuscript editing.
Abbreviations
- AA
arachidonic acid
- DHA
docosahexaenoic acid
- EFA
essential fatty acid
- FAME
fatty acid methyl ester
- GC or GC/FID
gas chromatography or gas chromatography-flame ionization detectors
- GC/MS
gas chromatography-mass spectrometry
- HUFA
highly unsaturated fatty acid
- ISTD
internal standard
- LiHa
liquid handling arm
- pLLD
pressure-based liquid level detection
- PMP
pressure monitored pipetting
- PUFA
polyunsaturated fatty acid
- Robot
automated liquid handling system
- VBA
Visual Basic Application
Footnotes
Conflict of interest
The authors declare that there are no conflicts of interest.
References
- 1.Bakker EC, Ghys AJ, Kester AD, Vles JS, Dubas JS, Blanco CE, Hornstra G. Long-chain polyunsaturated fatty acids at birth and cognitive function at 7 y of age. Eur J Clin Nutr. 2003;57:89–95. doi: 10.1038/sj.ejcn.1601506. [DOI] [PubMed] [Google Scholar]
- 2.Hibbeln JR, Davis JM, Steer C, Emmett P, Rogers I, Williams C, Golding J. Maternal seafood consumption in pregnancy and neurodevelopmental outcomes in childhood (ALSPAC study): an observational cohort study. Lancet. 2007;369:578–585. doi: 10.1016/S0140-6736(07)60277-3. [DOI] [PubMed] [Google Scholar]
- 3.Marchioli R, Barzi F, Bomba E, Chieffo C, Di GD, Di MR, Franzosi MG, Geraci E, Levantesi G, Maggioni AP, Mantini L, Marfisi RM, Mastrogiuseppe G, Mininni N, Nicolosi GL, Santini M, Schweiger C, Tavazzi L, Tognoni G, Tucci C, Valagussa F. Early protection against sudden death by n-3 polyunsaturated fatty acids after myocardial infarction: time-course analysis of the results of the Gruppo Italiano per lo Studio della Sopravvivenza nell’Infarto Miocardico (GISSI)-Prevenzione. Circulation. 2002;105:1897–1903. doi: 10.1161/01.cir.0000014682.14181.f2. [DOI] [PubMed] [Google Scholar]
- 4.Mihrshahi S, Peat JK, Webb K, Tovey ER, Marks GB, Mellis CM, Leeder SR. The childhood asthma prevention study (CAPS): design and research protocol of a randomized trial for the primary prevention of asthma. Control Clin Trials. 2001;22:333–354. doi: 10.1016/s0197-2456(01)00112-x. [DOI] [PubMed] [Google Scholar]
- 5.Seddon JM, George S, Rosner B. Cigarette smoking, fish consumption, omega-3 fatty acid intake, and associations with age-related macular degeneration: the US Twin Study of Age-Related Macular Degeneration. Arch Ophthalmol. 2006;124:995–1001. doi: 10.1001/archopht.124.7.995. [DOI] [PubMed] [Google Scholar]
- 6.Smithers LG, Collins CT, Simmonds LA, Gibson RA, McPhee A, Makrides M. Feeding preterm infants milk with a higher dose of docosahexaenoic acid than that used in current practice does not influence language or behavior in early childhood: a follow-up study of a randomized controlled trial. Am J Clin Nutr. 2010;91:628–634. doi: 10.3945/ajcn.2009.28603. [DOI] [PubMed] [Google Scholar]
- 7.Salem N, Jr, Kim HY, Yergy JA. Docosahexaenoic acid: membrane function and metabolism. In: Simopoulos AP, Kifer RR, Martin RE, editors. Health Effects of Polyunsaturated Fatty Acids in Seafoods. Academic Press; New York: 1986. pp. 263–317. [Google Scholar]
- 8.Mozaffarian D. Fish and n-3 fatty acids for the prevention of fatal coronary heart disease and sudden cardiac death. Am J Clin Nutr. 2008;87:1991S–1996S. doi: 10.1093/ajcn/87.6.1991S. [DOI] [PubMed] [Google Scholar]
- 9.Calon F, Lim GP, Morihara T, Yang F, Ubeda O, Salem N, Jr, Frautschy SA, Cole GM. Dietary n-3 polyunsaturated fatty acid depletion activates caspases and decreases NMDA receptors in the brain of a transgenic mouse model of Alzheimer’s disease. Eur J Neurosci. 2005;22:617–626. doi: 10.1111/j.1460-9568.2005.04253.x. [DOI] [PubMed] [Google Scholar]
- 10.Hibbeln JR, Salem N., Jr Dietary polyunsaturated fatty acids and depression: when cholesterol does not satisfy. Am J Clin Nutr. 1995;62:1–9. doi: 10.1093/ajcn/62.1.1. [DOI] [PubMed] [Google Scholar]
- 11.Dunstan JA, Mori TA, Barden A, Beilin LJ, Taylor AL, Holt PG, Prescott SL. Fish oil supplementation in pregnancy modifies neonatal allergen-specific immune responses and clinical outcomes in infants at high risk of atopy: a randomized, controlled trial. J Allergy Clin Immunol. 2003;112:1178–1184. doi: 10.1016/j.jaci.2003.09.009. [DOI] [PubMed] [Google Scholar]
- 12.Godwin SL, Chambers E, Cleveland L. Accuracy of reporting dietary intake using various portion-size aids in-person and via telephone. J Am Diet Assoc. 2004;104:585–594. doi: 10.1016/j.jada.2004.01.006. [DOI] [PubMed] [Google Scholar]
- 13.Marangoni F, Colombo C, Galli C. A method for the direct evaluation of the fatty acid status in a drop of blood from a fingertip in humans: applicability to nutritional and epidemiological studies. Anal Biochem. 2004;326:267–272. doi: 10.1016/j.ab.2003.12.016. [DOI] [PubMed] [Google Scholar]
- 14.Armstrong JM, Metherel AH, Stark KD. Direct microwave transesterification of fingertip prick blood samples for fatty acid determinations. Lipids. 2008;43:187–196. doi: 10.1007/s11745-007-3141-6. [DOI] [PubMed] [Google Scholar]
- 15.Banerjee P, Dawson G, Dasgupta A. Enrichment of saturated fatty acid containing phospholipids in sheep brain serotonin receptor preparations: use of microwave irradiation for rapid transesterification of phospholipids. Biochim Biophys Acta. 1992;1110:65–74. doi: 10.1016/0005-2736(92)90295-w. [DOI] [PubMed] [Google Scholar]
- 16.Glaser C, Demmelmair H, Koletzko B. High-throughput analysis of fatty acid composition of plasma glycerophospholipids. J Lipid Res. 2010;51:216–221. doi: 10.1194/jlr.D000547. [DOI] [PMC free article] [PubMed] [Google Scholar]
- 17.Masood A, Stark KD, Salem N., Jr A simplified and efficient method for the analysis of fatty acid methyl esters suitable for large clinical studies. J Lipid Res. 2005;46:2299–2305. doi: 10.1194/jlr.D500022-JLR200. [DOI] [PubMed] [Google Scholar]
- 18.Masood MA, Salem N., Jr High-throughput analysis of plasma fatty acid methyl esters employing robotic transesterification and fast gas chromatography. Lipids. 2008;43:171–180. doi: 10.1007/s11745-007-3130-9. [DOI] [PubMed] [Google Scholar]
- 19.Blix G. Electrophoresis of lipid-free blood serum. J Biol Chem. 1941;137:495–501. [Google Scholar]
- 20.Folch J, Lees M, Sloane Stanley GH. A simple method for the isolation and purification of total lipides from animal tissues. J Biol Chem. 1957;226:497–509. [PubMed] [Google Scholar]
- 21.Lepage G, Roy CC. Direct transesterification of all classes of lipids in a one-step reaction. J Lipid Res. 1986;27:114–120. [PubMed] [Google Scholar]
- 22.US Food and Drug Administration. [accessed January 2012];Guidance for Industry: Bioanalytical method validation. http://www.fda.gov/downloads/Drugs/GuidanceComplianceRegulatoryInformation/Guidances/UCM070107.pdf.
- 23.US Department of Health and Human Services. Medicare, Medicaid and CLIA programs; regulations implementing the Clinical Laboratory Improvement Amendments of 1988 (CLIA)--HCFA. Final rule with comment period. Fed Regist. 1992;57:7002–7186. [PubMed] [Google Scholar]
- 24.Apelberg BJ, Goldman LR, Calafat AM, Herbstman JB, Kuklenyik Z, Heidler J, Needham LL, Halden RU, Witter FR. Determinants of fetal exposure to polyfluoroalkyl compounds in Baltimore, Maryland. Environ Sci Technol. 2007;41:3891–3897. doi: 10.1021/es0700911. [DOI] [PubMed] [Google Scholar]
- 25.Glaser C, Demmelmair H, Koletzko B. High-throughput analysis of total plasma fatty acid composition with direct in situ transesterification. PLoS One. 2010;5:e12045. doi: 10.1371/journal.pone.0012045. [DOI] [PMC free article] [PubMed] [Google Scholar]
- 26.Quehenberger O, Armando AM, Dennis EA. High sensitivity quantitative lipidomics analysis of fatty acids in biological samples by gas chromatography-mass spectrometry. Biochim Biophys Acta. 2011;1811:648–656. doi: 10.1016/j.bbalip.2011.07.006. [DOI] [PMC free article] [PubMed] [Google Scholar]
- 27.Gil-Sanchez A, Larque E, Demmelmair H, Acien MI, Faber FL, Parrilla JJ, Koletzko B. Maternal-fetal in vivo transfer of [13C]docosahexaenoic and other fatty acids across the human placenta 12 h after maternal oral intake. Am J Clin Nutr. 2010;92:115–122. doi: 10.3945/ajcn.2010.29589. [DOI] [PubMed] [Google Scholar]
- 28.Lewis RM, Hanson MA, Burdge GC. Umbilical venous-arterial plasma composition differences suggest differential incorporation of fatty acids in NEFA and cholesteryl ester pools. Br J Nutr. 2011;106:463–467. doi: 10.1017/S0007114511000377. [DOI] [PubMed] [Google Scholar]
- 29.Denkins YM, Woods J, Whitty JE, Hannigan JH, Martier SS, Sokol RJ, Salem N., Jr Effects of gestational alcohol exposure on the fatty acid composition of umbilical cord serum in humans. Am J Clin Nutr. 2000;71:300S–306S. doi: 10.1093/ajcn/71.1.300s. [DOI] [PubMed] [Google Scholar]
- 30.Donahue SM, Rifas-Shiman SL, Olsen SF, Gold DR, Gillman MW, Oken E. Associations of maternal prenatal dietary intake of n-3 and n-6 fatty acids with maternal and umbilical cord blood levels. Prostaglandins Leukot Essent Fatty Acids. 2009;80:289–296. doi: 10.1016/j.plefa.2009.02.007. [DOI] [PMC free article] [PubMed] [Google Scholar]
- 31.Kohlboeck G, Glaser C, Tiesler C, Demmelmair H, Standl M, Romanos M, Koletzko B, Lehmann I, Heinrich J. Effect of fatty acid status in cord blood serum on children’s behavioral difficulties at 10 y of age: results from the LISAplus Study. Am J Clin Nutr. 2011;94:1592–1599. doi: 10.3945/ajcn.111.015800. [DOI] [PubMed] [Google Scholar]
- 32.Pankiewicz E, Cretti A, Ronin-Walknowska E, Czeszynska MB, Konefal H, Hnatyszyn G. Maternal adipose tissue, maternal and cord blood essential fatty acids and their long-chain polyunsaturated derivatives composition after elective caesarean section. Early Hum Dev. 2007;83:459–464. doi: 10.1016/j.earlhumdev.2006.09.005. [DOI] [PubMed] [Google Scholar]
- 33.Lewis MD, Hibbeln JR, Johnson JE, Lin YH, Hyun DY, Loewke JD. Suicide deaths of active-duty US military and omega-3 fatty-acid status: a case-control comparison. J Clin Psychiatry. 2011;72:1585–90. doi: 10.4088/JCP.11m06879. [DOI] [PMC free article] [PubMed] [Google Scholar]
- 34.Steer CD, Hibbeln JR, Golding J, Smith GD. Polyunsaturated fatty acid levels in blood during pregnancy, at birth and at 7 years: their associations with two common FADS2 polymorphisms. Hum Mol Genet. 2012 doi: 10.1093/hmg/ddr588. (in press) [DOI] [PMC free article] [PubMed] [Google Scholar]
Associated Data
This section collects any data citations, data availability statements, or supplementary materials included in this article.