

Abstract
Interactions between dopamine and glutamate signalling within the nucleus accumbens core are required for behavioural reinforcement and habit formation. Dopamine modulates excitatory glutamatergic signals from the prefrontal cortex, but the precise mechanism has not been identified. We combined optical and electrophysiology recordings in murine slice preparations from CB1 receptor-null mice and green fluorescent protein hemizygotic bacterial artificial chromosome transgenic mice to show how dopamine regulates glutamatergic synapses specific to the striatonigral and striatopallidal basal ganglia pathways. At low cortical frequencies, dopamine D1 receptors promote glutamate release to both D1 and D2 receptor-expressing medium spiny neurons while D2 receptors specifically inhibit excitatory inputs to D2 receptor-expressing cells by decreasing exocytosis from cortical terminals with a low probability of release. At higher cortical stimulation frequencies, this dopaminergic modulation of presynaptic activity is occluded by adenosine and endocannabinoids. Glutamatergic inputs to both D1 and D2 receptor-bearing medium spiny neurons are inhibited by adenosine, released upon activation of NMDA and AMPA receptors and adenylyl cyclase in D1 receptor-expressing cells. Excitatory inputs to D2 receptor-expressing cells are specifically inhibited by endocannabinoids, whose release is dependent on D2 and group 1 metabotropic glutamate receptors. The convergence of excitatory and inhibitory modulation of corticoaccumbal activity by dopamine, adenosine and endocannabinoids creates subsets of corticoaccumbal inputs, selectively and temporally reinforces strong cortical signals through the striatonigral pathway while inhibiting the weak, and may provide a mechanism whereby continued attention might be focused on behaviourally salient information.
Key points
Dopamine's control over excitatory signals from the cortex to the nucleus accumbens is thought to underlie motor learning, behavioural reinforcement and drug dependence.
In this study, we combined optical recordings of presynaptic release with whole-cell electrophysiology in CB1 receptor-null mice and bacterial artificial chromosome (BAC) transgenic mice with fluorescently labelled D1 and D2 receptor-expressing neurons to identify the specific interactions between dopamine and glutamate signalling at individual cortical terminals within the nucleus accumbens core.
Experiments showed that dopamine produces frequency-dependent filtering of low-probability release synapses. At low frequencies, D1 receptors excited striatal output neurons of the striatonigral and striatopallidal pathways, while D2 receptors specifically inhibited neurons of the striatopallidal pathway. At higher frequencies, the dopamine-dependent release of adenosine and endocannabinoids promoted further temporal filtering of cortical signals entering both output pathways.
These results help us understand how dopamine provides frequency and temporal filtering of cortical information by promoting activity through the striatonigral pathway, while inhibiting weak signals.
Introduction
The neocortex refines movements and goal-directed behaviours through basal ganglia circuits that contribute feedback and feed-forward integrative signalling (Albin et al. 1989). Excitatory glutamatergic signals from neurons in the prefrontal cortex (PFC) and dopaminergic projections from neurons in the ventral tegmentum (VTA) enter the nucleus accumbens core (NAcore) to form synapses on medium spiny neurons (MSNs). Dopamine released by salient behavioural stimuli or amphetamine (Pennartz et al. 1994; Sulzer, 2011) diffuses into the synaptic cleft where it differentially regulates the excitability of D1-class dopamine receptor (D1R)-expressing MSNs, which constitute the ‘direct’ striatonigral pathway that initiates movements and behaviours, and D2-class dopamine receptor (D2R)-expressing MSNs, which form the ‘indirect’ striatopallidal pathway that suppresses competing actions (Pennartz et al. 1994; Nicola et al. 2000).
Regulation of excitatory signals by dopamine and other neuromodulators, including adenosine and endocannabinoids, is considered necessary for the establishment of reward and attention (Harvey & Lacey, 1996; Kalivas & Volkow, 2005; Bamford et al. 2008; Pan et al. 2008) and alterations in their availability are thought to underlie numerous neuropsychological disorders including Parkinsonism (Bamford & Cepeda, 2009; Cepeda et al. 2010), schizophrenia (Goto & Grace, 2007), and drug dependence (Kalivas & Volkow, 2005). However, the mechanism by which this modulation develops in the NAcore remains unclear. Electrophysiological recordings have shown that dopamine can impede corticoaccumbal activity through presynaptic D1 (Harvey & Lacey, 1996; Nicola et al. 1996; Nicola & Malenka, 1997) and D2 receptors (O’Donnell & Grace, 1994; Brady & O’Donnell, 2004), or through adenosine (Harvey & Lacey, 1997; Dunwiddie & Masino, 2001) and endocannabinoids (Grueter et al. 2010). Thus, how dopamine modulates corticoaccumbal neurotransmission remains unsettled, although this issue is paramount to understanding striatal function.
To gain an understanding of how dopamine controls cortical information entering the striatonigral and striatopallidal pathways within the NAcore, we combined presynaptic optical approaches with postsynaptic electrophysiology in CB1 receptor (CB1R)-null mice (CB1−/−) and in hemizygotic bacterial artificial chromosome (BAC) transgenic mice expressing the reporter enhanced green fluorescent protein (EGFP) under the control of the D1 and D2 dopamine receptor promoters (Drd1-EGFP and Drd2-EGFP). The goals of this study were first to identify frequency- and stimulation-dependent interactions between dopamine and glutamate signalling at individual cortical terminals within the NAcore and second to determine how adenosine and endocannabinoids channel information through striatonigral and striatopallidal pathways.
Methods
Ethical approval
All experimental procedures were approved by the Institutional Animal Care and Use Committee at the University of Washington. Male mice aged 4–9 weeks were housed with a 12 h light–dark cycle with ad libitum access to food and water and were anaesthetized with Nembutal (120 mg kg−1 i.p.) or ketamine (650 mg kg−1 i.p.) with xylazine (44 mg kg−1 i.p.) prior to killing. C57BL/6 mice (n = 202) were obtained from The Jackson Laboratory (Bar Harbor, ME, USA). CB1−/− (n = 12) and wild-type (WT) littermates (CB1+/+; n = 10), generated as described on a C57BL/6 background (Marsicano et al. 2003), were a kind gift from Dr Nephi Stella, University of Washington, Seattle. Hemizygous Drd1 (n = 54) and Drd2 (n = 40) EGFP BAC transgenic mice were generated as described on a C57BL/6 background (Cepeda et al. 2008) and mice used for breeding were a kind gift from Dr Michael Levine, University of California, Los Angeles, CA, USA.
Optical imaging with FM1-43
Optical recordings of cortical afferents in the motor striatum were performed as described (Bamford et al. 2004a). Sagittal sections 250 μm thick containing the PFC and NAcore were cut using a vibrating blade microtome and recovered for 1 h in carbogenated (95% O2, 5% CO2) ACSF containing (in mm): NaCl 109, KCl 5, NaHCO3 35, NaH2PO4 1.25, Hepes 20, MgCl2 1.2, CaCl2 2, glucose 10 (pH 7.3–7.4, 295–305 mosmol l−1) at room temperature. Experiments were performed on slices obtained at an interaural distance range of 0.72 mm to 1.44 mm from midline. During the experiment, slices were held in a RC-27L incubation chamber (56 μl mm−1; Warner Instruments, Hamden, CT, USA) and were perfused with ACSF at 2–3 ml min−1. To ensure equilibrium, sections were exposed to pharmacological agents for 10 min before unloading. Drugs were obtained from Sigma-Aldrich (St Louis, MO, USA) or Tocris Bioscience (Bristol, UK).
The endocytic tracer FM1-43 (N-[3-(triethylammonio) propyl]-4-(4-dibutylaminostyryl) pyridinium dibromide; Molecular Probes; 8 μm) was loaded into corticoaccumbal terminals by stimulating the PFC at 10 Hz for 10 min with 400 μA, 200 μs pulses via a twisted tungsten bipolar electrode. The electrode was placed over the dorsal PFC that preferentially projects to the NAcore (Gorelova & Yang, 1997). This loading method ensures that changes in release of FM1-43 are not due to inadequate FM1-43 loading of the recycling synaptic vesicle pool (Bamford et al. 2004b; Joshi et al. 2009). As FM1-43 destaining generally followed first-order kinetics (Joshi et al. 2009), corticoaccumbal release was characterized by the half-time of destaining (t1/2), defined as the time required for terminal fluorescence to decay to half of its initial value.
Following terminal loading, slices were superfused in ADVESEP-7 (1 mm; CyDex, Overland Park, KS, USA) for 2 min to remove adventitious staining. For stimulation-dependent destaining, pulse trains were again delivered to the dorsal PFC. ADVASEP-7 (100 μm) was used during unloading to prevent recurrent endocytosis of dye into synaptic terminals. Few puncta were labelled in the absence of stimulation (Joshi et al. 2009) or following a cut between the cortex and striatum and no destaining occurred upon restimulation. Electrical stimulation was provided by a Grass Stimulator (West Warwick, RI, USA) through a stimulation isolator (AMPI, Jerusalem, Israel) and monitored by a Tektronix TDS 3014B digital oscilloscope (Beaverton, OR, USA).
Image acquisition and analysis
Fluorescent corticoaccumbal terminals in the NAcore were visualized using an LSM 510 NLO multiphoton laser-scanning microscope equipped with a titanium-sapphire laser (excitation 810 nm/emission 625 nm) and a 40× inverted oil objective (Zeiss). Images were captured in 8-bit, 123 μm × 123 μm regions of interest (ROI) at 512 pixel × 512 pixel resolution and acquired at 22.5 s intervals using Zeiss LSM 510 software. To compensate for z-axis shift, a z-series of five images, separated by 1 μm in the z-axis, was obtained for each imaging period. The time series of images was analysed for changes in presynaptic terminal fluorescence using ImageJ (Wayne Rosband, National Institutes of Health, Rockville, MD, USA) and custom software written in Interactive Data Language (IDL; Research Systems, Boulder, CO, USA) (Bamford et al. 2004b). Fluorescent puncta, 0.5–1.5 μm in diameter, were identified in the NAcore. The criteria for punctum inclusion were (1) spherical shape, (2) fluorescence 2 standard deviations above the background, and (3) stimulation-dependent destaining. The IDL software aligned and combined the five image z-series for each time interval and the overall intensity of the FM1-43 fluorescence was measured over the course of the time series. ImageJ was used to subtract background fluorescence of the tissue from the fluorescence intensity of each individual punctum. The results were then normalized by the maximal puncta fluorescence just prior to application of destaining stimulation. The half-time of fluorescence intensity decay during destaining (t1/2) was determined using a software algorithm written on SigmaPlot software (Systat Software Inc., San Jose, CA, USA). Nearness of fit to first-order kinetics was determined using A = 100 × exp(ln(0.5) ×t/t1/2), an integrated form of the first-order kinetics equation: −dA/dt = kA.
Electrophysiology
Electrophysiological recordings in MSNs from mice were performed, as described (Bamford et al. 2008), and standard techniques were used to prepare slices for electrophysiology (Bamford et al. 2004b). Brains were dissected and placed in ice-cold, carbogenated low Ca2+ ACSF containing (in mm): NaCl 130, KCl 3, NaHCO3 26, NaH2PO4 1.25, MgCl2 5, CaCl2 1 and glucose 10. Sagittal slices (300 μm) were prepared on a vibrating blade microtome then transferred to an incubating chamber containing carbogenated background ACSF containing (in mm): NaCl 124, KCl 5, NaHCO3 26, NaH2PO4 1.25, MgCl2 2, CaCl2 2 and glucose 10 (pH7.2–7.4, 290–310 mosmol l−1) at room temperature. After 1 h, slices were placed on the stage of a Zeiss Axioskop FS microscope and submerged in continuously flowing carbogenated background ACSF (3 ml min−1) at room temperature.
Whole-cell patch clamp recordings in voltage clamp mode were obtained from MSNs (n = 395) visualized in slices with the aid of infrared videomicroscopy coupled with differential interference contrast optics and fluorescent filters optimized to detect EGFP fluorescence and infrared light. MSNs were identified by somatic size (∼8–12 μm) and typical passive basic membrane properties (membrane resistance 212 ± 9 MΩ, membrane capacitance 100 ± 2 pF and time constant 1.6 ± 0.03 ms) (Joshi et al. 2009). Cell identification was confirmed by labelling with 1% biocytin, according to published protocols (Cepeda et al. 2001). The series resistance of each cell was <20 MΩ(15.4 ± 0.3 MΩ). Electrophysiological properties were monitored throughout the recording and cells were removed from the analysis if the series resistance changed by >20%. For voltage clamp recordings, the patch pipette (4–6 MΩ) contained the following internal solution (in mm): caesium methanesulfonate 125, KCl 3, NaCl 4, MgCl2 1, MgATP 5, EGTA 5, Hepes 8, Tris-GTP 1, di-sodium phosphocreatine 10, leupeptin 0.1 and N-(2,6-dimethylphenylcarbamoylmethyl) triethylammonium bromide 4 (QX-314; pH 7.2–7.3, 270–280 mosmol l−1). In some experiments, the cAMP inhibitor Rp-cAMPS (400 μm) was added to the internal solution. For current-clamp recordings, the patch pipette (4–6 MΩ) contained the following internal solution (in mm): potassium gluconate 112.5, KCl 17.5, NaCl 4, MgCl2 1, CaCl2 0.5, EGTA 5, Hepes 10, NaGTP 1, K2ATP 5 (pH 7.2–7.3, 270–280 mosmol l−1). EPSCs were isolated by blocking GABA-A receptors with picrotoxin (50 μm) or with bicuculline (10 μm). In addition, cells were held at −70 mV to further minimize the contribution of GABA-A mediated events and that of voltage-gated conductances.
Excitatory postsynaptic currents (EPSCs) were evoked by electrical stimulation of the deep cortical layers of the dorsal PFC at stimulation strengths adjusted to 1.5× threshold (1.5 ± 0.1 mA). The stimulating electrodes were of the same type of bipolar tungsten electrode used in the optical studies and both stimulating and recording electrodes were placed in the same locations described in the imaging experiments. Paired current pulses (200 μs duration) delivered at 20 Hz were presented every 30 s. Evoked (e) EPSC amplitudes were averaged and compared before and during bath application of the receptor ligand. Paired-pulse ratios were determined by dividing the amplitude of the second pulse by that of the first pulse and then multiplying by 100. Cells demonstrating eEPSCs with variable latencies or prolonged durations, suggesting polysynaptic responses, were rejected from analysis.
Miniature (m) EPSCs were recorded in gap free mode with the Na+ channel blocker TTX (1 μm) for 90 s before and during bath-application of a receptor ligand. Spontaneous (s) EPSCs were recorded without TTX. For some experiments, sEPSCs were recorded following conditioning stimuli. In these cells, the stimulus current threshold required to evoke an EPSC was determined using six single cortical pulses applied every 30 s. Conditioning stimuli, consisting of two paired-pulses at 20 Hz, were then presented three times with a 30 s interval between stimulation trains. The brain slices were then exposed to the receptor ligand and sEPSCs were again observed for 90 s. The membrane current was filtered at 1 kHz and digitized at 100 μs using Clampfit 10.1 (Molecular Devices, Inc., Sunnyvale, CA, USA). Spontaneous synaptic events were analysed off-line using the Mini Analysis Program (Synaptosoft, Leonia, NJ, USA). The threshold amplitude for the detection of an event was adjusted to at least 2 times above root mean square noise level (∼2–3 pA at −70 mV). Synaptic events could be prevented by adding the AMPA receptor (AMPAR) antagonist 2,3-dihydroxy-6-nitro-7-sulfamoyl-benzo[f]quinoxaline- 2,3-dione (NBQX; 10 μm) to the bath solution, indicating that they arose from activation of glutamatergic receptors.
Data analysis
Values given in the text and in the figures are means ± SEM. Differences in mean values, derived from 3–14 slices from 3–9 mice, were assessed with the non-parametric Mann–Whitney U test, Student's paired t test (two groups) or appropriate ANOVAs (multiple groups) followed by multiple comparisons using a Bonferroni adjustment. For optical studies, destaining was compared using the F test, population distributions were compared using the Kolmogorov–Smirnov test and changes in terminal subpopulations were also determined graphically using normal probability plots by comparing release half-times of individual terminals. For electrophysiological experiments, data was compared using a Student's paired t test before and 5 to 7.5 min after ligand perfusion. Differences analysed by Statistica (StatSoft, Tulsa, OK, USA) were considered significant if P < 0.05.
Online Supplemental Material
Supplementary methods, figures and references are provided. Supplementary Methods and Fig. S1 illustrate the fractional destaining of FM1-43 at 1 Hz through 20 Hz with and without the dopamine releaser amphetamine. Supplementary Figs S2–S7 show how amphetamine, dopamine, endocannabinoid and glutamate receptors modify subpopulations of corticoaccumbal terminals.
Results
Dopamine and endocannabinoids promote frequency-dependent filtering at presynaptic corticoaccumbal terminals
Exocytosis from PFC terminals within the NAcore was directly measured using the endocytic tracer FM1-43 combined with multiphoton confocal microscopy in murine sagittal slices (Fig. 1A and B). Bipolar stimulation of layers V–VI of the dorsal PFC produced endocytosis of FM1-43 dye into recycling synaptic vesicles (Fig. 1B–D). Multiphoton optical recordings in the NAcore revealed fluorescent puncta (diameter = 1.1 ± 0.1 μm; mean ± SEM; n = 11 puncta) distinctive of corticostriatal afferents that, upon re-stimulation, decreased in a manner approximating first-order kinetics (r2 > 0.973; P < 0.001, F test), characteristic of regulated synaptic vesicle fusion (Bamford et al. 2004b) (Fig. 1D–F). Corticoaccumbal release was characterized by the half-time of destaining (t1/2), defined as the time required for terminal fluorescence to decay to half of its initial value.
Figure 1. Amphetamine and endocannabinoids produce frequency-dependent filtering at corticoaccumbal terminals.
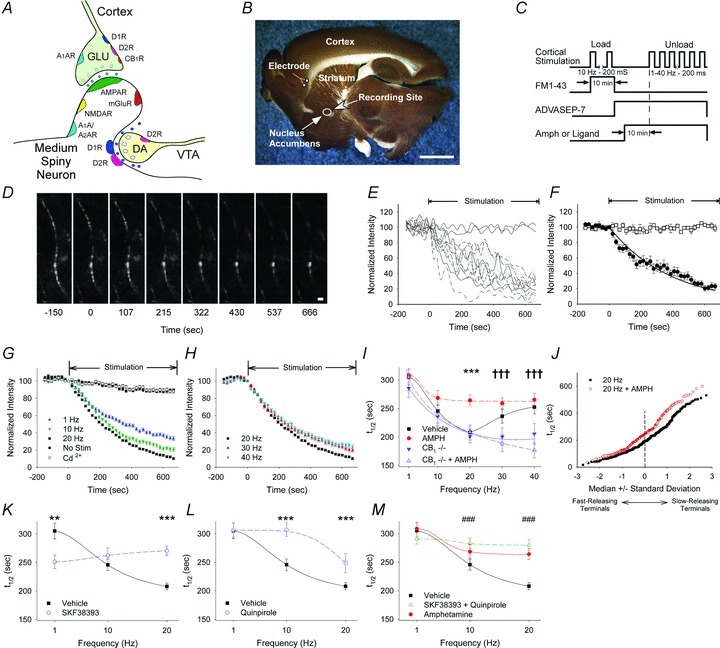
A, cartoon of the basic ‘striatal microcircuit’. GLU, glutamatergic afferent; VTA, ventral tegmental area; DA, dopamine afferent; mGluR, metabotropic glutamate receptor; D, dopamine receptor; A1R and A2R, adenosine receptor; CB1, cannabinoid receptor. B, a sagittal corticoaccumbal slice stained with FM1-43 and 3,3′-diaminobenzidine shows the stimulation and recording regions. Corticoaccumbal terminals from the PFC were stimulated with a bipolar electrode. Two-photon images of corticoaccumbal terminals and electrophysiological recordings in MSNs were obtained within the NAcore (circle within the striatum). Bar, 3 mm. C, protocol for loading and destaining corticoaccumbal terminals with FM1-43. D, stimulation of the PFC in the presence of FM1-43 created labelled puncta, sometimes seen in en passant arrays. Re-stimulation of the PFC at 20 Hz resulted in activity-dependent destaining of most puncta. Stimulation began at t = 0. Bar, 2 μm. E, time-intensity analysis of fluorescent puncta along the axon array, shown in panel D, during unloading demonstrates differential release kinetics. The plateau lines on the graph represents optical measurements from non-destaining fluorescent puncta. F, mean ± SEM fluorescence intensity of destaining and non-destaining puncta shown in panel E. Curve demonstrates exponential fitting for first-order kinetics. G, stimulation of the PFC at 1 Hz, 10 Hz and 20 Hz produced a frequency-dependent increase in FM1-43 destaining reflected by a decrease in FM1-43 destaining. Little FM1-43 destaining occurred when no stimulation was applied or when cadmium (Cd2+) was added to the bath. H, PFC stimulation frequencies of 30 Hz and 40 Hz progressively reduced exocytosis from corticoaccumbal terminals. I, mean destaining half-times (t1/2) of FM1-43 release in slices from WT and CB1−/− mice perfused in vehicle or amphetamine (AMPH). *P < 0.05, **P < 0.01, ***P < 0.001, amphetamine compared with vehicle and †††P < 0.001 for vehicle or amphetamine, compared with data obtained from CB1−/− mice, Mann–Whitney U test. J, normal probability plot comparison of individual half-times of release in slices from WT mice shows that amphetamine reduces FM1-43 release from terminals with lowest probability of release (e.g. those with the highest t1/2). K, distribution of mean t1/2 of release for slices from WT mice exposed to vehicle or the D1R agonist SKF38393 (SKF) at 1, 10 and 20 Hz. For panels K and L, **P < 0.01, ***P < 0.001, Mann–Whitney U test. L, distribution of mean t1/2 of release for slices from WT mice exposed to vehicle or the D2R agonist quinpirole (QUIN) at 1, 10 and 20 Hz. M, distribution of mean t1/2 of release in slices from WT mice exposed to vehicle, amphetamine or to the combination of SKF38393 and quinpirole at 1, 10 and 20 Hz. ###P < 0.001 for SKF38393 with quinpirole, compared with vehicle, Mann–Whitney U test.
Stimulation of the PFC in slices from WT mice at frequencies of 1 Hz (n = 104 puncta), 10 Hz (n = 136), and 20 Hz (n = 330) produced a corresponding increase in terminal release reflected by a decrease in the half-time of FM1-43 destaining (t1/2 = 305 s at 1 Hz, t1/2 = 245 s at 10 Hz, and t1/2 = 207 s at 20 Hz; F(2,567) = 28, P < 0.001, ANOVA) (Fig. 1G and I). Little FM1-43 destaining occurred in the absence of cortical stimulation (n = 80) and destaining was calcium dependent, as bath application of the calcium channel blocker cadmium (200 μm; n = 99) prevented release of the dye (Fig. 1G), consistent with vesicular exocytosis.
To determine if dopamine might alter corticoaccumbal exocytosis, we recorded FM1-43 destaining in the presence of amphetamine (10 μm), which raises striatal dopamine concentrations to ∼6 μm (Bamford et al. 2004b). Compared to vehicle, amphetamine had little effect on FM1-43 release in slices from WT mice at stimulation frequencies of 1 Hz (t1/2 = 308 s; n = 103) and 10 Hz (t1/2 = 268 s; n = 97), but decreased the half-time of FM1-43 release at 20 Hz stimulation (t1/2 = 264 s; n = 193; F(4,1442) = 2.3, P = 0.05, 2-way ANOVA for interaction between frequency and amphetamine) by diminishing the fractional destaining of FM1-43 by 42% (Fig. 1I and Fig. S1).
One advantage of these optical recordings is that the kinetics of individual presynaptic terminals can be observed. When individual terminal half-times are presented in a normal probability plot, where the x-axis indicates the standard deviation from the median value, a straight line indicates a normally distributed population (Bamford et al. 2004b). At 20 Hz stimulation frequency, amphetamine specifically depressed release from a subset of terminals with a low probability of release (Fig. 1J and Supplementary Fig. S2).
We determined if the apparent lack of response to amphetamine at lower stimulation frequencies might be attributed to the differential effects of amphetamine acting through D1 and D2 dopamine receptors. With bath application of the D1R agonist SKF38393 (10 μm), the half-time of dye release remained constant with an increase in stimulation frequency (t1/2 = 251 s at 1 Hz, n = 97; t1/2 = 262 s at 10 Hz, n = 122, and t1/2 = 270 s at 20 Hz, n = 266) so that compared to vehicle, the D1R agonist was excitatory at 1 Hz (P < 0.001, Mann–Whitney U test) but inhibitory at 20 Hz (P < 0.001, Mann–Whitney U test) (Fig. 1K). Conversely, the D2R agonist quinpirole (0.5 μm) had little effect at 1 Hz (t1/2 = 306 s, n = 96) but progressively depressed release at higher frequencies of 10 Hz (t1/2 = 302 s; P < 0.001, n = 86, Mann–Whitney U test) and 20 Hz (t1/2 = 248 s; P < 0.001, compared to vehicle, n = 80, Mann–Whitney U test) (Fig. 1L). Similar to amphetamine, both SKF38393 and quinpirole modulated terminals with a low probability of release (Supplementary Fig. S3) and the combined responses from SKF38393 and quinpirole at stimulation frequencies of 1 Hz to 20 Hz (t1/2 = 291 s at 1 Hz, n = 193; t1/2 = 283 s at 10 Hz, n = 208 and t1/2 = 280 s at 20 Hz, n = 186) were similar to those following amphetamine (Fig. 1M).
Stimulation frequencies in excess of 20 Hz caused a progressive reduction in corticoaccumbal exocytosis in the absence of amphetamine (t1/2 = 207 s at 20 Hz; t1/2 = 236 s at 30 Hz, n = 105, and t1/2 = 252 s at 40 Hz, n = 88; F(2,520) = 17, P < 0.001, ANOVA), such that amphetamine had no effect on presynaptic release at stimulation frequencies of 30 Hz (t1/2 = 259 s; n = 147) and 40 Hz (t1/2 = 265 s; n = 148) (Fig. 1H–I and Supplementary Fig. S2). Consistent with prior reports (Yin & Lovinger, 2006), presynaptic inhibition by amphetamine at stimulation frequencies above 10 Hz was dependent on endocannabinoids, since amphetamine had no effect on release in slices from CB1−/− mice (t1/2 = 305 s at 1 Hz, n = 78; 239 s at 10 Hz, n = 91; 208 s at 20 Hz, n = 102; 189 s at 30 Hz, n = 71; 177 s at 40 Hz, n = 77) (Fig. 1I). Furthermore, while FM1-43 release in slices from CB1−/− mice increased with stimulation frequencies of 1 Hz to 20 Hz (t1/2 = 285 s at 1 Hz, n = 76; t1/2 = 236 s at 10 Hz, n = 162; t1/2 = 201 s at 20 Hz; n = 114; F(2,294) = 9, P < 0.001, compared with vehicle in WT mice, ANOVA) (Fig. 1I), higher stimulation frequencies of 30 Hz and 40 Hz reduced exocytosis from most terminals in slices from WT mice but not in slices from CB1−/− mice (t1/2 = 200 s at 30 Hz, n = 81 and t1/2 = 206 s at 40 Hz, n = 72, P < 0.001, Mann–Whitney U test) (Fig. 1I and Supplementary Fig. S4), suggesting that very high stimulation frequencies can release endocannabinoids in the absence of dopamine.
Presynaptic inhibition through adenosine is dependent on D1, NMDA and AMPA receptors
Since presynaptic filtering by amphetamine was generated at 20 Hz, we used this stimulation frequency to determine how corticoaccumbal inhibition was produced through D1Rs. Similar to amphetamine, the D1R agonist SKF38393 increased FM1-43 destaining (t1/2 = 270 s for a SKF38393, n = 193 puncta vs. t1/2 = 207 s for vehicle, n = 330; P < 0.001, Mann–Whitney U test) (Fig. 2A and B), by inhibiting terminals with the lowest probability of release (Supplementary Fig. S5). The D1R antagonist SCH23390 (10 μm) did not change exocytosis (t1/2 = 183 s, n = 163; P = 0.1, compared to vehicle, Mann–Whitney U test) (Fig. 2A and B) and as expected, blocked inhibition by the D1R agonist SKF38393 (t1/2 = 213 s, n = 90; P = 0.1, compared to vehicle, Mann–Whitney U test) (not shown). While the addition of SCH23390 to amphetamine accelerated FM1-43 destaining (t1/2 = 237 for amphetamine with SCH23390, n = 163; P = 0.02, compared to amphetamine alone, Mann–Whitney U test), it only partially blocked inhibition by amphetamine (P = 0.03, compared to vehicle, Mann–Whitney U test) (Fig. 2A and B), confirming that dopamine-mediated inhibition of corticoaccumbal activity occurred in part, but not entirely through D1Rs.
Figure 2. D1R-mediated inhibition of corticoaccumbal release requires adenosine.
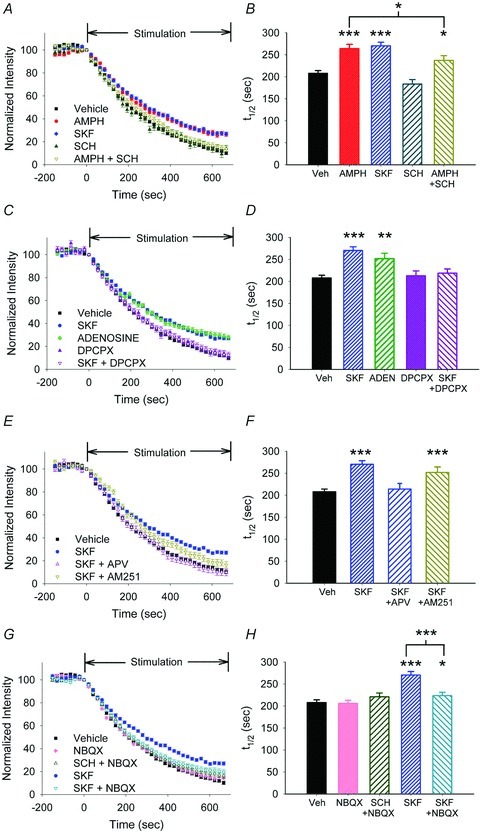
A, FM1-43 destaining curves show that, compared to vehicle (Veh), amphetamine or the D1R agonist SKF38393 reduced corticoaccumbal release. The D1R antagonist SCH23390 (SCH) had no effect on release and only partially blocked inhibition by amphetamine (AMPH+SCH). B, distribution of the mean t1/2 of release for the destaining curves shown in panel A. For all panels, *P < 0.05, **P < 0.01, ***P < 0.001, Mann–Whitney U test. C, similar to SKF38393, adenosine (ADEN) inhibited FM1-43 release. DPCPX alone did not alter destaining but blocked the inhibition produced by SKF38393 (SKF + DPCPX). D, distribution of the mean t1/2 of release for the destaining curves shown in panel C. E, the NMDAR antagonist APV prevented inhibition by SKF38393 (SKF + APV), while the CB1R antagonist AM251 did not significantly alter FM1-43 destaining (SKF + AM251). F, distribution of the mean t1/2 of release for the destaining curves shown in panel E. G, the AMPAR antagonist NBQX with or without SCH23390 did not alter destaining. However, NBQX diminished, but did not completely reverse, presynaptic inhibition produced by SKF38393 (SKF + NBQX). H, distribution of the mean t1/2 of release for the destaining curves shown in panel G.
D1Rs have been shown to promote adenosine efflux and produce inhibition of glutamate release via A1 adenosine receptors (A1Rs) (Harvey & Lacey, 1997) that are located on presynaptic corticoaccumbal terminals (Ciruela et al. 2006). Consistent with these reports, the receptor agonist adenosine (60 μm) inhibited corticoaccumbal release (t1/2 = 251 s for adenosine, n = 112; P = 0.002, compared to vehicle, Mann–Whitney U test) (Fig. 2C and D) and similar to the D1R agonist, reduced exocytosis from terminals with a low probability of release (Supplementary Fig. S5). The selective A1R antagonist 8-cyclopentyl-1,3-dipropylxanthine (DPCPX; 500 nm) alone did not alter FM1-43 destaining (t1/2 = 212, n = 104; P = 0.1, compared to vehicle, Mann–Whitney U test), but it prevented presynaptic depression caused by the D1R agonist SKF38393 (t1/2 = 218 s for SKF38393 with DPCPX, n = 154; P = 0.5, compared to vehicle, Mann–Whitney U test) (Fig. 2C and D), suggesting that D1R activation is required for any substantial adenosine production that would modify FM1-43 destaining.
We determined if presynaptic inhibition by D1Rs was dependent on NMDA receptor (NMDAR) activation. Bath application of the NMDAR antagonist 2-amino-5-phosphonopentanoic acid (APV; 50 μm) prevented inhibition caused by SKF38393 (t1/2 = 214 s for SKF38393 with APV, n = 266; P = 0.5, compared with vehicle, Mann–Whitney U test) (Fig. 2E and F and Supplementary Fig. S5), suggesting that D1Rs can augment NMDAR-dependent signalling (Levine et al. 1996) and release adenosine (Manzoni et al. 1994; Harvey & Lacey, 1997). We suspected that AMPARs might also facilitate presynaptic inhibition by D1Rs, as they can enable NMDAR activation by elevating cellular resting membrane potentials (Cherubini et al. 1988). Corticoaccumbal destaining half-times remained unchanged in the presence of the AMPAR antagonist NBQX (10 μm; t1/2 = 206 s for NBQX; n = 205; P = 0.5, compared to vehicle, Mann–Whitney U test) and NBQX had no effect on release when combined with the D1R antagonist SCH23390 (t1/2 = 220 s for NBQX with SCH23390; n = 122; P = 0.1, compared with NBQX alone, Mann–Whitney U test) (Fig. 2G and H and Supplementary Fig. S5). However, NBQX diminished (t1/2 = 224 s for SKF38393 with NBQX; n = 159; P < 0.001, compared to SKF38393, Mann–Whitney U test), but did not completely prevent, inhibition caused by SKF38393 (P = 0.02, compared to vehicle, Mann–Whitney U test) (Fig. 2G and H). Thus, co-activation of D1, NMDA and AMPA receptors increased adenosine receptor activity to reduce destaining kinetics.
Endocannabinoids can also regulate presynaptic activity (Yin & Lovinger, 2006). However, presynaptic inhibition by D1Rs was independent of endocannabinoid signalling, as the CB1R antagonist AM251 (1 μm) with SKF38393 did not change FM1-43 release (t1/2 = 251 s for SKF38393 with AM251, n = 72 vs. 270 s for SKF38393 alone; P = 0.1, Mann–Whitney U test) (Fig. 2E and F and Supplementary Fig. S5).
Presynaptic inhibition through endocannabinoids is dependent on D2 and group 1 metabotropic glutamate receptors (mGluRs)
Next, we examined how D2Rs modulate excitatory inputs to the NAcore. The D2R agonist quinpirole decreased FM1-43 destaining (t1/2 = 249 s for quinpirole; n = 80 puncta; P = 0.01, compared to vehicle, Mann–Whitney U test) (Fig. 3A and B), primarily by inhibiting cortical terminals with the lowest probability of release (Supplementary Fig. S6). The D2R antagonist sulpiride (10 μm) alone had no effect on release (t1/2 = 211 s; n = 60; P = 0.5, compared to vehicle, Mann–Whitney U test) (Fig. 3A and B) and as expected, blocked inhibition by quinpirole (t1/2 = 213 s for quinpirole with sulpiride; n = 45; P = 0.5, compared to vehicle, Mann–Whitney U test) (not shown). However, sulpiride only partially prevented corticoaccumbal inhibition by amphetamine (t1/2 = 220 s for amphetamine with sulpiride; n = 146; P = 0.03, compared to vehicle, Mann–Whitney U test) (Fig. 3A and B). Inhibition by amphetamine required both D1 and D2 receptors since it was prevented only by both D1 and D2 receptor antagonists (t1/2 = 201 s for amphetamine in combination with SCH23390 and sulpiride; n = 228; P = 0.5, compared to vehicle, Mann–Whitney U test) (Fig. 3D). The actions of D1 and D2 receptors on corticoaccumbal activity were independent, with modulation by amphetamine representing a complementary balance between their individual responses (Fig. 1M).
Figure 3. D2Rs produce corticoaccumbal inhibition through endocannabinoids.
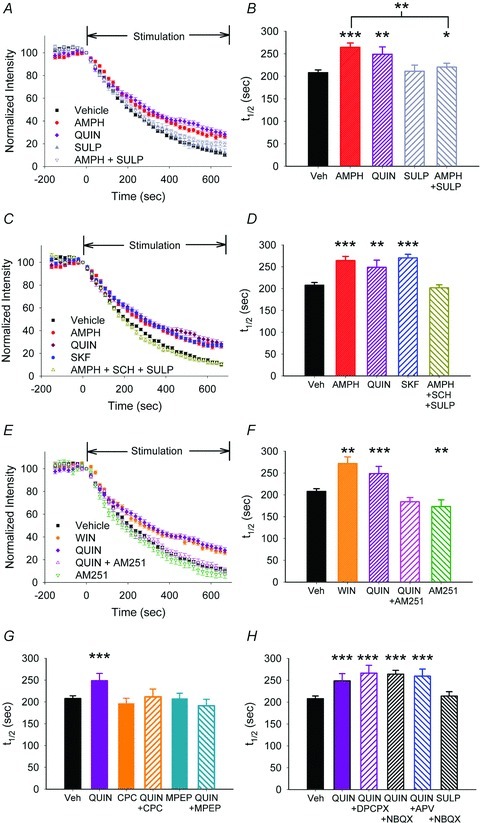
A, FM1-43 destaining curves revealed that both amphetamine and quinpirole (n = 80) reduced corticoaccumbal release. Sulpiride (SULP) alone did not alter destaining and only partially blocked inhibition by amphetamine (AMPH + SULP). B, distribution of the mean t1/2 of release for the destaining curves shown in panel A. For all panels, *P < 0.05, **P < 0.01, ***P < 0.001, Mann–Whitney U test. C, compared to vehicle, amphetamine, quinpirole and SKF38393 reduced corticoaccumbal destaining. Only the combination of D1 and D2 receptor antagonists, SCH23390 and sulpiride, respectively, prevented inhibition by amphetamine (AMPH + SCH + SULP). D, distribution of the mean t1/2 of release for destaining curves shown in panel C. E, the CB1R agonist, WIN55–2,2 (WIN) decreased exocytosis to a similar extent as quinpirole, while AM251 blocked inhibition by quinpirole (QUIN + AM251). AM251 alone boosted FM1-43 destaining. F, distribution of the mean t1/2 of release for the experiments shown in panel E. G, the mGluR1 antagonist CPCCOEt (CPC) did not modify FM1-43 destaining but blocked inhibition by quinpirole (CPC + QUIN). Similarly, the mGluR5 antagonist MPEP did not modify FM1-43 destaining and blocked inhibition by quinpirole (MPEP + QUIN). H, the A1 adenosine, NMDA and AMPA receptor antagonists DPCPX, NBQX and APV, respectively, did not block inhibition by quinpirole. Sulpiride with NBQX (SULP + NBQX) did not change FM1-43 destaining.
We determined if inhibition by D2Rs might occur through cannabinoid receptors located on presynaptic glutamatergic terminals in the NAcore (Pickel et al. 2006). The CB1R agonist WIN55-2,2 (2 μm) inhibited FM1-43 destaining (t1/2 = 271 s; n = 81; P < 0.001, compared to vehicle, Mann–Whitney U test) to a similar extent as the D2R agonist quinpirole (t1/2 = 248 s; n = 80; P = 0.4, compared to WIN55-2,2, Mann–Whitney U test) (Fig. 3E and F). The CB1R antagonist AM251 prevented inhibition by quinpirole (t1/2 = 184 s for quinpirole with AM251; n = 72; P = 0.2, compared to vehicle, Mann–Whitney U test) and increased release from a broad population of terminals in otherwise untreated slices (t1/2 = 173 s for AM251; n = 43; P = 0.002, compared with vehicle, Mann–Whitney U test) (Fig. 3E and F and Supplementary Fig. S6), suggesting that MSN activation produces some tonic endocannabinoid efflux that is independent of D2R activation.
In the ventral (Grueter et al. 2010) and dorsal striatum (Yin & Lovinger, 2006) and in the VTA (Pan et al. 2008), presynaptic inhibition through CB1Rs is dependent on activation of group 1 mGluRs. Consistent with these reports, quinpirole's inhibition at presynaptic terminals was suppressed by the mGluR1 antagonist 7-hydroxyiminocyclopropan[b]chromen-1α-carboxylic acid ethyl ester (CPCCOEt; 40 μm; t1/2 = 211 s for quinpirole with CPCCOEt;; n = 67; P = 0.5, compared with vehicle, Mann–Whitney U test) and by the mGluR5 antagonist 2-methyl-6-(phenylethynyl) pyridine (MPEP; 40 μm; n = 103; t1/2 = 191 s for quinpirole with MPEP; P = 0.1, compared to vehicle, Mann–Whitney U test), while CPCCOEt (t1/2 = 196 s; n = 99; P = 0.2, compared to vehicle, Mann–Whitney U test) or MPEP (t1/2 = 208 s; n = 71; P = 0.1, compared to vehicle, Mann–Whitney U test) alone had no effect on FM1-43 release (Fig. 3G).
Unlike that found with the D1R agonist, inhibition by D2Rs was not mediated through A1 adenosine, NMDA or AMPA receptors since quinpirole combined with their respective antagonists, DPCPX, (t1/2 = 266 s; n = 68; P = 0.4, compared with quinpirole, Mann–Whitney U test), NBQX (t1/2 = 264 s; n = 221; P = 0.3, compared with quinpirole, Mann–Whitney U test) and APV (t1/2 = 259 s; n = 75; P = 0.4, compared with quinpirole, Mann–Whitney U test), had no effect on the presynaptic release (Fig. 3H). Similarly, NBQX did not modify release following treatment with the D2R antagonist sulpiride (t1/2 = 214 s for NBQX with sulpiride, n = 137 vs. 206 s for NBQX alone; P = 0.5, Mann–Whitney U test) (Fig. 3H). The results indicate that endocannabinoids generate a strong regulatory effect on presynaptic excitation following high frequency stimulation; their actions are facilitated through D2R and group 1 mGluRs and are independent of A1 adenosine, AMPA, NMDA and D1 receptors.
D1Rs enhance corticoaccumbal release when glutamate receptors are blocked
To eliminate all glutamate-activated retrograde pathways that might produce presynaptic modulation, we exposed striatal slices to the AMPAR antagonist NBQX, the NMDAR antagonist APV, and the competitive antagonist at group 1 and 2 mGluRs, (+/−)-α-methyl-4-carboxyphenylglycine (MCPG; 300 μm). This cocktail of glutamatergic receptor antagonists alone did not alter corticoaccumbal release (t1/2 = 210 s for NBQX, APV and MCPG; n = 107 puncta; P = 0.5, compared to vehicle, Mann–Whitney U test) (Fig. 4A and B). However, in the presence of the D1R agonist SKF38393, the cocktail blocked presynaptic inhibition and further accelerated release from terminals with a low probability of release (Supplementary Fig. S7) beyond that observed in untreated slices (t1/2 = 177 s for NBQX, APV and MCPG with SKF38393; n = 92; P < 0.001, compared to vehicle, Mann–Whitney U test) (Fig. 4A and B), thereby unmasking an excitatory D1R effect that boosted corticoaccumbal release.
Figure 4. D1Rs boost corticoaccumbal release when glutamate receptors are blocked.
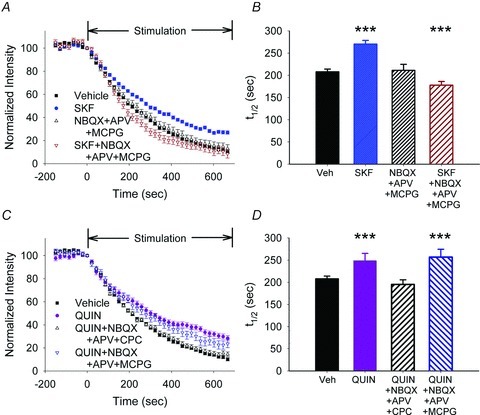
A, FM1-43 destaining curves showed that blockade of glutamate receptors with NBQX, APV and MCPG alone did not alter FM1-43 destaining but they blocked inhibition and further potentiated release when combined with SKF38393. B, average destaining half-times treatments shown in panel A. C, inhibition by the D2R agonist quinpirole was prevented by the glutamate antagonists NBQX, APV and CPCCOEt. The glutamate antagonists NBQX, APV and MCPG did not alter destaining after quinpirole. D, distribution of mean t1/2 of release for destaining curves shown in panel C.
Inhibition generated by the D2R agonist quinpirole was also prevented when the mGluR1 antagonist CPCCOEt was combined with NBQX and APV (t1/2 = 196 s; n = 68; P < 0.001, compared to quinpirole alone, Mann–Whitney U test), but these combined antagonists did not potentiate FM1-43 exocytosis (P = 0.2, compared to vehicle, Mann–Whitney U test) (Fig. 4C and D). The non-selective mGluR antagonist MCPG along with NBQX and APV failed to alter presynaptic inhibition by quinpirole (t1/2 = 256 s for quinpirole with MCPG, NBQX and APV; n = 126; P = 0.5, compared to quinpirole, Mann–Whitney U test) (Fig. 4C and D), further indicating that control over endocannabinoid efflux was restricted to group 1 mGluRs.
Whole cell electrophysiology experiments show that D1 and A1 receptors differentially regulate glutamate release onto striatonigral neurons
While optical recordings provided a measure of activity-dependent release from presynaptic terminals, they were not sensitive to those terminals synapsing on subtypes of MSNs. Thus, electrophysiological recordings were obtained in fluorescent and non-flourecent MSNs from hemizygotic Drd1- and Drd2-EGFP mice to detect alterations in glutamate release from terminals specifically innervating D1 (D1R+) and D2 (D2R+) receptor-expressing MSNs. Evoked (e) EPSCs in fluorescent MSNs from Drd1-EGFP mice (Fig. 5A) were measured in response to PFC stimulation with 20 Hz paired-pulses delivered every 30 s (Fig. 1B). The D1R agonist SKF38393 decreased the amplitude of the first current of the pair by 16 ± 7% (−103 ± 24 pA for vehicle vs. −89 ± 18 pA following SKF38393; n = 7 cells; P = 0.04, Student's paired t test) and increased the paired-pulse ratio (PPR; amplitude of the second eEPSC/amplitude of the first eEPSC) by 45 ± 13% (1.15 ± 0.18 in vehicle to 1.62 ± 0.24 in SKF38393; P = 0.02, Student's paired t test) (Fig. 5B), indicating a reduction in corticoaccumbal excitation.
Figure 5. Recordings in fluorescent MSNs from Drd1-EGFP mice show that presynaptic inhibition by D1Rs is dependent on adenosine, adenylyl cyclase and PKA.
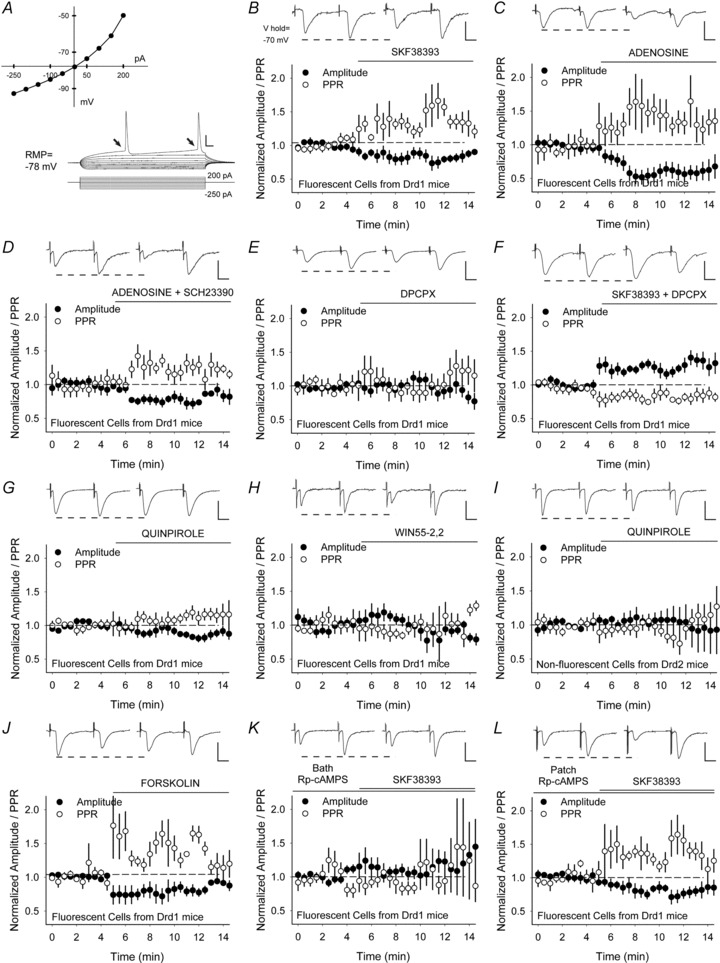
A, the current–voltage plot generated by depolarizing current pulses shows inward rectification (arrows) and regular firing behaviour, typical for MSNs. B, representative traces show the average responses of paired-pulses before (above, left) and 5 to 7.5 min following bath application of SKF38393 (above, right). Graph shows the normalized amplitude of the first eEPSC (of the pair) and the normalized PPR. SKF38393 and C, adenosine decreased the amplitude of the first eEPSC and increased the PPR. D, adenosine combined with the D1R antagonist SCH23390 decreased the amplitude of the first eEPSC and increased the PPR. E, the A1 adenosine antagonist DPCPX had no effect on the eEPSC amplitude or PPR. F, in the presence of DPCPX, SKF38393 increased the eEPSC amplitude and decreased the PPR. G, the D2R agonist quinpirole and H, the CB1R agonist WIN55–2,2 had no effect on the eEPSC amplitude or the PPR. I, in non-fluorescent cells from Drd2-EGFP mice, quinpirole had no effect on the eEPSC amplitude or the PPR. J, forskolin reduced the eEPSC amplitude in fluorescent cells from Drd1-EGFP mice and increased the PPR. K, bath application of the PKA inhibitor Rp-cAMPS blocked inhibition by SKF38393. L, when Rp-cAMPS was applied via the patch electrode, SKF38393 remained inhibitory, as the eEPSC amplitude decreased and the PPR increased. Bar in A: 10 mV, 25 ms. Bar in B–L: 100 pA, 12.5 ms.
Adenosine also reduced presynaptic activity since the amplitude of the first current of the pair by decreased by 41 ± 10% (−79 ± 17 pA for vehicle vs. −38 ± 7 pA following adenosine; n = 8; P = 0.04, Student's paired t test) and the PPR increased by 46 ± 13% (0.93 ± 0.08 in vehicle vs. 1.34 ± 0.22 in adenosine; P = 0.02, Student's paired t test) (Fig. 5C). Adenosine was sufficient to produce presynaptic inhibition, since it remained inhibitory in the presence of the D1R antagonist SCH23390; the amplitude of the first current of the pair decreased by 34 ± 11% (−52 ± 8 pA for vehicle vs. −33 ± 8 pA following SCH23390 and adenosine; n = 5; P = 0.02, Student's paired t test) and the PPR increased by 15 ± 4% (1.33 ± 0.17 in vehicle vs. 1.58 ± 0.32 in SCH23390 and adenosine; P = 0.03, Student's paired t test) (Fig. 5D).
The A1 adenosine receptor antagonist DPCPX alone had no effect on either the amplitude (−1 ± 8%; −76 ± 27 pA for vehicle vs. −73 ± 24 pA with DPCPX; n = 7; P = 0.6, Student's paired t test) or the PPR (13 ± 13%; 1.21 ± 0.11 in vehicle vs. 1.32 ± 0.14 in DPCPX; P = 0.4, Student's paired t test) (Fig. 5E), indicating a lack of tonic inhibition by adenosine. However, when DPCPX was combined with the D1R agonist, the amplitude of the first eEPSC increased by 18 ± 6% (−81 ± 12 pA for vehicle vs. −96 ± 16 pA for SKF38393 with DPCPX; n = 10; P = 0.03, Student's paired t test) and the PPR decreased by 13 ± 3% (1.37 ± 0.14 in vehicle vs. 1.19 ± 0.18 in SKF38393 and DPCPX; P = 0.007, Student's paired t test) (Fig. 5F), indicating presynaptic excitation through D1Rs in the absence of A1R stimulation.
D2 and CB1 receptors did not modulate eEPSCs in D1R+ neurons, as the D2R agonist quinpirole (5 μM) did not change the eEPSC amplitude (−12 ± 7%; −197 ± 31 pA for vehicle vs. −168 ± 33 pA following quinpirole; n = 6; P = 0.1, Student's paired t test) or the PPR (5 ± 7%; 1.01 ± 0.16 in vehicle to 1.13 ± 0.18 in quinpirole; P = 0.1, Student's paired t test) (Fig. 5G) and the CB1R agonist WIN55-2,2 had no effect on the eEPSC amplitude (−19 ± 11%; −130 ± 49 pA for vehicle vs. −119 ± 52 pA following WIN55-2,2; n = 6; P = 0.5, Student's paired t test) or the PPR (18 ± 13%; 1.38 ± 0.24 in vehicle to 1.65 ± 0.36 in WIN55-2,2; P = 0.2, Student's paired t test) (Fig. 5H). Likewise, quinpirole did not change the eEPSC amplitude (2 ± 15%; −74 ± 7 pA in vehicle vs. −75 ± 13 pA in quinpirole; n = 7; P = 0.5, Student's paired t test) or the PPR (−10 ± 9%; 1.38 ± 0.19 in vehicle vs. 1.3 ± 0.24 in quinpirole; P = 0.4, Student's paired t test) in non-fluorescent cells from Drd2-EGFP mice (Fig. 5I).
Inhibition by adenosine requires activation of adenylyl cyclase and protein kinase A (PKA) in striatonigral MSNs
Activation of adenylyl cyclase, cAMP and PKA are required for signalling by Gs-protein coupled receptors (Memo et al. 1986) and adenosine production in the hippocampus (Brundege et al. 1997; Dunwiddie & Masino, 2001). Similar to the D1R agonist, bath application of forskolin (FSK; 10 μm), a potent membrane-permeant activator of adenylyl cyclase (Laurenza et al. 1989), briskly reduced the eEPSC amplitude in D1R-expressing cells by 15 ± 5% (−75 ± 22 pA for vehicle vs. −63 ± 16 pA following forskolin; n = 6 cells; P = 0.04, Student's paired t test) and increased the PPR by 35 ± 6% (1.07 ± 0.15 in vehicle vs. 1.39 ± 0.29 in forskolin; P = 0.02, Student's paired t test) (Fig. 5J). When the membrane-permeant PKA inhibitor Rp-cAMPS (10 μm) was bath applied, SKF38393 had no effect on corticoaccumbal activity; there was no change in the eEPSC amplitude (4 ± 12%; −67 ± 7 pA for Rp-cAMPS vs. −74 ± 12 pA following SKF38393 with Rp-cAMPS; n = 7; P = 0.5, Student's paired t test) or in the PPR (−13 ± 20%; 1.51 ± 0.35 in Rp-cAMPS vs. 1.36 ± 0.17 in SKF38393 and Rp-cAMPS; P = 0.6, Student's paired t test) (Fig. 5K). These results suggest that forskolin and SKF38393 modulated corticoaccumbal activity through adenylyl cyclase and PKA.
To confirm that presynaptic mechanisms were involved, we made recordings with internal solutions containing 400 μm Rp-cAMPS (Ding et al. 2003). When Rp-cAMPS was applied via the patch electrode, SKF38393 remained inhibitory; the eEPSC amplitude decreased by 28 ± 9% (−71 ± 10 pA for vehicle vs. −58 ± 13 pA following SKF38393; n = 7; P = 0.02, Student's paired t test) and the PPR increased (23 ± 6%; 1.28 ± 0.17 in vehicle to 1.74 ± 0.37 vs. SKF38393; P = 0.04, Student's paired t test) (Fig. 5L), suggesting that the presynaptic depression caused by SKF38393 did not arise through mechanisms intrinsic to the neuron under evaluation.
D1Rs excite while A1Rs inhibit presynaptic activity of striatonigral neurons
To further localize D1 and A1 receptors on cortical afferents of fluorescent MSNs in Drd1-EGFP mice, miniature (m) EPSCs were observed in the presence of the Na+ channel antagonist TTX, which blocked spontaneous cortically derived action potentials and isolated activity at the presynaptic terminal. The D1R agonist SKF38393 increased the frequency of mEPSC by 35 ± 16% (4.77 ± 0.91 Hz in vehicle vs. 6.51 ± 1.34 Hz in SKF38393; n = 9; P = 0.04, Student's paired t test), by selectively increasing high-frequency, low-amplitude inward currents (Fig. 6A and B). There was no difference in the distribution of mEPSC amplitudes (Fig. 6B), indicating that the increase in mEPSCs frequency was likely to be attributable to the potentiating effect of SKF38393 on presynaptic release (Van der Kloot, 1991). Conversely, adenosine diminished the frequency of mEPSC in D1R-presenting MSNs by 21 ± 6% (7.02 ± 0.88 Hz in vehicle vs. 5.55 ± 1.09 Hz in adenosine; n = 7; P = 0.03, Student's paired t test), by inhibiting high-frequency, low-amplitude events (Fig. 6C–D). Neither the D2R agonist quinpirole (3.9 ± 5%; 3.45 ± 1.56 Hz in vehicle vs. 3.82 ± 1.93 Hz in quinpirole; n = 6; P = 0.4, Student's paired t test) nor the CB1R agonist WIN55-2,2 (−0.8 ± 9%; 5.26 ± 1.42 Hz in vehicle vs. 4.77 ± 1.09 Hz in WIN55-2,2; n = 8; P = 0.4, Student's paired t test) changed the frequency or amplitude distribution of mEPSCs (Fig. 6E–F). Thus, in the absence of stimulation, D1 receptors enhanced and A1 adenosine receptors diminished the excitability of D1R-expressing cells at presynaptic terminals, while D2 and CB1 receptors had no effect.
Figure 6. D1 and A1 adenosine receptors modulate presynaptic activity in fluorescent cells from Drd1-EGFP mice.
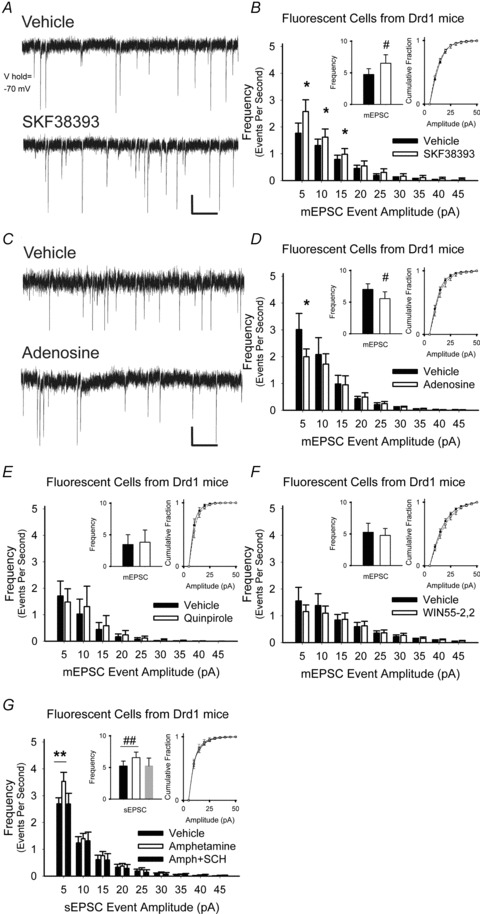
A, representative mEPSCs in D1R+ cells (upper trace) increased 5 min after exposure to the D1R agonist SKF38393 (lower trace). B, SKF38393 increased the frequency of mEPSCs (inset, left) by boosting the number of high-frequency, low-amplitude spontaneous inward currents while having no effect on the cumulative distributions of mEPSC amplitudes (inset, right). For panels B and D–G, *P < 0.05, **P < 0.01, Student's t test with Bonferroni adjustment and #P < 0.05, ##P < 0.01, Student's paired t test. C, representative mEPSCs in D1R+ cells (upper trace), decreased after exposure to adenosine (lower trace). D, adenosine reduced the frequency of low-amplitude mEPSCs but had no effect on the distribution of mEPSC amplitudes. E, the D2R agonist quinpirole did not alter the frequency, the frequency distribution or the amplitude distribution of mEPSCs in D1R+ cells. F, the CB1R agonist WIN55-2,2 also had no effect on the mEPSC frequency, the frequency distribution or the amplitude distribution in D1R-expressing cells. G, amphetamine increased in frequency, but not amplitude distribution, of sEPSCs D1R+ cells. Excitation by amphetamine was blocked by the D1R antagonist SCH23390 (SCH). Bar in panels A and C, 5 pA, 0.5 s.
To determine the effect of amphetamine on corticoaccumbal neurotransmission under more physiological conditions, spontaneous (s) EPSCs (without TTX) were observed in D1R+ MSNs. These spontaneous synaptic currents probably represent release of individual transmitter quanta if there is no change in their amplitude distributions (Mennerick & Zorumski, 1995). Amphetamine increased the frequency, but not amplitude distribution of sEPSCs in all cells tested by 29 ± 10% (5.23 ± 0.78 Hz in vehicle vs. 6.56 ± 0.87 Hz in amphetamine; n = 10; P = 0.01, Student's paired t test). The increase in sEPSC frequency by amphetamine was prevented by the D1R antagonist SCH23390 (Fig. 6G), but not by the A1 adenosine antagonist DPCPX (not shown; P = 0.8, Student's paired t test).
Synaptic activity promotes inhibition through adenosine and overrides excitation caused by D1Rs
To support these data, we also observed frequencies of mEPSC (with TTX) in MSNs from non-genetically manipulated WT mice. The D1R agonist SKF38393 increased the frequency of mEPSCs in all cells tested by 43 ± 12% (3.03 ± 0.89 Hz in vehicle vs. 3.98 ± 0.98 Hz in SKF38393; n = 7; P = 0.01, Student's paired t test) by increasing high-frequency events in the 5–15 pA range, but did not change the distribution of mEPSC amplitudes (Fig. 7A and F), indicating that D1Rs had a potentiating effect on presynaptic release.
Figure 7. Synaptic activity in MSNs from WT mice prevents D1R-dependent presynaptic excitation and promotes inhibition through adenosine.
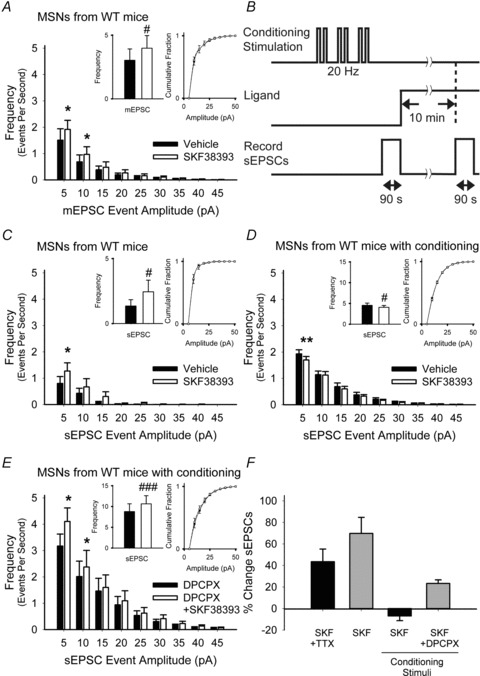
A, SKF38393 increased the average frequency of 5–10 pA and 10–15 pA inward currents and did not alter the mEPSC amplitude distribution. For panels A and C–E, *P < 0.05, **P < 0.01, Student's t test with Bonferroni adjustment and #P < 0.05, ###P < 0.001, Student's paired t test. B, protocol for synaptic conditioning with cortical stimulation. C, in the absence of conditioning, SKF38393 increased the frequency of 5–10 pA sEPSCs, but had no effect on the cumulative amplitude distribution. D, after conditioning stimuli were applied, SKF38393 reduced the average number of sEPSCs in the 5–10 pA range, but had no effect on their amplitude distributions. E, when the adenosine receptor antagonist DPCPX was applied along with conditioning stimuli, SKF38393 increased the average number of sEPSCs with amplitudes of 5–10 pA and 10–15 pA but did not alter their cumulative amplitude distributions. F, summary of changes in mEPSCs and sEPSCs following SKF38393 with and without synaptic conditioning.
Next, we used synaptic conditioning to confirm that inhibition produced though adenosine might override excitation caused by D1Rs. sEPSCs were observed in WT MSNs before and following conditioning stimuli, consisting of cortically applied paired-pulses at 20 Hz (Fig. 7B). In the absence of conditioning stimuli, the D1R agonist SKF38393 was excitatory (70 ± 15%; 1.35 ± 0.49 Hz in vehicle vs. 2.45 ± 0.9 Hz in SKF38393; n = 8; P = 0.03, Student's paired t test), and there was no change in the sEPSC amplitude distribution (Fig. 7C and F). Following conditioning stimuli, excitation by the D1R agonist was blocked and the frequency of sEPSCs declined by 7 ± 4% (4.53 ± 0.54 Hz in vehicle vs. 4.06 ± 0.44 Hz in SKF38393; n = 25; P = 0.03, Student's paired t test), primarily by decreasing the frequency of spontaneous events in the 5–10 pA range (Fig. 7D and F). When adenosine A1Rs were blocked, presynaptic depression was prevented and the frequency of sEPSCs increased by 23 ± 3% (8.78 ± 1.87 Hz in DPCPX vs. 10.65 ± 1.19 Hz in DPCPX combined with SKF38393; n = 6; P < 0.001, Student's paired t test), with a boost in 5–15 pA events (Fig. 7E and F). Thus, high frequency synaptic activity prevented excitation by the D1R and promoted presynaptic inhibition through A1Rs.
CB1 and D1 receptors differentially regulate glutamate release onto striatopallidal neurons
We first examined modulation of presynaptic activity to D2R+ MSNs using electrophysiological recordings in non-fluorescing cells from hemizygotic Drd1-EGFP mice, as the majority of these cells are likely to express D2Rs (Shuen et al. 2008). In these cells, quinpirole reduced the peak amplitude of the first eEPSC by 23 ± 6% (−164 ± 36 pA in vehicle vs. −126 ± 32 pA in quinpirole; n = 6 cells; P = 0.05, Student's paired t test) and the PPR increased by 9 ± 2% (1.01 ± 0.07 in vehicle vs. 1.1 ± 0.17 in quinpirole; P = 0.02, Student's paired t test) (Fig. 8A). Interestingly, compared to the rapid inhibition achieved by SKF38393 in D1R+ MSNs (Fig. 5B), the onset of presynaptic inhibition caused by quinpirole appeared relatively delayed (Fig. 8B).
Figure 8. Presynaptic excitation of D2R-expressing MSNs by D2Rs is prevented by endocannabinoids.
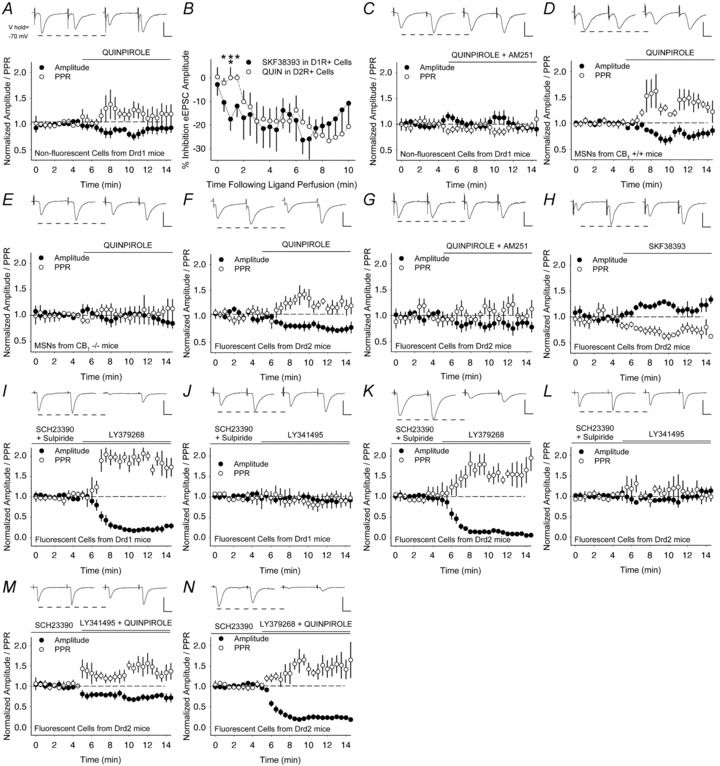
A, the D2R agonist quinpirole decreased the amplitude of the first eEPSC (of the pair) and increased the PPR in non-fluorescent MSNs from Drd1-EGFP mice. B, inhibition of the eEPSC amplitude by quinpirole in D2R-expressing cells was delayed compared to inhibition by the D1R agonist SKF38393 in D1R-expressing cells. *P < 0.05, **P < 0.01, ANOVA. C, the CB1R antagonist AM251 blocked inhibition by quinpirole in non-fluorescent cells from Drd1-EGFP mice. D and E, quinpirole decreased the amplitude and reduced the PPR in MSNs from CB1+/+ mice (D), but not in cells from CB1−/− mice (E). F and G, in fluorescent cells from Drd2-EGFP mice, quinpirole decreased the eEPSC amplitude and increased the PPR (F) and AM251 prevented inhibition by quinpirole (G). H, the D1R agonist SKF38393 increased the eEPSC amplitude and reduced the PPR. I and J, in the presence of D1 and D2 receptor antagonists SCH23390 and sulpiride, the mGluR2/3 agonist LY379268 suppressed the amplitude and increased the PPR in D1R+ cells (I), while the mGluR2/3 antagonist had no effect (J). K and L, the mGluR2/3 agonist also suppressed the amplitude and increased the PPR in D2R+ cells (K), while the mGluR2/3 antagonist LY341495 had no effect (L). M and N, in the presence of the D1R antagonist SCH23390, the D2R agonist quinpirole remained inhibitory when combined with the mGluR2/3 antagonist (M), and the the combination of mGluR2/3 agonist and quinpirole suppressed corticoaccumbal activity (N). Bar in panels A and C–N, 100 pA, 12.5 ms.
Inhibition by D2Rs was dependent on endocannabinoids, since the CB1R antagonist AM251 blocked inhibition by the D2R agonist; the amplitude of the first eEPSC (−2 ± 14%; −114 ± 27 pA for vehicle vs. −118 ± 29 pA for quinpirole with AM251; n = 9; P = 0.8, Student's paired t test) and the PPR (−12 ± 10%; 1.45 ± 0.21 in vehicle vs. 1.32 ± 0.21 in quinpirole with AM251; P = 0.3, Student's paired t test) remained unaffected (Fig. 8C). Further, in MSNs from CB1+/+ mice, quinpirole reduced the eEPSC amplitude (−18 ± 7%; −91 ± 18 pA in vehicle vs. −80 ± 21 pA in quinpirole; n = 7; P = 0.5, Student's paired t test) and increased the PPR (35 ± 5%; 1.04 ± 0.11 in vehicle vs. 1.4 ± 0.21 in quinpirole; P = 0.4, Student's paired t test) (Fig. 8D), but not in cells from CB1−/− mice, where the eEPSC amplitude (−3 ± 16%; −137 ± 24 pA in vehicle vs. −124 ± 29 pA in quinpirole; n = 6; P = 0.7, Student's paired t test) and the PPR (6 ± 16%; 1.34 ± 0.11 in vehicle vs. 1.41 ± 0.24 in quinpirole; P = 0.8, Student's paired t test) remained unchanged (Fig. 8E). In support of the optical experiments, which showed that endocannabinoids promote some on-going inhibition of corticostriatal release in the absence of dopamine, the PPR in MSNs from CB1−/− mice was significantly higher than in cells from CB1+/+ mice (P = 0.05, ANOVA).
Because a substantial fraction of non-fluorescing MSNs might fail to detectably express the pathway-specific transgenes and thereby result in a mixed population of cells (Shuen et al. 2008), electrophysiological recordings were also obtained in fluorescent MSNs from Drd2-EGFP mice. In these cells, quinpirole also decreased the amplitude of eEPSCs by 26 ± 8% (−94 ± 26 pA in vehicle vs. −76 ± 23 pA in quinpirole; n = 9; P = 0.03, Student's paired t test) and increased the PPR by 7 ± 2% (1.38 ± 0.16 in vehicle vs. 1.48 ± 0.27 in quinpirole; P = 0.003, Student's paired t test) (Fig. 8F). The corticoaccumbal inhibition caused by quinpirole was blocked by the CB1R antagonist, since the amplitude (−10 ± 9%; –62 ± 8 pA in vehicle vs. −52 ± 11 pA in quinpirole with AM251; n = 8; P = 0.2, Student's paired t test) and the PPR (5 ± 5%; 1.39 ± 0.15 in vehicle vs. 1.6 ± 0.33 in quinpirole with AM251; P = 0.4, Student's paired t test) remained unchanged (Fig. 8G).
D1Rs excited D2R+ cells, since the D1R agonist SKF38393 increased the eEPSC amplitude by 16 ± 5% (−81 ± 16 pA in vehicle vs. −96 ± 21 pA in SKF38393; n = 6; P = 0.03, Student's paired t test) and decreased the PPR by 32 ± 10% (1.41 ± 0.24 in vehicle vs. 1.1 ± 0.23 in SKF38393; P = 0.01, Student's paired t test) (Fig. 8H). Thus, while D1Rs excited D2R+ neurons, D2Rs promoted a much stronger inhibition at those same synapses through endocannabinoids. Since responses following quinpirole were similar between fluorescent cells obtained in Drd2-EGFP mice and non-fluorescent cells from Drd1-EGFP mice, any over-expression of D2R proteins in Drd2-EGFP mice (Kramer et al. 2011) did not significantly impact corticoaccumbal activity under these conditions.
Inhibition by D2Rs is independent of group 2 mGluRs
We tested whether group 2 mGluRs (mGluR2/3) on cortical terminals (Testa et al. 1998) might modulate corticostriatal activity. For these experiments, the D1 and D2 receptor antagonists SCH23390 and sulpiride, respectively, were also added to the bath, since the mGluR2/3 can negatively regulate dopamine release and their antagonists can increase synaptic dopamine (Karasawa et al. 2010). Consistent with prior studies (Lovinger & McCool, 1995), the mGluR2/3 agonist LY379268 ((1S,2R,5R,6R)-2-amino-4-oxabicyclo[3.1.0]hexane-2,6- dicarboxylic acid; 1 μm) strongly suppressed presynaptic activity in D1R+ MSNs since the eEPSC amplitude decreased by −81 ± 2% (−193 ± 35 pA vs. −39 ± 10 pA in LY379268; n = 5; P = 0.004, Student's paired t test) and the PPR increased by 78 ± 24% (0.94 ± 0.11 vs. 1.6 ± 0.33 in LY379268; P = 0.02, Student's paired t test) (Fig. 8I). There was no tonic inhibition by mGluR2/3, as the mGluR2/3 antagonist LY341495 (2-[(1S,2S)-2-carboxycyclopropyl]-3-(9H-xanthen-9-yl)- d-alanine; 100 nm) did not change the eEPSC amplitude (−7 ± 14%; −92 ± 21 pA vs. −94 ± 31 pA in LY341495; n = 4; P = 0.9, Student's paired t test) or the PPR (−12 ± 14%; 1.23 ± 0.2 vs. 1.02 ± 0.15 in LY341495; P = 0.2, Student's paired t test) (Fig. 8J).
The mGluR2/3 agonist also reduced corticostriatal activity in D2R+ cells since the eEPSC amplitude decreased by 85 ± 4% (−122 ± 20 pA vs. −20 ± 7 pA in LY379268; n = 6; P = 0.005, Student's paired t test) and the PPR increased by 26 ± 6% (1.19 ± 0.13 vs. 1.63 ± 0.32 in LY379268; P = 0.02, Student's paired t test) (Fig. 8K). Similar to D1R+ cells, the mGluR2/3 antagonist did not change the eEPSC amplitude (−1 ± 9%; −65 ± 15 pA vs. −64 ± 18 pA in LY341495; n = 7; P = 0.9, Student's paired t test) or the PPR (−0.3 ± 12%; 1.36 ± 0.16 vs. 1.33 ± 0.19 in LY341495; P = 0.8, Student's paired t test) (Fig. 8L).
Next, we determined whether mGluR2/3 might modulate D2R-dependent presynaptic inhibition in D2R+ MSNs. For these experiments, the D1R antagonist SCH23390 was added to the bath. Quinpirole remained inhibitory in the presence of the mGluR2/3 antagonist (−32 ± 6%; −70 ± 12 pA vs. −49 ± 12 pA in LY341495; n = 7; P = 0.008, Student's paired t test) and the PPR increased by 53 ± 22% (1.3 ± 0.12 vs. 1.97 ± 0.37 in LY341495; P = 0.05, Student's paired t test) (Fig. 8M). As expected, quinpirole in combination with the mGluR2/3 agonist LY379268 also strongly inhibited corticoaccumbal activity; the eEPSC amplitude decreased (−75 ± 6%; −206 ± 69 pA vs. −56 ± 19 pA in LY379268; n = 5; P = 0.03, Student's paired t test) and the PPR increased by 49 ± 18% (1.23 ± 0.15 vs. 1.88 ± 0.37 in LY379268; P = 0.04, Student's paired t test) (Fig. 8N). Thus, mGluR2/3 promoted strong presynaptic inhibition of both D1R+ and D2R+ cells, while presynaptic inhibition by D2Rs was independent of group 2 mGluRs.
D1Rs are excitatory, while both D2 and CB1 receptors inhibit presynaptic activity of striatopallidal neurons
mEPSCs were recorded in fluorescent cells from Drd2-EGFP mice to further localize D1, A1, D2 and CB1 receptors on presynaptic terminals. The D1R agonist SKF38393 increased the frequency, but not the amplitude of mEPSC in fluorescent MSNs by 51 ± 18% (2.43 ± 0.65 Hz in vehicle vs. 3.12 ± 0.71 Hz in SKF38393; n = 11 cells; P = 0.01, Student's paired t test) by increasing high-frequency, low-amplitude events (Fig. 9A). Conversely, adenosine diminished the frequency of mEPSCs in D2R+ cells by 31 ± 7% (3.38 ± 0.78 Hz in vehicle vs. 2.03 ± 0.32 Hz with adenosine; n = 10; P = 0.02, Student's paired t test) while the amplitude distribution remained unchanged (Fig. 9B). Compared to its selective inhibition of high-frequency, low-amplitude events in D1R+ cells, adenosine more broadly inhibited input frequencies to D2R+ MSNs (compare Figs 6D and 9B).
Figure 9. Excitatory D1Rs and inhibitory A1, D2 and CB1Rs modulate presynaptic inputs in Drd2-EGFP mice.
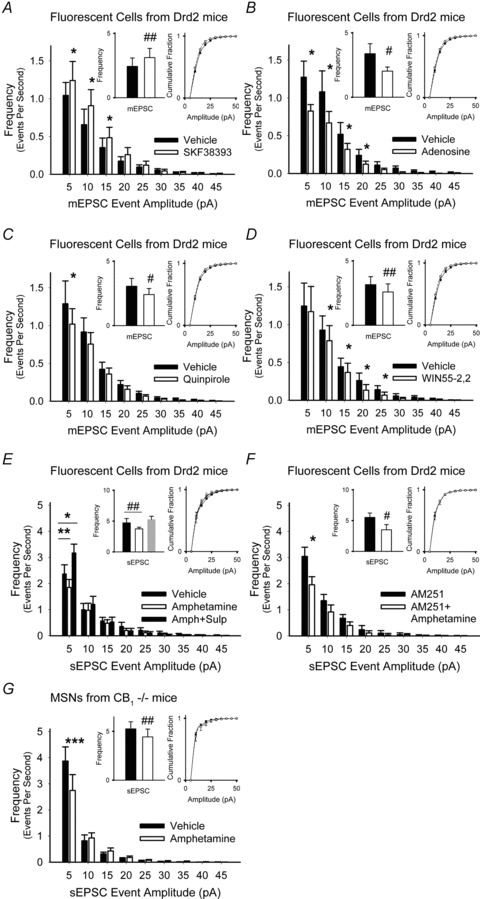
A, the D1R agonist SKF38393 increased the frequency of mEPSCs by boosting the high-frequency, low-amplitude spontaneous inward currents but did not change the cumulative distribution of mEPSC amplitudes. For all panels, *P < 0.05, **P < 0.01, ***P < 0.001, Student's t test with Bonferroni adjustment and #P < 0.05, ##P < 0.01, Student's paired t test. B, adenosine reduced the frequency of mEPSCs by broadly decreasing high-frequency, low-amplitude currents and did not change the mEPSC amplitude distribution. C, the D2R agonist quinpirole reduced the frequency of mEPSCs by specifically reducing high-frequency, low-amplitude inward currents but did not change the cumulative amplitude distribution. D, the CB1R agonist WIN55-2,2 decreased mEPSC over a wide range of frequencies and did not changes their amplitude distributions. E, amphetamine increased the frequency, but not the amplitude of sEPSCs in D2R+ cells. The D2R antagonist sulpiride blocked inhibition and the frequency of 5–10 pA inward currents increased. F and G, the frequency of sEPSCs was reduced by amphetamine with AM251 in D2+ cells (F), and also by amphetamine in MSNs from CB1−/− mice (G).
The D2R agonist quinpirole also reduced the frequency, but not the amplitude, of mEPSCs in D2R+ cells by 20 ± 6% (3.06 ± 0.61 Hz in vehicle vs. 2.41 ± 0.47 Hz with quinpirole; n = 16; P = 0.04, Student's paired t test) by depressing high-frequency, low-amplitude inward currents (Fig. 9C) and the CB1R agonist WIN55-2,2 decreased the frequency, but not the amplitude distribution, in D2R+ cells by 22 ± 7% (3.15 ± 0.62 Hz in vehicle vs. 2.59 ± 0.63 Hz with WIN55–2,2; n = 8; P = 0.01, Student's paired t test) (Fig. 9D). Compared to quinpirole, WIN55-2,2 more broadly reduced mEPSC frequencies (compare Fig. 9C and D). Thus, D1Rs increased the frequency of mEPSCs, while D2 and CB1 receptors were inhibitory.
We determined how dopamine might modulate corticoaccumbal inputs to D2R+ MSNs under more physiological conditions. Measurement of spontaneous inward currents in D2R+ cells indicated that amphetamine reduced the frequency, but not amplitude distribution, of sEPSCs by 23 ± 13% (4.71 ± 0.71 Hz in vehicle vs. 3.74 ± 0.67 Hz in amphetamine; n = 7; P = 0.009, Student's paired t test). This inhibition by amphetamine was produced by competition between D1 and D2 receptors, since the D2R antagonist sulpiride blocked the decrease in sEPSC frequency (−0.5 ± 8%; 5.25 ± 0.54 Hz; P = 0.9, compared to vehicle, Student's paired t test) and the frequency of 5–10 pA inward currents increased (Fig. 9E). Inhibition by quinpirole was at least partially independent of endocannabinoids since it persisted in the presence of the CB1R antagonist AM251 (−33 ± 8%; 5.52 ± 0.71 Hz in vehicle vs. 3.51 ± 0.84 Hz in amphetamine; n = 6; P = 0.03, Student's paired t test) (Fig. 9F) and in CB1−/− mice (−17 ± 5%; 5.26 ± 0.73 Hz in vehicle vs. 4.44 ± 0.8 Hz in amphetamine; n = 6; P = 0.01, Student's paired t test) (Fig. 9G).
CB1Rs inhibit presynaptic activity when synapses are active while D2Rs independently modulate glutamate release when synapses are quiet
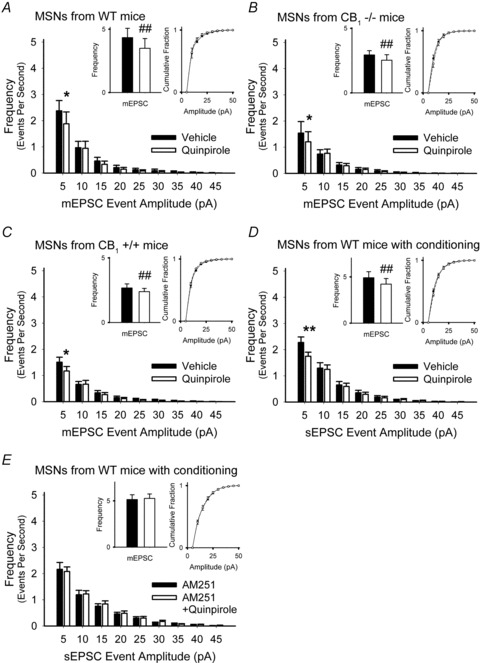
To confirm these data, we also measured mEPSCs in non-genetically manipulated WT mice, where over-expression of D2Rs has not been found (Kramer et al. 2011). The frequency of mEPSC declined by 23 ± 9% in the D2R agonist (4.34 ± 0.73 Hz in vehicle vs. 3.5 ± 0.77 Hz in quinpirole; n = 10 cells; P < 0.001, Student's paired t test), primarily by reducing high-frequency, 5–10 pA events (Fig. 10A). Presynaptic inhibition by the D2R agonist was independent of CB1Rs since quinpirole decreased mEPSCs in slices from CB1−/− mice by −13 ± 2% (2.94 ± 0.33 Hz in vehicle vs. 2.53 ± 0.43 Hz in quinpirole; n = 12; P = 0.01, Student's paired t test) and also in their CB1+/+ littermates (12 ± 4%; 2.67 ± 0.31 Hz in vehicle vs. 2.38 ± 0.25 Hz in quinpirole: n = 15; P = 0.007, Student's paired t test) (Fig. 10B and C), suggesting that under non-stimulated conditions, D2Rs can also inhibit glutamate release in the absence of CB1Rs. Tonic inhibition by endocannabinoids was lacking in the absence of evoked stimulation, since the frequency of mEPSC in MSNs from CB1+/+ and CB1−/− mice were similar (P = 0.44, ANOVA).
Figure 10. D2 and CB1 receptors inhibit glutamate release in WT mice.
A, the D2R agonist quinpirole decreased the average frequency of mEPSCs by reducing high-frequency, low-amplitude events but did not alter the cumulative mEPSC amplitude distribution. For all panels, *P < 0.05, **P < 0.01, Student's t test with Bonferroni adjustment and ##P < 0.001, Student's paired t test. B and C, quinpirole reduced the frequency of mEPSCs in cells from CB1+/+ mice (B), and also in MSNs from CB1−/− mice (C). D, quinpirole also reduced the frequency of sEPSCs in cells from WT mice following conditioning stimuli. E, after cortical conditioning stimuli were applied, the reduction in the frequency of sEPSCs by quinpirole was blocked by the CB1R antagonist AM251.
To determine if synaptic activity might generate endocannabinoid inhibition at presynaptic terminals, sEPSCs (without TTX) were observed in MSNs from WT mice following conditioning stimuli, consisting of cortically applied paired-pulses at 20 Hz (Fig. 7B). When conditioning stimuli were applied, quinpirole depressed the frequency of sEPSCs (−12 ± 4%; 4.91 ± 0.66 Hz in vehicle vs. 4.22 ± 0.6 Hz in quinpirole; n = 12; P = 0.01, Student's paired t test) by inhibiting 5–10 pA inward currents (Fig. 10D). The CB1R antagonist AM251 blocked the inhibition by quinpirole following conditioning stimuli (5.14 ± 0.52 Hz in AM251 vs. 5.26 ± 0.48 Hz in AM251 with quinpirole; n = 15; P = 0.5, Student's paired t test) (Fig. 10E) and no differences were observed in sEPSC amplitude distributions with or without AM251. These data suggest that presynaptic inhibition by endocannabinoids requires synaptic activity and that D2Rs may independently modulate glutamate release in their absence.
Discussion
Interactions between dopamine and glutamate in the NAcore are required for behavioural adaptations provoked by salient experiences (Pennartz et al. 1994) and these data show how dopamine can provide frequency-dependent and temporal modulation of corticoaccumbal activity in striatonigral and striatopallidal MSNs. At cortical frequencies below 10 Hz, presynaptic D1Rs excited both D1 and D2 receptor-expressing MSNs, while D2Rs specifically inhibited excitatory inputs to D2R-expressing cells. At higher cortical frequencies, dopamine promoted a prevailing inhibition of presynaptic corticoaccumbal terminals through adenosine and endocannabinoids, respectively. Adenosine production was dependent on activation of D1, AMPA and NMDA receptors and inhibited presynaptic activity to both D1 and D2R-expressing MSNs. Endocannabinoids caused a relatively late reduction in corticoaccumbal activity that specifically targeted D2R-expressing cells and was independent of AMPA, NMDA, group 2 mGlu, and D1 receptors, but required group 1 mGluRs. Thus, dopamine released following behavioural cues or psychostimulants would increase corticoaccumbal excitation and promote strong signals along the striatonigral pathway while inhibiting the weak. Once activated, each population of D1 or D2 receptor-expressing output neuron could curb their excitation though segregated retrograde pathways to encode signal patterns for striatal information processing (Geldwert et al. 2006; Mizuno et al. 2007) (Fig. 11).
Figure 11. Proposed mechanism for signal processing by dopamine.
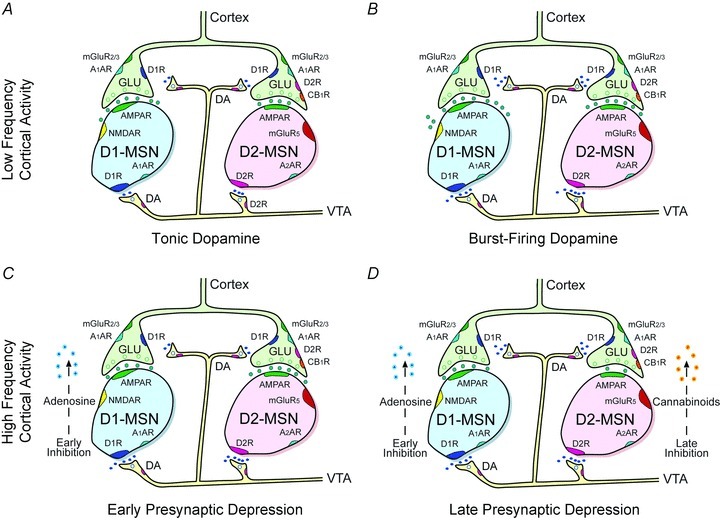
A, when corticoaccumbal neurons fire at low frequencies, tonic dopamine inhibits corticoaccumbal activity through D2Rs, which selectively inhibit low-release probability synapses on D2R-expressing MSNs. B, higher levels of evoked dopamine also modulate corticoaccumbal activity through D1Rs that strengthen glutamate release from presynaptic terminals innervating both D1 and D2R-expressing MSNs. C, when corticoaccumbal neurons fire a higher frequencies, dopamine promotes a much stronger modulation of presynaptic activity through adenosine. Adenosine inhibits presynaptic activity to both D1 and D2 receptor-expressing MSNs via A1Rs and in D1-receptor expressing cells, is dependent on AMPA and NMDA receptor activation, as well as adenylate cyclase coupling in D1R-expressing MSNs. D, high frequency corticoaccumbal activity also promotes a selective presynaptic inhibition of D2R-expressing MSNs via CB1Rs. Presynaptic inhibition by endocannabinoids is slower than adenosine, is strengthened by stimulation of D2Rs, and is dependent on group 1 mGlu receptors.
Results demonstrated how dopamine provides selective filtering at presynaptic corticoaccumbal terminals at low cortical frequencies. Unlike that found in the dorsal striatum (Maura et al. 1988; Hsu et al. 1995; Bamford et al. 2004b; Dumartin et al. 2007), we showed for the first time that D1Rs boosted glutamate release from terminals innervating both D1 and D2R-expressing MSNs with modulation likely occurring via presynaptic D1Rs located on ∼25% of corticoaccumbal terminals (Dumartin et al. 2007). Under conditions of non-evoked, spontaneous glutamate release, amphetamine selectively and differentially modified the activity of high-frequency, low-amplitude excitatory currents to MSNs by producing a D1R-dependent excitation of D1R-expressing MSNs while causing a net D2R-dependent reduction in the excitation of D2R-bearing cells. Although not sensitive to the type of MSN activated, the optical experiments revealed a similar pattern of excitation and inhibition from low-probability release terminals at cortical stimulation frequencies around 10 Hz, with amphetamine increasing exocytosis via D1Rs and decreasing exocytosis through D2Rs.
These opposing actions of D1 and D2 receptors on corticoaccumbal activity were occluded by the release of adenosine and endocannabinoids at higher cortical frequencies, which also dampened weak signals to D2 receptor-bearing MSNs and enhanced strong signals to D1R-expressing cells. Data suggest that when D1R-expressing striatal neurons were activated, postsynaptic D1Rs facilitated adenosine efflux and caused retrograde inhibition by decreasing the probability of glutamate release to D1 receptor-expressing MSNs. Stimulation of either D1 or A1 receptors attenuated exocytosis from ∼80% of cortical terminals, concordant with the percentage of adenosine receptors on striatal glutamatergic afferents (Ciruela et al. 2006) and selected strong synapses on D1-expressing MSNs while more broadly reducing synaptic transmission to D2R-bearing cells. Adenosine was sufficient to produce presynaptic inhibition in the absence of postsynaptic D1R activation and its actions at presynaptic terminals were augmented through Gi/o protein coupling by D1R- and forskolin-mediated stimulation of adenylyl cyclase and cAMP, which may then produce adenosine following dephosphorylation by ecto-nucleotidases (Dunwiddie & Masino, 2001). We also found that inhibition by adenosine was dependent on NMDAR stimulation and was potentiated by AMPARs, suggesting that D1 (Levine et al. 1996) and AMPA (Cherubini et al. 1988) receptors on MSNs may augment NMDAR-dependent calcium entry into postsynaptic cells (Huang et al. 2011) to promote adenosine production through signalling cascades (Husi et al. 2000; Hardingham et al. 2001) that are independent of adenylyl cyclase (Manzoni et al. 1994; Harvey & Lacey, 1997). These parallel mechanisms may share a common pathway (Dunwiddie & Masino, 2001) through cAMP (Sabatini et al. 2002; Vanhoutte & Bading, 2003; Dell’Acqua et al. 2006) since blockade of either adenylyl cyclase or NMDARs prevented inhibition triggered by the D1R agonist.
Activation of D2R-expressing striatal neurons at high cortical frequencies also encouraged further depression of the striatopallidal pathway through endocannabinoid signalling, which was strengthened at much higher cortical stimulation frequencies in the absence of amphetamine. D2Rs attenuated glutamate release by enhancing endocannabinoid efflux, presumably from MSNs (Di Marzo et al. 1994), after cortical stimulation was applied and more uniformly filtered cortical afferents to those same cells. Similar to that described in the dorsal striatum (Kreitzer & Malenka, 2005; Yin & Lovinger, 2006) and VTA (Pan et al. 2008), CB1Rs had a strong modulatory effect on corticoaccumbal excitation that was driven by D2Rs following synaptic conditioning and was dependent on group 1, but not group 2, mGluRs. The D2R response was upstream from that of the mGluR and the CB1 receptor, as blocking either receptor prevented the D2R agonist from inhibiting presynaptic release. These findings confirm and extend data in other studies showing that D2R-expressing MSNs specifically participate in activity-dependent reduction in the efficacy of neuronal synapses (Grueter et al. 2010) that can be expressed through presynaptic mechanisms (Choi & Lovinger, 1997a,b). Both optical and electrophysiological recordings provided evidence of on-going inhibition by endocannabinoids at much higher stimulation frequencies in the absence of D2R activation. This supports existing evidence that cannabinoid-mediated presynaptic inhibition and LTD require some threshold level of synaptic activation that is provided at high cortical frequencies or following prolonged exposure to spontaneous activity (Adermark & Lovinger, 2007; Lovinger, 2010).
Interestingly, it appeared that a greater number of evoked synaptic currents were required to establish the full expression of endocannabinoid-mediated synaptic depression, as compared to the more rapid presynaptic attenuation caused by adenosine. This delay in endocannabinoid response is similar to that demonstrated during hippocampal LTD (Chevaleyre & Castillo, 2003) and may be due to requisite glutamate efflux to extra-synaptic mGluRs (Yin & Lovinger, 2006). A failure or delay in generating a concentered synaptic depression by endocannabinoids would lead to an imbalance in signals leaving the striatum via the striatonigral and striatopallidal projections, possibly affecting the viability of D2R-expressing MSNs, which may be susceptible to selective degeneration (Reiner et al. 1988; Joshi et al. 2009), and favour a shift from cannabinoid-induced LTD to long-term potentiation that develops through adenosine A2A receptors on striatopallidal neurons (Higley & Sabatini, 2010).
We also found evidence for endocannabinoid- independent D2R inhibition at presynaptic afferents to striatopallidal pathway neurons. Under non-stimulated conditions, D2Rs inhibited spontaneous excitatory neurotransmission specific to D2R-expressing MSNs by reducing exocytosis from cortical terminals with a low probability of release. This depression of excitatory inward currents by D2Rs was in part independent of endocannabinoids, as it persisted in CB1−/− mice, and possibly occurred via D2Rs located on asymmetric, excitatory-type synapses in the NAcore (Pickel et al. 2006), although contributions from other sources, including interneurons that also express D2Rs (Dawson et al. 1988; Seamans et al. 2001), are possible. Presynaptic D2Rs have been shown to facilitate cannabinoid-induced long-term depression (LTD) in the VTA (Pan et al. 2008) and may depress the probability of neurotransmitter release by inhibiting cAMP/PKA signalling at the presynaptic terminal (Neve et al. 2004; Howlett, 2005). Since inhibition by D2Rs was detected in CB1−/− mice in the absence of stimulation, dopamine may produce relatively weak synaptic filtering at low frequencies and provoke a more robust and overriding synaptic depression at higher frequencies by enhancing stimulus-dependent endocannabinoid efflux from MSNs, which can then bind to CB1 or CB1/D2 receptor heteromers on presynaptic terminals (Kearn et al. 2005; Pickel et al. 2006; Marcellino et al. 2008).
Prior studies have generated apparently conflicting conclusions regarding the putative interactions between dopamine and glutamate within the NAcore. Results biased towards direct or indirect modulation, excitation or inhibition, or even a lack of response, might be attributed to the proportion of D1 and D2 receptor-expressing MSNs examined, by the presence or absence of synaptic stimulation, by differences in striatal anatomy or cortical stimulation frequency, or by the use of intra-striatal electrical stimulation to provoke synaptic activity that would likely release dopamine (Bamford et al. 2004b) and inadvertently modulate responses at the MSN.
It is tempting to speculate that selective filtering of low-probability synapses in the NAcore by dopamine, adenosine and endocannabinoids may be instrumental in determining the salience of sensory input and in defining the reinforcing properties associated with rewarding behaviour and attention (Pennartz et al. 1994). Presynaptic D1Rs that are selectively activated by dopamine burst firing in response to novel stimulation would initially lead to a stronger excitatory synaptic event but then, in an activity-dependent way, a subsequent lowering of the background at those same synapses via adenosine and endocannabinoids, thereby improving signal-to-noise while promoting attention on salient behavioural cues (Rebec, 1998; Dani & Zhou, 2004). These neuromodulators provide frequency-dependent filtering of excitatory inputs and also provide temporal filtering that leads to that selection. This activity-dependent filtering may accentuate particular synapses in space but also at a particular time. When different synapses are selected during motor learning, by the convergence of dopamine and cortical activity, oscillations between synaptic activation and depression may then enable sequencing of one motor task after another. Unwanted plasticity at striatal synapses due to alterations in dopamine, adenosine, endocannabinoid or glutamate availability or receptor sensitivity and expression would alter synaptic efficacy, promote an imbalance between striatonigral and striatopallidal pathways and contribute to symptoms and signs of neuropsychiatric disease.
Acknowledgments
We would like to acknowledge Michael S. Levine, Carlos Cepeda and Gowry Fernando at the University of California, Los Angeles for providing breeding pairs of Drd1 and Drd2 EGFP BAC transgenic mice. We thank Nephi Stella and Xiaocui Sun at the University of Washington for providing CB1-null and control mice. We thank David Sulzer, Richard Palmiter and David Perkel for careful reading and pertinent comments. We also thank Ian J. Bamford and Lisa H. Zimberg for assistance. This work was supported by NIH grants NS052536, NS060803, DA007278, and HD02274, the University of Washington Vision Research Centre and Seattle Children's Hospital, Seattle, WA.
Glossary
- AMPAR
AMPA receptor
- AMPH
amphetamine
- BAC
bacterial artificial chromosome
- D1R+
D1 receptor-expressing MSN
- D2R+
D2 receptor-expressing MSN
- eEPSC
evoked EPSC
- EGFP
enhanced green fluorescent protein
- LTD
long-term depression
- mEPSC
miniature EPSC
- mGluR
metabotropic glutamate receptor
- MSN
medium spiny neuron
- NAcore
nucleus accumbens core
- NMDAR
NMDA receptor
- PFC
prefrontal cortex
- PKA
protein kinase A
- PPR
paired-pulse ratio
- R
receptor
- sEPSC
spontaneous EPSC
- Veh
vehicle
- VTA
ventral tegmentum
Author contributions
Conception and design of the experiments: N.S.B. Collection, analysis and interpretation of data: D.D., W.W., J.L., A.B., E.K.E., I.N., J.T., G.P.S. and N.S.B. Drafting the article or revising it critically for important intellectual content: N.S.B. All authors approved the final version of the manuscript.
Supplementary material
Supplementary Methods
Supplemental Figure 1
Supplemental Figure 2
Supplemental Figure 3
Supplemental Figure 4
Supplemental Figure 5
Supplemental Figure 6
Supplemental Figure 7
References
- Adermark L, Lovinger DM. Retrograde endocannabinoid signaling at striatal synapses requires a regulated postsynaptic release step. Proc Natl Acad Sci U S A. 2007;104:20564–20569. doi: 10.1073/pnas.0706873104. [DOI] [PMC free article] [PubMed] [Google Scholar]
- Albin RL, Young AB, Penney JB. The functional anatomy of basal ganglia disorders. Trends Neurosci. 1989;12:366–375. doi: 10.1016/0166-2236(89)90074-x. [DOI] [PubMed] [Google Scholar]
- Bamford NS, Cepeda C. The corticostriatal pathway in parkinson's disease. In: Tseng KY, editor. Cortico-Subcortical Dynamics in Parkinson's Disease. New York: Humana Press; 2009. pp. 87–104. [Google Scholar]
- Bamford NS, Robinson S, Palmiter RD, Joyce JA, Moore C, Meshul CK. Dopamine modulates release from corticostriatal terminals. J Neurosci. 2004a;24:9541–9552. doi: 10.1523/JNEUROSCI.2891-04.2004. [DOI] [PMC free article] [PubMed] [Google Scholar]
- Bamford NS, Zhang H, Joyce JA, Scarlis CA, Hanan W, Wu NP, Andre VM, Cohen R, Cepeda C, Levine MS, Harleton E, Sulzer D. Repeated exposure to methamphetamine causes long-lasting presynaptic corticostriatal depression that is renormalized with drug readministration. Neuron. 2008;58:89–103. doi: 10.1016/j.neuron.2008.01.033. [DOI] [PMC free article] [PubMed] [Google Scholar]
- Bamford NS, Zhang H, Schmitz Y, Wu NP, Cepeda C, Levine MS, Schmauss C, Zakharenko SS, Zablow L, Sulzer D. Heterosynaptic dopamine neurotransmission selects sets of corticostriatal terminals. Neuron. 2004b;42:653–663. doi: 10.1016/s0896-6273(04)00265-x. [DOI] [PubMed] [Google Scholar]
- Brady AM, O’Donnell P. Dopaminergic modulation of prefrontal cortical input to nucleus accumbens neurons in vivo. J Neurosci. 2004;24:1040–1049. doi: 10.1523/JNEUROSCI.4178-03.2004. [DOI] [PMC free article] [PubMed] [Google Scholar]
- Brundege JM, Diao L, Proctor WR, Dunwiddie TV. The role of cyclic AMP as a precursor of extracellular adenosine in the rat hippocampus. Neuropharmacology. 1997;36:1201–1210. doi: 10.1016/s0028-3908(97)00102-0. [DOI] [PubMed] [Google Scholar]
- Cepeda C, Andre VM, Yamazaki I, Wu N, Kleiman-Weiner M, Levine MS. Differential electrophysiological properties of dopamine D1 and D2 receptor-containing striatal medium-sized spiny neurons. Eur J Neurosci. 2008;27:671–682. doi: 10.1111/j.1460-9568.2008.06038.x. [DOI] [PubMed] [Google Scholar]
- Cepeda C, Bamford NS, Andre VM, Levine MS. Alterations in corticostriatal synaptic function in Huntington's and Parkinson's diseases. In: Steiner H, Tseng KY, editors. Basal Ganglia Structure and Function. San Diego: Elsevier; 2010. pp. 607–623. [Google Scholar]
- Cepeda C, Hurst RS, Altemus KL, Flores-Hernandez J, Calvert CR, Jokel ES, Grandy DK, Low MJ, Rubinstein M, Ariano MA, Levine MS. Facilitated glutamatergic transmission in the striatum of D2 dopamine receptor-deficient mice. J Neurophysiol. 2001;85:659–670. doi: 10.1152/jn.2001.85.2.659. [DOI] [PubMed] [Google Scholar]
- Cherubini E, Herrling PL, Lanfumey L, Stanzione P. Excitatory amino acids in synaptic excitation of rat striatal neurones in vitro. J Physiol. 1988;400:677–690. doi: 10.1113/jphysiol.1988.sp017143. [DOI] [PMC free article] [PubMed] [Google Scholar]
- Chevaleyre V, Castillo PE. Heterosynaptic LTD of hippocampal GABAergic synapses: a novel role of endocannabinoids in regulating excitability. Neuron. 2003;38:461–472. doi: 10.1016/s0896-6273(03)00235-6. [DOI] [PubMed] [Google Scholar]
- Choi S, Lovinger DM. Decreased frequency but not amplitude of quantal synaptic responses associated with expression of corticostriatal long-term depression. J Neurosci. 1997a;17:8613–8620. doi: 10.1523/JNEUROSCI.17-21-08613.1997. [DOI] [PMC free article] [PubMed] [Google Scholar]
- Choi S, Lovinger DM. Decreased probability of neurotransmitter release underlies striatal long-term depression and postnatal development of corticostriatal synapses. Proc Natl Acad Sci U S A. 1997b;94:2665–2670. doi: 10.1073/pnas.94.6.2665. [DOI] [PMC free article] [PubMed] [Google Scholar]
- Ciruela F, Casado V, Rodrigues RJ, Lujan R, Burgueno J, Canals M, Borycz J, Rebola N, Goldberg SR, Mallol J, Cortes A, Canela EI, Lopez-Gimenez JF, Milligan G, Lluis C, Cunha RA, Ferre S, Franco R. Presynaptic control of striatal glutamatergic neurotransmission by adenosine A1–A2A receptor heteromers. J Neurosci. 2006;26:2080–2087. doi: 10.1523/JNEUROSCI.3574-05.2006. [DOI] [PMC free article] [PubMed] [Google Scholar]
- Dani JA, Zhou FM. Selective dopamine filter of glutamate striatal afferents. Neuron. 2004;42:522–524. doi: 10.1016/j.neuron.2004.05.008. [DOI] [PubMed] [Google Scholar]
- Dawson VL, Dawson TM, Filloux FM, Wamsley JK. Evidence for dopamine D-2 receptors on cholinergic interneurons in the rat caudate-putamen. Life Sci. 1988;42:1933–1939. doi: 10.1016/0024-3205(88)90492-4. [DOI] [PubMed] [Google Scholar]
- Dell’Acqua ML, Smith KE, Gorski JA, Horne EA, Gibson ES, Gomez LL. Regulation of neuronal PKA signaling through AKAP targeting dynamics. Eur J Cell Biol. 2006;85:627–633. doi: 10.1016/j.ejcb.2006.01.010. [DOI] [PubMed] [Google Scholar]
- Di Marzo V, Fontana A, Cadas H, Schinelli S, Cimino G, Schwartz JC, Piomelli D. Formation and inactivation of endogenous cannabinoid anandamide in central neurons. Nature. 1994;372:686–691. doi: 10.1038/372686a0. [DOI] [PubMed] [Google Scholar]
- Ding L, Perkel DJ, Farries MA. Presynaptic depression of glutamatergic synaptic transmission by D1-like dopamine receptor activation in the avian basal ganglia. J Neurosci. 2003;23:6086–6095. doi: 10.1523/JNEUROSCI.23-14-06086.2003. [DOI] [PMC free article] [PubMed] [Google Scholar]
- Dumartin B, Doudnikoff E, Gonon F, Bloch B. Differences in ultrastructural localization of dopaminergic D1 receptors between dorsal striatum and nucleus accumbens in the rat. Neurosci Lett. 2007;419:273–277. doi: 10.1016/j.neulet.2007.04.034. [DOI] [PubMed] [Google Scholar]
- Dunwiddie TV, Masino SA. The role and regulation of adenosine in the central nervous system. Annu Rev Neurosci. 2001;24:31–55. doi: 10.1146/annurev.neuro.24.1.31. [DOI] [PubMed] [Google Scholar]
- Geldwert D, Norris JM, Feldman IG, Schulman JJ, Joyce MP, Rayport S. Dopamine presynaptically and heterogeneously modulates nucleus accumbens medium-spiny neuron GABA synapses in vitro. BMC Neurosci. 2006;7:53. doi: 10.1186/1471-2202-7-53. [DOI] [PMC free article] [PubMed] [Google Scholar]
- Gorelova N, Yang CR. The course of neural projection from the prefrontal cortex to the nucleus accumbens in the rat. Neuroscience. 1997;76:689–706. doi: 10.1016/s0306-4522(96)00380-6. [DOI] [PubMed] [Google Scholar]
- Goto Y, Grace AA. The dopamine system and the pathophysiology of schizophrenia: a basic science perspective. Int Rev Neurobiol. 2007;78C:41–68. doi: 10.1016/S0074-7742(06)78002-3. [DOI] [PubMed] [Google Scholar]
- Grueter BA, Brasnjo G, Malenka RC. Postsynaptic TRPV1 triggers cell type-specific long-term depression in the nucleus accumbens. Nat Neurosci. 2010;13:1519–1525. doi: 10.1038/nn.2685. [DOI] [PMC free article] [PubMed] [Google Scholar]
- Hardingham GE, Arnold FJ, Bading H. A calcium microdomain near NMDA receptors: on switch for ERK-dependent synapse-to-nucleus communication. Nat Neurosci. 2001;4:565–566. doi: 10.1038/88380. [DOI] [PubMed] [Google Scholar]
- Harvey J, Lacey MG. Endogenous and exogenous dopamine depress EPSCs in rat nucleus accumbens in vitro via D1 receptors activation. J Physiol. 1996;492:143–154. doi: 10.1113/jphysiol.1996.sp021296. [DOI] [PMC free article] [PubMed] [Google Scholar]
- Harvey J, Lacey MG. A postsynaptic interaction between dopamine D1 and NMDA receptors promotes presynaptic inhibition in the rat nucleus accumbens via adenosine release. J Neurosci. 1997;17:5271–5280. doi: 10.1523/JNEUROSCI.17-14-05271.1997. [DOI] [PMC free article] [PubMed] [Google Scholar]
- Higley MJ, Sabatini BL. Competitive regulation of synaptic Ca2+ influx by D2 dopamine and A2A adenosine receptors. Nat Neurosci. 2010;13:958–966. doi: 10.1038/nn.2592. [DOI] [PMC free article] [PubMed] [Google Scholar]
- Howlett AC. Cannabinoid receptor signaling. Handb Exp Pharmacol. 2005:53–79. doi: 10.1007/3-540-26573-2_2. [DOI] [PubMed] [Google Scholar]
- Hsu KS, Huang CC, Yang CH, Gean PW. Presynaptic D2 dopaminergic receptors mediate inhibition of excitatory synaptic transmission in rat neostriatum. Brain Res. 1995;690:264–268. doi: 10.1016/0006-8993(95)00734-8. [DOI] [PubMed] [Google Scholar]
- Huang YH, Ishikawa M, Lee BR, Nakanishi N, Schluter OM, Dong Y. Searching for presynaptic NMDA receptors in the nucleus accumbens. J Neurosci. 2011;31:18453–18463. doi: 10.1523/JNEUROSCI.3824-11.2011. [DOI] [PMC free article] [PubMed] [Google Scholar]
- Husi H, Ward MA, Choudhary JS, Blackstock WP, Grant SG. Proteomic analysis of NMDA receptor-adhesion protein signaling complexes. Nat Neurosci. 2000;3:661–669. doi: 10.1038/76615. [DOI] [PubMed] [Google Scholar]
- Joshi PR, Wu NP, Andre VM, Cummings DM, Cepeda C, Joyce JA, Carroll JB, Leavitt BR, Hayden MR, Levine MS, Bamford NS. Age-dependent alterations of corticostriatal activity in the YAC128 mouse model of Huntington disease. J Neurosci. 2009;29:2414–2427. doi: 10.1523/JNEUROSCI.5687-08.2009. [DOI] [PMC free article] [PubMed] [Google Scholar]
- Kalivas PW, Volkow ND. The neural basis of addiction: a pathology of motivation and choice. Am J Psychiatry. 2005;162:1403–1413. doi: 10.1176/appi.ajp.162.8.1403. [DOI] [PubMed] [Google Scholar]
- Karasawa J, Kotani M, Kambe D, Chaki S. AMPA receptor mediates mGlu 2/3 receptor antagonist-induced dopamine release in the rat nucleus accumbens shell. Neurochem Int. 2010;57:615–619. doi: 10.1016/j.neuint.2010.07.011. [DOI] [PubMed] [Google Scholar]
- Kearn CS, Blake-Palmer K, Daniel E, Mackie K, Glass M. Concurrent stimulation of cannabinoid CB1 and dopamine D2 receptors enhances heterodimer formation: a mechanism for receptor cross-talk? Mol Pharmacol. 2005;67:1697–1704. doi: 10.1124/mol.104.006882. [DOI] [PubMed] [Google Scholar]
- Kramer PF, Christensen CH, Hazelwood LA, Dobi A, Bock R, Sibley DR, Mateo Y, Alvarez VA. Dopamine D2 receptor overexpression alters behavior and physiology in Drd2-EGFP mice. J Neurosci. 2011;31:126–132. doi: 10.1523/JNEUROSCI.4287-10.2011. [DOI] [PMC free article] [PubMed] [Google Scholar]
- Kreitzer AC, Malenka RC. Dopamine modulation of state-dependent endocannabinoid release and long-term depression in the striatum. J Neurosci. 2005;25:10537–10545. doi: 10.1523/JNEUROSCI.2959-05.2005. [DOI] [PMC free article] [PubMed] [Google Scholar]
- Laurenza A, Sutkowski EM, Seamon KB. Forskolin: a specific stimulator of adenylyl cyclase or a diterpene with multiple sites of action? Trends Pharmacol Sci. 1989;10:442–447. doi: 10.1016/S0165-6147(89)80008-2. [DOI] [PubMed] [Google Scholar]
- Levine MS, Altemus KL, Cepeda C, Cromwell HC, Crawford C, Ariano MA, Drago J, Sibley DR, Westphal H. Modulatory actions of dopamine on NMDA receptor-mediated responses are reduced in D1Adeficient mutant mice. J Neurosci. 1996;16:5870–5882. doi: 10.1523/JNEUROSCI.16-18-05870.1996. [DOI] [PMC free article] [PubMed] [Google Scholar]
- Lovinger DM. Neurotransmitter roles in synaptic modulation, plasticity and learning in the dorsal striatum. Neuropharmacology. 2010;58:951–961. doi: 10.1016/j.neuropharm.2010.01.008. [DOI] [PMC free article] [PubMed] [Google Scholar]
- Lovinger DM, McCool BA. Metabotropic glutamate receptor-mediated presynaptic depression at corticostriatal synapses involves mGLuR2 or 3. J Neurophysiol. 1995;73:1076–1083. doi: 10.1152/jn.1995.73.3.1076. [DOI] [PubMed] [Google Scholar]
- Manzoni OJ, Manabe T, Nicoll RA. Release of adenosine by activation of NMDA receptors in the hippocampus. Science. 1994;265:2098–2101. doi: 10.1126/science.7916485. [DOI] [PubMed] [Google Scholar]
- Marcellino D, Carriba P, Filip M, Borgkvist A, Frankowska M, Bellido I, Tanganelli S, Muller CE, Fisone G, Lluis C, Agnati LF, Franco R, Fuxe K. Antagonistic cannabinoid CB1/dopamine D2 receptor interactions in striatal CB1/D2 heteromers. A combined neurochemical and behavioral analysis. Neuropharmacology. 2008;54:815–823. doi: 10.1016/j.neuropharm.2007.12.011. [DOI] [PubMed] [Google Scholar]
- Marsicano G, Goodenough S, Monory K, Hermann H, Eder M, Cannich A, Azad SC, Cascio MG, Gutierrez SO, van der Stelt M, Lopez-Rodriguez ML, Casanova E, Schutz G, Zieglgansberger W, Di Marzo V, Behl C, Lutz B. CB1 cannabinoid receptors and on-demand defense against excitotoxicity. Science. 2003;302:84–88. doi: 10.1126/science.1088208. [DOI] [PubMed] [Google Scholar]
- Maura G, Giardi A, Raiteri M. Release-regulating D-2 dopamine receptors are located on striatal glutamatergic nerve terminals. J Pharmacol Exp Ther. 1988;247:680–684. [PubMed] [Google Scholar]
- Memo M, Missale C, Carruba MO, Spano PF. Pharmacology and biochemistry of dopamine receptors in the central nervous system and peripheral tissue. J Neural Transm Suppl. 1986;22:19–32. [PubMed] [Google Scholar]
- Mennerick S, Zorumski CF. Paired-pulse modulation of fast excitatory synaptic currents in microcultures of rat hippocampal neurons. J Physiol. 1995;488:85–101. doi: 10.1113/jphysiol.1995.sp020948. [DOI] [PMC free article] [PubMed] [Google Scholar]
- Mizuno T, Schmauss C, Rayport S. Distinct roles of presynaptic dopamine receptors in the differential modulation of the intrinsic synapses of medium-spiny neurons in the nucleus accumbens. BMC Neurosci. 2007;8:8. doi: 10.1186/1471-2202-8-8. [DOI] [PMC free article] [PubMed] [Google Scholar]
- Neve KA, Seamans JK, Trantham-Davidson H. Dopamine receptor signaling. J Recept Signal Transduct Res. 2004;24:165–205. doi: 10.1081/rrs-200029981. [DOI] [PubMed] [Google Scholar]
- Nicola SM, Kombian SB, Malenka RC. Psychostimulants depress excitatory synaptic transmission in the nucleus accumbens via presynaptic D1-like dopamine receptors. J Neurosci. 1996;16:1591–1604. doi: 10.1523/JNEUROSCI.16-05-01591.1996. [DOI] [PMC free article] [PubMed] [Google Scholar]
- Nicola SM, Malenka RC. Dopamine depresses excitatory and inhibitory synaptic transmission by distinct mechanisms in the nucleus accumbens. J Neurosci. 1997;17:5697–5710. doi: 10.1523/JNEUROSCI.17-15-05697.1997. [DOI] [PMC free article] [PubMed] [Google Scholar]
- Nicola SM, Surmeier J, Malenka RC. Dopaminergic modulation of neuronal excitability in the striatum and nucleus accumbens. Annu Rev Neurosci. 2000;23:185–215. doi: 10.1146/annurev.neuro.23.1.185. [DOI] [PubMed] [Google Scholar]
- O’Donnell P, Grace AA. Tonic D2-mediated attenuation of cortical excitation in nucleus accumbens neurons recorded in vitro. Brain Res. 1994;634:105–112. doi: 10.1016/0006-8993(94)90263-1. [DOI] [PubMed] [Google Scholar]
- Pan B, Hillard CJ, Liu QS. D2 dopamine receptor activation facilitates endocannabinoid-mediated long-term synaptic depression of GABAergic synaptic transmission in midbrain dopamine neurons via cAMP-protein kinase A signaling. J Neurosci. 2008;28:14018–14030. doi: 10.1523/JNEUROSCI.4035-08.2008. [DOI] [PMC free article] [PubMed] [Google Scholar]
- Pennartz CM, Groenewegen HJ, Lopes da Silva FH. The nucleus accumbens as a complex of functionally distinct neuronal ensembles: an integration of behavioural, electrophysiological and anatomical data. Prog Neurobiol. 1994;42:719–761. doi: 10.1016/0301-0082(94)90025-6. [DOI] [PubMed] [Google Scholar]
- Pickel VM, Chan J, Kearn CS, Mackie K. Targeting dopamine D2 and cannabinoid-1 (CB1) receptors in rat nucleus accumbens. J Comp Neurol. 2006;495:299–313. doi: 10.1002/cne.20881. [DOI] [PMC free article] [PubMed] [Google Scholar]
- Rebec GV. Real-time assessments of dopamine function during behavior: single-unit recording, iontophoresis, and fast-scan cyclic voltammetry in awake, unrestrained rats. Alcohol Clin Exp Res. 1998;22:32–40. doi: 10.1111/j.1530-0277.1998.tb03614.x. [DOI] [PubMed] [Google Scholar]
- Reiner A, Albin RL, Anderson KD, D’Amato CJ, Penney JB, Young AB. Differential loss of striatal projection neurons in Huntington disease. Proc Natl Acad Sci U S A. 1988;85:5733–5737. doi: 10.1073/pnas.85.15.5733. [DOI] [PMC free article] [PubMed] [Google Scholar]
- Sabatini BL, Oertner TG, Svoboda K. The life cycle of Ca2+ ions in dendritic spines. Neuron. 2002;33:439–452. doi: 10.1016/s0896-6273(02)00573-1. [DOI] [PubMed] [Google Scholar]
- Seamans JK, Gorelova N, Durstewitz D, Yang CR. Bidirectional dopamine modulation of GABAergic inhibition in prefrontal cortical pyramidal neurons. J Neurosci. 2001;21:3628–3638. doi: 10.1523/JNEUROSCI.21-10-03628.2001. [DOI] [PMC free article] [PubMed] [Google Scholar]
- Shuen JA, Chen M, Gloss B, Calakos N. Drd1a-tdTomato BAC transgenic mice for simultaneous visualization of medium spiny neurons in the direct and indirect pathways of the basal ganglia. J Neurosci. 2008;28:2681–2685. doi: 10.1523/JNEUROSCI.5492-07.2008. [DOI] [PMC free article] [PubMed] [Google Scholar]
- Sulzer D. How addictive drugs disrupt presynaptic dopamine neurotransmission. Neuron. 2011;69:628–649. doi: 10.1016/j.neuron.2011.02.010. [DOI] [PMC free article] [PubMed] [Google Scholar]
- Testa CM, Friberg IK, Weiss SW, Standaert DG. Immunohistochemical localization of metabotropic glutamate receptors mGluR1a and mGluR2/3 in the rat basal ganglia. J Comp Neurol. 1998;390:5–19. [PubMed] [Google Scholar]
- Van der Kloot W. The regulation of quantal size. Prog Neurobiol. 1991;36:93–130. doi: 10.1016/0301-0082(91)90019-w. [DOI] [PubMed] [Google Scholar]
- Vanhoutte P, Bading H. Opposing roles of synaptic and extrasynaptic NMDA receptors in neuronal calcium signalling and BDNF gene regulation. Curr Opin Neurobiol. 2003;13:366–371. doi: 10.1016/s0959-4388(03)00073-4. [DOI] [PubMed] [Google Scholar]
- Yin HH, Lovinger DM. Frequency-specific and D2 receptor-mediated inhibition of glutamate release by retrograde endocannabinoid signaling. Proc Natl Acad Sci U S A. 2006;103:8251–8256. doi: 10.1073/pnas.0510797103. [DOI] [PMC free article] [PubMed] [Google Scholar]
Associated Data
This section collects any data citations, data availability statements, or supplementary materials included in this article.