

Abstract
Hepatitis B Virus (HBV) cores assemble on viral RNA, which is reverse transcribed within the core to the partially dsDNA genome of mature HBV. However, constraining dsDNA, a stiff polymer, within a core necessarily requires far greater capsid stability than constraining ssRNA. We hypothesized that, unlike ssRNA, dsDNA would be a poor substrate for assembly. We examined titrations of ssDNA and dsDNA with purified HBV core protein, Cp183, by EMSA, EM, DLS, and etheno-DNA fluorescence. Cp183 bound ssDNA with high affinity to form virus-like capsids. However, Cp183 bound dsDNA poorly, forming a mixture of irregular complexes. Nonetheless, we observed some normal cores in dsDNA assembly reactions, indicating that the energy required to bend DNA could be similar to the protein–protein association energy. This similarity of energies suggests that dsDNA stresses mature HBV cores, in agreement with calculation, which may be the basis for the virus maturation signal and DNA release.
Keywords: Hepadnavirus, Spumavirus, Capsid assembly, Self-assembly, Biophysics, RNA-binding, DNA-binding
Introduction
There are different physical requirements for capsids of single and double-stranded nucleic acid spherical viruses. To assemble any capsid, individual subunit–subunit interactions must be relatively weak to avoid kinetically trapping defects or intermediates (Endres and Zlotnick, 2002; Katen et al., 2010). However, one might expect that double-stranded DNA (dsDNA) viruses are more robust. Most viruses that package dsDNA genomes first assemble an empty capsid and then pump in genomic dsDNA through a specific portal (Hendrix and Garcea, 1994; Smith et al., 2001). Viruses that have dsDNA pumped into their capsids post-assembly must withstand substantial internal forces or pressures that these may amount to tens of atmospheres (Evilevitch et al., 2003; Grayson et al., 2006; Purohit et al., 2003), though it has been suggested that dehydration of the DNA may attenuate them (Panja and Molineux, 2010); most of these viruses are stabilized by extensive post-assembly conformational transitions (Aebi et al., 1974; Conway et al., 2001; Fane and Prevelige, 2003; Hendrix and Garcea, 1994; Ross et al., 2006). Exceptionally, SV40, a polyomavirus that normally packages dsDNA compacted by histones, can assemble normal 45 nm capsids on a naked dsDNA substrate (Kimchi-Sarfaty et al., 2002; Mukherjee et al., 2010). Conversely, many viruses that assemble on single-stranded nucleic acid (ssRNA and ssDNA) are actually stabilized by protein–nucleic acid interactions (Bancroft, 1970; Elrad and Hagan, 2010; Johnson et al., 2004). In at least some RNA viruses, the genome prefers a compact fold that is further conducive to assembly (Kuznetsov et al., 2005; Yoffe et al., 2008).
Hepadnaviridae and Spumaviridae both initially package ssRNA pregenomes (a very flexible substrate) and reverse transcribe it to dsDNA within the virion. Thus, for viruses like HBV the physical properties of the nucleic acid change during the virus lifecycle and can affect virus stability. dsDNA is a much stiffer polymer than ssRNA. The flexibility of a filamentous polymer is often described in terms of persistence length (Lp), which is related to the size in solution of a polymer of contour length L by where h is the distance between the ends of the polymer (Grosberg et al., 1994). A polymer much longer than its Lp (e.g. 5Lp) behaves like a flexible chain with no correlation between the directions of its ends. A polymer whose length is much shorter than Lp (e.g. 0.2Lp) behaves like a rigid rod and energy will be required to bend it. The persistence length of a random dsDNA sequence is ~50 nm (about 150 base pairs). Thus the Lp of DNA is twice the inner diameter of an HBV capsid. This leads to the hypothesis that when fragile hepadnavirus capsids, initially stabilized by flexible ssRNA, mature by reverse transcription they achieve a state that is metastable due to the coiled spring of dsDNA. In comparison, the persistence length of ssRNA is an estimated ~0.7 nm (two nucleotides) indicating that, though typical ssRNA molecules are heavily base-paired, the single stranded regions are very flexible.
Hepatitis B Virus (HBV), the hepadnavirus archetype, is a DNA virus with an RNA intermediate (Nassal, 2008; Seeger et al., 2007). In an infected cell, viral RNA is transcribed from nuclear dsDNA, which is associated with viral core protein, though that DNA is not encapsidated (Bock et al., 2001; Levrero et al., 2009). HBV assembly is cytoplasmic and begins when the core protein encapsidates a single-stranded mRNA transcript of the viral genome (the pregenomic or pgRNA) complexed with the viral reverse transcriptase and associated host proteins. This yields an RNA-filled icosahedral core. After assembly, while the core resides in the cytoplasm, the RNA is reverse transcribed and the pgRNA digested to yield the partially double-stranded relaxed circular DNA of infectious HBV. It is only after successful reverse transcription that HBV cores are secreted from cells or are cycled to the nucleus, presumably to maintain infection.
The 183-residue HBV core protein (hereafter referred to as Cp183) can be isolated as a stable homodimer where each subunit is comprised of an assembly domain and a 34-residue RNA-binding C-terminal domain (CTD) (Nassal, 1992). Studies with a purified truncation mutant show that the assembly domain rapidly assembles into empty virus-like particles with predominantly T=4 icosahedral symmetry. The pairwise association energy between subunits is very weak (ca. –3.5 kcal/mol) (Ceres and Zlotnick, 2002; Zlotnick et al., 1999). Studies with purified full-length Cp183 show that it too can assemble into empty particles but also cooperatively binds RNA with high affinity and no specificity (Porterfield et al., 2010). The strong association of Cp183 for RNA is hardly surprising given the +15 charge of the arginine-rich CTD. Paradoxically, at the other end of the viral lifecycle, HBV cores dissociate to release their dsDNA genome into the nucleus. This process may start in the cytoplasm (Guo et al., 2010) and be completed at a nuclear pore (Rabe et al., 2009).
During virion assembly, the core protein has high affinity for RNA. In the process of infection, the same protein apparently has a low affinity for the DNA form of its genome. dsDNA-filled HBV must partially expose internal components of the capsid for (i) intracellular signaling (Yeh et al., 1996) and (ii) digestion of the packaged reverse transcriptase (Guo et al., 2010). Furthermore, after the genome is released in the nucleus, core protein is found associated with host RNA, implying (at least partial) dissociation of the DNA-filled capsid (Rabe et al., 2009). Why should the association constant of Cp183 for different nucleic acids change so dramatically? In this study we examine assembly of Cp183 on ssDNA and dsDNA substrates and show that the ability of HBV to assemble into a virus-like particle is profoundly influenced by the physical properties of the nucleic acid. The difficulties encountered during assembly on dsDNA suggest that the stability of assembled HBV is similarly compromised.
Results
Binding to ssDNA
Our goal is to identify changes in protein–nucleic acid interactions that would be expected to occur during reverse transcription. To expand on our earlier studies with RNA, we first examined binding of full-length HBV core protein, Cp183, to single-stranded DNA. We used two distinct groups of experiments to examine assembly. Electrophoretic Mobility Shift Assays (EMSAs) are sensitive to formation of large complexes. The other binding assay was based on the fluorescence of etheno-DNA, which is sensitive to local protein–DNA interaction. Assembly products were further characterized by transmission electron microscopy (TEM) and dynamic light scattering (DLS). EMSAs also allow direct comparison to our previously published RNA binding experiments which showed Cp183 bound all tested RNAs with high affinity and high cooperativity (Porterfield et al., 2010).
For ssDNA EMSA experiments, we used ssDNA that was about the size of the HBV genomic minus strand, ~3 kb. ssDNA at a concentration of 15 nM in terms of DNA polymer was titrated with Cp183 at various molar ratios of dimers per DNA polymer. DNA migration was monitored by ETBr fluorescence.
Titrating ssDNA with Cp183 led to capsid formation. As the Cp183:ssDNA ratio increased, the EMSA assay showed disappearance of free ssDNA and appearance of a band that co-migrated with control capsid (Fig. 1A). At high Cp183 concentrations, additional bands and smearing were observed. We quantified the loss of free ssDNA and appearance of capsid during the titration by measuring the ETBr fluorescence (Fig. 1B). Up to a ratio of 15:1, fluorescence of the free ssDNA band remained nearly constant. However, by 60:1 Cp183:ssDNA roughly half of the free ssDNA was absent and appeared to shift to a band that had the same relative mobility as RNA-filled capsid (Fig. 1A and B). The free ssDNA band essentially disappeared between 90:1 and 120:1 Cp183:ssDNA. As there are 120 dimers per T=4 capsid, this suggests that there can be one to two ssDNA molecules packaged per capsid. Surprisingly, higher Cp183:ssDNA ratios supershift migration of the DNA-associated fluorescence. At these higher ratios, the fluorescence band becomes progressively more diffuse. This effect suggests that higher Cp183 concentrations either inhibit normal capsid formation or that Cp183 simply aggregates on previously formed virus-like particles.
Fig. 1. Binding of ssDNA by Cp183 dimer.

(A) A representative EMSA of ssDNA titrated with Cp183 dimer at the listed molar ratio of dimer to ssDNA. The overlapping positions of the bands for free and encapsidated DNA are notated on the left of the panel. Lane M is a molecular weight marker; the 3000 nucleotide ssDNA migrates slightly faster than the 1500 bp standard. 0.6% agarose was used for ssDNA gels. (B) A plot of unbound ssDNA from EMSA (squares), quantified with ImageJ (Abramoff et al., 2004), showing the disappearance of free ssDNA as a function of protein concentration. As ssDNA appeared a band that co-migrated with free capsid appeared (circles) and reached a maximum as the Cp183:DNA ratio reached about 90. When the Cp183:ssDNA exceeded 100, the capsid band intensity decreased. (C) Micrographs of negative stained ssDNA filled capsids at ratios of 60:1 (left) and 120:1 (right); the scale bar is 50 nm. Free protein in the background is especially visible in the 120:1 Cp183:ssDNA sample. (D) Size distribution of Cp183-DNA complexes, determined by DLS, increases as the Cp183:ssDNA ratio increases from 30:1 to 60:1 to 90:1 to 120:1; the respective centroids of diameters distributions are 45 nm, 58 nm, 62 nm, and 66 nm. The DLS signal of the lowest Cp183:DNA ratio is dominated by particles with a diameter similar to E. coli-expressed RNA filled capsid.
To ascertain that ssDNA-induced assembly of normal capsids we used negative stain TEM to examine particle morphology and DLS to estimate a weighted average of the particle diameter. By TEM we observed numerous virus-like particles, −35 nm diameter, at ratios of 30, 60, and 120 dimers per ssDNA. Though the free DNA fluorescence had not noticeably diminished at 30 dimers per ssDNA, micrographs showed complete particles. A few disrupted particles are visible in all of the micrographs; these are typical artifacts of TEM sample preparation with HBV (e.g. (Porterfield et al., 2010)). Particularly at higher Cp183:ssDNA ratios, a large amount of free Cp183 dimer and small aggregates of dimer were evident in the background of micrographs. The absence of half capsids, seen with assembly of the much more fragile Cowpea Chlorotic Mottle Virus, suggests that HBV assembly on ssDNA resembles a two-state reaction (as does assembly of empty HBV capsids (Katen and Zlotnick, 2009) and assembly of Cp183 on ssRNA (Porterfield et al., 2010)). Surprisingly, by negative stain TEM, the particles assembled with 60 dimers per ssDNA were slightly larger than those formed at 120 dimers per ssDNA (Fig. 1C). This results suggests that 120-dimer T=4 capsids were preferred at 60 dimer:ssDNA ratio and 90-dimer T=3 particles at 120:1, consistent with a theoretical prediction that smaller capsid geometries are preferred at larger stoichiometric ratios (Zandi and van der Schoot, 2009). Particles formed at 90:1 were a mixture of two sizes. The effect of single stranded nucleic acid on capsid morphology will be investigated in future studies.
DLS was used to describe the bulk state of assembly. DLS estimates of particle size are derived from a diffusion coefficient determined from light scattering fluctuations. Like all light scattering techniques, it is dominated by the largest and most populated species; light scattering intensity is proportional to the weight-averaged molecular weight of all solutes. DLS analysis of the 30:1 dimer to ssDNA sample (Fig. 1D) showed a peak centered at about 30 nm with a mean diameter of 45 nm, suggesting that there was a substantial population of capsids present. Control samples of E. coli-derived RNA-filled capsids had a similar mean diameter by DLS. EMSA (Fig. 1A) indicated the capsid population was relatively small in the 30:1 sample, but clearly they dominated the light scattering signal. The DLS-estimated mean radius increased as the Cp183:ssDNA ratio increased, reaching a maximum mean diameter of 66 nm. The very large diameters and wide peak breadth suggested that some capsids and non-capsid constituents of the solution were aggregating.
The small amount of capsid formed at low Cp183:ssDNA suggested weak binding. However, EMSA detection has limited sensitivity. Therefore, we used fluorescent etheno-DNA to directly examine Cp183 binding of nucleic acid. Etheno-modified ssDNA also eliminates nucleic acid secondary structure that could adversely affect binding. To generate etheno-DNA we used chloroacetaldehyde to modify the same ssDNA used in EMSA titrations. The etheno modification blocks base-pairing potential of adenine and cytosine bases and renders the etheno-adenines fluorescent. Unlike EMSAs, which detect charge and hydrodynamic radius, etheno-DNA fluorescence only detects local changes in the environment of the modified nucleotides and thus reveals even a few interactions per polymer.
Cp183 caused the fluorescence of 6, 12, and 24 nM etheno-DNA polymer to increase about two to 2.5-fold compared to free etheno-DNA (Fig. 2). This increase in etheno-DNA fluorescence has been attributed to extending the nucleotide backbone to relieve self-quenching. Contrary to EMSA experiments, etheno-DNA fluorescence increased almost linearly with protein concentration until the fluorescence change was saturated; a subsequent shallow increase in fluorescence is attributable to protein fluorescence and light scatter (data not shown). We performed equivalent experiments at different etheno-DNA concentrations. These titrations all scaled together (normalizing the protein concentration as the ratio of dimers per polymer and normalizing the fluorescent signal with respect to the concentration of etheno-DNA). The fluorescence increase saturated at about 94 dimers per polynucleotide.
Fig. 2. Binding isotherms monitored by the change in etheno-DNA fluorescence.
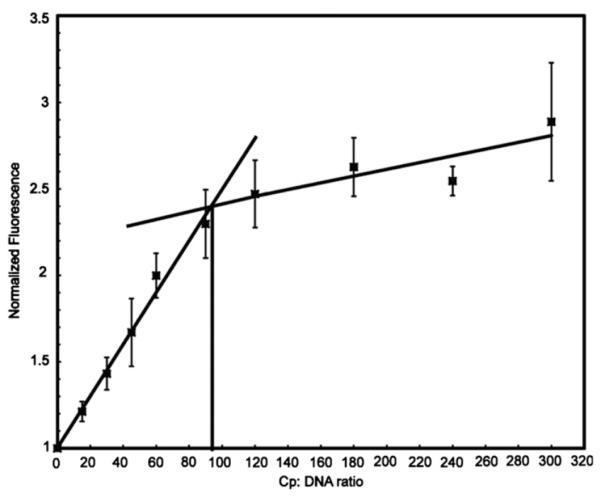
Cp183 was used to titrate three different concentrations of etheno-DNA, 24, 12, and 6 μM nucleotide, corresponding to 8, 4, and 2 nM etheno-DNA polynucleotide. Titrations at each concentration were performed in triplicate. Experiments were normalized with respect to the enhancement of fluorescence and the number of Cp183 dimers per 3000 base polynucleotide. As the normalized titrations over-lapped, they were averaged together. The absence of concentration dependence indicates high affinity binding (Kowalczykowski et al., 1986). Heavy lines are overlaid on the data to show the apparent saturation point at about 94 dimers per DNA. Etheno-DNA fluorescence was monitored by excitation at 350 nm and emission at 410 nm. Error bars for each sample are standard deviations based on three independent experiments based on separate etheno-DNA preparations.
The linear rise followed by saturation suggests that Cp183 bound etheno-DNA with high affinity, a stoichiometric titration as defined by von Hippel and co-workers (McGhee and von Hippel, 1974). The failure of EMSAs to show binding at low Cp183:ssDNA ratios may be due to labile interaction or lower sensitivity of the EMSA assay. Comparison of EMSA and etheno-DNA titrations showed a consistent saturation at about 90 dimers per ssDNA. Similarly, micrographs indicated that Cp183 led to a mixture of 90 dimer T=3 capsids and 120 dimer T=4 capsids (Fig. 1C). Therefore it is likely that these assembly reactions result in a mixture of capsids containing preferably one ssDNA polymer. Interestingly, in titrations of ssRNA by Cp183 we found that T=4 capsids packaged two 3200-nucleotide RNAs if protein was limiting (Porterfield et al., 2010) or one RNA if protein was in excess (Porterfield and Zlotnick, 2010).
Binding to short dsDNA
Like ssRNA, ssDNA can have a complex tertiary structure with many short double-stranded regions; it can be topologically described as a highly branched polymer. Etheno-DNA lacks all secondary structure and is probably best described as a highly flexible linear polymer. By comparison, dsDNA has a 50 nm persistence length, twice the internal diameter of a T=4 HBV capsid and thus a 25 nm length of DNA will behave like a relatively stiff rod. To study the ability of Cp183 to encapsidate dsDNA, we examined dsDNA molecules that were approximately one fifth, one half, and three-fourths the length of the viral genome (i.e. 600, 1600, and 2700 bp, respectively).
The shortest dsDNA tested (600 bp) was about 200 nm long, much longer than the HBV’s diameter. EMSAs of the 600 bp dsDNA titrated with Cp183 had distinct differences from and similarities to ssRNA and ssDNA titrations (Fig. 3A and B). In the dsDNA titration, the concentration of free DNA decreases as judged by ETBr fluorescence. Quantification of fluorescence shows no detectable change at low ratios of Cp183 per DNA, indicating that Cp183 did not bind or had little effect on DNA migration (Fig. 3B). Unlike the EMSA with ssDNA or ssRNA, no unique new band was observed with a similar amount of fluorescence. A well-defined band would suggest a new, well-defined species; its absence suggests heterogeneous assembly. However, with higher Cp183 concentrations, two diffuse bands were observed. One band migrated somewhat faster than an RNA-filled capsid and became progressively slower as the Cp183 concentration was increased. The second band was slower and very broad, some-what slower than a sample of HBV capsids filled with RNA (rightmost lane). This slow diffuse band became stronger as Cp183 was added (a small amount of unidentified ETBr staining material in the DNA control lane also migrated at this position).
Fig. 3. Binding of 600 bp dsDNA by Cp183 dimer to dsDNA polymer.

(A) A representative EMSA of 600 bp dsDNA titrated with Cp183 dimer at the listed molar ratio. The molecular weight standard, lane M, is the same as in Fig. 1. All dsDNA gels used 1% agarose. (B) A plot of unbound 600 bp dsDNA from EMSA, quantified with imageJ (Abramoff et al., 2004), showing its disappearance as a function of protein concentration. In the absence of an analytical function to describe nucleic acid binding visualized by EMSA, straight lines were fit to subsets of data to highlight trends. (C) Negative stained micrographs of 600 bp dsDNA associated with core protein at ratios of 60:1 (left) and 120:1 (right); the scale bar is 50 nm. (D) Size distribution of Cp-DNA complexes, determined by DLS, increases as the Cp183:dsDNA ratio increases from 30:1 to 120:1; the respective centroids of diameters distributions are 83 nm, 78 nm, 91 nm and 89 nm.
Electron micrographs of Cp183 associated with a 600 bp dsDNA show numerous aberrant structures (Fig. 3C). Of the complexes that appear to be single particles, most were larger than the typical 35 nm diameter capsid and few if any were complete circles. Most complexes were distorted spirals or interdigitated half circles. Complexes came in a range of sizes, but most were less than 200 nm in the longest dimension. Micrographs of complexes at Cp183:dsDNA ratios of 60:1 and 120:1 were essentially indistinguishable. Furthermore, images from negative stained micrographs were consistent with DLS, which indicated a weighted average radius of 80 to 90 nm for Cp183:DNA complexes at ratios of 30:1, 60:1, 90:1, and 120:1.
Binding to long dsDNA
A longer dsDNA substrate was also examined in detail. A 1600 bp substrate is about half the length of the HBV genome. A 1600 bp double stranded region appears to be a common pause length in reverse transcription (Lewellyn and Loeb, 2007). EMSAs of titrations of the 1600 bp DNA by Cp183 essentially recapitulate the results shown with the 600 bp substrate (Fig. 4). As the concentration of Cp183 increased, after a phase with no discernable loss of free DNA, the intensity of the free DNA band decreased (Fig. 4B). As with the 600 bp DNA, the amount of fluorescence was not conserved. Free 1600-mer migrates slightly slower than the control capsid. There was no evidence for accumulation of virus like particles. Instead, a new, diffuse, slow migrating band did become evident at a ratio of 1 DNA to 45 dimers. As the concentration of Cp183 increased, this band did become slower, brighter, and more diffuse, suggesting it represented a heterogeneous mixture of complexes. Furthermore, at the highest concentrations of Cp183, a noticeable amount of ETBr fluorescence was retained in the well, indicating a very large complex. Quantitation of the free dsDNA band (Fig. 4B) confirmed the lag phase. The loss of free dsDNA fluorescence covered a broader range of Cp183, but this may reflect the number density of Cp183 dimers bound to a longer piece of dsDNA.
Fig. 4. Binding of 1600 bp dsDNA by Cp183 dimer.

(A) EMSA of 1600 bp dsDNA titrated with Cp183 dimer at the listed molar ratio of dimer to dsDNA polymer. (B) A plot of unbound 1600 bp dsDNA from EMSA, quantified with image J, showing its disappearance as a function of protein concentration. (C) Negative stain micrographs of Cp assembled on a 1600 bp dsDNA associated with core protein at ratios of 60:1 (left) and 120:1 (right); the scale bar is 50 nm. (D) Size distribution of Cp183-dsDNA complexes, determined by DLS, increases as the Cp183:dsDNA ratio increases from 30:1 to 120:1; the respective centroids of diameter distributions are 117 nm, 137 nm, 146 nm, and 155 nm.
TEM and DLS confirmed the EMSA results. TEM showed a heterogeneous mixture of complexes with a small number of individual particles. Some single particles were indeed virus sized (~35 nm). Many of the virus-sized capsids contained a peculiar stain-excluding volume, suggestive of a DNA condensate. Most complexes were comprised of many capsid-fragments. In some cases, these appear to be extended or folded serpentine arrangements of half-capsids. In addition, there were several examples of very large cylindrical structures, 40 to 60 nm in diameter with lengths ranging from about 500 nm, the length of our 1600 bp DNA, to several microns (Fig. 5). DLS indicates that the dominant species, in terms of number and scattering power, are large complexes of capsids and capsid fragments. As the ratio of dimers per dsDNA increases from 30:1 to 120:1, the centroid of the diameter distribution increases monotonically from 117 to 155 nm, consistent with the gradual retardation of the slow migrating band in the EMSAs. The large size and changing size distribution indicates that high concentrations of Cp183 lead to aggregation or non-covalent crosslinking of complexes rather than packaging one or a small number of dsDNA molecules in a virus-like complex. Assembly on a 2700 bp dsDNA substrate, 75% of the length of the HBV genome was also examined with results essentially identical with experiments using the 1600 bp dsDNA.
Fig. 5. Complexes observed at low ratios of Cp183 to dsDNA.
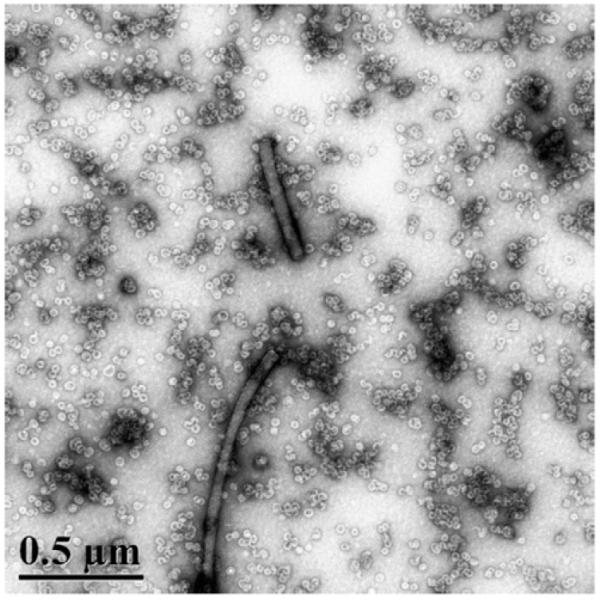
A 1600 bp dsDNA with 60 Cp183 dimers per DNA polymer shows a heterogeneous mixture of assembly products, including cylindrical condensates of 40-60 nm in diameter and up to several microns in length. Numerous capsids and aberrant capsids are present in the background.
Estimation of DNA bending energy
The difficulties of Cp assembly on dsDNA suggest there is an energetic barrier to encapsidating dsDNA. These difficulties imply that the energetic cost for assembling around dsDNA is related, if not equivalent, to the cost of keeping the DNA contained within a capsid. Presumably, this cost causes dsDNA-filled capsids to be less stable than ssDNA- or ssRNA-filled capsids. Therefore, the stability of a DNA-filled capsid (compared to the dissociated compounds) can be represented by
| (1) |
where the terms respectively describe the interaction energies of the capsid (ΔGprotein•protein), protein–DNA contact (ΔGprotein•DNA), DNA–DNA contact (ΔGDNAW•DNA), and the cost of DNA bending (ΔGbend).
Eq. (1) has important implications. Consider the stability of an intact DNA-filled capsid and one that is disrupted but the capsid proteins remain associated with the DNA: to a first approximation, the value for ΔGprotein•DNA will be about the same, however the stabilizing protein-protein interactions are lost as are the destabilizing ΔGDNA•DNA and ΔGbend. Therefore, the stability of an intact DNA-filled capsid is a balance between nGprotein protein and ΔGDNA•DNA + ΔGbend.
As ΔGprotein•protein for empty capsids has been estimated experimentally (Ceres and Zlotnick, 2002; Katen and Zlotnick, 2009), we must determine ΔGDNAW•DNA and ΔGbend to examine how dsDNA could affect an assembled HBV core. For this calculation, the DNA conformation is approximated as a spool of hexagonally packed DNA. The spool outer radius is bounded by the capsid (Rout), the inner radius is R, and the spacing between strands is ds (Eq. (2)). While there is little information about the conformation of DNA inside HBV (reconstructions show only a small fraction of DNA and that density is icosahedrally averaged (Dryden et al., 2002)), the spooled conformation represents one possible energetic minimum. A spool is also consistent with images of DNA inside bacteriophages (Cerritelli et al., 1997;Chang et al., 2006; Petrov et al., 2007). Importantly, the results of our calculation are general and not sensitive to the details of the DNAs conformation (Purohit et al., 2005).
To determine the energy of packaging the DNA it is necessary to find the conformation of the DNA spool (i.e. R and ds) where the total free energy is a minimum. For a given length of DNA (L) and Rout, R and ds are directly related by the spool geometry (Eq. (2), Methods); as ds is increased the inner radius necessarily becomes smaller. Thus increasing ds makes ΔGDNA•DNA smaller and less destabilizing while the smaller R increases ΔGbend. Equivalent methods for estimating encapsidation free energy have been proposed (Purohit et al., 2003; Tzlil et al., 2003). To optimize DNA geometry, we follow the formalism of Purohit et al. to estimate DNA bending energy (ΔGbend) and DNA–DNA repulsion (ΔGDNA•DNA), equations (3) and (4), respectively (Purohit et al., 2005). The DNA-DNA repulsion is empirically parameterized based on a strand–strand force parameter (F0) ((Rau and Parsegian, 1992) see methods); we typically use F0 2.3 × 10⁵ pN/nm2, consistent with empirical measurements of DNA packaging in bacteriophage phi29 (Purohit et al., 2005); HBV and phi29 have similar fractions of their internal volume packed with dsDNA (Purohit et al., 2005). We add a third term accounting for the protein–DNA interaction (ΔGprotein•DNA). Thus, the optimal inter-strand spacing ds is determined by minimizing the total encapsidation free energy, ΔGtot=ΔGbend+ΔGDNA•DNAΔGprotein•DNA (see Methods).
These calculations show that DNA bending and DNA-DNA repulsion make large disruptive contributions to the stability of DNA-filled cores. First, the optimal values of ds are shown as a function of capsid charge density, σ in Fig. 6A. For the charge density corresponding to fully charged Cp183 CTDs (σ=1.83 charges/nm2) we obtain ds=2.89 nm (Fig. 6A), which corresponds to a spool inner radius of R=2.05 nm. The calculated bending and DNA-DNA interaction free energies are then ΔGbend=507 kcal/mol (818 kBT) and ΔGDNA•DNA=1218 kcal/mol (Fig. 6C). The large value of ΔGbend reflects that fact that the DNA in the center of the spool is very strained; however larger values of R are disfavored by the interaction energy ΔGDNA•DNA. We find that these optimal values depend only weakly on the strength of the protein–DNA interaction, justifying the simplified description used in the calculation. At F0=2.3 × 10⁵ pN/nm2, the sum ΔGbend+ΔGDNA•DNA is constant with respect to σ (Fig. 6B nearly ). At a smaller value of F0, as might be found at high ionic strength, the optimal inter-strand spacing is more sensitive to surface charge (Fig. 6A) but the qualitative conclusion that bending and DNA-DNA interaction are substantial and destabilizing remains the same: DNA is a relatively stiff polymer that has the potential to distort a capsid.
Fig. 6. Bending energy for dsDNA in an HBV core.

(A) Theoretical prediction for the dsDNA interstrand spacing ds, calculated from Eqs. (2)–(4) and Eq. (6) as a function of the C-termini charge density, σ. The last point in each curve corresponds to the charge density for Cp183. Calculated values are shown for the empirically estimated value of F0=2.3 × 10⁵ pN/nm2 (Purohit, Kondev, and Phillips, 2003) with blue circles; for comparison, the predicted inter-strand spacing values are shown for a smaller interaction energy F0=1 × 10⁵ pN/nm2 with red x symbols. (B) Calculated values of the destabilization energy (ΔGbend+ΔGDNA•DNA), (Eqs. (2) and (3)) for F0=2.3 × 10⁵ pN/nm2 (blue circles) and F0=1 × 10⁵ pN/nm2 (red × symbols). Greater values for ds are prevented due to packing constraints. (C) The bending energy ΔGbend (red + symbols) and the interaction energy ΔGDNA•DNA (blue circles) are shown as a function of ds for charge density σ 1.83 charges/nm2. (For interpretation of the references to colour in this figure legend, the reader is referred to the web version of this article.).
We also examined a more complicated version of the model that separately considered inter-strand spacings for the layer next to the capsid surface and within the interior of the capsid. The predicted bending and interaction energies are qualitatively similar to those of the simpler single parameter model discussed above.
Discussion
In vivo, HBV cores assemble on pregenomic ssRNA. But as that RNA pregenome is reverse transcribed within the capsid, the capsid must be able to accommodate and restrain first ssDNA and then dsDNA (Seeger et al., 2007). In vitro we observed that HBV Cp assembles aggressively on ssRNA (Porterfield et al., 2010) and ssDNA (Figs. 1 and 2), but does not assemble well on a dsDNA substrate (Figs. 3 and 4). HBV has evolved a strategy of assembling on a flexible but noninfectious precursor. RNA-filled HBV particles, either from E. coli or assembled in vitro, are tremendously stable due to the mixture of protein–protein and protein–RNA interactions, under conditions where empty capsids are marginally stable (Porterfield et al., 2010). Failure of HBV to efficiently assemble on dsDNA (dsDNA-filled particles were not detectable by bulk measurements though a few were evident in EM (Figs. 3–5)) suggested that the bending energy of the nucleic acid is similar to the average interaction free energy of an incoming core protein dimer for the growing capsid.
We anticipated that ssDNA-binding would resemble ssRNA-binding, which exhibits high affinity and high cooperativity (Porterfield et al., 2010). Indeed, TEM showed only complete capsids whereas partial capsids would be expected with low cooperativity binding, as observed in titrations of RNA by Cowpea Chlorotic Mottle Virus (CCMV) (Johnson et al., 2004). EMSA titrations of ssDNA resulted in a bimodal distribution of free and bound DNA, diagnostic for cooperative binding (compare Figs. 1–5 in reference (Porterfield et al., 2010)). Solution experiments with etheno-DNA unambiguously indicated that Cp183 has a high affinity for ssDNA (Fig. 2). The linear increase in fluorescence up to the point of saturation is characteristic of stoichiometric binding (Kowalczykowski et al., 1986; McGhee and von Hippel, 1974), which is to say that added protein bound quantitatively and cooperatively to ssDNA.
Unlike ssRNA and ssDNA, dsDNA did not support assembly of uniform HBV capsids. Assembly products were pleiomorphic. The most common products of reaction of Cp183 with a dsDNA substrate, based on EMSA, DLS, and TEM, were strings of capsid fragments (Figs. 3–5). In dsDNA reactions, capsids with apparently normal morphology were relatively rare species, visualized in micrographs but not identifiable by EMSA. We also observed DNA condensates, very large cylindrical nucleoprotein complexes greater in diameter than a capsid and up to several microns long (Fig. 5). The heterogeneity of assembly products is likely to have a kinetic basis; each of the three states (capsids, aberrant complexes, and DNA condensates) represents an energy minimum too stable to dissociate in favor of the supramolecular complex(es) at the global minimum.
The comparison between capsid stability and the energy of packaged dsDNA (ΔGbend+ΔGDNA•DNA) suggests that dsDNA may drastically affect capsid behavior. Capsid protein interaction energy (from assembly studies) sums to approximately –740 kcal/mol per capsid (Ceres and Zlotnick, 2002); this value includes only the contributions of the assembly domain. DNA bending requires an estimated +507 kcal/mol (Fig. 6B) while DNA–DNA interaction is + 1218 kcal/mol. Even taking the calculated values as crude over-estimates, it is clear that packaging DNA is destabilizing, perhaps to the point that capsids are metastable and only persist due to hysteresis (Hagan and Chandler, 2006; Singh and Zlotnick, 2003). Of course there is a strong electrostatic attraction between Cp183 and DNA, but this will be present whether the protein is an assembled capsid or a poorly organized network of dimers. The analogy to a jack-in-the-box seems appropriate: the difficulty in assembly, the perturbation of capsid stability, and the apparent similarity between association energy and DNA bending leads to the speculation that capsid strain from packaged dsDNA, particularly if distributed unevenly, can act as a coiled spring to facilitate virus uncoating.
These in vitro studies also provide insight to the process of assembly. The strings of partial capsids call to mind coarsegrained molecular dynamics simulations of polymer packaging during virus assembly (Elrad and Hagan, 2010). The simulations were able to generate linked polymers of partial capsids, resembling the micrographs in Figs. 3–5 when (i) strong subunit–subunit interactions were combined with high subunit concentrations leading to multiple nucleation events on a single polymer or (ii) when the polymer molecule was too long to be packaged. Oligomers of capsids were also generated when CCMV capsid protein was assembled on RNA much longer than a normal genome. The CCMV complexes, assembled on a much more flexible substrate, appeared as pairs and trios of morphologically normal capsids (Cadena-Nava et al., 2012). In these previous investigations the length of the polymer impeded formation of capsids. Here we see that a stiff polymer can have a similar effect on assembly.
Cylindrical DNA condensates induced by HBV Cp183 (Fig. 5) are most common when there is excess DNA, ≤60 capsid protein dimers:DNA. Very similar complexes were also observed at low protein:DNA ratios with CCMV (Mukherjee et al., 2006) and SV40 (Mukherjee et al., 2010). Cylindrical DNA condensates of this sort suggest a roughly parallel arrangement of DNA molecules (Bloomfield, 1996) reminiscent of DNA condensates formed in solution by polyvalent cations and within bacteriophages (with or without added cations) (Black et al., 1985; Cerritelli et al., 1997;Fujiyoshi et al., 1982; Hud and Downing, 2001; Tang et al., 2011).
HBV is a DNA virus with an RNA intermediate. ssRNA is demonstrably an excellent substrate for assembly (Porterfield et al., 2010); here we show that dsDNA is not. Capsid assembly is most successful when intersubunit contacts are weak (Katen et al., 2010), whereas relatively substantial interactions are needed to constrain dsDNA—a rationale for why the lifecycles of most dsDNA viruses depend on pumping dsDNA into preformed, maturation-stabilized capsids (Conway et al., 2001; Fane and Prevelige, 2003; Ross et al., 2006).
Our observations may explain why free Cp183 does not assemble on DNA. This is an important point because nuclear Cp183 is localized to the episomal dsDNA form of the HBV genome, where it alters histone spacing, indicating a biological role for core protein-host protein–DNA interaction (Bock et al., 2001; Levrero et al., 2009).
In the context of the virion, the bending energy of packaged dsDNA may destabilize capsids to the degree that a kinetic barrier to dissociation is all that prevents them from dissociating (Hagan and Chandler, 2006; Singh and Zlotnick, 2003). At the very least, internal strain may affect capsid breathing (Hilmer et al., 2008). Breathing may also increase accessibility of the internal reverse transcriptase to external proteases (Guo et al., 2007). The concept of internal strain in HBV leads to the very attractive hypothesis that DNA formation modulates capsid stability and frees a subset of CTDs from tight interaction with the viral genome. CTDs incorporate signals for intracellular trafficking (Kann et al., 2007; Liao and Ou, 1995); this reorganization of the genome would allow CTDs to be transiently exposed (due to breathing or by protruding through holes perforating the HBV surface (Chen et al., 2011)) to advance a HBV core to the next stages in the viral lifecycle.
Materials and methods
Nucleic acids
A 3000 nucleotide M13-derived ssDNA was produced from pBluescript II SK+ with VCS M13 helper phage virus (both from Stratagene). As per the manufacturer’s directions, XL1-Blue MRF E coli were transformed with pBluescript II and infected with helper phage. This culture was used to inoculate 25 ml of 2XYT media containing 75 μg/ml ampicillin and 70 μg/ml kanamycin and grown for 24 h. After cells were sedimented by centrifugation at 20,000 × g for 10 min, phage and phagemid particles were precipitated by addition of 1/5 volume of 20% PEG8000, 1 M NaCl, for 15 min on ice. Phage was sedimented at 20,000 g for 10 min, resuspended in 600 μl of TE buffer (10 mM Tris pH 8 and 1 mM EDTA pH 8.0), and then digested by additions of 15 μl of 0.1 mg/ml proteinase K in TE pH 8.0 and 15 μl of 20% SDS and incubated at 65 °C for 15 min. Digested protein was precipitated by addition of 60 μl of 5 M potassium acetate on ice for 10 min followed by centrifugation for 15 min at 8000 × g. ssDNA was then ethanol precipitated from the supernatant. The ssDNA concentration was determined by absorbance using an extinction coefficient of ε260=8700 (M cm)−1 per nucleotide. For dsDNA, ε260=7000 (M cm)−1.
Fluorescent etheno-DNA was prepared from ssDNA as described previously (Zlotnick et al., 1993). Briefly, 0.4 mM ssDNA (as nucleotide) in 50 mM NaOAc pH 5.5, 1 mM EDTA was mixed with 1/6 volume of chloroacetaldehyde for 90 min at 45 °C. The reaction was quenched by adding 1/3 volume of 1.5 M Tris pH 8.8. Using an Amicon ultra 30 K centrifugal filter, the sample was concentrated as needed and washed 4 times with 2 ml of 20 mM Tris HCl pH 7.0 to remove the chloroacetaldehyde. The UV absorbance was measured at 245 nm, 260 nm, 270 nm, 280 nm and 290 nm. The sample was characterized by measuring the absorbance ratios of A260/245=1.25, A260/270 1.06, A260/280=1.3, A260/290 2.1. The etheno-DNA concentration was determined using an extinction coefficient of ε260=7000 (M cm)−1 per nucleotide.
The 1600 bp and 600 bp dsDNA were produced from plasmid DNA by PCR using appropriate 5′ and 3′ primers. After the PCR amplification the DNA was purified by extraction from a 1% agarose gel using a Qiagen QIAquick Gel Extraction kit.
Preparation and assembly of Cp183
Dimeric, full-length HBV core protein, Cp183, was prepared as previously described (Porterfield et al., 2010) except that the buffer used for disassembly was 1.5 M guanidine HCl, 1.5 M LiCl, 50 mM Tris pH 7.5, 10 mM DTT and the buffer used for column chromatography was 1.5 M guanidine HCl, 0.5 M LiCl, 50 mM Tris pH 7.5. Cp183 concentration was determined by absorbance using an ε280=60,900 (M cm)−1 per dimer.
Binding assays
For electrophoretic mobility shift assays (EMSAs), Cp183 dimer was added to 150 ng of dsDNA or ssDNA; this yielded similar fluorescence in all experiments. In each reaction, the final conditions were 375 mM guanidine HCl, 125 mM LiCl, 32.5 mM HEPES pH 7.5. Under these conditions, reassembly on RNA was quantitative at 4 °C and 20 °C (Porterfield et al., 2010). DNA standards and E. coli-derived Cp183 capsids were adjusted to these buffer conditions. After 15 min incubation on ice, the samples were loaded into 0.6% or 1% agarose gels in Tris-acetate-EDTA (TAE) with 0.0001% ethidium bromide (ETBr) in both gel and running buffer. ETBr improved separation of free DNA from DNA associated into capsids DNA gels were run at constant voltage (80 V for dsDNA, 70 V for ssDNA) for 1.5 to 2 h.
Binding to etheno-DNA was measured by the protein-induced increase in fluorescence. The assembly reactions were set up with the etheno-DNA concentrations of 24 nM, 12 nM and 6 nM. The etheno-DNA concentration was kept constant in each set of reactions. The Cp 183 dimer protein concentration was adjusted in order to get the dimer to etheno-DNA ratios of 0, 15, 30, 45, 60, 90, 120, 180, 240, and 300. The reactions were incubated on ice for 15 min and 60 μl of the product was used to measure the fluorescence. The fluorescence was measured with a Photon Technology International fluorometer with monochromators set at 310 nm for excitation and 410 nm for emission. All measurements were made at room temperature and using a black masked quartz microcuvette with 0.3 cm path length (Hellma). All experiments were repeated four times on four different days. Samples for Dynamic Light Scattering (DLS) were prepared as for EMSA and kept at 4 °C. DLS was measured using a Malvern Zetasizer.
Electron microscopy
Samples for EMSA were also used for electron microscopy. Capsid samples were applied to glow-discharged, carbon-coated copper grids (EMS) and immediately blotted. Grids were negatively stained with 2% uranyl acetate for 25 s and then blotted dry. Images were obtained at a nominal magnification of ×50,000 using a JEOL JEM-1010 transmission electron microscope and recorded using a Gatan 4 K X 4 K CCD camera.
Calculations
For the 3200 bp HBV genome the contour length L of the confined DNA is 1090 nm, assuming 0.34 nm per base pair. For the spool geometry we consider (see the main text), the value of the inner radius R is then calculated as a function of inter-strand center–center distance, ds, and L according to (Purohit et al., 2003)
| (2) |
where the outer radius is the internal radius of the HBV capsid Rout=12.5 nm and R is the inner radius of the spool. The elastic (bending) energy ΔGbend is given by
| (3) |
where Lp=50 nm is the persistence length of DNA, kB is Boltzmann’s constant, equivalent to the molar gas constant of 1.987 cal deg−1, and the physiologically relevant temperature for HBV, T, is 310 K.
The DNA–DNA interaction energy is calculated assuming a spool of DNA where the strands are hexagonally packed. The DNA–DNA interaction potential for hexagonal arrays was measured as a function of inter-strand spacing (Rau et al., 1984; Rau and Parsegian, 1992). The total DNA–DNA interaction energy for the spool can be calculated from this empirical potential by Eq. (3) (Purohit et al., 2005; Purohit et al., 2003)
| (4) |
where the decay length c is roughly constant over varying conditions but the interstrand force, F0, depends on salt concentration and ion type, especially at large values of ds (Purohit et al., 2003;Rau and Parsegian, 1992). We use c=0.27 nm (Rau and Parsegian, 1992) and F0=2.3 × 10⁵ pN/nm2, which led to the best fit between the theory and forces in bacteriophages (Purohit et al., 2003).
Finally, we account for screened electrostatic interactions between charges on the DNA and HBV core protein C-termini under the following approximations. The charges on the Cp183 C-termini are represented as a uniform charge density σ smeared on the inner surface of the capsid, and the charge on the DNA as a uniform density ρDNA within the region occupied by DNA. We calculate the free energy ΔGprotein•DNA due to electrostatic interactions and entropy of counterions using the linearized Poisson Boltzmann equation. Thus, counterion osmotic pressure effects are included empirically in the DNA•DNA energy and theoretically in the protein•DNA contact energy. We simplify the calculation by treating ρDNA as spherically symmetric and noting that Routb⪢ λD where λD=1 nm is the Debye length. The DNA–DNA interaction free energy has already been accounted for in GDNA•DNA, and interactions among the charges on the C-termini are included in the capsid protein–protein interaction free energy. Thus we isolate the interaction free energy due to DNA C-termini interactions as
| (5) |
This yields
| (6) |
where lB=0.7 nm is the Bjerrum length at which the electrostatic energy between two monovalent ions in water is kBT, NDNA=6400 is the number of charges on the DNA, and the C-termini surface charge density is σ=1.83 charges/nm2 assuming 15 positive charges per C-terminus.
Acknowledgments
We wish to thank Drs Chao Chen, J. Zachary Porterfield, David Nickens, and Sarah Katen for critical discussions. Electron microscopy was performed at the IU molecular biology institute; dynamic light scattering experiments were performed at the IU Physical Biochemistry Instrumentation Facility. MSD, JC-YW, and AZ were supported by NIH R01-AI077688 to AZ; MFH was supported by NIH R01-AI080791 and Burroughs-Wellcome Fund 2012 Collaborative Research Travel Grant.
References
- Abramoff MD, Magelhaes PJ, Ram SJ. Image processing with imagej. Biophoton. Int. 2004;11:36–42. [Google Scholar]
- Aebi U, Bijlenga R.,v.,B., Eiserling F, Kellenberger C, Kellenberger E, Mesyanzhinov V, Müller L, Showe M, Smith R, Steven A. The transformation of tau particles into T4 heads. II. Transformations of the surface lattice and related observations on form determination. J. Supramol. Struct. 1974;2:253–275. doi: 10.1002/jss.400020218. [DOI] [PubMed] [Google Scholar]
- Bancroft JB. The self-assembly of spherical plant viruses. Adv. Virus Res. 1970;16:99–134. doi: 10.1016/s0065-3527(08)60022-6. [DOI] [PubMed] [Google Scholar]
- Black LW, Newcomb WW, Boring JW, Brown JC. Ion etching bacteriophage T4: support for a spiral-fold model of packaged DNA. Proc. Natl. Acad. Sci. USA. 1985;82:7960–7964. doi: 10.1073/pnas.82.23.7960. [DOI] [PMC free article] [PubMed] [Google Scholar]
- Bloomfield VA. DNA condensation. Curr. Opin. Struct. Biol. 1996;6(3):334–341. doi: 10.1016/s0959-440x(96)80052-2. [DOI] [PubMed] [Google Scholar]
- Bock CT, Schwinn S, Locarnini S, Fyfe J, Manns MP, Trautwein C, Zentgraf H. Structural organization of the hepatitis B virus minichromosome. J. Mol. Biol. 2001;307(1):183–196. doi: 10.1006/jmbi.2000.4481. [DOI] [PubMed] [Google Scholar]
- Cadena-Nava RD, Comas-Garcia M, Garmann RF, Rao AL, Knobler CM, Gelbart WM. Self-assembly of viral capsid protein and RNA molecules of different sizes: requirement for a specific high protein/RNA mass ratio. J. Virol. 2012;86(6):3318–3326. doi: 10.1128/JVI.06566-11. [DOI] [PMC free article] [PubMed] [Google Scholar]
- Ceres P, Zlotnick A. Weak protein–protein interactions are sufficient to drive assembly of hepatitis B virus capsids. Biochemistry. 2002;41(39):11525–11531. doi: 10.1021/bi0261645. [DOI] [PubMed] [Google Scholar]
- Cerritelli ME, Cheng N, Rosenberg AH, McPherson CE, Booy FP, Steven AC. Encapsidated conformation of bacteriophage T7 DNA. Cell. 1997;91(2):271–280. doi: 10.1016/s0092-8674(00)80409-2. [DOI] [PubMed] [Google Scholar]
- Chang J, Weigele P, King J, Chiu W, Jiang W. Cryo-EM asymmetric reconstruction of bacteriophage P22 reveals organization of its DNA packaging and infecting machinery. Structure. 2006;14(6):1073–1082. doi: 10.1016/j.str.2006.05.007. [DOI] [PubMed] [Google Scholar]
- Chen C, Wang JC-Y, Zlotnick A. A kinase chaperones Hepatitis B Virus capsid assembly and captures capsid dynamics. PLoS Pathog. 2011;7(11):e1002388. doi: 10.1371/journal.ppat.1002388. [DOI] [PMC free article] [PubMed] [Google Scholar]
- Conway JF, Wikoff WR, Cheng N, Duda RL, Hendrix RW, Johnson JE, Steven AC. Virus maturation involving large subunit rotations and local refolding. Science. 2001;292(5517):744–748. doi: 10.1126/science.1058069. [DOI] [PubMed] [Google Scholar]
- Dryden K, Wieland S, Chisari F, Yeager M. American Society for Virology 21st Annual Meeting; Lexington, Ke. 2002. [Google Scholar]
- Elrad OM, Hagan MF. Encapsulation of a polymer by an icosahedral virus. Phys. Biol. 2010;7(4):045003. doi: 10.1088/1478-3975/7/4/045003. [DOI] [PMC free article] [PubMed] [Google Scholar]
- Endres D, Zlotnick A. Model-based analysis of assembly kinetics for virus capsids or other spherical polymers. Biophys. J. 2002;83:1217–1230. doi: 10.1016/S0006-3495(02)75245-4. [DOI] [PMC free article] [PubMed] [Google Scholar]
- Evilevitch A, Lavelle L, Knobler CM, Raspaud E, Gelbart WM. Osmotic pressure inhibition of DNA ejection from phage. Proc. Natl. Acad. Sci. USA. 2003;100(16):9292–9295. doi: 10.1073/pnas.1233721100. [DOI] [PMC free article] [PubMed] [Google Scholar]
- Fane BA, Prevelige PE., Jr. Mechanism of scaffolding-assisted viral assembly. In: Chiu W, Johnson JE, editors. Virus Structure. vol. 64. Academic Press; San Diego: 2003. pp. 259–299. [DOI] [PubMed] [Google Scholar]
- Fujiyoshi Y, Yamagishi H, Kunisada T, Sugisaki H, Kobayashi T, Uyeda N. Visualization of the DNA thread packing within bacteriophage T4 heads. J. Ultrastruct. Res. 1982;79:235–240. doi: 10.1016/s0022-5320(82)90034-x. [DOI] [PubMed] [Google Scholar]
- Grayson P, Evilevitch A, Inamdar MM, Purohit PK, Gelbart WM, Knobler CM, Phillips R. The effect of genome length on ejection forces in bacteriophage lambda. Virology. 2006;348(2):430–436. doi: 10.1016/j.virol.2006.01.003. [DOI] [PMC free article] [PubMed] [Google Scholar]
- Grosberg A, Izrailev S, Nechaev S. Phase transition in a heteropolymer chain at a selective interface. Phys. Rev. E, Stat. Phys. Plasmas Fluids Related Interdisc. topics. 1994;50(3):1912–1921. doi: 10.1103/physreve.50.1912. [DOI] [PubMed] [Google Scholar]
- Guo H, Jiang D, Zhou T, Cuconati A, Block TM, Guo JT. Characterization of the intracellular deproteinized relaxed circular DNA of hepatitis B virus: an intermediate of covalently closed circular DNA formation. J. Virol. 2007;81(22):12472–12484. doi: 10.1128/JVI.01123-07. [DOI] [PMC free article] [PubMed] [Google Scholar]
- Guo H, Mao R, Block TM, Guo JT. Production and function of the cytoplasmic deproteinized relaxed circular DNA of hepadnaviruses. J. Virol. 2010;84(1):387–396. doi: 10.1128/JVI.01921-09. [DOI] [PMC free article] [PubMed] [Google Scholar]
- Hagan MF, Chandler D. Dynamic pathways for viral capsid assembly. Biophys. J. 2006;91(1):42–54. doi: 10.1529/biophysj.105.076851. [DOI] [PMC free article] [PubMed] [Google Scholar]
- Hendrix RW, Garcea RL. Capsid assembly of dsDNA viruses. Sem.Virol. 1994;5:15–26. [Google Scholar]
- Hilmer JK, Zlotnick A, Bothner B. Conformational equilibria and rates of localized motion within Hepatitis B virus capsids. J. Mol. Biol. 2008;375:581–594. doi: 10.1016/j.jmb.2007.10.044. [DOI] [PMC free article] [PubMed] [Google Scholar]
- Hud NV, Downing KH. Cryoelectron microscopy of lambda phage DNA condensates in vitreous ice: the fine structure of DNA toroids. Proc. Natl. Acad. Sci. USA. 2001;98(26):14925–14930. doi: 10.1073/pnas.261560398. [DOI] [PMC free article] [PubMed] [Google Scholar]
- Johnson JM, Willits D, Young MJ, Zlotnick A. Interaction with capsid protein alters RNA structure and the pathway for in vitro assembly of Cowpea Chlorotic Mottle Virus. J. Mol. Biol. 2004;335:455–464. doi: 10.1016/j.jmb.2003.10.059. [DOI] [PubMed] [Google Scholar]
- Kann M, Schmitz A, Rabe B. Intracellular transport of hepatitis B virus. World J. Gastroenterol. 2007;13(1):39–47. doi: 10.3748/wjg.v13.i1.39. [DOI] [PMC free article] [PubMed] [Google Scholar]
- Katen SP, Chirapu SR, Finn MG, Zlotnick A. Trapping of Hepatitis B Virus capsid assembly intermediates by phenylpropenamide assembly accelerators. ACS Chem. Biol. 2010;5:1125–1136. doi: 10.1021/cb100275b. [DOI] [PMC free article] [PubMed] [Google Scholar]
- Katen SP, Zlotnick A. Thermodynamics of virus capsid assembly. Methods Enzymol. 2009;455:395–417. doi: 10.1016/S0076-6879(08)04214-6. [DOI] [PMC free article] [PubMed] [Google Scholar]
- Kimchi-Sarfaty C, Ben-Nun-Shaul O, Rund D, Oppenheim A, Gottesman MM. In vitro-packaged SV40 pseudovirions as highly efficient vectors for gene transfer. Hum. Gene Ther. 2002;13(2):299–310. doi: 10.1089/10430340252769815. [DOI] [PubMed] [Google Scholar]
- Kowalczykowski SC, Paul LS, Lonberg N, Newport JW, McSwiggen JA, von Hippel PH. Cooperative and noncooperative binding of protein ligands to nucleic acid lattices: experimental approaches to the determination of thermodynamic parameters. Biochemistry. 1986;25(6):1226–1240. doi: 10.1021/bi00354a006. [DOI] [PubMed] [Google Scholar]
- Kuznetsov YG, Daijogo S, Zhou J, Semler BL, McPherson A. Atomic force microscopy analysis of icosahedral virus RNA. J. Mol. Biol. 2005;347(1):41–52. doi: 10.1016/j.jmb.2005.01.006. [DOI] [PubMed] [Google Scholar]
- Levrero M, Pollicino T, Petersen J, Belloni L, Raimondo G, Dandri M. Control of cccDNA function in hepatitis B virus infection. J. Hepatol. 2009;51(3):581–592. doi: 10.1016/j.jhep.2009.05.022. [DOI] [PubMed] [Google Scholar]
- Lewellyn EB, Loeb DD. Base pairing between cis-acting sequences contributes to template switching during plus-strand DNA synthesis in human hepatitis B virus. J. Virol. 2007;81(12):6207–6215. doi: 10.1128/JVI.00210-07. [DOI] [PMC free article] [PubMed] [Google Scholar]
- Liao W, Ou JH. Phosphorylation and nuclear localization of the hepatitis B virus core protein: significance of serine in the three repeated SPRRR motifs. J. Virol. 1995;69(2):1025–1029. doi: 10.1128/jvi.69.2.1025-1029.1995. [DOI] [PMC free article] [PubMed] [Google Scholar]
- McGhee JD, von Hippel PH. Theoretical aspects of DNA–protein interactions: cooperative and non-cooperative binding of large ligands to a one dimensional homogeneous lattice. J. Mol. Biol. 1974;86:469–489. doi: 10.1016/0022-2836(74)90031-x. [DOI] [PubMed] [Google Scholar]
- Mukherjee S, Kler S, Oppenheim A, Zlotnick A. Uncatalyzed assembly of spherical particles from SV40 VP1 pentamers and linear dsDNA incorporates both low and high cooperativity elements. Virology. 2010 doi: 10.1016/j.virol.2009.10.050. [DOI] [PubMed] [Google Scholar]
- Mukherjee S, Pfeifer CM, Johnson JM, Liu J, Zlotnick A. Redirecting the coat protein of a spherical virus to assemble into tubular nanostructures. J. Am. Chem. Soc. 2006;128(8):2538–2539. doi: 10.1021/ja056656f. [DOI] [PubMed] [Google Scholar]
- Nassal M. The arginine-rich domain of the hepatitis B virus core protein is required for pregenome encapsidation and productive viral positive-strand DNA synthesis but not for virus assembly. J. Virol. 1992;66:4107–4116. doi: 10.1128/jvi.66.7.4107-4116.1992. [DOI] [PMC free article] [PubMed] [Google Scholar]
- Nassal M. Hepatitis B viruses: reverse transcription a different way. Virus Res. 2008;134(1–2):235–249. doi: 10.1016/j.virusres.2007.12.024. [DOI] [PubMed] [Google Scholar]
- Panja D, Molineux IJ. Dynamics of bacteriophage genome ejection in vitro and in vivo. Phys. Biol. 2010;7(4):045006. doi: 10.1088/1478-3975/7/4/045006. [DOI] [PubMed] [Google Scholar]
- Petrov AS, Boz MB, Harvey SC. The conformation of double-stranded DNA inside bacteriophages depends on capsid size and shape. J. Struct. Biol. 2007;160(2):241–248. doi: 10.1016/j.jsb.2007.08.012. [DOI] [PMC free article] [PubMed] [Google Scholar]
- Porterfield JZ, Dhason MS, Loeb DD, Nassal M, Stray SJ, Zlotnick A. Full-length HBV core protein packages viral and heterologous RNA with similar high cooperativity. J. Virol. 2010;84:7174–7184. doi: 10.1128/JVI.00586-10. [DOI] [PMC free article] [PubMed] [Google Scholar]
- Porterfield JZ, Zlotnick A. A simple and general method for determining the protein and nucleic acid content of viruses by UV absorbance. Virology. 2010;407:281–288. doi: 10.1016/j.virol.2010.08.015. [DOI] [PMC free article] [PubMed] [Google Scholar]
- Purohit PK, Inamdar MM, Grayson PD, Squires TM, Kondev J, Phillips R. Forces during bacteriophage DNA packaging and ejection. Biophys. J. 2005;88(2):851–866. doi: 10.1529/biophysj.104.047134. [DOI] [PMC free article] [PubMed] [Google Scholar]
- Purohit PK, Kondev J, Phillips R. Mechanics of DNA packaging in viruses. Proc. Natl. Acad. Sci. USA. 2003;100(6):3173–3178. doi: 10.1073/pnas.0737893100. [DOI] [PMC free article] [PubMed] [Google Scholar]
- Rabe B, Delaleau M, Bischof A, Foss M, Sominskaya I, Pumpens P, Cazenave C, Castroviejo M, Kann M. Nuclear entry of hepatitis B virus capsids involves disintegration to protein dimers followed by nuclear reassociation to capsids. PLoS Pathog. 2009;5(8):e1000563. doi: 10.1371/journal.ppat.1000563. [DOI] [PMC free article] [PubMed] [Google Scholar]
- Rau DC, Lee B, Parsegian VA. Measurement of the repulsive force between polyelectrolyte molecules in ionic solution: hydration forces between parallel DNA double helices. Proc. Natl. Acad. Sci. USA. 1984;81:2621–2625. doi: 10.1073/pnas.81.9.2621. [DOI] [PMC free article] [PubMed] [Google Scholar]
- Rau DC, Parsegian VA. Direct measurement of the intermolecular forces between counterion condensed dna double helices. Biophys. J. 1992;61:246–259. doi: 10.1016/S0006-3495(92)81831-3. [DOI] [PMC free article] [PubMed] [Google Scholar]
- Ross PD, Conway JF, Cheng N, Dierkes L, Firek BA, Hendrix RW, Steven AC, Duda RL. A free energy cascade with locks drives assembly and maturation of bacteriophage HK97 capsid. J. Mol. Biol. 2006;364(3):512–525. doi: 10.1016/j.jmb.2006.08.048. [DOI] [PMC free article] [PubMed] [Google Scholar]
- Seeger C, Zoulim F, Mason WS. Hepadnaviruses. In: Knipe DM, Griffin DE, Lamb RA, Martin MA, Roizman B, Straus SE, editors. Fields Virol. vol. 2. Lippincott Williams & Wilkins; Philadelphia: 2007. pp. 2977–3029. 2 vols. [Google Scholar]
- Singh S, Zlotnick A. Observed hysteresis of virus capsid disassembly is implicit in kinetic models of assembly. J. Biol. Chem. 2003;278(20):18249–18255. doi: 10.1074/jbc.M211408200. [DOI] [PubMed] [Google Scholar]
- Smith DE, Tans SJ, Smith SB, Grimes S, Anderson DL, Bustamante C. The bacteriophage straight phi29 portal motor can package DNA against a large internal force. Nature. 2001;413(6857):748–752. doi: 10.1038/35099581. [DOI] [PubMed] [Google Scholar]
- Tang J, Lander GC, Olia A, Li R, Casjens S, Prevelige P, Jr., Cingolani G, Baker TS, Johnson JE. Peering down the barrel of a bacteriophage portal: the genome packaging and release valve in p22. Structure. 2011;19(4):496–502. doi: 10.1016/j.str.2011.02.010. [DOI] [PMC free article] [PubMed] [Google Scholar]
- Tzlil S, Kindt JT, Gelbart WM, Ben-Shaul A. Forces and pressures in DNA packaging and release from viral capsids. Biophys. J. 2003;84(3):1616–1627. doi: 10.1016/S0006-3495(03)74971-6. [DOI] [PMC free article] [PubMed] [Google Scholar]
- Yeh CT, Hong LH, Ou JH, Chu CM, Liaw YF. Characterization of nuclear localization of a hepatitis B virus precore protein derivative P22. Arch. Virol. 1996;141(3–4):425–438. doi: 10.1007/BF01718307. [DOI] [PubMed] [Google Scholar]
- Yoffe AM, Prinsen P, Gopal A, Knobler CM, Gelbart WM, Ben-Shaul A. Predicting the sizes of large RNA molecules. Proc. Natl. Acad. Sci. USA. 2008;105(42):16153–16158. doi: 10.1073/pnas.0808089105. [DOI] [PMC free article] [PubMed] [Google Scholar]
- Zandi R, van der Schoot P. Size regulation of ss-RNA viruses. Biophys. J. 2009;96(1):9–20. doi: 10.1529/biophysj.108.137489. [DOI] [PMC free article] [PubMed] [Google Scholar]
- Zlotnick A, Johnson JM, Wingfield PW, Stahl SJ, Endres D. A theoretical model successfully identifies features of hepatitis B virus capsid assembly. Biochemistry. 1999;38(44):14644–14652. doi: 10.1021/bi991611a. [DOI] [PubMed] [Google Scholar]
- Zlotnick A, Mitchell RS, Steed RK, Brenner SL. Analysis of two distinct single-stranded DNA binding sites on the recA nucleoprotein filament. J. Biol. Chem. 1993;268(30):22525–22530. [PubMed] [Google Scholar]