Abstract
A key distinction between the lanthanide (4f) and actinide (5f) transition elements is the increased role of f-orbital covalent bonding in the latter. Circularly polarized luminescence (CPL) is an uncommon but powerful spectroscopy which probes the electronic structure of chiral, luminescent complexes or molecules. While there are many examples of CPL spectra for the lanthanides, this report is the first for an actinide. Two chiral, octadentate chelating ligands based on orthoamide phenol (IAM) were used to complex curium(III). While the radioactivity kept the amount of material limited to micromole amounts, the spectra of the highly luminescent complexes showed significant emission peak-shifts between the different complexes, consistent with ligand field effects previously observed in luminescence spectra.
INTRODUCTION
Due to their radioactivity, consequent rarity, and difficulty of handling the actinides (particularly those beyond uranium in the periodic table), have electronic levels which are less understood than other d or f transition metals. Although the optical properties of Cm(III) was the subject of an excellent recent review,1 less is known at the molecular level concerning electronic and structural properties of actinides in excited states,1–4 in contrast to the 4f lanthanides. The latter are therefore often used as surrogates for the actinides. The significant electronic and chemical differences between the 4f and 5f elements require direct investigation to differentiate.5–8
Recent advances in computational modeling for these relativistic and many-electron elements have rekindled the interest of experimentalists in the molecular chemistry and physics of the actinides.5, 9–11 This effort is significant, since most of the prior actinide photoluminescence studies have been in the solid state and based on direct excitation of the metal center. While antennae sensitization has been commonly used for indirect enhancement of the luminescence of lanthanides (even in commercial use), there are very few reports of the sensitization of actinides. In this study a new window into the electronic structure of actinides is opened through the use of Circularly Polarized Luminescence (CPL) spectroscopy.12, 13 Compared to standard photoluminescence spectroscopy, this spectroscopic technique is rarely reported.14–18 The only example of CPL from an actinide complex is a study of the charge transfer band of uranyl complexes, which is not an f-f transition.19, 20
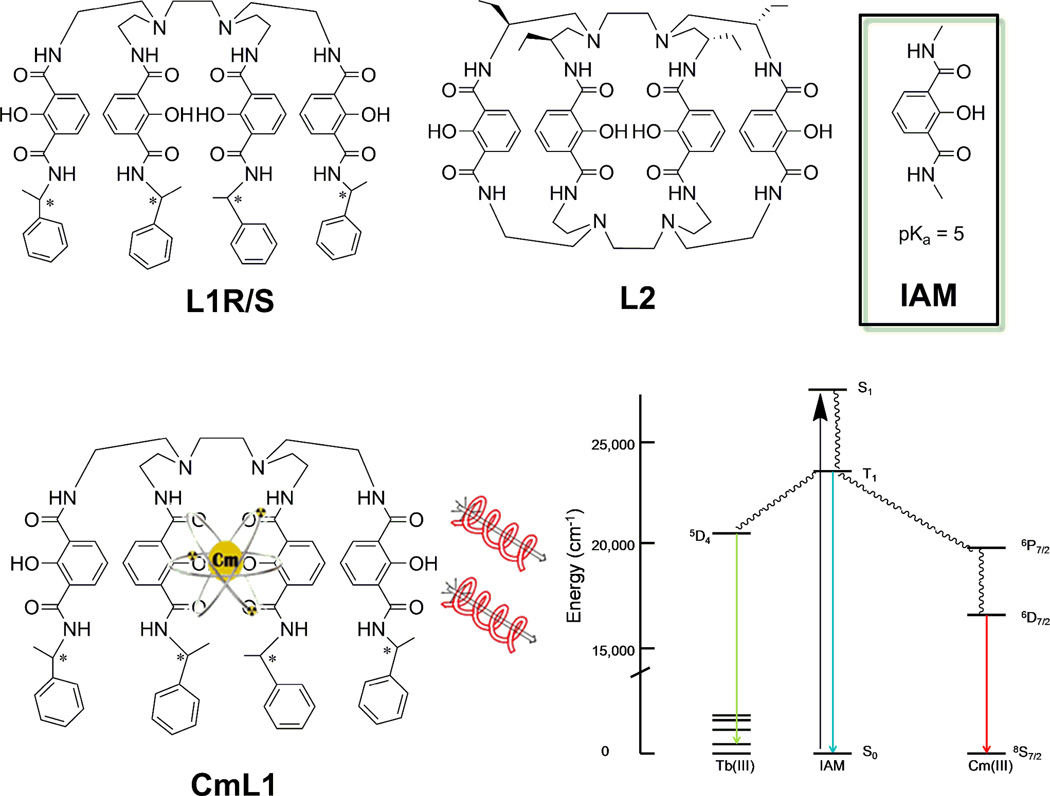
CPL is the emission analog of circular dichroism (CD). Similar to CD, CPL can also discriminate between structurally similar luminescent chiral complexes/molecules.21–25 In this work, octadentate chiral phenolate ligands, H(2,2)BnMe IAMS(−)/R(+) chiral ligands (both enantiomers denoted as L1), as well as a newly synthesized chiral cage, EtH(2,2)-BIAM (L2), were used to form Cm(III) complexes (Scheme 1).24, 26 The ligands L1 and L2 were selected based on the photophysical properties of the L1 terbium(III) complexes.24 The sensitizer/chelator group, 2-hydroxyisophthalamide (IAM), was thought likely to provide a favorable pairing of electronic states for the sensitization of Cm(III) (Scheme 1).27, 28 As previously shown for the lanthanides, L1 and L2 are both strongly coordinating and strongly sensitizing ligands. Given the relative energy levels (see Figure S1 in Supporting Material) we anticipated efficient luminescence, a large quantum yield, and perhaps strong CPL response for the Cm(III) complexes. Although Am lies below Eu and so might be considered the most promising 5f luminescent ion, relativistic effects and spin-orbit coupling3 make Cm (which lies below Gd) the best choice, as shown in Scheme 1.
Scheme 1.
top) Structures of the chiral ligands used in this study. The * indicates the chiral center for L1 and L2. (bottom) Cartoon of CmL1 structure (left) and partial energy diagram generally describing the energy transfer from the chromophore (IAM) to Cm(III) and Tb(III) (right).
EXPERIMENTAL SECTION
Synthesis of L1 has been previously reported24 and L2 will be reported in another pending manuscript. The integrity of these ligands was verified by elemental analysis, proton NMR and ESI/MS and for L1, the ligand characterization agreed to the reported values.24
Complexes were prepared in situ by dissolving the appropriate amount of the ligand L1 (H4R (+) BnMeH(2,2)IAM or L2, H4EtBH(2,2)IAM) to yield either a 10 or 200 µM solution in HPLC grade methanol dried with molecular sieves. Curium(III) solutions were prepared in dry methanol at the same concentrations as the ligand solution (10 or 200 µM) from the Cm(III) acidified (HCl) stock. Complexes were prepared by mixing 1.00 mL of the ligand solution with 1.00 mL of the Cm(III) methanol solution, in a 1:1 stoichiometric ratio, and thoroughly mixed by gentle pipetting. A base, 5 µL dry pyridine, was added in excess to ensure deprotonation of the IAM moieties. Samples were incubated for at least 48 hours to allow for equilibration. As the complexes were formed in situ, characterization of the complexes were done by ESI/MS. For the photoluminescence measurements, the stock solution was diluted to approximately 5, 4, 3, 2, and 1 µM in methanolic solution.
ESI/MS
All ESI/MS experiments were performed using an Agilent 6340 QIT-MS. The instrument has a detection range of 50–2200 m/z, with a resolution of ~0.25 m/z. Mass spectra were recorded using the negative ion mode. Solutions were injected into an electrospray needle via a syringe pump and were nebulized using nitrogen gas upon exiting the needle, resulting in the creation of small droplets and eventually gaseous ions. The gas-phase ions entered a charged capillary where they were further desolvated by dry heated nitrogen from a liquid nitrogen dewar, which also supplied the nebulizing gas. The ions then passed through an ion-focusing skimmer and into two focusing octopoles for transfer into the ion trap. Mass spectra were acquired using the following instrumental parameters: Solution flow rate, 60 µl/hour; nebulizer gas pressure, 15 psi; dry gas flow rate, 5 L/min; dry gas temperature, 325 °C; capillary voltage, 4500 V; capillary exit voltage, −147.3 V; skimmer voltage, −40.0 V; octopole 1 and 2 DC voltage, −12.00 V and −3.67 V; octopole RF amplitude, 200.0 Vpp; lens 1 and 2 voltages, 5.0 V and 60.0 V; trap drive, 150.5.
CmL2 [Cm(III)(EtBH(2,2)IAM)]− ESI-MS negative mode (M−) m/z expected 1405.32 (found 1405.0).
CmL1R [Cm(III)R(+)BnMeH22IAM]− ESI-MS negative mode (M−) m/z expected 1544.46 (found 1544.5).
CmL1S [Cm(III)S(−)BnMeH22IAM]- ESI-MS negative mode (M−) m/z expected 1544.46 (found 1544.5).
Photophysics
UV-Vis absorbance measurements were collected using the Carey 6000i UV-Vis in the Heavy Elements Research Laboratory at the Lawrence Berkeley National Laboratory (LBNL). The solution spectra of the Cm(III) complexes were recorded at 25.0°C. Emission spectra were acquired on a HORIBA Jobin Yvon IBH FluoroLog-3 spectrofluorometer equipped 450 W xenon lamp and a temperature controller operating at 25.0 °C. This instrument is described in detail elsewhere.21–26 Quantum yields were determined by the optically dilute method using Equation (1).
| (1) |
A quantum yield standard, quinine sulfate, in 0.1 M H2SO4 (Φr = 0.577) was used as a reference and prepared according to the literature.9, 27 The absorbance at the excitation wavelength was varied from approximately 0.02 to 0.13 for both the curium complexes and the quinine sulfate reference. Five CmL samples and quinine sulfate reference solutions were prepared for each quantum yield determination at different absorbances within the previously given range. The following refractive indices were used for the reference and the sample nH2O = 1.333 and nMEOH = 1.329, respectively. Quantum yields are reported as the average of three independent measurements unless stated otherwise. Samples and references were excited at 350 nm with a 3 nm bandpass. The emission was collected in 1.0 or 0.1 nm increments, 0.2 s integration times with a 1.0 nm bandpass.
For time-resolved luminescent lifetime measurements, the sub-microsecond xenon flash lamp (Jobin Yvon, 5000XeF) unit of the Fluorolog-3 was used as the light source also described in detail elsewhere.21–26 Samples in methanol were excited at 350 nm; the emission slit was set to the maximum intensity determined by from the emission spectra for each sample. Excitation and emission slits were adjusted to prevent saturation of the of the detector electronics utilizing ratiometers included in the time-resolved luminescence software package. The goodness of fit was assessed by minimizing the reduced chi squared function, χ2, and a visual inspection of the weighted residuals. Each trace contained at least 10,000 points and the reported lifetime values result from at least three independent measurements.
Circularly polarized luminescence and total luminescence spectra were recorded on an instrument described previously,21–25 operating in a differential photon-counting mode. The light source for indirect excitation was a continuous wave 1000 W xenon arc lamp from a Spex FluoroLog-2 spectrofluorometer, equipped with excitation and emission monochromators with dispersions of 4 nm/mm (SPEX, 1681B). The optical detection system consisted of a focusing lens, long pass filter, and 0.22 m monochromator. The emitted light was detected by a cooled EMI-9558B photo-multiplier tube operating in photon-counting mode. All measurements were performed in quartz cuvettes with a path length of 0.4 or 1.0 cm.
RESULTS/DISCUSSION
The two ligands (L1 and L2) differ by the presence of an additional capping moiety and the incorporation of the chiral centers. The open ended octadentate ligands, L1R and L1S (collectively L1,see Scheme 1), were synthesized in enantiopure forms.21 These molecules are chiral due to the insertion of chiral centers on the opposite end of the IAM chelator to the capping group referred to as “H(2,2).” The L2 macrocyclic ligand is a derivative of L1 and is more synthetically challenging. It is a macrocyclic octadentate ligand in which the four chelating chromophores are tethered together at both ends and it was designed to enhance kinetic and thermodynamic stability. Rigidity generally improves the photoluminescent properties such as quantum yield and the excited state lifetime (relative to L1), however, not necessarily the CPL response. Since the L2 ligand is capped at either end of the IAM chromophore, the chirality is introduced into the molecule by the addition of ethyl groups on one of the capping scaffolds H(2,2) (Scheme 1).
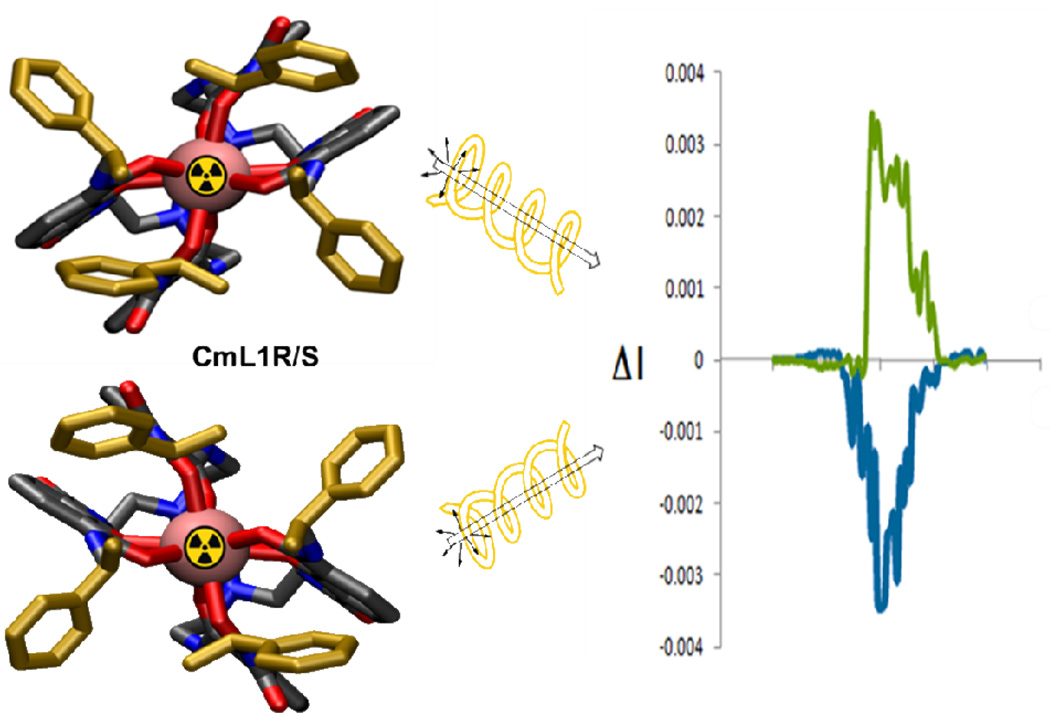
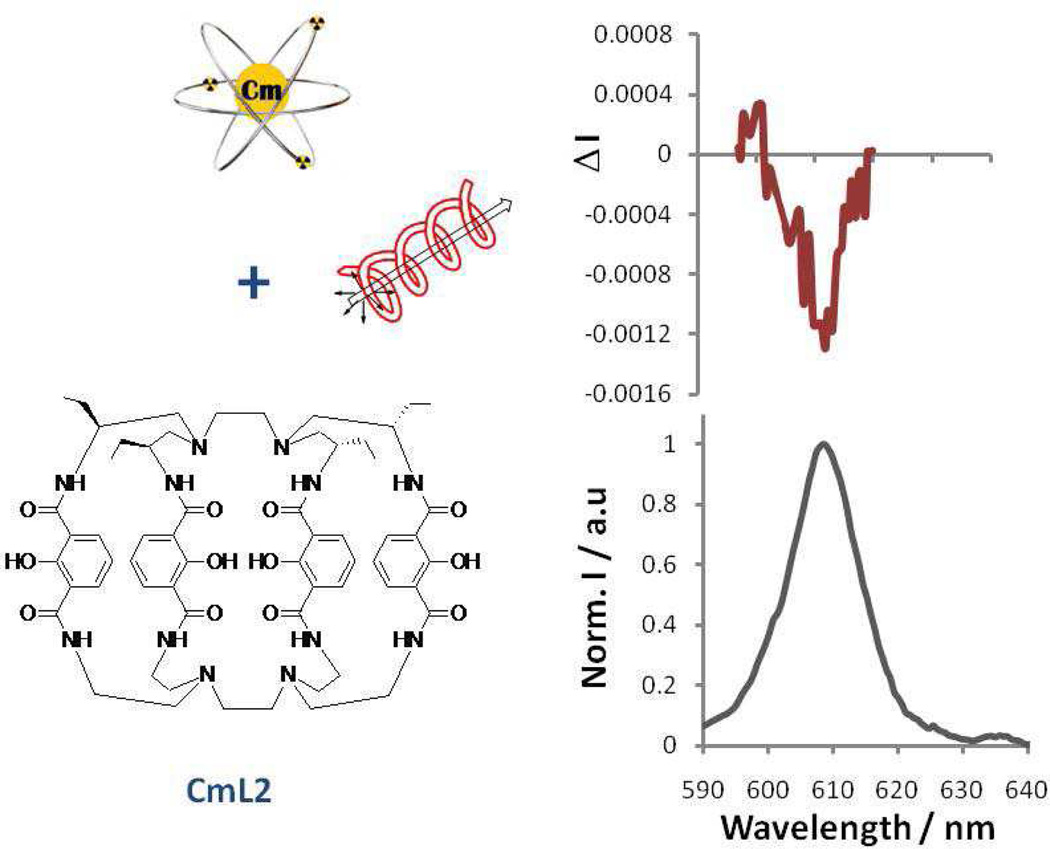
The CPL spectra of CmL1R/S and CmL2 are shown in Figure 1 and Figure 2, respectively. The CPL activity of the Cm(III) complexes in methanol solutions were determined using a custom-built instrument that measures left and right CPL and is quantified as glum, the luminescence dissymmetry factor (Equation 2).21–24 Here IL is the intensity of left CPL and IR is the intensity of right CPL.
Figure 1.
CPL spectra of CmL1 (S-) (top) and CmL1 (R+) (bottom), λEX = 350 nm at 25.0 °C in MeOH.
Figure 2.
CPL spectra of the CmL2 (top) and emission spectra (bottom) (λEX = 350 nm at 25.0 °C in MeOH), 4 µM concentration.
| (2) |
The CPL response is typically of greater magnitude at transitions corresponding to magnetic dipole rather than electric dipole allowed transitions.12, 13 In this case Cm(III) emission is observed at ~611-3 nm for the complexes. The glum values for the R and S isomers were −0.050 and +0.048 at an emission wavelength of 611 nm, respectively (Table 1). Since the complexes are enantiomers these spectra are mirror images (Figure 1).
Table 1.
CPL properties of Cm(III) chiral complexes, 4 µM in MeOH at 25.0 °C.
| Ligand | glum | λEM (nm) |
|---|---|---|
| L1R | −0.050 | 611 |
| L1S | +0.048 | 611 |
| L2 | +0.0018 −0.0014 |
600 609 |
Comparison of the CPL of CmL1 and CmL2 shows that the more rigid CmL2 has a smaller glum than the CmL1 complex. The CPL spectrum of CmL2 is characterized by a negative glum value of −0.0018 (a greater degree of right CPL) at an emission wavelength of ~609 nm (Table 1) with another peak seen at 600 nm with a glum value of +0.0014. In comparison to the lanthanides, these values for the Cm(III) complexes are not as large as the glum values for [EuL1R/S], previously reported with values of +0.298 and −0.294 (at an emission wavelength of 596 nm),24 or with any other lanthanide complexes we have reported.22–25 The glum values for the CmL1R/S complexes were similar to the Tb(III) values determined with the same ligand L1R/S, (+0.044 and −0.048, respectively). It is important to note that although, Tb(III) and Cm(III) have some similarities with respect to excited state energies, it is unlikely that these similarities result in similar glum, since other parameters (including coordination geometry and inner sphere solvent coordination as well as vibronic relaxations) play an influential role. In the case of L2, the capping of the ligand has enhanced the photoluminescent properties through the increased rigidity of the ligand.
We suggest that the energy transfer mechanism to Cm(III) occurs via the “antennae effect”; absorbed light excites the IAM ligand to a singlet, which decays to a triplet state followed by excitation of the accepting state of the metal ion. The lowest triplet state of the IAM chromophore has been previously determined as 23,300 cm−1, as shown in the Jablonski diagram (Scheme 1).28, 29 The intramolecular energy transfer from the triplet state of the chromophore is believed to proceed to a high energy Cm(III) excited state (above the lowest lying excited state), which then cascades to the lowest emitting state (5D7/2), before relaxing to the ground state (8S7/2), by radiative (photon emission) and non-radiative (such as vibronic coupling) relaxation processes (Scheme 1).
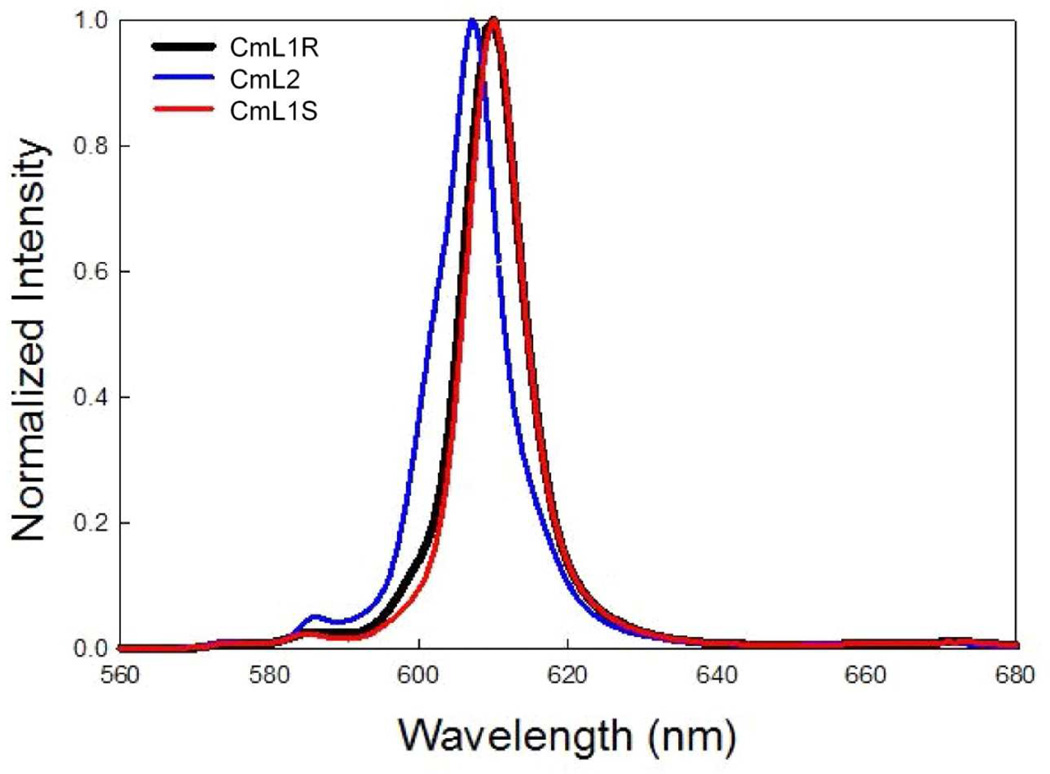
The photophysical data of the Cm(III) complexes are reported in Table 2. All measurements were performed in methanolic solutions at 25.0 °C (supporting online material). The sensitization of Cm(III) by IAM is surprisingly efficient. This is essential, since such low concentration of the complexes necessarily were used for the photoluminescent (and CPL) measurements (4 µM). The UV absorption maximum is observed at 335–345 nm for both complexes, with a large molar absorptivity from the Π-Π* transitions. This is characteristic of the IAM chromophore, as seen in our previous lanthanide studies.26, 28, 30 The primary emission band, observed at 610 nm, is assigned to an f-f transition (5D7/2 8S7/2) of Cm(III). The emission spectra and photophysical properties for the enantiomers (CmL1 R/S) are nearly identical, as expected (Figure 3). The photoluminescence emission spectra comparing the two different ligands are shown in Figure 3.
Table 2.
Photophysical properties of the Cm(III) chiral complexes in MeOH at 25.0 °C.
| Complex | ε (M−1 cm−1) |
λEM (nm) |
Φ (%) |
τMEOH (µS) |
qMEOH |
|---|---|---|---|---|---|
| CmL1R | 25,600 | 609 | 0.38 | 471 | 0.3a, 0.2b |
| CmL1S | 25,100 | 609 | 0.35 | 502 | 0.3a, 0.2b |
| CmL2 | 19,300 | 606 | 0.50 | 353 | 0.5a, 0.3b |
Calculated with equation 2a.
Calculated using equation 2b.
Figure 3.
Normalized emission spectra CmL2, CmL1R and CmL15 in methanol λEX = 350 ± 4 nm at 5 µM and 25.0 °C.
The coordination differences of the ligands (L1 and L2) are more apparent upon comparison of the photophysical properties of the complexes (Table 2 and Figure 3). CmL2, the bi-capped macrocycle, has enhanced photoluminescent properties relative to CmL1, improved quantum yield efficiency and brightness. The quantum yield of the CmL2 complex is significantly larger (Φ = 0.50 versus 0.38–0.35) when compared to the CmL1 isomers. The value of the molar absorptivity (19,300 M−1 cm−1) and observed lifetime (353 µs) are slightly smaller and shorter for CmL2 compared to CmL1, respectively. We suggest that the increased rigidity, stability, and reduction of external quenching by solvent molecules, due to more effective encapsulation of the CmL2 complex, accounts for the enhancement of these photophysical properties. Solvation numbers, qMEOH, of the complexes were estimated using a modified Cm(III) equation originally developed by Kimura 31 and then by Tian32 (equations 2a and 2b respectively). 33 To obtain the qMEOH, the numerical values of both original equations were taken as ½ to approximate the quenching of a methanol molecule since one methanol contains a single O-H oscillator whereas water is composed of two oscillators.33 However, it is important to note that these two equations fail to account for many non-radiative decay processes such as back energy transfer to a chromophore or quenching by other nearby oscillators. 1
| (2a) |
| (2b) |
The qMEOH number determined for the CmL1 complexes is estimated to be 0.2 – 0.3 and 0.5-0.3 for CmL2, although other quenching processes may be occurring and unaccounted for in both systems. Alternatively, partial dissociation of the chelator allowing for a small fraction of CmL species with a inner-sphere water cannot be definitively ruled out and may influence to non-zero qMEOH number. However, the large quantum yields and monoexponential time-resolved photoluminescent data together are suggestive of a single species present in solution with no solvent molecules directly coordinated to either complex.
Inspection of the photoluminescence emission spectra from the two different octadentate ligands (L1 and L2) shows the characteristic Cm(III) emission band, which is observed between 590–614 nm (Figure 3). The smaller bands observed in the emission spectra (570 and 590 nm) are likely a result of the crystal field splitting of the lowest lying excited state (5D7/2.3 The time-resolved photoluminescence lifetime decays were fitted to a monoexponential decay function, consistent with one species in solution for all the Cm(III) samples discussed here (Table 2). In addition, only one major peak for the predicted Cm(III) complexes was observed in the ESI/MS spectra (Figure S2).
The bathochromatic shift (red shift) of the emission wavelength maxima between CmL1 and CmL2 has been discussed for a range of Cm(III) complexes.3 Comparison of either complex to directly excited methanolic solutions of Cm(III) (λEX = 396 nm) with spectra peak maxima at 600 nm shows a larger red shift. This red shift of 8–10 nm is much larger than those observed for Ln(III) complexes and free cations (0–3 nm).34, 35 For comparison, aqueous Cm(III) has reported emission maxima at 593.8 nm.1, 32, 36 The nephelauxetic effect seen in the luminescence spectra of a range has been previously explained (see Table 4 of reference 1).
CONCLUSIONS
We report the first actinide CPL spectra of an f-f transition. Highly luminescent Cm(III) complexes of antenna ligands show significant emission peak shifts between the two complexes studied. The apparent ligand field effects are consistent with the significant differences in electronic structure between 5f Cm(III) and 4f analogs.
Supplementary Material
ACKNOWLEDGMENT
Some of this research was supported by NIH grant HL069832. Work at LBNL was supported by the Director, Office of Science, Office of Basic Energy Sciences, and the Division of Chemical Sciences, Geosciences, and Biosciences of the U.S. Department of Energy at LBNL under Contract No. DE-AC02-05CH11231. G.M. thanks the National Institutes of Health, Minority Biomedical Research support (1 SC3 GM089589-03) and the Henry Dreyfus Teacher-Scholar Award for financial support. G.M. also thanks Mr. Victor Maraschin from the San José State University Nuclear Science facility for his technical help in handling the samples.
Footnotes
Author Contributions
All authors have given approval to the final version of the manuscript.
ASSOCIATED CONTENT
Supporting Information. Contains an energy level diagram depicting luminescent actinides in relation to the IAM chromophore and ESI/MS spectra. This material is available free of charge via the Internet at http://pubs.acs.org.”
REFERENCES
- 1.Edelstein NM, Klenze R, Fanghänel T, Hubert S. Coord. Chem. Rev. 2006;250:948. [Google Scholar]
- 2.Billard I, Geipel G. Springer Ser. Fluoresc. 2008;5:465. [Google Scholar]
- 3.Carnall WT. J. Phys. Chem. 1992;96:8713. [Google Scholar]
- 4.Gorden AEV, Xu J, Szigethy G, Oliver A, Shuh DK, Raymond KN. J. Am. Chem. Soc. 2007;129:6674. doi: 10.1021/ja070168l. [DOI] [PubMed] [Google Scholar]
- 5.Polly R, Schimmelpfennig B, Rabung T, Flörsheimer M, Klenze R, Geckeis H. Radiochim. Acta. 2010;98:627. [Google Scholar]
- 6.Elgazzar S, Rusz J, Oppeneer PM, Colineau E, Griveau JC, Magnani N, Rebizant J, Caciuffo R. Phys. Rev. B: Condens. Matter. 2010;81:235117. [Google Scholar]
- 7.Söderlind P, Gonis A. Phys. Rev. B: Condens. Matter. 2010;82:033102. [Google Scholar]
- 8.Odoh SO, Schreckenbach G. J. Phys. Chem. A. 2010;114:1957. doi: 10.1021/jp909576w. [DOI] [PubMed] [Google Scholar]
- 9.Marie C, Miguirditchian M, Guillaumont D, Tosseng A, Berthon C, Guilbaud P, Duvail M, Bisson J, Guillaneux D, Pipelier M, Dubreuil D. Inorg. Chem. 2011;50:6557. doi: 10.1021/ic200271e. [DOI] [PubMed] [Google Scholar]
- 10.Pérez-Villa A, David J, Fuentealba P, Restrepo A. Chemical Physics Letters. 2011;507:57. [Google Scholar]
- 11.Tecmer P, Gomes ASP, Ekström U, Visscher L. Physical Chemistry Chemical Physics. 2011;13:6249. doi: 10.1039/c0cp02534h. [DOI] [PubMed] [Google Scholar]
- 12.Martin B, Richardson FS. Quarterly Reviews of Biophysics. 1979;12:181. doi: 10.1017/s0033583500002754. [DOI] [PubMed] [Google Scholar]
- 13.Riehl JP, Richardson FS. Chem. Rev. 1986;86:1. [Google Scholar]
- 14.Panak P, Klenze R, Kim JI, Wimmer H. Journal of Alloys and Compounds. 1995;225:261. [Google Scholar]
- 15.Klenze R, Panak P, Kim JI. Journal of Alloys and Compounds. 1998;271- 273:746. [Google Scholar]
- 16.Nugent LJ, Burnett JL, Baybarz RD, Werner GK, Tanner SP, Tarrant JR, O. L. Keller J. J. Phys. Chem. 1969;73:1540. [Google Scholar]
- 17.Dem'yanova TA, Stepanov AV, Babaev AS, Aleksandruk VM. Radiokhimiya. 1986;28:494. [Google Scholar]
- 18.Yusov AB. J. Radioanal. Nucl. Chem. 1990;143:287. [Google Scholar]
- 19.Samoilov BN. J. Exp. Theor. Phys. 1948;18:1030. [Google Scholar]
- 20.Murata K, Yamazaki Y, Morita M. J. Lumin. 1979;18-19, Part 1:407. [Google Scholar]
- 21.Seitz M, Moore EG, Ingram AJ, Muller G, Raymond KN. J. Am. Chem. Soc. 2007;129:15468. doi: 10.1021/ja076005e. [DOI] [PMC free article] [PubMed] [Google Scholar]
- 22.Seitz M, Do K, Ingram AJ, Moore EG, Muller G, Raymond KN. Inorg. Chem. 2009;48:8469. doi: 10.1021/ic901079s. [DOI] [PMC free article] [PubMed] [Google Scholar]
- 23.Samuel APS, Lunkley JL, Muller G, Raymond KN. Eur. J. Inorg. Chem. 2010;2010:3343. doi: 10.1002/ejic.201000309. [DOI] [PMC free article] [PubMed] [Google Scholar]
- 24.Petoud S, Muller G, Moore EG, Xu J, Sokolnicki J, Riehl JP, Le UN, Cohen SM, Raymond KN. J. Am. Chem. Soc. 2007;129:77. doi: 10.1021/ja064902x. [DOI] [PMC free article] [PubMed] [Google Scholar]
- 25.D'Aleo A, Xu J, Do K, Muller G, Raymond KN. Helv. Chim. Acta. 2009;92:2439. doi: 10.1002/hlca.200900161. [DOI] [PMC free article] [PubMed] [Google Scholar]
- 26.Xu J, Corneillie TM, Moore EG, Law GL, Butlin NG, Raymond KN. J. Am. Chem. Soc. 2011 doi: 10.1021/ja2079898. [DOI] [PMC free article] [PubMed] [Google Scholar]
- 27.Eastman JW. Photochem. Photobiol. 1967;6:55. [Google Scholar]
- 28.Samuel APS, Xu J, Raymond KN. Inorg. Chem. 2008;48:687. doi: 10.1021/ic801904s. [DOI] [PubMed] [Google Scholar]
- 29.Moore EG, Samuel APS, Raymond KN. Acc. Chem. Res. 2009;42:542. doi: 10.1021/ar800211j. [DOI] [PMC free article] [PubMed] [Google Scholar]
- 30.Petoud S, Cohen SM, Bünzli J-CG, Raymond KN. J. Am. Chem. Soc. 2003;125:13324. doi: 10.1021/ja0379363. [DOI] [PubMed] [Google Scholar]
- 31.Kimura T, Nagaishi R, Kato Y, Yoshida Z. Radiochim. Acta. 2001;89:125. [Google Scholar]
- 32.Tian G, Edelstein NM, Rao L. J. Phys. Chem. A. 2011;115:1933. doi: 10.1021/jp1116432. [DOI] [PubMed] [Google Scholar]
- 33.Horrocks WD, Jr, Sudnick DR. Science. 1979;206:1194. doi: 10.1126/science.505007. [DOI] [PubMed] [Google Scholar]
- 34.Andolina CM, Mathews RA, Morrow JR. Helv. Chim. Acta. 2009;92:2330. [Google Scholar]
- 35.Andolina CM, Holthoff WG, Page PM, Mathews RA, Morrow JR, Bright FV. Appl Spectrosc. 2009;63:483. doi: 10.1366/000370209788346959. [DOI] [PubMed] [Google Scholar]
- 36.Rao L, Tian G. Dalton Trans. 2011;40:914. doi: 10.1039/c0dt01160f. [DOI] [PubMed] [Google Scholar]
Associated Data
This section collects any data citations, data availability statements, or supplementary materials included in this article.


