Abstract
Acoustic radiation force impulse (ARFI) imaging is being utilized to investigate mechanical properties of cardiac tissue. The underlying physiological motion, however, presents a major challenge. This paper aims to investigate the effectiveness of various physiological motion filters using in vivo canine data with a simulated ARFI push pulse. Ideally, the motion filter will exactly model the physiological motion and, when subtracted from the total displacement, leave only the simulated ARFI displacement profile.
We investigated three temporal quadratic motion filters: (1) interpolation, (2) extrapolation and (3) a weighted technique. Additionally, the various motion filters were compared when using 1-D versus 2-D autocorrelation methods to estimate motion. It was found that 2D-autocorrelation always produced better physiological motion estimates regardless of the type of filter used. The extrapolation filter gives the most accurate estimate of the physiological motion at times immediately after the ARFI push (0.1 ms) while a close-time interpolation filter using displacement estimates at times before full tissue recovery gives the most accurate estimates at later times after the ARFI push (0.7 ms). While improvements to the motion filter during atrial systole and the onset of ventricular systole are needed, the weighted, close-time interpolation and extrapolation motion filters all offer promising results for estimating cardiac physiological motion more accurately, while allowing faster ARFI frame rates than previous motion filters. This study demonstrates the ability to eliminate physiological motion in a clinically-feasible manner, opening the door for more extensive clinical experimentation.
Keywords: Acoustic radiation force, ARFI, cardiac imaging, cardiac modeling, motion filter, ultrasound
I. INTRODUCTION
40% to 50% of patients with heart failure have diastolic dysfunction.1 Studies report an association between increased left ventricle myocardial stiffness and diastolic heart failure.2,3 Thus, cardiac stiffness and mechanical properties have vast potential as diagnostic tools. One method of obtaining myocardial stiffness measurements is through the pressure-volume relation.4,5 This method is limited, however, as it cannot provide measurements of specific regions of the heart nor provide measurements in real-time. Three more promising techniques that are compatible with current commercial scanners are shear wave dispersion ultrasound vibrometry (SDUV), which uses the speed of propagating shear waves at several frequencies to determine tissue mechanical properties;6,8 shear wave elasticity imaging (SWEI);9 and acoustic radiation force impulse (ARFI) imaging.10
ARFI imaging, the focus of this paper, is a noninvasive method to assess the mechanical properties of tissue.11 ARFI imaging uses a high-intensity acoustic wave transmitted through tissue to create a body force expressed as:
| (1) |
where c is the speed of sound in tissue [m/s], α is the tissue absorption coefficient [Np/m] and I is the intensity [W/cm2]. This force causes small displacements inversely proportional to tissue stiffness.11 Recent modifications to ARFI imaging, such as parallel beam tracking, have decreased acquisition times and transducer heating, making clinical applications of cardiac ARFI feasible.12 Arguably, the greatest remaining challenge for cardiac ARFI and SWEI applications is accommodating physiological motion.13
While the physiological motion of the heart has been shown to contain diagnostically-relevant information either through qualitative inspection, cardiac elastography or strain-rate imaging,11,14–16 for other applications, particularly ARFI, physiological motion is a dominant noise source that deteriorates image quality and must be filtered. According to several studies, human cardiac tissue can achieve maximum acceleration and velocity magnitudes of 190 cm/s2 and 17.5 cm/s, respectively.17,18 This physiological motion causes decorrelation of consecutively-acquired echo signals, which subsequently results in increased bias and jitter of displacement estimates.19 Additionally, the unfiltered physiological motion will overwhelm ARFI-induced displacements.
Several methods have been explored for filtering cardiac motion.10,19,20 All cardiac motion filters utilized in previous work, as well as those investigated here, use a common underlying approach. The motion filter relies on the knowledge that the ARFI displacement estimates include both physiological and ARFI-induced motion for some amount of time after the application of radiation force. But before radiation force is applied and after the tissue recovers from radiation force induced displacement, the estimates represent only physiological motion. Additionally, since the physiological motion is continuous and on a different time scale relative to the interrogated tissue’s dynamic response to the ARFI-induced displacement (~500 ms versus ~5 ms), the physiological motion that occurs during the dynamic ARFI response can be predicted using the physiological motion that occurs outside the temporal influence of the ARFI’s response. The predicted physiological motion can then be subtracted from the total estimated motion. The remaining motion is assumed to be the solely due to the ARFI-induced displacement. (Practically, motion filters generally operate on assumptions about the relevant temporal extent of an ARFI’s dynamic response based on a priori information about the investigated tissue’s stiffuess.)
For example, although the heart is very dynamic and the velocity of the tissue is not constant, it has been hypothesized that the motion is approximately linear over several milliseconds. Thus, the first attempt at physiological motion filtering predicted the physiological motion using a temporal first-order polynomial model.13,21 This filter fit a line through two points: the ARFI reference time point, which is just prior to the ARFI push pulse, and a single displacement estimate after full tissue recovery, which is selected based on the previously-mentioned assumption. The predicted physiological motion was subtracted from the total motion, ideally leaving only displacements due to radiation force. This approach has several problems: (1) two points are often too few to accurately model the cardiac motion and (2) even in such a short time frame, the velocity of cardiac tissue is dynamic and thus cannot be well modeled with a first-order polynomial.
Further improvements of cardiac physiological motion filtering have utilized more postrecovery displacement estimates, introduced displacement estimates of the physiological motion before the ARFI reference pulse and modeled the physiological motion as a second-rather than a first-order polynomial. By adding three additional postrecovery tracking A-lines and modeling the physiological motion quadratically, Hsu et al were able to realize significant improvements over the original motion filter realization.10 Hsu et al’s study interrogated open-chested canines with the transducer fixed to the epicardial surface of the heart. Hsu et al assumed full tissue recovery 2.97 ms after the ARFI pushing pulse. The improved motion-filter implementation worked effectively during diastole but not during systole. During ventricular systole (when the cardiac tissue is stiffest), the displacement from the ARFI push is at its minimum and, at the same time, the motion filter has its worst performance. To provide perspective, in Hsu et al’s study, the motion filter had a maximum error of 1.5 μm during systole, yet the average ARFI-induced displacement during systole was just 3.96 ± 1.16 μm. On the other hand, during diastole, the motion filter’s error was approximately 0.2 μm with an average ARFI-induced displacement of 19.75 ± 2.97 μm.10
Currently, the most accurate motion- filtering technique is a temporal quadratic interpolation method which uses several postrecovery tracking A-lines, a single prereference tracking A-line and a second-order polynomial model.19 This motion filter was demonstrated by Bradway et al and the filter’s residual error range in a transthoracic imaging scenario was shown to be ± 1 μm. Another recent work by Hsu et al suggests that it may be beneficial to include more than one prereference tracking A-line but the results were not rigorously quantified.20
While the most recent motion filters work well, there are still several challenges. First, it is very difficult to determine precisely when radiation-force-induced shear waves have entirely cleared the region of interest and residual displacements may influence the ‘post-recovery’ tracking time points used in the interpolation.22 Second, interpolation requires data over a relatively long time and is thus susceptible to out-of-plane motion and decorrelation. Third, interpolation requires data to be collected until full tissue recovery, increasing acquisition time for a single ARFI sequence and decreasing flexibility in constructing ARFI sequences. This limitationis especially detrimental for an M-mode case where a single ARFI sequence is obtained repetitively in the same tissue region and interleaving of sequences to keep up frame rate is not possible.
This paper aims to evaluate the effectiveness of motion filters throughout the cardiac cycle and determine the most effective technique for removing physiological motion for cardiac ARFI and SWEI applications. Three motion-filtering techniques are investigated: quadratic interpolation, quadratic extrapolation and a quadratic weighted model filter.
Lastly, most in vivo cardiac studies to date have used data acquired with the transducer fixed directly against the epicardial surface of the heart.22,23 Epicardial data acquisition is extremely invasive and not practical for clinical application of SWEI and ARFI imaging. Instead, this study examines the effectiveness of the mentioned physiological motion filters on transthoracic canine cardiac data acquired noninvasively.
II. METHODS
Data acquisition
Raw ultrasound data were acquired in an in-phase and quadrature (IQ) form using the Siemens (Siemens Healthcare Sector, Ultrasound Business Unit, Mountain View, CA) SONOLINE Antares imaging system with the handheld VF 10-5 transducer. The linear array was used to acquire transthoracic in vivo cardiac data on two canine subjects. The mass and heart rate of each canine subject can be seen in table 1. The study was approved by the Institutional Animal Care and Use Committee at Duke University conforming to the Research Animal Use Guidelines of the American Heart Association. The data from the canine subjects was acquired without any ARFI excitation pulse. Data were acquired using a 6.67 MHz center frequency and 4-to-1 parallel receive beamforming. For each trial, the ARFI sequence consists of 20 prereference tracking A-lines, one reference A-line and 60 post-reference tracking A-lines, all evenly spaced in time. In other words, the time spans from −2.0 to +6.0 ms with a pulse repetition interval of 0.1 ms. The reference A-line is at time zero and was used to establish the initial tissue position. All subsequent (and prior) tissue displacements are measured relative to the reference A-line. For the remainder of the paper, the tracking A-lines are simply referred to as tracks. For more detail regarding the acquisition sequence, the reader is referred to Hsu et al.20 All data was processed offline using Matlab (The Mathworks, Inc., Natick, MA).
Table 1.
Comparison of canine subjects.
| Canine subject | Mass (kg) | Average heart rate (beats/min) | Maximum velocity of cardiac tissue (cm/s) |
|---|---|---|---|
| 1 (subject analyzed) | 19.5 | 140 | 14.3 |
| 2 | 18.0 | 115 | 9.27 |
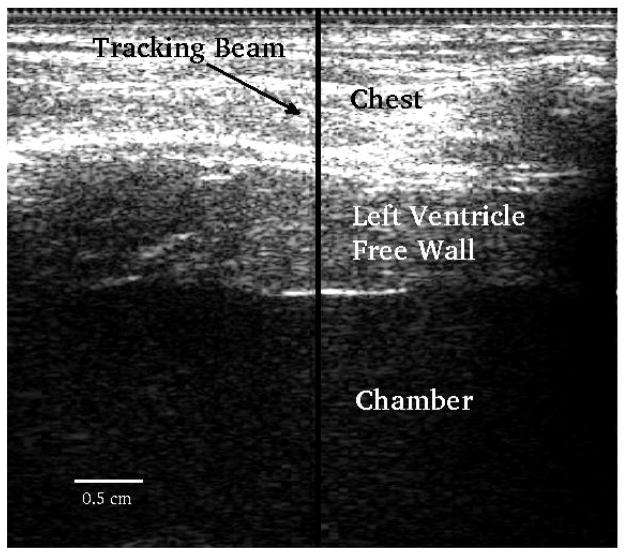
Figure 1 shows a B-mode image along with the location of the M-mode ARFI sequence. Data were acquired up to a depth of 4 cm but only regions within the left ventricle free wall were processed.
FIG. 1.
B-mode image. The transducer is located at the top of the image. The y-axis corresponds to axial depth and x-axis lateral distance. The middle part of the image between the two horizontal white lines corresponds to the left ventricle free wall. The motion filters were applied to all axial depths in the free wall. The solid black vertical line indicates the location of the M-mode ARFI sequence.
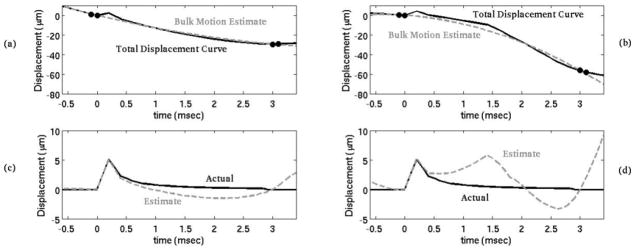
As mentioned previously, none of the acquired in vivo canine data include a pulse capable of inducing measurable radiation force displacements. Instead, a simulated ARFI displacement profile was added to each M-mode ARFI sequence immediately after the reference A-line. (Thus, it simulates an ARFI excitation pulse applied at time t = 0+). Previous work indicates that the on-axis displacement profile from an ARFI excitation in cardiac tissue in experimental settings matches well qualitatively with simulations.10,19,24,25 For a more detailed description of the finite-element method model used to simulate the dynamic response from an acoustic radiation force, the reader is referred to a paper by Palmeri et al.24 Figure 2(c) and (d) show the simulated displacement profile. As a result, both the ARFI displacement and the underlying physiological motion are known quantities.
FIG. 2.
In the top plots (a, b), the black line is the total displacement curve, containing both the physiological motion and displacement due to a simulated acoustic radiation force. The gray dotted line is an estimate of the physiological motion using a temporal interpolation motion filter. The black dots represent the points used for the motion filter. By subtracting the bulk motion estimate from the total displacement curve, the displacement due to the acoustic radiation force is isolated (c, d). (a) and (c) demonstrate a case in which the motion filter is effective while (b) and (d) demonstrates a less effective case.
Displacement using phase-shift estimation
Previous work indicates that for small displacements, there is little difference in performance when tracking with radiofrequency (rf) data compared to IQ data as long as appropriate algorithms are used.25,26 There are numerous algorithms used for phase shift estimation, the most prominent being Kasai et al’s 1-D and Loupas et al’s 2-D autocorrelarors. 27–29 While 1-D autocorrelation methods have a slight computational advantage, 2-D autocorrelation algorithms have lower jitter and bias.26 Displacement estimates derived from both 1-D and 2-D autocorrelation algorithms and the subsequent motion filtering results were tested and compared in this study.
In all cases, the displacements were estimated against a single, static reference tracking pulse (i.e. A–B, A–C, etc.). Because the phase shift (as opposed to the time delay as in normalized crosscorrelation) is used to determine the displacement of the tissue in both algorithms, phase wrapping does occur in at least some of the data. For Kasai’s algorithm, it is relatively trivial to unwrap the displacement estimates; large displacement discontinuities through time greater than half a wavelength were found in the data and shifted an entire wavelength in the opposite direction. Phase unwrapping is significantly more challenging on Loupas-derived displacement estimates. Therefore, for this work, Loupas’ algorithm was implemented as by Cohn et al where the Loupas-based displacement estimate is allowed to track the envelope producing the necessary information for phase unwrapping.30 After applying the phase-shift algorithm and before adding the simulated ARFI sequence as mentioned in the previous section, all displacements were filtered along the axial dimension with a 1.5λ long low-pass filter kernel with a cut-off frequency of 1.90 cycles/mm.
Additionally, to help monitor signal decorrelation and account for the tracking of perceived versus actual motion, a normalized correlation-coefficient value was used as an estimate of tracking efficacy. The normalized crosscorrelation was calculated over a range of displacements and the maximum value was selected, as in crosscorrelation tracking. If the peak correlation coefficient was below 0.85, it was assumed that motion could not be estimated with the quality necessary for ARFI imaging and those trials were thrown out.
Motion filters
Three types of physiological quadratic motion filters were investigated: (1) temporal interpolation, (2) temporal extrapolation and (3) a temporal weighted technique. In all three cases, a quadratic polynomial was used to model the motion:
| (2) |
The polynomial was fit using the least-squares method (where d is a vector containing displacement estimates, A is the model matrix containing times and x is the coefficient vector) for the interpolation and extrapolation filters. In all cases, the model matrix, A, was constructed to force the displacement fit through zero displacement at the reference track (i.e. no intercept was included in the model matrix). In other words:
| (3) |
For the weighted filter, the formula Wd = WAx was used, where W is the weights matrix. Figure 2 gives an example of the filtering technique for the temporal quadratic-interpolation motion filter.
1. Temporal quadratic-interpolation filter
Before investigating alternative filtering techniques, the current temporal quadratic-interpolation motion filter was investigated.10,19 Cardiac tissue is stiff; Fahey et al demonstrated full tissue recovery just 2–3 ms after the radiation force pulse,31 indicating relatively high-velocity shear-wave propagation on the order of several meters per second (max shear wave velocity varies from 2.65–5 m/s).32,33 Therefore, 3 ms was assumed to be the earliest time where postreference tracking pulses could be used to fit the physiological motion. The quadratic motion filter was quantified as a function of the ratio of prereference tracks to postrecovery tracks and as a function of the total number of tracks (ratio held constant). For example, when investigating the motion-filter effectiveness as a function of the total number of tracks, the total motion was predicted using the first prereference track at −0.1 ms before the simulated ARFI push and the first postrecovery track at 3.0 ms after the push. The results of this filter were compared to other quadratic filters also with a 1:1 prereference to postrecovery track ratio, such as one using the first two prereference tracks (−0.2 ms, −0.1 ms) and the first two postrecovery tracks (3.0 ms, 3.1 ms).
2. Temporal quadratic-extrapolation filter
Next, a temporal quadratic extrapolation filter was investigated. The extrapolation filter employs the same technique as the interpolation filter but only the tracks before the simulated ARFI push (the prereference tracks) were used as inputs to the model. The extrapolation filter was characterized as a function of the total number of prereference tracks included in the filter, ranging from 1 to 20.
3. Temporal quadratic-weighted filter
Many studies are concerned with the ARFI-induced displacements in the tissue 0.4–1.0 ms after the ARFI push pulse.10,19,20,32 A new weighted model was developed using post-reference tracks 0.4–1.0 ms after the simulated ARFI push (before full tissue recovery) instead of using any postrecovery tracks. For this method, several prereference tracks weighted 1 were combined with tracks during ARFI recovery weighted anywhere between 0 and 1 in order to fit the motion. The most challenging aspect of the weighted filter is determining how to weight the postreference tracks during ARFI recovery. The weights used were determined empirically from a nonexhaustive parameter space.
Metrics used for comparison
Two of the most useful metrics to compare the effectiveness of the various filters are bias and jitter. Bias is the mean of the displacement error between the filter’s estimate and the actual physiological motion whereas jitter is the standard deviation of the displacement error. Additionally, the mean absolute difference (MAD) and the standard deviation of the absolute difference (STDad) were computed in order to facilitate comparison with previously-published motion filtering results.10,20 The MAD is the mean of the absolute displacement error between the filter’s estimate and the actual physiological motion. Additionally, the signal to noise ratio (SNR) was computed, where the signal is the simulated ARFI displacement profile squared and the noise is the summation of the bias squared and jitter squared. Finally, the correlation coefficient (r) was used to assess how the residual physiological motion after application of the different motion filters affects the shape of the ARFI response. Equations for the metrics used are listed below, where x is the motion filter estimate [μm], y is the actual physiological motion [μm], i is each axial depth in the left ventricle free wall, t is each time point over the entire course of data collection (~0.85 s) and s is the signal.
| (4) |
| (5) |
| (6) |
| (7) |
| (8) |
III. RESULTS
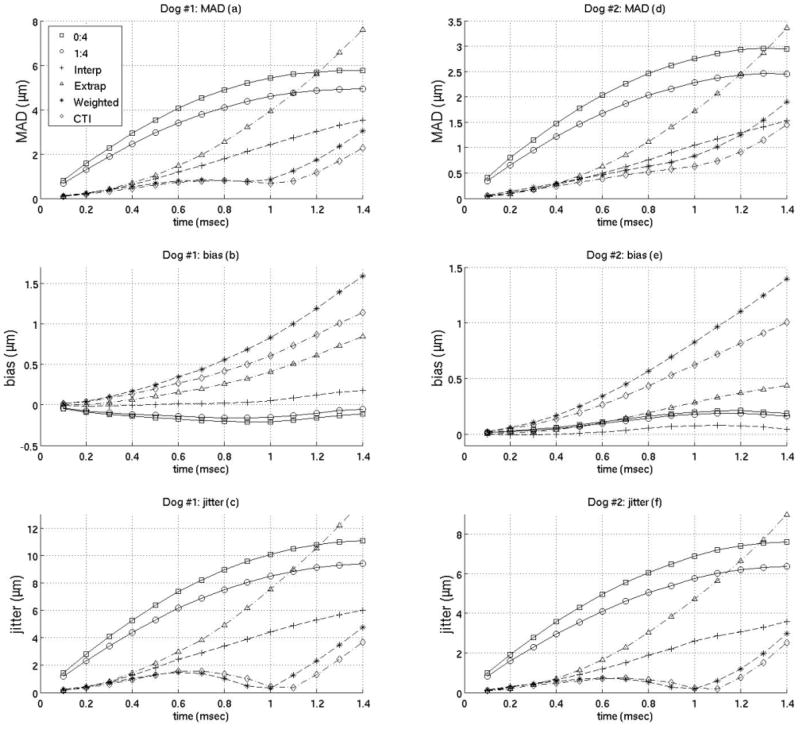
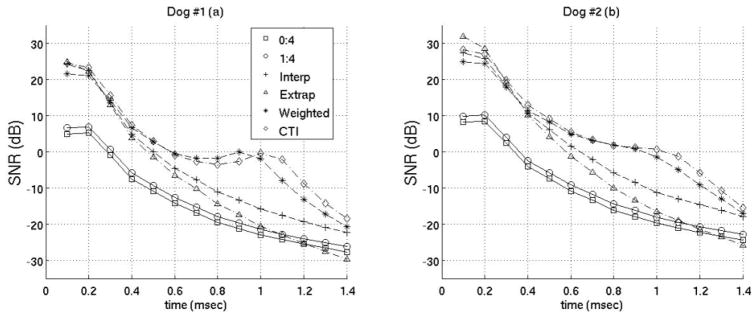
Two canine subjects were imaged for this study. Due to the large quantity of data and the consistent patterns in terms of motion filter effectiveness and similarity of results between the two subjects, only the data from one canine subject — the one with the most dynamic heart, and by extension the worst results — is shown in figures 3–7. However, data from both canine subjects is reported in figures 8 and 9, comparing the best of each type of motion filter. A comparison of the heart dynamics of the two canine subjects is shown in table 1.
FIG. 3.
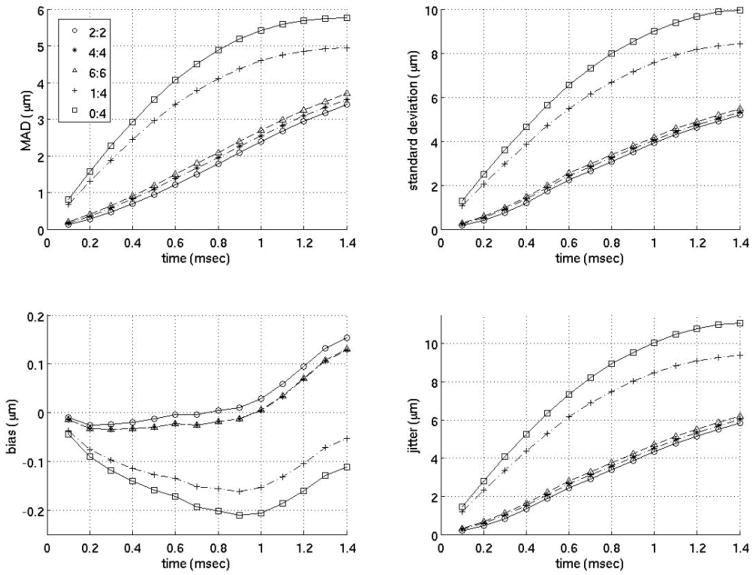
Interpolation motion filter. Plots of the mean absolute difference (MAD), standard deviation of the MAD (STD), bias and standard deviation of the bias (jitter) for an interpolation motion filter as a function of time after ARFI push. As an example, 2:2 in the legend indicates the filter used 2 prereference tracks immediately before the reference line and 2 postrecovery tracks immediately after full tissue recovery to fit the quadratic estimate of the physiological motion. (1:4 is the filter used by Bradway et al9 and 0:4 is the filter used by Hsu et al.10)
FIG. 7.
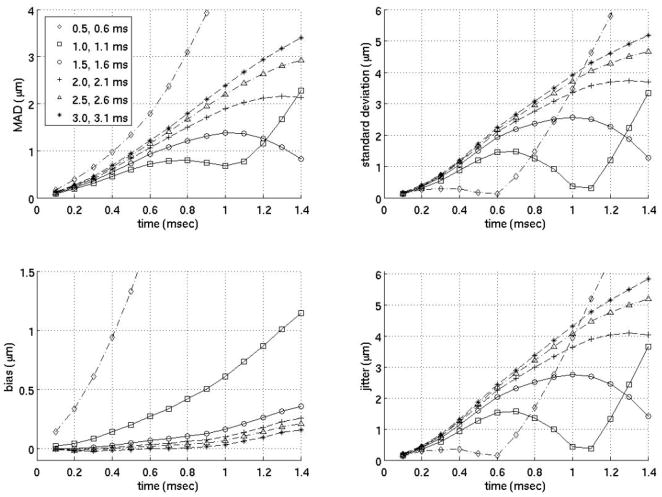
Close time interpolation motion filter. All the filters above use two prereference tracks (−0.2 ms, −0.1 ms) weighted 1 and two postreference tracks weighted 1 at varying times from 0.5 to 3.0 ms after the simulated ARFI push (as indicated on the legend).
FIG. 8.
Comparison of best motion filters. Results from both canine subjects are shown above. 0:4 and 1:4 are temporal interpolation filters applied in previous studies using zero prereference tracks and four postrecovery tracks (3.0 to 3.3 ms) and one prereference track (−0.1 ms) and four postrecovery tracks (3.0 to 3.3 ms) respectively. The interpolation filter uses two prereference tracks (−0.2 ms, −0.1 ms) and one postrecovery track (3.0 ms). The extrapolation uses four prereference tracks (−0.4 to −0.1 ms). The weighted filter uses five prereference tracks (−0.5 to −0.1 ms) weighted 1 and seven tracks from 0.4 to 1.0 ms after the simulated ARFI push weighted 0.001, 0.005, 0.01, 0.05, 0.1,0.5 and 1. The close time interpolation filter use two prereference tracks (−0.2 ms, −0.1 ms) and two post-reference tracks (1.0 ms, 1.1 ms).
FIG. 9.
SNR of best motion filters. Results from both canine subjects are shown. The filters used are the same as those in figure 8.
Both the standard deviation of the absolute difference (STDad) and the standard deviation of the bias (jitter) were plotted separately instead of as error bars in most cases. Although this is unconventional, it was done to maintain clarity and reduce clutter in all figures. The standard deviations are larger than in other studies for several reasons: (1) The motion filters were applied to all depths in the left ventricle free wall whereas previous studies only used values at a single depth.10,20 As the axial distance from the transducer increases, the performance of the motion filter generally degrades. (2) This study uses data acquired trans-thoracically, as opposed to data acquired with direct transducer contact with the heart. (3) The data employed here represents the most difficult to image of the two canines.
Interpolation filters
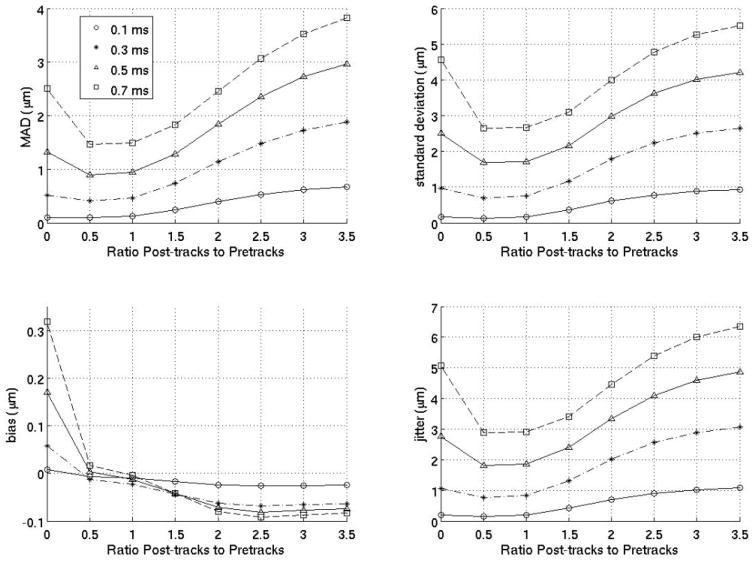
Figure 3 gives the MAD, STDad, bias, and jitter over time from 0 to 1.4 ms after the simulated ARFI push for various interpolation filters, and their performance is compared to previously-employed filters. The previously-employed filters used for comparison are a quadratic interpolation filter using no prereference tracking pulses and four postrecovery tracking pulses and a quadratic-interpolation filter using a single prereference track and four postrecovery tracking pulses. These two filters were used in previous work by Hsu et al10 and Bradway et al,20 respectively. As the results show, for cardiac imaging, it is much more effective to use interpolation filters with an equal number of prereference and postrecovery tracking pulses. To verify this observation, figure 4 compares various interpolation filters as a function of the ratio of postrecovery tracks to prereference tracks.
FIG. 4.
Interpolation motion filter. Plots for an interpolation motion filter as a function of the ratio of postrecovery tracks to prereference tracks at various times (either 0.1,0.3,0.5 or 0.7 ms) after the ARFI push. The number of prereference tracks was held constant at 2, so, for example, a ratio of 1.5 means the filter used three postrecovery tracks immediately after tissue recovery and three prereference tracks immediately prior to the ARFI push.
Extrapolation filters
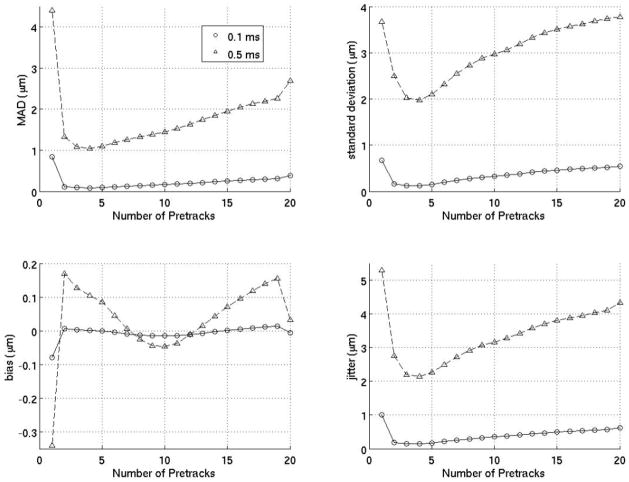
Figure 5 investigates extrapolation filters as a function of the number of prereference tracks. The results indicate that using just one prereference track is ineffective while using too many prereference tracks is inefficient as well as less effective. The ideal extrapolation filter uses about four prereference tracks.
FIG. 5.
Extrapolation motion filter. Results above are the MAD, standard deviation of the MAD (STD), bias and standard deviation of the bias (jitter) for extrapolative motion filters as a function of the number of prereference tracks at 0.1 and 0.5 ms after the ARFI push.
Weighted filters
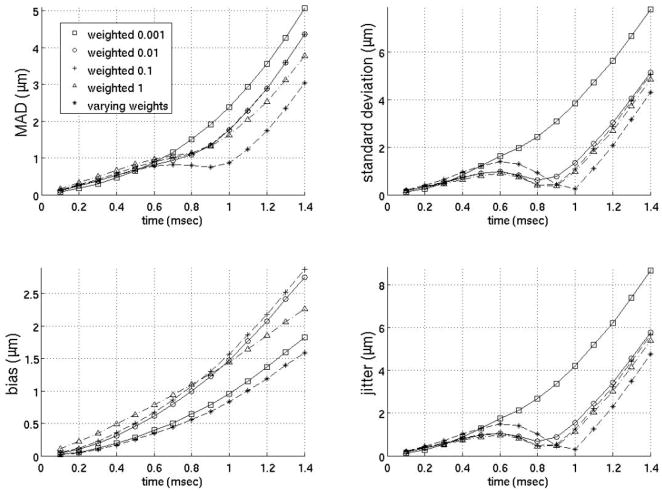
Figure 6 gives the MAD, STDad, bias and jitter of several of the weighted filters that yielded the most accurate estimates of the physiological motion. All the filters in figure 6 use five prereference tracks from −0.5 to −0.1 ms weighted 1 and seven postreference tracks from 0.4 to 1.0 ms with various weights (see figure 6 for precise weights). Since the filters in figure 6 perform similarly regardless of the weights selected, it is unclear whether the weighted motion filters were effective in estimating the physiological motion due to the weights selected or simply because of the use of postreference tracks prior to full tissue recovery from the simulated ARFI push pulse. Therefore, figure 7 plots a motion filter using two prereference tracks (−0.2 ms, −0.1 ms) and two postreference tracks at varying times from 0.5 to 3.0 ms after the simulated ARFI push pulse all weighted 1. For the remainder of the paper, the filter in figure 7 will be referred to as the close-time interpolation (CTI) motion filter.
FIG. 6.
Weightted motion filter. All the filters above used five prereference tracks (from −0.5 to −0.1 ms) weighted 1 and seven postreference tracks (from 0.4 to 1.0 ms after the ARFI push weighted as stated on the legend). The seven postreference tracks on the filter with varying weights were weighted 0.001, 0.005, 0.01, 0.05, 0.1, 0.5 and 1, respectively.
Comparison of interpolation, extrapolation and weighted motion filters
The previous plots of the MAD, STDad, bias and jitter were used to determine the best interpolation, extrapolation, and weighted filters when using Loupas’ phase-shift estimation technique. (Obviously, there may be some slight differences as to what is the best filter depending on constraints of a specific experiment). It was found the best interpolation filter used two prereference tracks (−0.2 ms, −0.1 ms) and one postrecovery track (3.0 ms). The best extrapolation filter used four prereference tracks (−0.4 to −0.1 ms). The best weighted filter used five prereference tracks (−0.5 to −0.1 ms) weighted 1 and seven postreference tracks from 0.4–1.0 ms after the simulated ARFI push weighted 0.001,0.005,0.01,0.05,0.1, 0.5 and 1 respectively. And the best close-time interpolation filter used two prereference tracks (−0.2 ms, −0.1 ms) and two postreference tracks (1.0 ms, 1.1 ms). Figures 8 and 9 compare the best filters and those used in previous works by Hsu et al and Bradway et al. Results from both canine subjects imaged are shown in figures 8 and 9 and the results between canine subjects are nearly identical. Figure 8 gives the MAD, STDad, bias and jitter of the various motion filters while figure 9 plots the SNR of the various motion filters as a function of time after the simulated ARFI push.
Additionally, table 2 gives the correlation coefficient comparing the simulated ARFI dynamic response to the estimate of the ARFI displacements after the physiological motion is removed using the most effective interpolation, extrapolation, weighted and close-time interpolation filters (filters used in figures 8 and 9). To emphasize, the r values below show correlations between the known ARFI response and the ARFI displacement estimate after filtering with the residual physiological motion present. The responses are compared for times 0.1–1.4 ms after the simulated ARFI push.
Table 2.
Correlation coefficients comparing the simulated ARFI dynamic response to the dynamic response combined with the residual physiological motion not removed by motion filtering from 0.1 to 1.4 ms after excitation.
| Filter | r |
|---|---|
| Interpolation | 0.7945 |
| Justright extrapolation | 0.6768 |
| Weighted | 0.8884 |
| Close-Time interpolation | 0.9123 |
Loupas vs. Kasai phase-shift estimation
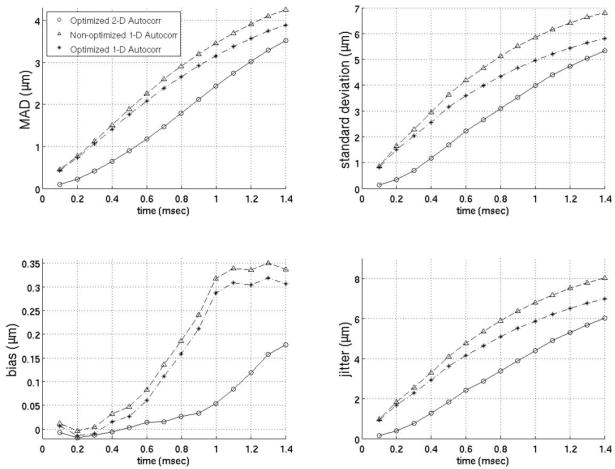
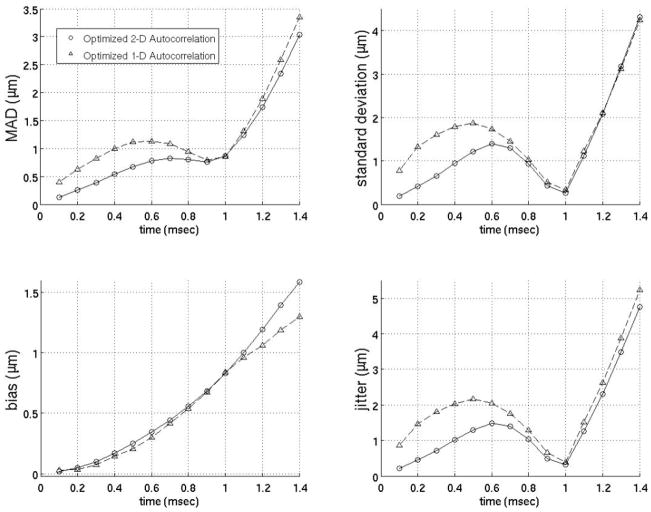
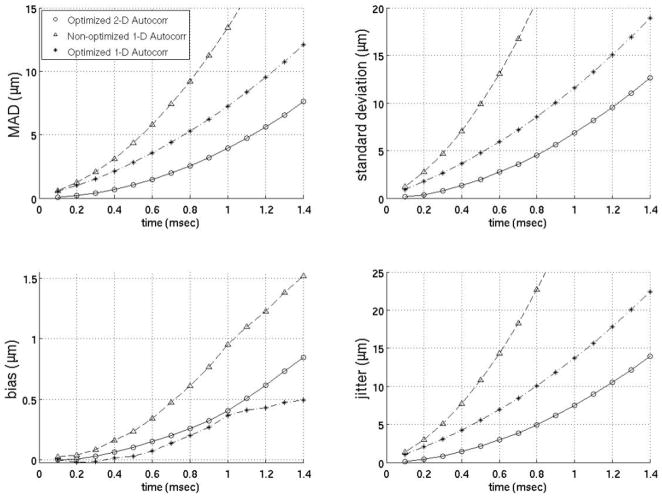
Since previous studies employing motion filters operated on displacements calculated using 1-D autocorrelation as developed by Kasai et al27 and the filters developed here (Figs. 3–9) operate on displacement estimates from 2-D autocorrelation as developed by Loupas et al,28,29 the performance of motion filters operating on displacement estimates calculated with 1- versus 2-D autocorrelation estimators are compared in figures 10–12. The best motion filters were selected for displacement estimates using 1-D autocorrelation using the same metrics as those already described and shown in figures 3–9. Figures 10–12 contain three filters: (1) the best filter based on 2-D autocorrelation derived displacement estimates, (2) the identical filter (same model matrix) as the best filter using 2-D autocorrelation based displacements but instead using 1-D autocorrelation derived displacements and (3) the filter optimized for 1-D autocorrelation-derived displacements. One interesting trend is that the models optimized for 1-D autocorrelation-derived displacement estimates do better with more points added to the model relative to models optimized for 2-D autocorrelation-derived displacements. For example, the best 1-D autocorrelation-based extrapolation filter in figure 11 uses four prereference tracks while the best 2-D autocorrelation based filter uses only four prereference tracks. As the figures show, the best 2-D autocorrelation filters give better results than the optimized 1-D autocorrelation filters, regardless of time after the ARFI push or the metric used for comparison. It is also important to note that the best 1-D autocorrelation-derived filters do perform better than an average model supplied with 2-D autocorrelation- based displacement estimates.
FIG. 10.
Comparison of 1- and 2-D autocorrelation-based phase-shift estimators for the temporal quadratic interpolation motion filter. The optimized 2-D autocorrelation and nonoptimized 1-D autocorrelation use two prereference tracks (−0.2 ms, −0.1 ms) and one postrecovery track (3.0 ms). The optimized 1-D autocorrelation uses three prereference tracks (−0.3 to −0.1 ms) and three postrecovery tracks (3.0 to 3.2 ms).
FIG. 12.
Comparison of 1- and 2-D autocorrelation-based phase-shift estimators for the temporal quadratic weighted motion filter. The optimized 2-D autocorrelation and optimized 1-D autocorrelation both use five prereference tracks (−0.5 to −0.1 ms) weighted 1 and seven postreference from 0.4 to 1.0 ms after the simulated ARFI push weighted 0.001, 0.005, 0.01, 0.05, 0.1, 0.5 and 1.
FIG. 11.
Comparison of 1- and 2-D autocorrelation-based phase-shift estimators for the temporal quadratic extrapolation motion filter. The optimized 2-D autocorrelation and nonoptimized 1-D autocorrelation use four prereference tracks (−0.4 to −0.1 ms). The optimized 1-D autocorrelation uses 14 prereference tracks (−1.4 to −0.1 ms).
Cardiac cycle
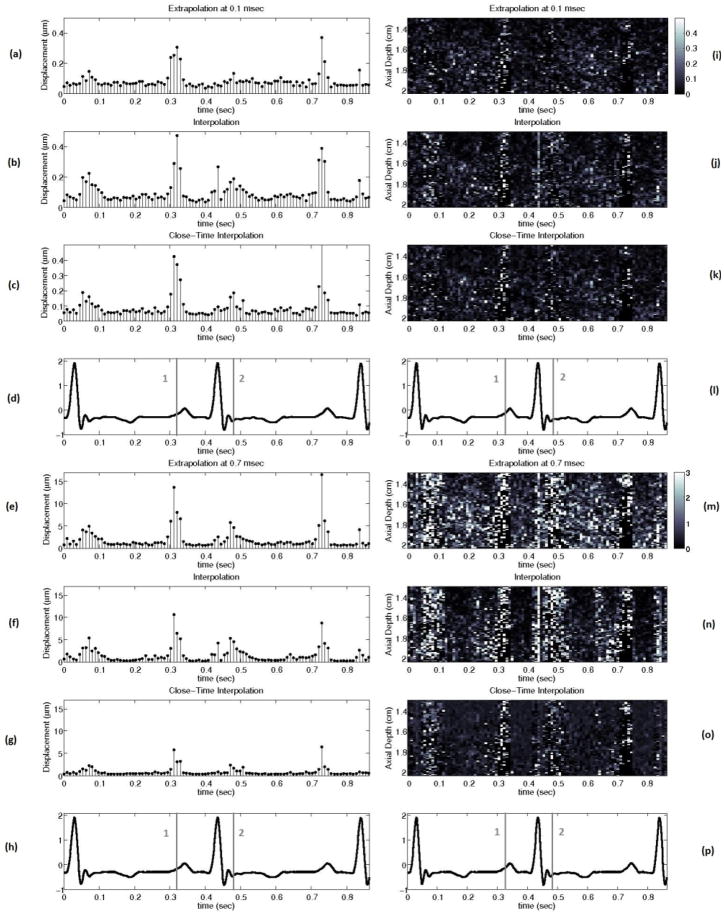
Figure 13 shows the performance of the best interpolation, extrapolation, and close-time interpolation filters using 2-D autocorrelation-derived displacement estimates throughout the cardiac cycle with a matched electrocardiogram (ECG).
FIG. 13.
(a) to (h) show the mean absolute difference between the actual ARFI displacement and the estimate of the ARFI displacement after filtering at all depths in the left ventricle free wall 0.1 and 0.7 ms after the simulated ARFI push with a matched ECG (d, h). (i) to (p) show the absolute difference between the actual ARFI displacement and the estimate of the ARFI displacement after filtering at each depth in the left ventricle free wall 0.1 and 0.7 ms after the simulated ARFI push. The gray lines labeled ‘1’ and ‘2’ on the ECG correspond to atrial systole and the onset of ventricular systole. The interpolation, extrapolation, and close-time interpolation filters used are the same as those shown in figure 8.
IV. DISCUSSION
Cardiac tissue fully recovers approximately 3 ms after acoustic radiation force excitation (for a typical push beam width on-axis).13,24,31 However, using either a weighted motion filter or close-time interpolation motion filter enables tracks at times where the ARFI displacements are still present in the cardiac tissue to be useful for motion filtering (< 3 ms). It is advantageous to use tracks prior to full tissue recovery because the majority of cardiac studies are most interested in the ARFI displacements 0.1–1.0 ms after excitation.10, 19, 20, 32 The best SNR occurs from 0.1–0.5 ms after excitation (Fig. 9) while the greatest contrast in ARFI-induced displacements during systole relative to diastole occurs from 0.5–1.0 ms after excitation and is used to determine the myocardial stiffness ratio.10
The idea behind the weighted motion filter was to weight the displacement estimates at times before full tissue recovery less than 1 so they do not have as much of an effect on the fit and are primarily used to put bounds on the physiological motion. However, as figures 6–8 demonstrate, a close-time interpolation motion filter using two tracks prior to full tissue recovery (1.0 ms, 1.1 ms) actually fits the physiological motion slightly better than any weighted motion filter. Thus, it is simply the use of tracks close to the 0.1–1.0 ms range and not the various weighting of the tracks the improves the filter’s estimate of the physiological motion relative to interpolation filters used in previous work.10, 19
The ARFI displacements still present in the tissue 1.0–1.1 ms after the simulated ARFI excitation do not have much effect on the close-time interpolation filter’s estimate of the physiological motion for a couple reasons. First, the ARFI displacements decrease exponentially after reaching a peak displacement around 0.3 ms after the simulated ARFI pulse (Fig. 2). By 1.0 ms, the ARFI displacements are just 10% of their peak value (approximately 0.5 μm in magnitude). Second, using a quadratic fit further lessens the effect of the ARFI displacement still present in the tracks because the ARFI displacement over time is not well modeled by a quadratic, whereas the physiological motion over several milliseconds can be modeled by a quadratic in most cases (Fig. 2).
The extrapolation, weighted and close-time interpolation motion filters also address one of the major challenges with cardiac ARFI imaging: signal decorrelation. When there is a significant amount of decorrelation (whether from strain, rotation, nonaxial motion, etc.), the measured displacement will stop corresponding with true displacement. This phenomenon has been observed and studied by others.34 To help monitor the decorrelation and account for perceived versus actual motion, normalized cross-correlation values were used to ensure the existence of reasonable levels of correlation. Additionally, Loupas’ phase-shift estimation as implemented by Cohn et al is susceptible to envelope-tracking errors.30 Thus, the tissue displacement between subsequent tracks was also monitored to ensure the tracking of actual motion. If the peak correlation coefficient was below 0.85 or the maximum displacement between two subsequent tracks was greater than 85 μm, it was assumed that motion could not be estimated with the quality necessary for ARFI imaging and the results from fitting those tracks were thrown out. Obviously, the farther apart in time the tracks used to fit the physiological motion are, the more likely the trial will contain sufficiently-decorrelated signals and thus meet the criteria for being eliminated. From this perspective, motion filters that require tracking the displacements for the least amount of time are most ideal. As table 3 shows, there are essentially no trials with a correlation coefficient below 0.85 or displacement between subsequent tracks greater than 85 μm when using an extrapolation filter that requires tracking for just 0.5 ms but there is significant decorrelation when using an interpolation filter that requires tracking over 3 ms.
Table 3.
Percentage of trials deemed too poor for ARFI imaging (correlation coefficient below 0.85 or peak hop greater than 85 μm).
| Time-of-displacement estimates used (ms) | Number of trials (out of 9,100) | Percentage of trials (%) |
|---|---|---|
| −0.2 to 3.1 (best interpolation) | 973 | 10.69 |
| −0.4 to 0 (best extrapolation) | 3 | 0.03 |
| −0.5 to 1.0 (best weighted) | 75 | 0.82 |
| −0.2 to 1.1 (best close time interpolation) | 98 | 1.08 |
Another important observation is that using more data does not necessarily yield better results. For example, figure 3 reveals that an interpolation filter using two prereference tracks (from −0.2 to −0.1 ms) and two postreference tracks (from 3.0 to 3.1 ms) gives a better estimate of that actual physiological motion than an interpolation filter using four prereference tracks (from −0.4 to −0.1 ms) and four postreference tracks (from 3.0 to 3.4 ms). A quadratic model is assumed. The fact that the physiological motion more closely resembles a quadratic when fewer points are used implies that a quadratic model is an imperfect representation of the physiological motion and it may be worth finding a better model for the motion in the future. While this result is a limitation, the quadratic motion filter is still an effective technique.
The results of this study clearly demonstrate the extrapolation, weighted and close-time interpolation motion filters are preferable to currently-used interpolation filters. Figure 13 shows that an extrapolation filter results in the most accurate estimate of the physiological motion if one is concerned with the ARFI displacements almost immediately after the ARFI push pulse (< 0.2 ms). However, a close-time interpolation filter gives the most accurate estimate at later times after the ARFI push pulse (> 0.5 ms) and does the best job of preserving the overall ARFI response curve, which is important for parametric ARFI methods. From 0.2–0.5 ms after the push pulse, the optimal interpolation, extrapolation, close-time interpolation and weighted techniques perform about the same (Fig. 8). As a result, the extrapolation filter should be used up to 0.5 ms since it both allows the fastest ARFI frame rate and is subject to the least amount of signal decorrelation (Table 3). Regardless of the type of motion filter used, it is least accurate during a trial systole and the onset of ventricular systole (Fig. 13). During these phases, motion is not as well modeled by any of the models tested to date. It is possible that an adaptive method that applies different models during different phases of the heart cycle may solve this problem.
There is one minor limitation of our method that should be discussed. In practice, an ARFI push pulse creates shearing under the imaging point spear function (PSF) which thereby causes the ultrasonic, correlation-based tracking methods to have a negative bias and underestimate the actual tissue displacements.24, 25 This ARFI -induced decorrelation alters tracking performance and is not accounted for in the finite-element method model used to create the simulated ARFI displacement profile. However, the displacement underestimation occurs at extremely early time steps almost immediately after the ARFI push pulse. None of the motion filters in this paper use displacement estimates from 0+ to 0.3 ms after the simulated ARFI push pulse and thus the motion filter performance is only minimally affected.
While this study only investigates a specific case — transthoracic cardiac ARFI in a medium noise environment — the physiological motion filters can potentially be applied to a broad range of scenarios. For example, similar motion filters have already been applied to open-chested cardiac ARFI (a low noise environment) and cardiac SWEI10,32 and the results from these studies suggest that the general ranking of motion filters from least to most effective is consistent. The motion filters also have potential in thermal-strain imaging and photoacoustic-imaging scenarios35, 36 where cardiac motion is a dominant noise source that must be eliminated.
V. CONCLUSION
This study demonstrates the ability to eliminate physiological motion in a clinically- feasible manner, opening the door for more extensive clinical experimentation. While, the extrapolation, weighted and close-time interpolation motion filters offer promising results for estimating cardiac physiological motion both more accurately and at a faster ARFI frame rate than previous motion filters, improvements to the motion filters during atrial systole and the onset of ventricular systole need to be made. Future studies are planned using in vivo data with non-zero ARFI excitations.
Acknowledgments
The authors thank Siemens Medical Solutions USA, Inc. for their system support. This research was funded by NIH Grants T32EB001040 and R37-HL-096023. The authors also thank the Duke University Pratt Fellows Program, Dr. Steven Hsu, Dr. Mark Palmeri, Dr. Patrick Wolf, Ellen Dixon-Tulloch and Dr. Jeremy Dahl.
References
- 1.Gary R, Davis L. Diastolic heart failure. Heart Lung. 2008;37:405–416. doi: 10.1016/j.hrtlng.2007.12.002. [DOI] [PubMed] [Google Scholar]
- 2.Zile M, Baicu C, Gaasch W. Diastolic heart failure-abnormalities in active relaxation and passive stiffness of the left ventricle. New England J Med. 2004;350:1953–1959. doi: 10.1056/NEJMoa032566. [DOI] [PubMed] [Google Scholar]
- 3.Borbely A, van der Velden J, Papp Z, et al. Cardiomyocyte stiffness in diastolic heart failure. Circulation. 2005;111:774–781. doi: 10.1161/01.CIR.0000155257.33485.6D. [DOI] [PubMed] [Google Scholar]
- 4.Cingolani O, Yang X, Cavasin M, Carretero O. Increased systolic perofrmance with diastolic dysfuction in adult spontaneously hyertensive rats. Hypertension. 2003;41:249–254. doi: 10.1161/01.hyp.0000052832.96564.0b. [DOI] [PubMed] [Google Scholar]
- 5.Kheradvar A, Milano M, Gorman R, et al. Assessment of left ventricular viscoelastic components based on ventricular harmonic behavior. Cardiovascular Eng. 2006;6:31–39. doi: 10.1007/s10558-006-9001-9. [DOI] [PubMed] [Google Scholar]
- 6.Greenleaf JF, Urban MW, Chen S. Measurement of tissue mechanical properties with shear wave dispersion ultrasound vibrometry (SDUV) Conf Proc IEEE Eng Med Biol Soc 2009. 2009:4411–4414. doi: 10.1109/IEMBS.2009.5333694. [DOI] [PubMed] [Google Scholar]
- 7.Zheng Y, Yao A, Chen S, Greenleaf J. Measurement of shear wave using ultrasound and kalman filter with large background motion for cardiovascular studies. Proc IEEE Ultrasonics Symp. 2006;1–5:718–721. [Google Scholar]
- 8.Nenadic I, Urban MW, Greenleaf JF. Ex vivo measurements of myocardial viscoelasticity using shearwave dispersion ultrasound vibrometry (SDUV) Conf Proc IEEE Eng Med Biol Soc 2009. 2009:2895–2898. doi: 10.1109/IEMBS.2009.5334448. [DOI] [PubMed] [Google Scholar]
- 9.Pernot M, Mace E, Dubois R, et al. Mapping myocardial elasticity changes after RF-ablation using supersonic shear imaging. Proc CinC. 2009:793–796. [Google Scholar]
- 10.Hsu SJ, Bouchard RR, Dumont DM, et al. In vivo assessment of myocardial stiffness with acoustic radiation force impulse imaging. Ultrasound Med Biol. 2007;33:1706–1719. doi: 10.1016/j.ultrasmedbio.2007.05.009. [DOI] [PMC free article] [PubMed] [Google Scholar]
- 11.Nightingale K, Palmeri ML, Nightingale RW, Trahey GE. On the feasibility of remote palpation using acoustic radiation force. J Acoust Soc Amer. 2001;110:625–634. doi: 10.1121/1.1378344. [DOI] [PubMed] [Google Scholar]
- 12.Dahl JJ, Pinton GF, Palmeri ML, et al. A parallel tracking method for acoustic radiation force impulse imaging. IEEE Trans Ultrason Ferroelectr Freq Contr. 2007;54:301–312. doi: 10.1109/tuffc.2007.244. [DOI] [PMC free article] [PubMed] [Google Scholar]
- 13.Fahey BJ, Palmeri ML, Trahey GE. The impact of physiological motion on tissue tracking during radiation force imaging. Ultrasound Med Biol. 2007;33:1149–1166. doi: 10.1016/j.ultrasmedbio.2007.01.007. [DOI] [PMC free article] [PubMed] [Google Scholar]
- 14.Heimdal A, Stoylen A, Torp H, Skjaerpe T. Real-time strain rate imaging of the left ventricle by ultrasound. J Amer Soc Echocardiogr. 1998;11:1013–1019. doi: 10.1016/s0894-7317(98)70151-8. [DOI] [PubMed] [Google Scholar]
- 15.Meyer RA. History of ultrasound in cardiology. J Ultrasound Med. 2004;23:1–11. doi: 10.7863/jum.2004.23.1.1. [DOI] [PubMed] [Google Scholar]
- 16.Konofagou EE, D’Hooge J, Ophir J. Myocardial elastography - a feasibility study in vivo. Ultrasound Med Biol. 2002;28:475–482. doi: 10.1016/s0301-5629(02)00488-x. [DOI] [PubMed] [Google Scholar]
- 17.Cheung MMH, Smallhorn JF, McCrindle BW, et al. Non-invasive assessment of ventricular force-frequency relations in the univentricular circulation by tissue doppler echocardiography: A novel method of assessing myocardial performance in congenital heart disease. Heart. 2005;91:1338–1342. doi: 10.1136/hrt.2004.048207. [DOI] [PMC free article] [PubMed] [Google Scholar]
- 18.Price DJA, Wallbridge DR, Stewart MJ. Tissue Doppler imaging: Current and potential clinical applications. Heart. 2000;84:11–18. doi: 10.1136/heart.84.suppl_2.ii11. [DOI] [PMC free article] [PubMed] [Google Scholar]
- 19.Bradway DP, Hsu SJ, Fahey BJ, et al. Transthoracic cardiac acoustic radiation force impulse imaging: a feasibility study. Proc IEEE Ultrasonics Symp. 2007;1–6:448–451. [Google Scholar]
- 20.Hsu SJ, Bouchard RR, Dumont DM, et al. Novel acoustic radiation force impulse imaging methods for visualization of rapidly moving tissue. Ultrasonic Imaging. 2009;31:183–200. doi: 10.1177/016173460903100304. [DOI] [PMC free article] [PubMed] [Google Scholar]
- 21.Nightingale K, Soo MS, Nightingale RW, Trahey GE. Acoustic radiation force impulse imaging: In vivo demonstration of clinical feasibility. Ultrasound Med Biol. 2002;28:227–235. doi: 10.1016/s0301-5629(01)00499-9. [DOI] [PubMed] [Google Scholar]
- 22.Fahey BJ, Hsu SJ, Trahey GE. A novel motion compensation algorithm for acoustic radiation force elastography. IEEE Trans Ultrason Ferroelectr Freq Contr. 2008;55:1095–1111. doi: 10.1109/TUFFC.2008.762. [DOI] [PMC free article] [PubMed] [Google Scholar]
- 23.Lubinski MA, Emelianov SY, O’Donnell M. Speckle tracking methods for ultrasonic elasticity imaging using short-time correlation. IEEE Trans Ultrason Ferroelectr Freq Contr. 1999;46:82–96. doi: 10.1109/58.741427. [DOI] [PubMed] [Google Scholar]
- 24.Palmeri ML, Sharma AC, Bouchard RR, et al. A finite-element method model of soft tissue response to impulsive acoustic radiation force. IEEE Trans Ultrason Ferroelectr Freq Contr. 2005;52:1699–1712. doi: 10.1109/tuffc.2005.1561624. [DOI] [PMC free article] [PubMed] [Google Scholar]
- 25.Palmeri ML, McAleavey SA, Trahey GE, Nightingale KR. Ultrasonic tracking of acoustic radiation force-induced displacements in homogeneous media. IEEE Trans Ultrason Ferroelectr Freq Contr. 2006;53:1300–1313. doi: 10.1109/tuffc.2006.1665078. [DOI] [PMC free article] [PubMed] [Google Scholar]
- 26.Pinton GF, Dahl JJ, Trahey GE. Rapid tracking of small displacements with ultrasound. IEEE Trans Ultrason Ferroelectr Freq Contr. 2006;53:1103–1117. doi: 10.1109/tuffc.2006.1642509. [DOI] [PubMed] [Google Scholar]
- 27.Kasai C, Namekawa K, Koyano A, Omoto R. Real-time two-dimensional blood-flow imaging using an auto-correlation technique. IEEE Trans Sonics Ultrason. 1985;32:458–464. [Google Scholar]
- 28.Loupas T, Peterson RB, Gill RW. Experimental evaluation of velocity and power estimation for ultrasound blood-flow imaging, by means of a 2-dimensional autocorrelation approach. IEEE Trans Ultrason Ferroelectr Freq Contr. 1995;42:689–699. [Google Scholar]
- 29.Loupas T, Powers JT, Gill RW. An axial velocity estimator for ultrasound blood-flow imaging, based on a full evaluation of the doppler equation by means of a 2-dimensional autocorrelation approach. IEEE Trans Ultrason Ferroelectr Freq Contr. 1995;42:672–688. [Google Scholar]
- 30.Cohn NA, et al. An elasticity microscope. IEEE Trans Ultrason Ferroelectr Freq Contr. 1997;44:1304–1319. [Google Scholar]
- 31.Fahey BJ, Nightingale KR, McAleavey SA, et al. Acoustic radiation force impulse imaging of myocardial radiofrequency ablation: initial in vivo results. IEEE Trans Ultrason Ferroelectr Freq Contr. 2005;52:631–641. doi: 10.1109/tuffc.2005.1428046. [DOI] [PubMed] [Google Scholar]
- 32.Bouchard RR, Hsu SJ, Wolf PD, Trahey GE. In vivo cardiac, acoustic-radiation-force-driven, shear wave velocimetry. Ultrasonic Imaging. 2009;31:201–213. doi: 10.1177/016173460903100305. [DOI] [PMC free article] [PubMed] [Google Scholar]
- 33.Pernot M, Fujikura K, Fung-Kee-Fung S, Konofagou E. Ecg-gated, mechanical and electromechanical wave imaging of cardiovascular tissues in vivo. Ultrasound Med Biol. 2007;33:1075–1085. doi: 10.1016/j.ultrasmedbio.2007.02.003. [DOI] [PubMed] [Google Scholar]
- 34.Kallel F, Bertrand M, Meunier J. Speckle motion artifact under tissue rotation. IEEE Trans Ultrason Ferroelectr Freq Contr. 1994;41:105–122. doi: 10.1109/58.764845. [DOI] [PubMed] [Google Scholar]
- 35.Shi Y, de Ana FJ, Chetcuti SJ, O’Donnell M. Motion artifact reduction for ivus-based thermal strain imaging. IEEE Trans Ultrason Ferroelectr Freq Contr. 2005;52:1312–1319. doi: 10.1109/tuffc.2005.1509789. [DOI] [PubMed] [Google Scholar]
- 36.Sethuraman S, Rakalin A, Aglyamov S, et al. Temperature monitoring in intravascular photoacoustic imaging. Proc IEEE Ultrasonics Symp. 2006;1–5:714–717. [Google Scholar]


