

Abstract
Many complex diseases are influenced by genetic variations in multiple genes, each with only a small marginal effect on disease susceptibility. Pathway analysis, which identifies biological pathways associated with disease outcome, has become increasingly popular for genome-wide association studies (GWAS). In addition to combining weak signals from a number of SNPs in the same pathway, results from pathway analysis also shed light on the biological processes underlying disease. We propose a new pathway-based analysis method for GWAS, the supervised principal component analysis (SPCA) model. In the proposed SPCA model, a selected subset of SNPs most associated with disease outcome is used to estimate the latent variable for a pathway. The estimated latent variable for each pathway is an optimal linear combination of a selected subset of SNPs; therefore, the proposed SPCA model provides the ability to borrow strength across the SNPs in a pathway. In addition to identifying pathways associated with disease outcome, SPCA also carries out additional within-category selection to identify the most important SNPs within each gene set. The proposed model operates in a well-established statistical framework and can handle design information such as covariate adjustment and matching information in GWAS. We compare the proposed method with currently available methods using data with realistic linkage disequilibrium structures and we illustrate the SPCA method using the Wellcome Trust Case-Control Consortium Crohn Disease (CD) dataset.
Keywords: SNPs, genome-wide association, pathway analysis, principal component analysis
1. INTRODUCTION
With the rapid development of genotyping technology, genome-wide association studies (GWAS) have become a popular approach for the identification of genes and genetic variants involved in complex diseases. A series of published results have demonstrated successful identification of SNPs involved in complex traits (McCarthy et al., 2008; Manolio et al., 2009; Wellcome Trust Case Control Consortium, 2007). While the standard approach for GWAS has been single SNP analysis, recently, pathway-based analysis methods have also been proposed (Chasman, 2008; Schwarz et al., 2008; Wang et al., 2007). These methods allow the integration of gene annotation databases such as Gene Ontology (Ashburner et al., 2000) to formally test for subtle but coordinated effects of the genetic variants in each pathway. Pathway analysis has been used widely in the analysis of gene expression data and has been shown to be an effective tool for delineating the underlying biological processes involved in transcriptome changes (Subramanian et al., 2005; Goeman et al., 2007; Wang et al., 2008; Chen et al., 2008).
Integrating prior biological knowledge into association studies and identifying pathways with disease association also can be valuable for GWAS for several reasons: (1) because the underlying biological mechanism for complex diseases is likely to be dependent on perturbation of different biological pathways, pathway analysis may approximate the true disease process more closely and shed biological insight; (2) while SNPs that are truly associated with disease but have only mild effects will likely be missed by single SNP analysis, pathway-based analysis provides a way to combine weak signals from the individual variants in each pathway to improve power; and (3) as the number of genomic markers on high-density SNP chips increases, brute-force searching for groups of SNPs that jointly affect disease outcome is becoming less feasible. Gene annotation databases, however, provide an automatic way of grouping SNPs on functionally related genes.
Several recent papers have explored the feasibility of pathway analysis for GWAS. In an interesting paper, Chasman (2008) evaluated the utility of gene set analysis methods based on Fisher’s exact test, which tests for overrepresentation of SNPs associated with disease within a pathway. Along the same lines, Wang et al. (2008) adapted the gene set enrichment analysis (GSEA) method of Subramanian et al. (2005) to GWAS, to test the distribution of association between outcome and genes within a pathway versus that between outcome and other genes using a modified Kolmogorov-Smirnov test. Goeman et al. (2007) classified pathway analysis into two categories: competitive and self-contained tests. A competitive test compares test statistics for genes in the pathway to a background defined by the complement of that pathway. Both Fisher’s exact test and GSEA are competitive tests. A self-contained test, in contrast, compares the gene set to a fixed standard that does not depend on the measurement of genes outside the pathway.
In this paper, we propose a new, self-contained test for testing association between a group of SNPs in a pathway with qualitative and quantitative traits using a modified principal component analysis (PCA) approach. PCA, a popular method for reducing high dimensionality to capture variations in gene expression or SNP markers, has been applied to gene expression pathway analysis, multi-locus association studies, and population structure correction (Tomfohr et al., 2005; Gauderman et al., 2007; Wang and Abbott, 2008; Zhu et al., 2002). In the analysis of GWA studies, PCA is an effective approach for testing association of the joint effects of genetic variations in genes/SNPs with phenotypic variations while accounting for correlations between the SNPs due to linkage disequilibrium (LD). However, one limitation of PCA is that the latent variable identified by the PCs may or may not be related to clinical phenotypes (Bair et al., 2004; Bair et al., 2006).
To address this difficulty, Bair and colleagues (2004, 2006) proposed the supervised PCA (SPCA) method, which estimates PCs from a selected subset of genes most associated with outcome, instead of performing PCA on all genes. Because initial screening of the variables uses outcome (e.g., disease status) information, this method is referred to as supervised. In the context of prediction analysis, SPCA has been shown to have excellent performance at predicting survival and continuous outcomes using gene expression data (Bair et al., 2004; Bair et al., 2006).
In this paper, we adapt the SPCA model to pathway-based SNP association analysis to test the association between a group of SNPs and variation in disease outcome. In Section 2, we first give an overview of the proposed method. Then, using genotype data with realistic patterns of linkage disequilibrium and allele frequencies, we conduct a simulation study that compares our method with an unsupervised PCA method, Fisher’s exact test, GSEA and the sum statistic (Hoh et al. 2001). In Section 3, we describe the details of the simulation study results and illustrate the SPCA model using a real Crohn’s disease case-control GWAS dataset. Finally, we provide some concluding comments in Section 4.
2. METHODS
2.1 An Overview of the Proposed Supervise Principal Component Analysis (SPCA) Method
The idea behind the SPCA model is that within a biological pathway, genetic variations in a subset of SNPs, each contributing a modest amount to disease predisposition, work together to disrupt normal biological processes. For simplicity, we use the terms “gene category”, “pathway”, and “gene set” interchangeably, although they may not be strictly equivalent. Given a gene category defined a priori (e.g., categories from the Gene Ontology or KEGG database), we first map SNPs on an array to groups of genes within each category. Then we select a subset of SNPs most associated with disease outcome and estimate the latent variable through PCA of this subset. Finally, to identify gene categories associated with disease outcome, we test for association between the estimated latent variable and disease outcome using a linear model. SPCA uses outcome information in the initial SNP screening; to account for this step, we propose an approximation to the sampling distribution of the test statistic in the linear model, which uses a Gumbel extreme value mixture distribution. In addition, to account for the effect of pathway size, we propose a simulation-based standardization procedure.
In the proposed model, the estimated latent variable is an optimal linear combination of a selected subset of SNPs; therefore, the proposed SPCA model provides the ability to borrow strength across both disease-predisposing and disease-protective SNPs in a pathway. In addition to identifying SNP pathways associated with disease outcome, SPCA also carries out within-category selection to identify the most important SNPs within each gene set (see details in Section 3). Finally, the proposed model operates in a well-established statistical framework and can handle design information such as covariate adjustment and matching information in a GWAS.
2.2 Supervised PCA Model
The SPCA model is discussed in detail in Bair and Tibshirani (2004), Bair et al. (2006), and Chen et al. (2008). Here we discuss the application of a SPCA model to pathway-based analysis of association studies. We discuss the application of a SPCA model to pathway-based analysis of association studies. The SPCA model estimates and tests disease association with principal component scores that account for correlations in the SNPs due to Linkage Disequilibrium (LD). The assumption behind the supervised PCA model is that within a gene set defined a priori, genetic variations in a subset of the SNPs are associated with a latent variable, which then varies with the outcome. Our objective is then to select the subset of relevant SNPs, estimate the latent variable, and assess its statistical association with outcome. To this end, we used the following supervised PCA model:
| (1) |
where pj = Pr (Patient j has disease phenotype ∣ PC1), and PC1 is the first principal component score estimated from the selected subset of relevant SNPs in a predefined gene set G and represents the latent variable for the underlying biological process associated with this group of genes. Magnitude of loadings for the first principal component score can be viewed as an estimate of the amount of contribution from different genetic variants. Statistical significance of β̂1 indicates a significant association between SNPs in gene set G and outcome. In theory, in addition to PC1, it is also possible to include additional PC scores in Model 1; however, we have found that models with PC1 as the only predictor have worked well in practice (see results on simulation and real data analysis in Section 3) because of the LD among SNPs in the same pathway.
For each pathway, we follow these steps:
For each SNP, compute an association measure by fitting a logistic regression model with disease status as the outcome variable and genotype (0, 1, 2) as the predictor. For the ith SNP, let the association measure pi be the single SNP p-value (i.e. p-value corresponding to regression coefficient for genotype in the logistic model).
Given all SNPs in the geneset G, pre-determine a set of m threshold values for the association measures: we let {r1, r2,…, rm} be a linearly ordered subset of real numbers such that r1 < r2… < rm. In this paper, for the simulation study and real dataset analysis, we used m = 20 thresholds by placing the thresholds at each increment of 5 percentiles of the association measures (single SNP p-values in (1)).
For a given threshold value rk, let Λk {SNPi ⊆ G: pi < rk, i = 1,.., nSNPs} be the subset of SNPs with association measures below the threshold. Compute the first principal component score PC1 using only SNPs in Λk and fit Model 1.
Let Tk = β̂1k / s.e. (β̂1k) be the t-statistic corresponding to PC1 (computed using SNPs corresponding to threshold Λk) in Model 1. Therefore, for the m threshold values, we have m t-statistics{T1, T2,…, Tm}. Let , in the next section, we derive the asymptotic distribution of this statistic.
2.3 Asymptotic Distribution of Mn
Without the gene selection process, when all genes in a gene set defined a priori are included in analysis, the test statistic T = β̂1 / s.e.(β̂1) in Model 1 follows a t-distribution. However, after the SNP selection step in Section 2.2, the test statistic can no longer be approximated well using a t-distribution.
Given a set of normal random variables{T1,…,Tn}, let . In this section, first we describe the Gumbel extreme value distributions for modeling the maximum and minimum of a set of n normal random variables, then we show the distribution of Mn follows a two-component mixture distribution based on the Gumbel extreme value distributions. In Section 2.4, we discuss practical applications of the theory to the analysis of gene sets.
Given a set of normal random variables{T1,…,Tn}, under regularity conditions (Leadbetter et al., 1982), the maximum can be shown to follow the Gumbel maximum distribution:
| (2) |
wheret1 = an (un − bn), an = (2 log n)1/2 and bn = (2 log n)1/2 −0.5(2 log n)−1/2 (log log n + log 4 π). Here, the normalizing constants an and bn serve as scale and location parameters of the distribution. In gene set analysis, given a set of t-statistics from fitting Model 1 at different thresholds, an and bn help normalize the effect of gene set size n. In Section 2.4, we show this important property of the extreme value distribution helps to increase the computational efficiency dramatically, by allowing us to pool Mn values for genesets with different gene set sizes in a given study. Next, the corresponding density function for the maximum is
| (3) |
Similarly, let , the distribution function for the minimums can be derived as
| (4) |
The density function for the minimum is then
| (5) |
where t2 = an (un + bn).
Now, for a given gene set, let , and p = Pr(Mn > 0), then the distribution function for Mn can be approximated as a two component mixture distribution:
| (6) |
The conditioning argument in the third line above follows because if Mn is positive, then Mn must be the maximum of all t-statistics {Tk; k =1,…,n}, so Mn = M1n and can be approximated with a Gumbel maximum distribution. Similarly, if Mn is negative, then Mn must be the minimum of all {Tk; k = 1,…, n}, so Mn = M2n and can be approximated with a Gumbel minimum distribution. The corresponding density function for the mixture distribution is then
| (7) |
2.4 Application of the Theory to Significance Testing in Gene Set Analysis
When applying the theory in Section 2.3 to gene set analysis, we note that several assumptions are violated: for each gene set, to keep the amount of computation manageable, only a finite number (m = 20) of t-statistics can be computed. Let n = pathway size or the number of SNPs, m = number of thresholds of association measures in step (2) of Section 2.2. Note that when the thresholds are placed at small intervals (e.g. at every increment of 5 percentiles of the t-statistics), where Δ = interval length, or the number of SNPs within the interval. In addition, from fitting Model 1 using SNPs corresponding to each threshold, we have a set of t-scores instead of normal scores, and the t-scores are correlated by construction. Therefore, the approximation in equation (6) and (7) may not be precise.
Given a large number of gene sets, to estimate p-values for each gene set accurately, our strategies are to use the theory in Section 2.3 to account for different gene set sizes, and then model the null distribution of Mm by generating random outcomes for each gene set, pooling Mm values for all gene sets, and estimating (additional) parameters of the mixture distribution. More specifically, we follow these steps:
Generate random outcomes for each gene set. For each gene set, fixing the genotype dataset, we generate disease status for each sample from a Bernouli distribution with parameter q where q is the proportion of case samples.
For each gene set, fit Model 1 for SNPs corresponding to each of the m = 20 thresholds, and compute Mm.
Pooling Mm values from all gene sets, we then have the null distribution for Mm. Because the disease outcomes were generated randomly, without looking at the SNP values, the resulting Mm values represent a random sample from the null distribution of Mm.
-
However, the p-values estimated directly using the null distribution in (iii) will often be coarse, when the number of gene sets tested in the study is only moderately large (a few hundreds to a thousand). To further improve accuracy in estimation of gene sets p-values, we add additional location and scale parameters to equation (7), by letting and for the parts correspond to maximum and minimum in equation (7) respectively.
So the density function (7) then becomes
Given a set of Mm values for the null gene sets (from (iii)) and the mixture density function (8), the parameters p, δ1, δ2, γ1, γ2 can then be estimated easily. We used the R function optim for the analysis in this study. To estimate p-values for each gene set, we then substitute these estimated parameters into the distribution function with the additional parameters:(8)
2.5 Design of a Simulation Experiment
We compared the performance of the supervised PCA model for pathway analysis of SNP data with several popular pathway analysis methods: Fisher’s exact test, GSEA (Holden et al. 2008), sum statistic (Hoh et al. 2001) and an unsupervised PCA model. First, from the Gene Ontology (GO) database, we randomly selected 50 gene categories. For each gene category, we obtained the list of SNPs within 5KB up- or downstream from genes in the gene set using the Ensembl database. Among the 50 selected gene sets, the number of SNPs per gene set varied from 11 to 295. We limited these SNPs to those from the Perlegen GV4 SNP chip, resulting in a total of 4035 SNPs across the selected 50 gene sets.
To generate samples of genotype data with realistic allele frequencies and linkage disequilibrium patterns, we used the web-based simulation tool HAP-SAMPLE (Wright et al., 2007). HAP-SAMPLE simulates genotype datasets by resampling chromosome-length haplotypes from existing phased datasets, such as the HapMap dataset, thus preserving realistic data structure in association studies. In this simulation, the SNP IDs of the 4035 SNPs from the selected 50 gene sets across different chromosome were entered into HAP-SAMPLE, and the Caucasian cohort (CEU) (parent data from phase II) was used as the source data. The haplotypes for each chromosome were generated from HapMap samples, and haplotypes between chromosomes were assumed to be independent. A total of 20,000 genotype samples were generated. This represents the genotype dataset for an artificial but realistic finite population of patients from which we can sample.
To construct causal gene sets, fixing the genotype data, for each gene set, we next simulated case-control status for the patients according to the multiplicative disease model. More specifically, for the first five gene sets (sorted by GO ID) with SNP set sizes 138, 145, 216, 254, and 262, respectively, we generated disease outcome for each patient based on the multiplicative disease model. Let gi = 0, 1, 2 represent the number of copies of the risk allele for SNP i (i=1,…, D), where D is the number of SNPs in the gene set associated with disease, and let f = Pr (affected ∣ g1,…, gD) be the penetrance for genotype {g1,…, gD}. Then, assuming the multiplicative genetic model , we independently generated βi(i = 1,…, D) from a N(μ, σ2) where μ = log(1.1) and σ2 = 0.15,0.2,0.25,0.3. We assumed the number of SNPs associated with disease to be D = 5, 8, and 10 within each pathway, resulting in 12 = 3 (D) × 4 (σ2) simulation scenarios (Table 1). For each causal pathway, the causal SNPs were selected randomly without using any SNP-to-Gene mapping information, so that the causal SNPs were located on different genes. Each scenario was replicated 50 times, resulting in, by design, a total of 250 (= 5 × 50) causal disease gene sets among a total of 2500 (= 50 × 50) gene sets. Under this setup, βi can be positive or negative; therefore, each gene set includes SNPs with a minor allele that either increases or decreases risk of disease relative to the major allele. To estimate β0, we assumed disease prevalence K to be 5%. Given prevalence K and βi(i = 1,…, D), β0 can then be estimated by maximizing the equation ; see details in Li et al. (2008). Finally, for each gene set, given values for β0, {β1,…,βD}, and genotype data {g1,…, gD}, we computed f using the multiplicative genetic model above and sampled genotype data for 500 cases and 500 controls from the pool of 20,000 patients.
Table 1.
Results of Simulation Studies Comparing SPCA, PCA, Fisher’s Exact Tests, GSEA and the sum statistic (SUMSTAT).
| Power at False Positive Rate =0.05
| ||||||||
|---|---|---|---|---|---|---|---|---|
| Scene | N_SNP | variance | SPCA | PCA | Fisher (Bonferroni 0.05) | Fisher (FDR 0.05) | GSEA | SUMSTAT |
| 1 | 5 | 0.15 | 0.42 | 0.10 | 0.06 | 0.07 | 0.19 | 0.35 |
| 2 | 5 | 0.20 | 0.64 | 0.17 | 0.22 | 0.24 | 0.23 | 0.51 |
| 3 | 5 | 0.25 | 0.72 | 0.21 | 0.34 | 0.36 | 0.27 | 0.65 |
| 4 | 5 | 0.30 | 0.81 | 0.25 | 0.46 | 0.48 | 0.32 | 0.76 |
| 5 | 8 | 0.15 | 0.53 | 0.11 | 0.10 | 0.13 | 0.22 | 0.40 |
| 6 | 8 | 0.20 | 0.74 | 0.14 | 0.24 | 0.28 | 0.28 | 0.67 |
| 7 | 8 | 0.25 | 0.88 | 0.24 | 0.46 | 0.50 | 0.37 | 0.84 |
| 8 | 8 | 0.30 | 0.92 | 0.29 | 0.63 | 0.67 | 0.40 | 0.90 |
| 9 | 10 | 0.15 | 0.58 | 0.18 | 0.15 | 0.18 | 0.27 | 0.51 |
| 10 | 10 | 0.20 | 0.80 | 0.25 | 0.36 | 0.40 | 0.33 | 0.72 |
| 11 | 10 | 0.25 | 0.90 | 0.27 | 0.55 | 0.61 | 0.39 | 0.88 |
| 12 | 10 | 0.30 | 0.96 | 0.30 | 0.75 | 0.79 | 0.47 | 0.95 |
Fisher (Bonferroni 0.05) = Fisher’s exact test using 0.05 Bonferrioni level as threshold for declaring single SNP significance; Fisher (FDR 0.05) = Fisher’s exact test using 0.05 FDR level as threshold for declaring single SNP significance; N_SNP = number of causal SNPs in the gene set; variance = variance of the beta coefficients in the multiplicative genetic model; see text for details of the simulation experiments.
To construct null gene sets, for the remaining 45 gene sets, we generated outcome status for each sample from Bernouli (K = 0.05) without looking at genotype data. Therefore, these are the null genesets. For each simulation scenario, genotype data for the first 500 cases and 500 controls were next selected from the pool of 20,000 patient samples.
To implement the analysis of SPCA, unsupervised PCA, and Fisher’s exact test, we used the R packages (http://www.r-project.org/) superpc (with modification for binary outcomes), lm, and fisher.test, respectively. For Fisher’s test, which compares the proportion of causal SNPs from a gene set to the proportion of causal SNPs in other genes, a univariate test must first be conducted for each SNP, and a significance threshold pre-specified. We used logistic regression with case-control status as outcome, and SNP status as predictor for the univariate SNP analysis. Two significance cutoff levels were used: at Bonferroni adjusted p-values of 0.05 or FDR adjusted p-values of 0.05.
We used the javaGSEA implementation (http://www.broadinstitute.org/gsea/) for GSEA analysis. Briefly, the SNPs were pre-ranked by Chi-square test statistic from the Cochran-Armitage Trend test and this ranked list was then used for the GSEA “Pre-ranked” algorithm. This is the algorithm implemented in GSEA-SNP software (Hoden et al. 2008). For the sum statistic, we used the program downloaded from the author’s website (http://linkage.rockefeller.edu/ott/sumstat.html).
3. RESULTS
3.1 Results of Simulation Experiment
To estimate type I error rate and power of the methods, we pooled gene sets from the 50 replications, among which 250 (= 5 gene sets × 50 replications) were causal gene sets and 2250 (= 45 gene sets × 50 replications) were null gene sets by design of the experiment.
For all scenarios, all methods had preserved type I error rate at the 0.05 significance level. In particular, Supplementary Figure 1 shows the distributions of p-values from the SPCA model for each scenario. Figure 1 and Table 1 compare the power of the methods for testing the null hypothesis H0: a gene set is not associated with disease. Across all scenarios, the SPCA model consistently performed best with the highest power among all methods. On the other hand, the unsupervised PCA model, which uses all SNPs in the gene set to estimate the underlying latent variable, had the lowest power among all methods. This suggests that, with the SNP selection step, supervised PCA removes some of the irrelevant SNPs before extracting the desired latent variable, thereby improving performance in discriminating causal gene sets from null gene sets. Another self-contained test (Section 1) that also uses only SNPs in the pathway, the sum statistic, also performed well with good power for all scenarios. Supplementary Table 1 further compares the average p-values (over 50 replications) of the sum statistic and SPCA model for each causal gene set with different gene set sizes. Across rows of this table, as expected, when the number of causal SNPs in the gene set is large (N_SNP=10), both methods performed well with small average p-values for each causal gene set. However, when the number of causal SNPs in the gene set is small (N_SNP=5), SPCA model had smaller average p-values. Across the columns of this table, while p-values from SPCA model were similar for causal gene sets with different sizes, the average p-values for sum statistics increased for larger gene sets, suggesting the results of sum statistic are affected by gene set sizes. In this simulation study, because we have selected the causal SNPs randomly, most of pairwise LDs between casual SNPs were less than 0.01. Note that when the causal SNPs display stronger LD pattern, the power of proposed method will be even higher.
Figure 1.
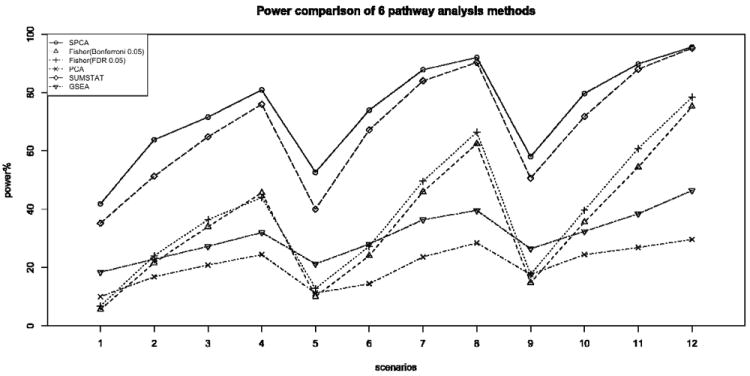
Comparison of power for six gene set analysis methods at 0.05 significance level, for 500-500 case-control samples with disease prevalence 0.05. The number of disease causal SNPs were chosen to be 5, 8, 10 and the variances of the normal distributions for coefficients beta of causal SNPs were 0.15, 0.2, 0.25 and 0.3. SPCA is the proposed Supervised PCA model; Fisher Bonferroni 0.05 and Fisher FDR 0.05 are Fisher’s exact test using Bonferroni 0.05 and FDR 0.05, respectively, as the threshold for declaring single SNP significance; PCA is the standard PCA regression; GSEA is the Gene Set Enrichment Analysis and SUMSTAT is sum statistic described in Hoh et al. (2001).
Compared to the self-contained tests (SPCA and sum statistic), the competitive tests (Fisher’s exact test and GSEA) which compare test statistics for SNPs in the gene set to other SNPs not in the gene set, had less power for detecting causal gene sets. This suggests that when SNPs in multiple pathways are associated with disease, competitive tests which compare association signals in a particular gene set vs. association signals from all other gene sets, may result in loss of power.
3.2 Application to the Crohn Disease (CD) GWA data
To further validate the proposed methodology, we next applied the methodology to a real GWAS dataset: the Wellcome Trust Case Control Consortium (WTCCC) Crohn’s disease (CD) case-control data.
Crohn’s disease, a typical complex disease affected by multiple genetics factors and environmental exposures (Podolsky, 2002), is a form of inflammatory bowel disease (IBD) most commonly affecting the small intestine and/or colon, in which an overactive immune response leads to chronic inflammation. Although the genetic architecture of CD is still incomplete, recent candidate gene and GWAS (Xavier and Podolsky, 2007; Mathew, 2008) suggest three major biological processes related to CD: innate immunity, adaptive immunity (regulation of IL23), and autophagy. These processes are closely associated. Autophagy can mediate innate immune responses by targeting intracellular bacteria and parasites, and connects with adaptive immunity through presenting antigen via MHC class II (Schmid and Munz, 2007). Innate immune responses are necessary to activate adaptive immunity, leading to inflammation (Xavier and Podolsky, 2007).
We chose the WTCCC CD data to test our proposed methodology because of the relatively clear understanding of the above-summarized biological mechanisms involved in the development of Crohn’s disease, including more than 30 susceptibility loci for CD found and replicated in different GWAS (Barrett et al., 2008). WTCCC GWA samples were genotyped using Affymetrix GeneChip 500K arrays. After data quality control, 1748 cases and 2953 controls remained, with 469,557 SNPs for each sample (WTCCC, 2007).
To conduct gene set analysis, we used gene sets from the canonical pathway (CP) and biological process (BP) collections of the Molecular Signatures Database (MSigDB), a public database created by the Broad Institute (http://www.broadinstitute.org/gsea/msigdb/). The CP gene sets are canonical representations of biological processes compiled by domain experts, from online databases such as BioCarta (http://www.biocarta.com/), KEGG (http://www.genome.jp/kegg/), and others. The BP collection consists of gene sets derived from the controlled vocabulary of the Gene Ontology project, in particular the ontologies in the “biological process” category. Because of the hierarchical structure of Gene Ontology, to reduce redundancy, MSigDB preprocesses gene sets to remove highly similar GO categories. To reduce the amount of multiple testing and avoid testing overly broad gene sets, we further removed gene sets with more than 250 genes. The remaining 762 GO categories and 638 canonical pathways were used for subsequent data analysis.
To assign SNPs to pathways, we used ENSEMBL database (version 51) annotation. First, SNPs mapped within 5KB of a gene were assigned to the corresponding gene. A total of 207,907 SNPs were mapped to 17,203 genes. Next, the genotype data in the CD case-control dataset were linked to the gene sets using identifiers for the genes. We conducted gene set analysis using the proposed methodology as outlined in Section 2. Based on the SPCA model, nominal p-values were estimated for all gene sets. To control for false discovery rate (FDR), we also estimated adjusted p-values based on the method of Benjamini and Hochberg (1995), using the multtest package in the R statistical software.
At FDR levels of 0.05 and 0.1, we identified 50 and 72 significant gene sets, respectively, in the CD dataset. The top 40 gene sets are listed in Table 2; a large proportion of these statistically significant gene sets are involved with biological processes related to the immune system, a reasonable result given the proposed biological mechanisms for CD summarized above.
Table 2.
The most significant pathways identified by SPCA analysis in the WTCCC CD GWA dataset.
| Gene set | No. of genes | No. of SNPs | P value | Function |
|---|---|---|---|---|
| GO:0009595 | 9 | 74 | 9.71E-06 | detection of biotic stimulus |
| GO:0009991 | 88 | 774 | 1.04E-05 | response to extracellular stimulus |
| KEGG: 04060 | 215 | 1992 | 1.04E-05 | cytokine cytokine receptor interaction |
| GO:0031668 | 34 | 216 | 1.21E-05 | cellular response to extracellular stimulus |
| GO:0006914 | 27 | 188 | 1.49E-05 | autophagy |
| GO:0016236 | 10 | 59 | 2.01E-05 | macroautophagy |
| GO:0051606 | 46 | 804 | 2.03E-05 | detection of stimulus |
| GO:0050715 | 8 | 114 | 2.18E-05 | positive regulation of cytokine secretion |
| GO:0050701 | 8 | 112 | 2.20E-05 | interleukin-1 secretion |
| GO:0000045 | 7 | 42 | 2.66E-05 | autophagic vacuole formation |
| GO:0043122 | 84 | 563 | 2.70E-05 | regulation of I-KappB kinase/NF-KappaB cascade |
| GO:0043123 | 78 | 509 | 2.74E-05 | positive regulation of I-KappB kinase/NF-KappaB cascade |
| GO:0009966 | 198 | 2365 | 3.09E-05 | regulation of signal transduction |
| GO:0009967 | 114 | 1400 | 3.35E-05 | positive regulation of signal transduction |
| KEGG: 04630 | 132 | 1187 | 3.50E-05 | Jak-STAT signaling pathway |
| GO:0051239 | 139 | 1992 | 3.73E-05 | regulation of multicellular organismal process |
| GO:0051259 | 36 | 699 | 4.28E-05 | protein oligomerization |
| GO:0050707 | 14 | 130 | 4.47E-05 | regulation of cytokine secretion |
| GO:0001819 | 14 | 126 | 4.51E-05 | positive regulation of cytokine production |
| GO:0050714 | 9 | 123 | 4.54E-05 | positive regulation of protein secretion |
| GO:0051240 | 60 | 522 | 5.02E-05 | positive regulation of multicellular organismal process |
| GO:0045087 | 115 | 1108 | 5.07E-05 | innate immune response |
| GO:0006461 | 151 | 2332 | 5.19E-05 | protein complex assembly |
| GO:0009581 | 22 | 180 | 5.28E-05 | detection of external stimulus |
| GO:0051704 | 141 | 1172 | 6.36E-05 | multi-organism process |
| GO:0051707 | 68 | 443 | 6.70E-05 | response to other organism |
| GO:0006952 | 218 | 1989 | 6.94E-05 | defense response |
| GO:0009607 | 97 | 660 | 7.25E-05 | response to biotic stimulus |
| GO:0051099 | 25 | 289 | 7.45E-05 | positive regulation of binding |
| GO:0043388 | 23 | 271 | 7.49E-05 | positive regulation of DNA binding |
| GO:0051091 | 21 | 266 | 7.51E-05 | positive regulation of transcription factor activity |
| GO:0050708 | 19 | 219 | 7.54E-05 | regulation of protein secretion |
| GO:0009617 | 23 | 174 | 7.83E-05 | response of bacterium |
| GO:0051047 | 17 | 166 | 7.89E-05 | positive regulation of secretion |
| GO:0001817 | 23 | 232 | 7.93E-05 | regulation of cytokine production |
| GO:0050663 | 16 | 187 | 8.12E-05 | cytokine secretion |
| GO:0051092 | 15 | 233 | 9.30E-05 | activation of NF-KappaB transcription factor |
| GO:0032940 | 97 | 1657 | 9.47E-05 | secretion by cell |
| GO:0001816 | 63 | 570 | 9.54E-05 | cytokine production |
| GO:0042742 | 18 | 143 | 1.00E-03 | defense response to bacterium |
Two groups of gene sets identified as statistically significant are closely related to innate immunity; one group includes gene categories related to detection and response to stimuli (bacteria), such as GO:0009595, GO:0051606, GO:0009581, GO:0009617. The genes identified from these categories include NOD2 (CARD15), RP1, IFNGR1, CCL4, IL10, IL12B, and others. The second group of innate immunity gene sets is involved with cytokine secretion and production, activation, or regulation of the nuclear factor-κB (NF-κB) transcription factor. The important genes in these sets are NOD2, TNFB2, MAP3K7, ABCA1, CARD11, PRKCQ and others. Among these genes, NOD2, the first discovered CD susceptibility gene, plays a central role in immune response pathways. By recognizing bacterial molecules that possess a muramyl dipeptide (MDP) with a leucine rich repeat (LRR) domain, NOD2 activates NF-κB and mitogen-activated protein (MAP) kinase signaling pathways through a receptor-interacting serine-threonine (RIPK2)-dependent signaling pathway (Kobayashi et al., 2002). This triggers the production and secretion of a series of pro-inflammatory cytokines such as tumor necrosis factor-α (TNF-α), interleukin 12 (IL12), and interleukin 23 (IL23), to enhance innate immunity.
Other major pathways identified as statistically significant are involved with adaptive immunity, in particular, the regulation of IL23. These pathways are the cytokine-cytokine receptor interaction pathway (KEGG 04060, including genes IL23R, IR12RB2, IL18RAP, IL6R, IL28A, ARFRAP1, CCL18, IFNGR1, TNFSF15, TNFRSF1B) and the JAK-STAT signaling pathway (KEGG 04630, including genes IL23R, STAT3, IL28A, IFNGR1, GRB2, SPRED1, SPRED2). IL23 has been shown to be the “master regulator” of Crohn’s disease, through activating a subset of T-cells (TH-17) to produce cytokine IL17 to promote inflammation. The STAT3/STAT4-dependent pathway is also required for IL23 to activate TH-17 through phosphorylation (Neurath, 2007).
Finally, statistically significant gene sets related to autophagy include GO:0006914, GO:0009991, GO:0031668, and others. The most important genes in these gene sets are autophagy-related 16-like 1 (ATG16L1) and the IRGM gene. These two genes are responsible for intracellular responses required for autophagy and are associated with Crohn’s disease risk (Hampe et al., 2007; Rioux et al., 2007; Parkes et al., 2007). Although our top pathways are not identical to the top hits in GESA analysis by Wang et al. (2009), the significant genes identified by SPCA, especially those in pathways related to regulation of IL23 were also included in the most significant pathways in GSEA analysis. This indicates important association signals for CD were picked up by both methods. In summary, results of the proposed SPCA model agreed well with recent findings in multiple GWA studies and animal experiments, further validating the proposed methodology.
4. DISCUSSION
Many complex diseases are influenced by joint effects of genetic variations in multiple genes and environmental factors (Manolio et al., 2009). In this paper, we have outlined a general strategy for conducting pathway analysis for GWAS data using the supervised PCA model. In addition to combining weak signals from a number of SNPs in a pathway, results from pathway analysis also can shed light on the biological processes underlying disease. Typically, only a subset of SNPs within a gene set defined a priori are associated with disease outcome. Hence, without a SNP screening step, using all SNPs to summarize information from a pathway can result in reduced test power for pathway analysis, because of the inclusion of SNPs unrelated to disease. In contrast, the proposed SPCA model, which is a semi-supervised testing procedure that combines feature selection and dimension reduction techniques, removes some of the irrelevant SNPs before extracting the principal components. Using GWAS data with realistic linkage disequilibrium structures, we have shown this approach compares favorably with currently available pathway testing methods.
The proposed method can be further improved in several ways: (1) Assigning SNPs to genes in the pathway. In this study, we have used physical annotations to assign SNPs within 5KB of each gene in a pathway to that gene, to capture the proximal functional elements of most genes; more distant SNPs and SNPs in LD with the included SNPs were ignored. We believe there is a balance to be struck here: adding SNPs mapped farther away from genes will likely cover more completely the regulatory regions, but will also include more irrelevant SNPs and increase the computational burden dramatically because of the large number of genes in most pathways. A previous study (Holmans et al., 2009) found no apparent improvement in results when different window sizes were used for a pathway-based analysis method; however, more studies on this issue are clearly warranted, with functional studies that assess the impact of SNPs on gene expression likely to be particularly helpful. (2) Accounting for the hierarchical structure of GO. The Gene Ontology terms used in this study are highly structured and ordered in a directed acyclic graph: the set of genes annotated to a certain term (node) is a subset of those annotated to its parent nodes. To reduce redundancy, we used collections of gene sets based on GO from the MSigDB database, which had been preprocessed to exclude extremely similar GO terms. Even after pre-processing, however, the results of gene set analysis may still include closely related processes; therefore, careful interpretation of functionally related gene sets is needed. In this study, we have taken the approach of grouping gene sets and interpreting functionally related groups of gene sets to further reduce redundancy.
Although these and other issues make pathway-based analysis of GWAS especially challenging, we believe pathway-based approaches that model joint effects of genetic variations in multiple functionally related genes is a major step forward in improving the power of GWAS and understanding molecular mechanisms of disease. In addition, the power and potential of these methods will increase as the coverage and quality of gene annotation databases improve.
Supplementary Material
Acknowledgments
The work of XC and JB were supported by NHLBI SCCOR Grant 1 P50 HL 077107. The work of LW was partially supported by NICHD grant 5P30 HD015052-25 and NIH grant 1 P50 MH078028-01A1. The work of XZ was supported by the National Institutes of Health, grant numbers HL074166 and HL086718 from the National Heart, Lung, Blood Institute and HG003054 from the National Human Genome Research Institute. This study makes use of data generated by the Wellcome Trust Case Control Consortium. A full list of the investigators who contributed to the generation of the data is available from http://www.wtccc.org.uk/info/participants.shtml. Funding for that project was provided by the Wellcome Trust under award 076113.
References
- Ashburner M, Ball CA, Blake JA, Botstein D, Butler H, Cherry JM, Davis AP, Dolinski K, Dwight SS, Eppig JT, Harris MA, Hill DP, Issel-Tarver L, Kasarskis A, Lewis S, Matese JC, Richardson JE, Ringwald M, Rubin GM, Sherlock G. Gene ontology: tool for the unification of biology. The Gene Ontology Consortium. Nat Genet. 2000;25:25–29. doi: 10.1038/75556. [DOI] [PMC free article] [PubMed] [Google Scholar]
- Bair E, Tibshirani R. Semi-supervised methods to predict patient survival from gene expression data. PLoS Biol. 2004;2:511–522. doi: 10.1371/journal.pbio.0020108. [DOI] [PMC free article] [PubMed] [Google Scholar]
- Bair E, Hastie T, Paul D, Tibshirani R. Prediction by supervised principal components. J Am Stat Assoc. 2006;101:119–137. [Google Scholar]
- Barrett JC, Hansoul S, Nicolae DL, Cho JH, Duerr RH, Rioux JD, Brant SR, Silverberg MS, Taylor KD, Barmada MM, Bitton A, Dassopoulos T, Datta LW, Green T, Griffiths AM, Kistner EO, Murtha MT, Regueiro MD, Rotter JI, Schumm LP, Steinhart AH, Targan SR, Xavier RJ, Libioulle C, Sandor C, Lathrop M, Belaiche J, Dewit O, Gut I, Heath S, Laukens D, Mni M, Rutgeerts P, Van Gossum A, Zelenika D, Franchimont D, Hugot JP, de Vos M, Vermeire S, Louis E, Cardon LR, Anderson CA, Drummond H, Nimmo E, Ahmad T, Prescott NJ, Onnie CM, Fisher SA, Marchini J, Ghori J, Bumpstead S, Gwilliam R, Tremelling M, Deloukas P, Mansfield J, Jewell D, Satsangi J, Mathew CG, Parkes M, Georges M, Daly MJ. Genome-wide association defines more than 30 distinct susceptibility loci for Crohn’s disease. Nat Genet. 2008;40:955–962. doi: 10.1038/NG.175. [DOI] [PMC free article] [PubMed] [Google Scholar]
- Benjamini Y, Hochberg Y. Controlling the false discovery rate: a practical and powerful approach to multiple testing. J Roy Stat Soc B. 1995;57:289–300. [Google Scholar]
- Chasman DI. On the utility of gene set methods in genomewide association Studies of quantitative traits. Genet Epidemiol. 2008;32:658–668. doi: 10.1002/gepi.20334. [DOI] [PubMed] [Google Scholar]
- Chen X, Wang L, Smith JD, Zhang B. Supervised principal component analysis for gene set enrichment of microarray data with continuous or survival outcomes. Bioinformatics. 2008;24:2474–2481. doi: 10.1093/bioinformatics/btn458. [DOI] [PMC free article] [PubMed] [Google Scholar]
- Gauderman WJ, Murcray C, Gilliland F, Conti DV. Testing association between disease and multiple SNPs in a candidate gene. Genet Epidemiol. 2007;31:383–395. doi: 10.1002/gepi.20219. [DOI] [PubMed] [Google Scholar]
- Goeman JJ, Buhlmann P. Analyzing gene expression data in terms of gene sets: methodological issues. Bioinformatics. 2007;23:980–987. doi: 10.1093/bioinformatics/btm051. [DOI] [PubMed] [Google Scholar]
- Hampe J, Franke A, Rosenstiel P, Till A, Teuber M, Huse K, Albrecht M, Mayr G, De La Vega FM, Briggs J, Gunther S, Prescott NJ, Onnie CM, Hasler R, Sipos B, Folsch UR, Lengauer T, Platzer M, Mathew CG, Krawczak M, Schreiber S. A genome-wide association scan of nonsynonymous SNPs identifies a susceptibility variant for Crohn disease in ATG16L1. Nat Genet. 2007;39:207–211. doi: 10.1038/ng1954. [DOI] [PubMed] [Google Scholar]
- Hoh J, Wille A, Ott J. Trimming, weighting, and grouping SNPs in human case-control association studies. Genome Res. 2001;11:2115–2119. doi: 10.1101/gr.204001. [DOI] [PMC free article] [PubMed] [Google Scholar]
- Holden M, Deng SW, Wojnowski L, Kulle B. GSEA-SNP: applying gene set enrichment analysis to SNP data from genome-wide association studies. Bioinformatics. 2008;24:2784–2785. doi: 10.1093/bioinformatics/btn516. [DOI] [PubMed] [Google Scholar]
- Holmans P, Green EK, Pahwa JS, Ferreira MAR, Purcell SM, Sklar P, Owen MJ, O’Donovan MC, Craddock N. Gene Ontology analysis of GWA study data sets provides insights into the biology of bipolar disorder. Am J Hum Genet. 2009;85:13–24. doi: 10.1016/j.ajhg.2009.05.011. [DOI] [PMC free article] [PubMed] [Google Scholar]
- Ivanov D, Philippova M, Antropova J, Gubaeva F, Iljinskaya O, Tararak E, Bochkov V, Erne P, Resink T, Tkachuk V. Expression of cell adhesion molecule T-cadherin in the human vasculature. Histochem Cell Biol. 2001;115:231–242. doi: 10.1007/s004180100252. [DOI] [PubMed] [Google Scholar]
- Ivanov D, Philippova M, Allenspach R, Erne P, Resink TS. T-cadherin upregulation correlates with cell-cycle progression and promotes proliferation of vascular cells. Cardiovasc Res. 2004;64:132–143. doi: 10.1016/j.cardiores.2004.06.010. [DOI] [PubMed] [Google Scholar]
- Kobayashi K, Inohara N, Hernandez LD, Galan JE, Nunez G, Janeway CA, Medzhitov R, Flavell RA. RICK/Rip2/CARDIAK mediates signalling for receptors of the innate and adaptive immune systems. Nature. 2002;416:194–199. doi: 10.1038/416194a. [DOI] [PubMed] [Google Scholar]
- Leadbetter MR, Lindgren G, Rootzen H. Extremes and Related Properties of Random Sequences and Processes. New York: Springer; 1982. [Google Scholar]
- Li C, Li MY. GWAsimulator: a rapid whole-genome simulation program. Bioinformatics. 2008;24:140–142. doi: 10.1093/bioinformatics/btm549. [DOI] [PubMed] [Google Scholar]
- Li Y, Abecasis GR. Mach 1.0: Rapid haplotype reconstruction and missing genotype inference. Am J Hum Genet. 2006;S79:2290. [Google Scholar]
- Manolio TA, Collins FS, Cox NJ, Goldstein DB, Hindorff LA, Hunter DJ, McCarthy MI, Ramos EM, Cardon LR, Chakravarti A, Cho JH, Guttmacher AE, Kong A, Kruglyak L, Mardis E, Rotimi CN, Slatkin M, Valle D, Whittemore AS, Boehnke M, Clark AG, Eichler EE, Gibson G, Haines JL, Mackay TFC, McCarroll SA, Visscher PM. Finding the missing heritability of complex diseases. Nature. 2009;461:747–753. doi: 10.1038/nature08494. [DOI] [PMC free article] [PubMed] [Google Scholar]
- Mathew CG. New links to the pathogenesis of Crohn disease provided by genome-wide association scans. Nat Rev Genet. 2008;9:9–14. doi: 10.1038/nrg2203. [DOI] [PubMed] [Google Scholar]
- McCarthy MI, Abecasis GR, Cardon LR, Goldstein DB, Little J, Ioannidis JPA, Hirschhorn JN. Genome-wide association studies for complex traits: consensus, uncertainty and challenges. Nat Rev Genet. 2008;9:356–369. doi: 10.1038/nrg2344. [DOI] [PubMed] [Google Scholar]
- Neurath MF. IL23: a master regulator in Crohn disease. Nat Med. 2007;13:26–28. doi: 10.1038/nm0107-26. [DOI] [PubMed] [Google Scholar]
- Parkes M, Barrett JC, Prescott NJ, Tremelling M, Anderson CA, Fisher SA, Roberts RG, Nimmo ER, Cummings FR, Soars D, Drummond H, Lees CW, Khawaja SA, Bagnall R, Burke DA, Todhunter CE, Ahmad T, Onnie CM, McArdle W, Strachan D, Bethel G, Bryan C, Lewis CM, Deloukas P, Forbes A, Sanderson J, Jewell DP, Satsangi J, Mansfield JC, Cardon L, Mathew CG. Sequence variants in the autophagy gene IRGM and multiple other replicating loci contribute to Crohn’s disease susceptibility. Nat Genet. 2007;39:830–832. doi: 10.1038/ng2061. [DOI] [PMC free article] [PubMed] [Google Scholar]
- Podolsky DK. Inflammatory bowel disease. New Engl J Med. 2002;347:417–429. doi: 10.1056/NEJMra020831. [DOI] [PubMed] [Google Scholar]
- Rioux JD, Xavier RJ, Taylor KD, Silverberg MS, Goyette P, Huett A, Green T, Kuballa P, Barmada MM, Datta LW, Shugart YY, Griffiths AM, Targan SR, Ippoliti AF, Bernard EJ, Mei L, Nicolae DL, Regueiro M, Schumm LP, Steinhart AH, Rotter JI, Duerr RH, Cho JH, Daly MJ, Brant SR. Genome-wide association study identifies new susceptibility loci for Crohn disease and implicates autophagy in disease pathogenesis. Nat Genet. 2007;39:596–604. doi: 10.1038/ng2032. [DOI] [PMC free article] [PubMed] [Google Scholar]
- Rubina K, Talovskaya E, Cherenkov V, Ivanov D, Stambolsky D, Storozhevykh T, Pinelis V, Shevelev A, Parfyonova Y, Resink T, Erne P, Tkachuk V. LDL induces intracellular signalling and cell migration via atypical LDL-binding protein T-cadherin. Mol Cell Biochem. 2005;273:33–41. doi: 10.1007/s11010-005-0250-5. [DOI] [PMC free article] [PubMed] [Google Scholar]
- Subramanian A, Tamayo P, Mootha VK, Mukherjee S, Ebert BL, Gillette MA, Paulovich A, Pomeroy SL, Golub TR, Lander ES, Mesirov JP. Gene set enrichment analysis: A knowledge-based approach for interpreting genome-wide expression profiles. P Natl Acad Sci USA. 2005;102:15545–15550. doi: 10.1073/pnas.0506580102. [DOI] [PMC free article] [PubMed] [Google Scholar]
- Schmid D, Munz C. Innate and adaptive immunity through autophagy. Immunity. 2007;27:11–21. doi: 10.1016/j.immuni.2007.07.004. [DOI] [PMC free article] [PubMed] [Google Scholar]
- Schwarz DF, Hadicke O, Erdmann J, Ziegler A, Bayer D, Moller S. SNPtoGO: characterizing SNPs by enriched GO terms. Binformatics. 2008;24:146–148. doi: 10.1093/bioinformatics/btm551. [DOI] [PubMed] [Google Scholar]
- Tomfohr J, Lu J, Kepler TB. Pathway level analysis of gene expression using singular value decomposition. BMC Bioinformatics. 2005;6:225. doi: 10.1186/1471-2105-6-225. [DOI] [PMC free article] [PubMed] [Google Scholar]
- Wang K, Li MY, Bucan M. Pathway-based approaches for analysis of genomewide association studies. Am J Hum Genet. 2007;81:1278–1283. doi: 10.1086/522374. [DOI] [PMC free article] [PubMed] [Google Scholar]
- Wang K, Abbott D. A principal components regression approach to multilocus genetic association studies. Genet Epidemiol. 2008;32:108–118. doi: 10.1002/gepi.20266. [DOI] [PubMed] [Google Scholar]
- Wang K, Zhang H, Kugathasan S, Annese V, Bradfield JR, Russell RK, Sleiman PMA, Imielinski M, Glessner J, Hou C, Wilson DC, Walters T, Kim C, Frackelton EC, Lionetti P, Barabino A, Van Limbergen J, Guthery S, Denson L, Piccoli D, Li M, Dubinsky M, Silverberg M, Griffiths A, Grant SFA, Satsangi J, Baldassano R, Hakonarson H. Diverse Genome-wide Association Studies Associate the IL12/IL23 Pathway with Crohn Disease. Am J Hum Genet. 2009;84:399–405. doi: 10.1016/j.ajhg.2009.01.026. [DOI] [PMC free article] [PubMed] [Google Scholar]
- Wang L, Zhang B, Wolfinger RD, Chen X. An integrated approach for the analysis of biological pathways using mixed models. PLoS Genet. 2008;4:e1000115. doi: 10.1371/journal.pgen.1000115. [DOI] [PMC free article] [PubMed] [Google Scholar]
- Wellcome Trust Case Control Consortium. Genome-wide association study of 14,000 cases of seven common diseases and 3,000 shared controls. Nature. 2007;447:661–678. doi: 10.1038/nature05911. [DOI] [PMC free article] [PubMed] [Google Scholar]
- Wright FA, Huang HW, Guan XJ, Gamiel K, Jeffries C, Barry WT, de Villena FPM, Sullivan PF, Wilhelmsen KC, Zou F. Simulating association studies: a data-based resampling method for candidate regions or whole genome scans. Binformatics. 2007;23:2581–2588. doi: 10.1093/bioinformatics/btm386. [DOI] [PubMed] [Google Scholar]
- Xavier RJ, Podolsky DK. Unravelling the pathogenesis of inflammatory bowel disease. Nature. 2007;448:427–434. doi: 10.1038/nature06005. [DOI] [PubMed] [Google Scholar]
- Zhu XF, Zhang SL, Zhao HY, Cooper RS. Association mapping, using a mixture model for complex traits. Genet Epidemiol. 2002;23:181–196. doi: 10.1002/gepi.210. [DOI] [PubMed] [Google Scholar]
Associated Data
This section collects any data citations, data availability statements, or supplementary materials included in this article.