

In vivo measurement of liver choline concentrations in healthy humans is feasible, and even measurement of glycogen can be achieved in some patients at 3.0 T with point-resolved 1H MR spectroscopy by using navigator-guided synchronization to respiratory motion and state-of-the-art B0 field shimming techniques.
Abstract
Purpose:
To determine the feasibility of measuring choline and glycogen concentrations in normal human liver in vivo with proton (hydrogen 1 [1H]) magnetic resonance (MR) spectroscopy.
Materials and Methods:
Signed consent to participate in an institutional review board–approved and HIPAA-compliant study was obtained from 46 subjects (mean age, 46 years ± 17 [standard deviation]; 24 women) consecutively recruited during 285 days. Navigator-gated MR images were used to select 8-mL volumes for point-resolved spectroscopy (PRESS) with a 35-msec echo time. Line widths were minimized with fast breath-hold B0 field mapping and further manual shimming. Navigator-gated spectra were recorded with and without water suppression to determine metabolite concentrations with water signals as an internal reference. In three subjects, echo time was varied to determine the glycogen and choline T2. Linear regression analysis was used to examine relations between choline, hepatic lipid content, body mass index, glycogen content, and age.
Results:
Choline concentrations could be determined in 46 of 48 studies and was found to be 8.6 mmol per kilogram of wet weight ± 3.1 (range, 3.8–17.6; n = 44). Twenty-seven spectra in 25 individuals with narrow line widths and low lipid content were adequate for quantitation of glycogen. The glycogen (glucosyl unit) concentration was 38.1 mmol/kg wet weight ± 14.4. The T2 of combined glycogen peaks in the liver of three subjects was 36 msec ± 8. Choline levels showed a weak but significant correlation with glycogen (r2 = 0.15; P < .05) but not with lipid content.
Conclusion:
Navigator-gated and gradient-echo shimmed PRESS 1H MR spectroscopy may allow quantification of liver metabolites that are important for understanding and identifying disorders of glucose and lipid metabolism.
© RSNA, 2012
Supplemental material: http://radiology.rsna.org/lookup/suppl/doi:10.1148/radiol.12112344/-/DC1
Introduction
Liver proton (hydrogen 1 [1H]) magnetic resonance (MR) spectroscopy is typically used for quantifying lipid content (1,2). Few have reported quantification of metabolites other than fatty acids (3,4), even though some are present in large enough concentrations to be detectable.
A large part of the total glucose usage of the human body is derived from glycogen stored in the liver—36% measured by using carbon 13 (13C) MR spectroscopy (5) and 78% measured by using isotope labeling (6). Carbon 13 MR spectroscopy has been preferred over 1H MR spectroscopy for observing glycogen in vivo because of superior separation of glycogen and lipid signals (5,7–9). Hydrogen 1 MR spectroscopy could offer 100% natural abundance and much greater signal-to-noise ratio, if only the strong signals of water and lipids can be avoided.
Separation of lipid and glycogen 1H signals has been achieved in rat liver with spectral editing (10,11), but this has not, to our knowledge, been applied in humans. Glycogen chemical exchange signal transfer (or glycoCEST) (12), a 1H MR imaging method, was applied in human muscle (13), but this does not yield concomitant information on lipids or choline.
Choline has a strong 1H signal provided by nine trimethylamine protons and has a high concentration in mouse and bovine liver (14,15). Even so, in vivo observation of both choline and glycogen in liver has been confounded by several factors: respiratory motion of the liver, poor B0 field homogeneity, and strong water and fat signals.
Water signal suppression must be applied with a narrow bandwidth to avoid suppression of nearby glycogen signals. Problems caused by respiratory motion can effectively be ameliorated by instructing subjects to do single (16) or multiple breath holds (17,18), by acquisition during synchronized breathing, or by navigator-guided acquisitions (3,19,20). These techniques have thus far only been applied to quantify hepatic lipid (16) or trimethylamine resonances (3,18).
Our purpose was to determine the feasibility of measuring choline and glycogen concentrations in normal human liver in vivo with 1H MR spectroscopy.
Materials and Methods
Subjects
All subjects (mean age, 46 years ± 17 [standard deviation]; 24 women) provided written informed consent for this study, which was approved by the institutional review board and was Health Insurance Portability and Accountability Act compliant. The subjects were consecutively recruited during a period of 285 days for MR studies that were initially aimed at characterization of hepatic lipids in healthy and obese subjects. Exclusion criteria were pregnancy, age younger than 18 years, mental disability precluding consent, known liver disease, and contraindications for MR. Inclusion criteria were healthy volunteers with an absence of a history of liver disease and age older than 18 years. None of the recruited subjects needed to be excluded. The 25 subjects whose spectra were retroactively selected on the basis of spectral quality for quantification of glycogen in this study were a subset of 47 consecutive liver MR spectroscopic studies in 46 subjects without known liver disease (one subject was studied twice) that were all performed with navigator-gated point-resolved spectroscopy (PRESS). The inclusion criteria for the retroactive quantification of glycogen were a set of glycogen peaks between 3.6 and 4 ppm, a choline peak that could be identified visually above the noise level, and convergence of the data-fitting routine that resulted in plausible parameters for the glycogen resonances with line widths less than 150 Hz and larger than half the unsuppressed water line width. The upper limit on line width for the glycogen resonances was designed to limit possible errors due to a low-intensity broad-lipid glycerol resonance at 4.3 ppm (21).
One male subject (aged 56 years at first examination) volunteered twice and was studied a second time after a 120-day interval. The two results were included as separate results in all calculations because the subject’s age and weight had changed during this period. In one female subject (aged 32 years), the available imaging time permitted us to select two locations in the liver. The metabolite concentrations of the two locations were averaged and added as one study for calculation of mean metabolite levels over all studies but were shown as separate in graphs relating metabolite concentrations to other factors such as lipid content. Thus, the 27 spectra from 26 studies in 25 individuals that were used for glycogen quantification were a selection from a total of 48 spectra derived from 46 individuals in 47 studies.
To ensure that all subjects were being imaged in a similar fed state, a standard meal with a composition similar to the typical American diet (30% fat, 20% protein, and 50% carbohydrate) was consumed 2–3 hours prior to MR imaging. The meal contained 30% of the subjects’ calculated total daily energy needs (Mifflin–St Jeor equation 1 [22]), with an activity factor of 1.3 to account for their relative inactivity in the hospital setting.
MR Imaging and Spectroscopy
MR studies were performed with a wide-bore 3.0-T MR imager (Magnetom Verio; Siemens Erlangen, Germany). Siemens Medical Systems provided the pulse sequences for gradient-recalled echo shimming and navigator-gated PRESS. The authors were in full control of the data and information submitted for publication in this article. Subjects were placed in the supine position on a spine coil, and a 16-channel torso coil was placed over the liver. After scout images were obtained, coronal and transverse three-dimensional T1-weighted gradient-recalled echo images were obtained (12° flip angle; repetition time, 3.1 msec; echo time, 1.3 msec; 18-second expiration breath holds). Coronal and transverse two-dimensional T2-weighted spin-echo navigator-gated images were obtained (repetition time, 1200 msec; echo time, 87 msec). Field of view and phase resolution were adjusted to fit torso size; the readout resolution was fixed at 256 points. A 20 × 20 × 20-mm spectroscopic volume was prescribed in a liver region free of adipose tissue (as seen on T2-weighted images) and large arteries (as seen on T1-weighted images), about 10 mm under the diaphragm and 10 mm inside the ribs. Shimming was performed in two stages. First, three-dimensional gradient-recalled echo images were obtained with 12-second expiration breath hold and B0 field mapping (23) and were used to calculate optimal first- and second-order shims for the spectroscopic volume. The water line width was further reduced to less than 40 Hz with manual shimming. Actual water line widths were later determined with a Hankel single-value decomposition time-domain fit (24).
Navigator volumes were positioned perpendicular to the diaphragm dome over the liver. Respiratory-gated single-volume modified PRESS (25) MR spectra were recorded with 1024 points at a 1200-Hz bandwidth, with minimum repetition time of 2.1 seconds and echo time of 35 msec. Effective repetition time was greater than 3.5 seconds because of delays for gating to respiratory cycles (typically 3.5–6-second duration). In one spectrum, 32 signals were averaged with water suppression enhanced through T1 effects (or WET) (26) by using 40-Hz line width sinc-Gauss pulses. A second spectrum was recorded in identical fashion but with only four signals averaged and amplitudes of the radiofrequency pulses of the water suppression enhanced through T1 effects sequence set to zero. Two or three 20–60-mm-thick spatial saturation slabs were used to suppress adipose tissue near the spectroscopic volume.
The water suppression enhanced through T1 effects sequence response was tested in a phantom by varying the water suppression frequency in a 20 × 20 × 20-mm3 PRESS volume selected in a 2-L bottle filled with water, doped with 2 g/L CuSO4.
MR Spectroscopic Data Processing
The spectra were preprocessed and analyzed by using time-domain fitting with the advanced method for accurate, robust, and efficient spectral fitting (AMARES) of MR spectroscopic data (27) in a Java-based MR user interface (or jMRUI) (28,29). When needed, the water-suppressed spectra were corrected for eddy current distortions by using the unsuppressed water signal as a reference (30). Residual water signals within a 40–50-Hz window around the water frequency were removed with a Hankel single-value decomposition filter (31).
The chemical shifts of the main metabolite signals were inferred from the results of ex vivo high-resolution magic-angle spinning 1H MR spectroscopy in liver biopsy specimens (32,33) and the position of the glycogen H2H4′, H5, and H3 peaks in Figure 1a in Chen et al (10).
Figure 1:

Choline concentration as a function of lipid content for men (▽ and ▼) and women (○ and ●). Solid symbols = studies selected for glycogen quantification. Open symbols = studies where only choline could be quantified. ww = wet weight.
Resonances were fitted as Gaussian line shapes with the first-order phase fixed at zero and the zero-order phase presumed equal for all resonances. The prior knowledge values used for water-suppressed data sets are summarized in Table 1. For most metabolites, AMARES soft-constraint boundaries were set on chemical shifts to the initial estimates ±0.1 ppm. A time-domain windowing function was applied to the measured data and model functions to improve fitting of closely spaced resonances (34). Because we cannot be sure that the chemical shifts for glycogen in liver are that same as those found in Chen et al (10), the initial chemical shift estimates for the glycogen signals were fine-tuned on seven spectra with both high glycogen signal-to-noise ratio and narrow water line widths. The soft-constraint regions for choline and glycogen H2H4′, H5, and H3 resonances were widened to ±0.5 ppm around initial estimated chemical shifts of 3.24, 3.60, 3.80, and 3.95 ppm, respectively. The resulting mean chemical shift values were subsequently adopted as new initial estimates (Table 1) and henceforth used for all spectra with the soft constraints also listed in Table 1. The reference frequency was set manually on the choline peak as 3.24 ppm. Resonances at 2.8–3.01 ppm were assigned to creatine (33). Lipid CH2 and creatine resonances were fitted with two peaks to accommodate asymmetries in these peaks.
Table 1.
Initial Values for Chemical Shift and Line Widths and Prior Knowledge Soft-Constraint Boundaries Used for AMARES Time-Domain Fitting of Metabolite Signals in Liver 1H MR Spectra and Fit Results of the Seven Best Spectra Fitted with 60.5-ppm Margins
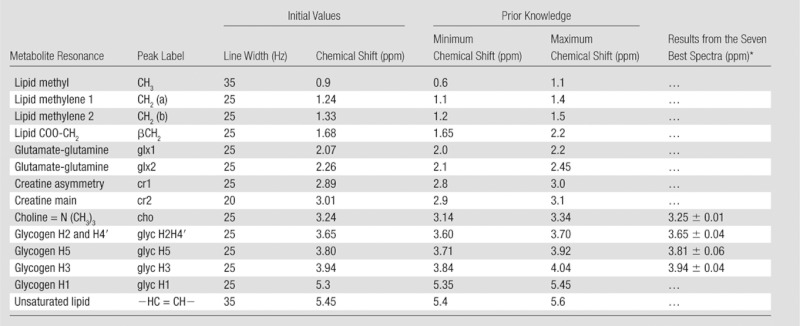
Data are means ± standard deviations.
The non–water-suppressed spectra were fitted in by using a simpler model with Gaussian line shapes for CH3 at 0.9 ppm, for CH2 at 1.45 ppm, for choline at 3.24 ppm, and for water peak at 4.7 ppm plus an extra Lorentzian line shape for water at 4.7 ppm, all with soft-constraint boundaries at ±0.5 ppm. In most cases, neither Gaussian nor Lorentzian line shapes perfectly fitted the water peak. The combined fit of the two line shapes gives an almost perfect fit, even in the presence of peak asymmetries caused by eddy currents. Because with this method the water line widths cannot be determined, water line widths were separately determined in non–water-suppressed spectra with a single Lorentzian peak model Hankel single-value decomposition time-domain fit (24).
For presentation, all signals were zero-filled to 2048 points, apodized with a 2-Hz Gaussian filter prior to Fourier transform, and displayed with an arbitrary intensity axis unit.
T2 Measurements
The T2 of choline and of the combined signals of glycogen H2H4′, H5, and H3 were determined with the same MR sequences and quantification methods described previously, but water-suppressed PRESS was repeated with the echo time varied. The number of signals averaged in one of the T2 experiments was set to 48 with echo times of 35, 40, 60, 80, and 100 msec. Two experiments were recorded as 32 signals averaged per echo time by using echo times of 35, 40, 60, 80, and 120 msec and 35, 40, 54, 60, and 100 msec. After quantification of resonance peak areas as described below, the T2 and initial magnetizations were determined with a two-parameter (Levenberg-Marquardt) nonlinear least-square fit to a monoexponential decay model within Matlab (Mathworks, Natick, Mass).
Metabolite Quantification
The H3, H5, and H2H4′ glycogen resonance peak areas were summed, and glycogen concentration was calculated from this total (four proton) glycogen signal (Sglyc) as
 |
FR2 is the correction factor for T2 decay for the combined glycogen resonances, FR2water is the T2 correction for the unsuppressed water signal, Swater is water signal, and WCliver is the water content of a healthy adult liver reported as 0.7158 kg per kilogram of wet weight (35) and 0.722 kg/kg wet weight (36). We used the mean value of 0.719 kg water/kg wet weight and converted from moles of water to kilograms with the factor 55.5. The FR2 for glycogen was 2.676 for the 35-msec echo time on the basis of a fitted T2 for glycogen of 35.6 msec. FR2water was set to 2.74 on the basis of the reported R2 for liver water signal of 28.8 sec−1 (37). Correction for saturation (FR1) was not applied because the T1 for the peaks used for quantification could not be determined and repetition time is variable because of the respiratory gating. It is assumed that the T1s are short compared with the effective repetition time used in this study.
Similarly, the choline concentration (cho) was calculated from the 3.24-ppm trimethylamine signal STMA as
 |
Again, no correction for saturation (FR1 = 1) was applied. The correction for T2 relaxation, FR2, was 1.574 for the echo time of 35 msec on the basis of a T2 for choline of 77.1 msec.
The T2 decay-corrected lipid content was determined without correction for saturation from the combined lipid CH2 and CH3 peak areas (Slipid) and the unsuppressed water area as
where FR2lipid is the T2 decay correction factor for the combined lipid CH2 and CH3 signals. The value used was 1.92 on the basis of a T2 of hepatic lipid of 54 msec ± 11 (38).
Statistical Analysis
Two-tailed Student t tests and linear regression fits relating choline and glycogen concentrations with other subject parameters were calculated with software (Excel for Mac, 2008, version 12.3.1, Microsoft, Redmond, Wash; StatPlus for Mac, 2009, AnalystSoft, Alexandria, Va). Differences in means with P less than .05 and linear regression correlations with F values in excess of a critical F at the P less than .05 level were deemed significant.
Results
MR Spectroscopy
We were able to quantify glycogen in 12 male and 13 female subjects. The age, body mass index, and weight of the selected and nonselected subjects are summarized in Table 2.
Table 2.
Subject Characteristics of the Selected and Nonselected Groups
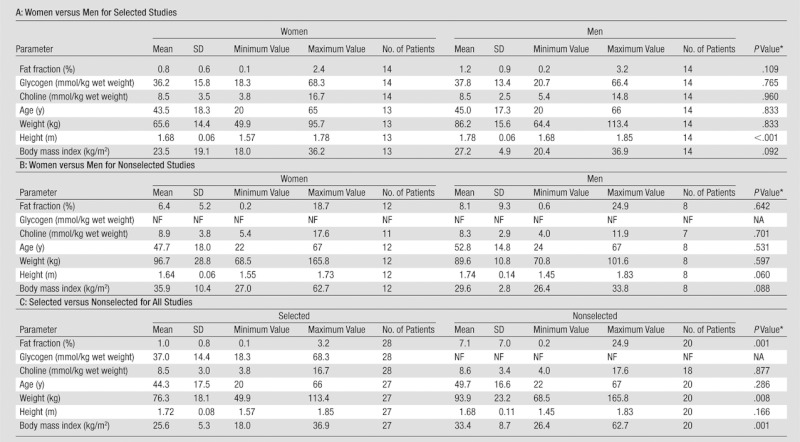
Note.— NA = not available, NF = not found, SD = standard deviation.
t test.
Choline could be quantified in all but two of the 47 spectra, but glycogen signals could only be quantified in 25 spectra with relatively narrow water line widths. The average water line width in studies suitable for quantification of glycogen was 17.8 Hz ± 2.4 (n = 25), which was significantly smaller than the 23.5 Hz ± 7.0 (n = 22) for all the other spectra (P < .001). The narrow water line width was also required to achieve effective water suppression with the reduced water suppression bandwidth of 40 Hz.
The choline concentrations are shown as a function of lipid content plotted in Figure 1. Only unselected spectra had a fat content of more than 3.5%. From this and the lipid content data in Table 2, it is clear that spectra with a high fat fraction were not suitable for quantification of glycogen.
The 40-Hz water suppression enhanced through T1 effects water suppression response measured on a water phantom is shown superimposed on a human in vivo liver spectrum in Figure 2. The saturation profile measured on the phantom showed hardly any spillover saturation on the glycogen peak area between 3.5 and 4 ppm or the 1H position at 5.3 ppm.
Figure 2:

Water suppression profile measured on a phantom superimposed on a 1H MR spectroscopic liver spectrum in 48-year-old healthy woman. Water suppression response, or S (○ and dashed line), is normalized to the unsuppressed water signal, Smax, measured with an offset of 150 Hz and water suppression radiofrequency pulse amplitudes set to zero. The spectrum (solid line) (intensity arbitrary units [a.u.]) was cut around the water frequency at points where the water suppression response signal S/Smax exceeds 0.98. This suppression area is indicated by gray shading.
Time-Domain Fitting
The standard deviations for the peak positions of glycogen H2H4′, H5, and H3 as determined from the seven best-quality spectra were within the search boundaries used for the time-domain fitting of all spectra. These values are presented in Table 1, along with the prior knowledge and initial estimates used for all quantified spectra. A sample spectrum with the reconstructed AMARES fit results and fit residual signal is shown in Figure 3. In this spectrum, glycogen was 32.5 mmol/kg wet weight, choline was 8.9 mmol/kg wet weight, and lipid content was 0.36%.
Figure 3a:

Liver spectra and AMARES fit data in 23-year-old healthy woman. (a) Water suppressed spectrum (red line) and reconstruction of AMARES time-domain fitted total signal (black line) with metabolite labels (from Table 1) for the principal fitted components. Gray line = non–water-suppressed spectrum scaled down by a factor 300. (b) Reconstruction of fitted individual peaks with metabolite labels corresponding to the prior knowledge labels listed in Table 1 (glX is glx1 plus glx2; cr is cr1 plus cr2; glyc is glyc H2H4′, glyc H5, and glyc H3). The positions for metabolites that were not found in this data fit (glyc H1 and cr2) are marked with gray labels.
Figure 3b:

Liver spectra and AMARES fit data in 23-year-old healthy woman. (a) Water suppressed spectrum (red line) and reconstruction of AMARES time-domain fitted total signal (black line) with metabolite labels (from Table 1) for the principal fitted components. Gray line = non–water-suppressed spectrum scaled down by a factor 300. (b) Reconstruction of fitted individual peaks with metabolite labels corresponding to the prior knowledge labels listed in Table 1 (glX is glx1 plus glx2; cr is cr1 plus cr2; glyc is glyc H2H4′, glyc H5, and glyc H3). The positions for metabolites that were not found in this data fit (glyc H1 and cr2) are marked with gray labels.
T2 Measurements
The T2 measurement performed with 48 signals averaged and five echo time values between 35 and 100 msec yielded a T2 of the combined glycogen H2H4′, H5, and H3 signals of 32.6 msec (Fig 4). Two T2 measurements with 32 signals averaged per echo time value yielded T2s of 29.1 and 44.9 msec. The measurements also yielded a T2 of 77.1 msec ± 9.8 (n = 3) for the choline trimethylamine resonance.
Figure 4a:

T2 measurement of the glycogen signals. (a) Series of spectra recorded with echo times (TE) of 35–100 msec. The spectral axes are shifted for each echo time and are shown with a dashed line in the same direction as the axis shifts to indicate the chemical shift of the glycogen H3 resonance at a constant intensity level. (b) Choline peak areas (○) as a function of echo time and monoexponential two-parameter (Levenberg-Marquardt) nonlinear least-square fit of the T2 of the choline resonance (solid line). (c) Summed signals of glycogen H2H4′, H3, and H5 as a function of echo time (○) and monoexponential fit (solid line) of the T2 of the glycogen resonances.
Figure 4b:

T2 measurement of the glycogen signals. (a) Series of spectra recorded with echo times (TE) of 35–100 msec. The spectral axes are shifted for each echo time and are shown with a dashed line in the same direction as the axis shifts to indicate the chemical shift of the glycogen H3 resonance at a constant intensity level. (b) Choline peak areas (○) as a function of echo time and monoexponential two-parameter (Levenberg-Marquardt) nonlinear least-square fit of the T2 of the choline resonance (solid line). (c) Summed signals of glycogen H2H4′, H3, and H5 as a function of echo time (○) and monoexponential fit (solid line) of the T2 of the glycogen resonances.
Figure 4c:

T2 measurement of the glycogen signals. (a) Series of spectra recorded with echo times (TE) of 35–100 msec. The spectral axes are shifted for each echo time and are shown with a dashed line in the same direction as the axis shifts to indicate the chemical shift of the glycogen H3 resonance at a constant intensity level. (b) Choline peak areas (○) as a function of echo time and monoexponential two-parameter (Levenberg-Marquardt) nonlinear least-square fit of the T2 of the choline resonance (solid line). (c) Summed signals of glycogen H2H4′, H3, and H5 as a function of echo time (○) and monoexponential fit (solid line) of the T2 of the glycogen resonances.
Metabolite Concentrations
The observable glycogen (glycosyl unit) concentration was 38.1 mmol/kg wet weight ± 14.4 (n = 26) and ranged from 18.3 to 68.3 mmol/kg wet weight (Fig 5). The average choline concentration was 8.6 mmol/kg wet weight ± 3.1 (range, 3.8–17.6) (n = 43). In the woman with measurements at two locations, glycogen concentration measurements were similar at 24.1 and 24.9 mmol/kg wet weight. The amounts of choline of the two volume locations were 6.5 and 4.5 mmol/kg wet weight and lipid contents were 0.62% and 0.15%, respectively (Fig E1 [online]). The man measured on two separate days had glycogen of 37.6 mmol/kg wet weight at the first study and 66.4 mmol/kg wet weight at the second study. The choline concentrations were 9.1 and 8.5 mmol/kg wet weight, respectively, and on both occasions lipid content was high at 3.2% and 1.8% (compared with the mean of 1.0% ± 0.8 for the 26 selected studies).
Figure 5a:

Liver metabolite spectrum of the subjects with the lowest glycogen concentrations. (a) Axial and (b) coronal T2-weighted navigator-gated images. Box = spectroscopic volume location. Dashed line = position of the respective orthogonal images. (c) Liver spectrum with glycogen concentration of 18.3 mmol/kg wet weight in 20-year-old woman with body mass index of 18 kg/m2, choline concentration of 5.2 mmol/kg wet weight, and lipid content of 0.44%. Gray line = non–water-suppressed spectrum scaled down by a factor 1000.
Figure 5b:

Liver metabolite spectrum of the subjects with the lowest glycogen concentrations. (a) Axial and (b) coronal T2-weighted navigator-gated images. Boxes = spectroscopic volume location. Dashed lines = positions of the respective orthogonal images. (c) Liver spectrum with glycogen concentration of 18.3 mmol/kg wet weight in 20-year-old woman with body mass index of 18 kg/m2, choline concentration of 5.2 mmol/kg wet weight, and lipid content of 0.44%. Gray line = non–water-suppressed spectrum scaled down by a factor 1000.
Figure 5c:

Liver metabolite spectrum of the subjects with the lowest glycogen concentrations. (a) Axial and (b) coronal T2-weighted navigator-gated images. Boxes = spectroscopic volume location. Dashed lines = positions of the respective orthogonal images. (c) Liver spectrum with glycogen concentration of 18.3 mmol/kg wet weight in 20-year-old woman with body mass index of 18 kg/m2, choline concentration of 5.2 mmol/kg wet weight, and lipid content of 0.44%. Gray line = non–water-suppressed spectrum scaled down by a factor 1000.
Figure 6 shows correlations of the choline and glycogen concentrations with lipid content, age, and body mass index and each other. Only the correlation between choline and glycogen was significant at P less than .05.
Figure 6a:

Choline concentration as a function of (a) glycogen concentration (men = ▼, women = ●) and (b) subject age (men = ∇, women = ○). Linear regression line in a is choline = 0.08 · glycogen + 5.54 with r2 of 0.15 (n = 25, P < .05) and that in b is choline = 0.053 · age + 6.17 with r2 of 0.08 (n = 45, P < .05). ww = wet weight.
Figure 6b:

Choline concentration as a function of (a) glycogen concentration (men = ▼, women = ●) and (b) subject age (men = ∇, women = ○). Linear regression line in a is choline = 0.08 · glycogen + 5.54 with r2 of 0.15 (n = 25, P < .05) and that in b is choline = 0.053 · age + 6.17 with r2 of 0.08 (n = 45, P < .05). ww = wet weight.
Discussion
Determining nonfatty acid metabolite concentrations from human livers with 1H MR spectroscopy is more challenging than just lipid quantification. However, once sights are set on the higher quality spectra required for metabolite concentrations, the extra effort often yields good results. Respiratory motion suppression with navigators instead of breath holds makes it easier to average more signals at a longer repetition time. Narrow water line widths are seen to be essential and can be achieved in relatively small volumes and with optimal shimming.
Avoiding saturation of the glycogen signals requires a narrow water line width and selective water suppression. We used a narrow suppression pulse, but other methods could be considered. Simultaneous water and lipid signal suppression by using dual-band pulses (39) may in the future help to obtain better metabolite spectra from subjects with a high lipid content, which in this study tended to exclude them from glycogen quantification.
Broad line widths due to poor B0 field homogeneity or uncompensated motion will compromise the water signal removal. The resulting severe baseline distortions of residual water signals will hinder accurate glycogen quantification. Even if the glycogen signal is large enough to be visually appreciated, the time-domain fitting can no longer be forced to find more than one very broad glycogen resonance in the 3.6–4.1-ppm region. We thought that a single-peak fit could not quantitatively distinguish the metabolite signal baseline roll (which is also more severe in spectra with large line widths). Omission of these spectra from the results does not necessarily bias the results toward higher glycogen concentrations.
The choline concentration we found was higher than previously reported MR spectroscopy–derived choline concentrations for healthy human liver (1.3 ± 0.8, n = 5) (4), possibly because of differences in spectrum quantification methods or relaxation corrections. Our finding was less than the approximately 30 mmol/kg wet weight determined with other assay methods in both mouse (14) and bovine liver (418 mg choline in 100 g liver) (15), possibly because of MR invisibility of choline lipids in membranes. The choline peak in vivo at 3.0 T probably comprises phosphocholine, phospoethanolamine, and glycerophosphocholine, which in perchloric acid extracts have all been assigned to resonances between 3.21 and 3.23 ppm (40). Creatine, which is synthesized in the liver, has a methyl resonance that could usually also be observed at about 3.06 ppm, but in this study, signal-to-noise ratio and resolution were insufficient to reliably quantify creatine.
Glycogen is present in glucosyl unit concentrations of about 270 mmol/kg wet weight in human livers (41) and 110–800 mmol/kg wet weight in rabbit livers (42). Glycogen was visible in human liver tissue samples with high-resolution magic-angle spinning 1H MR spectroscopy (33), and mammalian glycogen was shown to be 100% visible in aqueous solutions with 1H MR spectroscopy (43) and with 13C MR spectroscopy (42). We observed much lower glycogen concentrations than those reported in Nilsson and Hultman (41). The T2 determined for glycogen was in agreement with the T2 of about 30 msec for aqueous solutions of glycogen at 360 MHz (43), but it is plausible that the hepatic cytosol changes the MR properties of much of the glycogen molecules relative to aqueous solutions (42,44). Glycogen in human muscle is visible with glycogen chemical exchange signal transfer (12), but there is no trace of glycogen resonances reported in human muscle 1H MR spectra.
Tenacious manual shimming is required to get line widths good enough to quantify metabolite signals, and a manual shim routine that is not gated to respiration demands an experienced operator. High lipid content obstructs glycogen quantification because of the glycerol signal at 4.2 ppm. Although this signal is much lower and faster decaying than the main lipid CH2 signal (21), this broad peak will interfere with accurate quantification of the glycogen signals, generally leading to a time-domain fit result with a single very broad line that may cover both glycerol and glycogen. This limit on the choice of subjects to those with low lipid content may cause a bias in the glycogen results.
The glycogen concentrations we found were much lower than those of reported biopsy results (41). This raises the question whether all glycogen is visible with this MR spectroscopic technique and whether the applied relaxation corrections are accurate. In this study, no external reference was used, and therefore it is not possible to estimate the quantitative accuracy or bias of the method.
There is no reference standard for hepatic choline. Glycogen within the same volume used for 1H MR spectroscopy could perhaps be quantified with 13C MR spectroscopy (5) or with biopsy results (41), but neither of these methods is as easily available for human studies as 1H MR spectroscopy.
The absolute quantification of choline is not subject to errors caused by water saturation, magnetization transfer, or even very large errors in saturation correction. Nonetheless, we may not be able to observe the less mobile phosphatidylcholine lipids in lipid bilayers with MR spectroscopy. Consequently, concentrations of choline showed a better correlation with subject age and glycogen content than with lipid content.
In conclusion, in vivo measurement of liver choline concentrations in healthy humans is feasible, and even measurement of glycogen can be achieved in some patients at 3.0 T with PRESS 1H MR spectroscopy by using navigator-guided synchronization to respiratory motion and state-of-the-art B0 field shimming techniques.
Advances in Knowledge.
• Proton MR spectroscopy at 3.0 T can be used to noninvasively quantify choline concentrations and observe glycogen in the human liver in vivo.
• MR spectroscopy–derived choline concentration in the human liver is 8.6 mmol per kilogram of wet weight ± 3.1, and choline concentrations are reported as a function of age and hepatic lipid content.
• T2 relaxation times for liver choline and glycogen resonances in the human liver at 3.0 T are reported.
Implications for Patient Care.
• Combined measurements of liver lipid content and choline may help identify the nature of dysfunctions in fat metabolism.
• A noninvasive measurement of liver glycogen potentially can be used to monitor changes in glucose storage in metabolic diseases such as diabetes.
Disclosures of Potential Conflicts of Interest: R.O. No relevant conflicts of interest to disclose. R.I.P. No relevant conflicts of interest to disclose. A.M.G. No relevant conflicts of interest to disclose.
Supplementary Material
Acknowledgments
The authors thank Andreas Greiser and Saurabh Shah of Siemens Medical Systems for providing the pulse sequences for gradient recalled-echo shimming and Jian Xu of Siemens Medical Systems for providing the navigator-gated PRESS sequence.
Received November 4, 2011; revision requested December 14; revision received March 6, 2012; accepted April 3; final version accepted April 27.
Funding: Authors are employees of the National Institutes of Health.
Abbreviations:
- AMARES
- advanced method for accurate, robust, and efficient spectral fitting
- PRESS
- point-resolved spectroscopy
References
- 1.Cowin GJ, Jonsson JR, Bauer JD, et al. Magnetic resonance imaging and spectroscopy for monitoring liver steatosis. J Magn Reson Imaging 2008;28(4):937–945 [DOI] [PubMed] [Google Scholar]
- 2.Machann J, Stefan N, Schick F. (1)H MR spectroscopy of skeletal muscle, liver and bone marrow. Eur J Radiol 2008;67(2):275–284 [DOI] [PubMed] [Google Scholar]
- 3.Tyszka JM, Silverman JM. Navigated single-voxel proton spectroscopy of the human liver. Magn Reson Med 1998;39(1):1–5 [DOI] [PubMed] [Google Scholar]
- 4.Li CW, Kuo YC, Chen CY, et al. Quantification of choline compounds in human hepatic tumors by proton MR spectroscopy at 3 T. Magn Reson Med 2005;53(4):770–776 [DOI] [PubMed] [Google Scholar]
- 5.Rothman DL, Magnusson I, Katz LD, Shulman RG, Shulman GI. Quantitation of hepatic glycogenolysis and gluconeogenesis in fasting humans with 13C NMR. Science 1991;254(5031):573–576 [DOI] [PubMed] [Google Scholar]
- 6.Hellerstein MK, Neese RA, Linfoot P, Christiansen M, Turner S, Letscher A. Hepatic gluconeogenic fluxes and glycogen turnover during fasting in humans: a stable isotope study. J Clin Invest 1997;100(5):1305–1319 [DOI] [PMC free article] [PubMed] [Google Scholar]
- 7.Jue T, Rothman DL, Tavitian BA, Shulman RG. Natural-abundance 13C NMR study of glycogen repletion in human liver and muscle. Proc Natl Acad Sci U S A 1989;86(5):1439–1442 [DOI] [PMC free article] [PubMed] [Google Scholar]
- 8.Beckmann N, Seelig J, Wick H. Analysis of glycogen storage disease by in vivo 13C NMR: comparison of normal volunteers with a patient. Magn Reson Med 1990;16(1):150–160 [DOI] [PubMed] [Google Scholar]
- 9.Roser W, Beckmann N, Wiesmann U, Seelig J. Absolute quantification of the hepatic glycogen content in a patient with glycogen storage disease by 13C magnetic resonance spectroscopy. Magn Reson Imaging 1996;14(10):1217–1220 [DOI] [PubMed] [Google Scholar]
- 10.Chen W, Avison MJ, Bloch G, Shulman RG. Proton NMR observation of glycogen in vivo. Magn Reson Med 1994;31(5):576–579 [DOI] [PubMed] [Google Scholar]
- 11.Chen W, Avison MJ, Zhu XH, Shulman RG. NMR studies of 1H NOEs in glycogen. Biochemistry 1993;32(43):11483–11487 [DOI] [PubMed] [Google Scholar]
- 12.van Zijl PC, Jones CK, Ren J, Malloy CR, Sherry AD. MRI detection of glycogen in vivo by using chemical exchange saturation transfer imaging (glycoCEST). Proc Natl Acad Sci U S A 2007;104(11):4359–4364 [DOI] [PMC free article] [PubMed] [Google Scholar]
- 13.Kim M, Gillen J, Landman BA, Zhou J, van Zijl PC. Water saturation shift referencing (WASSR) for chemical exchange saturation transfer (CEST) experiments. Magn Reson Med 2009;61(6):1441–1450 [DOI] [PMC free article] [PubMed] [Google Scholar]
- 14.Haubrich DR, Gerber N, Pflueger AB, Zweig M. Tissue choline studied using a simple chemical assay. J Neurochem 1981;36(4):1409–1417 [DOI] [PubMed] [Google Scholar]
- 15.Zeisel SH, Mar MH, Howe JC, Holden JM. Concentrations of choline-containing compounds and betaine in common foods. J Nutr 2003;133(5):1302–1307 [DOI] [PubMed] [Google Scholar]
- 16.Bredella MA, Ghomi RH, Thomas BJ, et al. Breath-hold 1H-magnetic resonance spectroscopy for intrahepatic lipid quantification at 3 Tesla. J Comput Assist Tomogr 2010;34(3):372–376 [DOI] [PMC free article] [PubMed] [Google Scholar]
- 17.Krssák M, Hofer H, Wrba F, et al. Non-invasive assessment of hepatic fat accumulation in chronic hepatitis C by 1H magnetic resonance spectroscopy. Eur J Radiol 2010;74(3):e60–e66 [DOI] [PubMed] [Google Scholar]
- 18.Fischbach F, Schirmer T, Thormann M, Freund T, Ricke J, Bruhn H. Quantitative proton magnetic resonance spectroscopy of the normal liver and malignant hepatic lesions at 3.0 Tesla. Eur Radiol 2008;18(11):2549–2558 [DOI] [PubMed] [Google Scholar]
- 19.Star-Lack JM, Adalsteinsson E, Gold GE, Ikeda DM, Spielman DM. Motion correction and lipid suppression for 1H magnetic resonance spectroscopy. Magn Reson Med 2000;43(3):325–330 [DOI] [PubMed] [Google Scholar]
- 20.Klessen C, Asbach P, Kroencke TJ, et al. Magnetic resonance imaging of the upper abdomen using a free-breathing T2-weighted turbo spin echo sequence with navigator triggered prospective acquisition correction. J Magn Reson Imaging 2005;21(5):576–582 [DOI] [PubMed] [Google Scholar]
- 21.Middleton MS, Hamilton G, Bydder M, Sirlin CB. How much fat is under the water peak in liver fat MR spectroscopy? [abstr]. In: Proceedings of the Seventeenth Meeting of the International Society for Magnetic Resonance in Medicine. Berkeley, Calif: International Society for Magnetic Resonance in Medicine, 2009; 4331 [Google Scholar]
- 22.Mifflin MD, St Jeor ST, Hill LA, Scott BJ, Daugherty SA, Koh YO. A new predictive equation for resting energy expenditure in healthy individuals. Am J Clin Nutr 1990;51(2):241–247 [DOI] [PubMed] [Google Scholar]
- 23.Shah S, Kellman P, Greiser A, Weale PJ, Zuehlsdorff S, Jerecic R. Rapid fieldmap estimation for cardiac shimming [abstr]. In: Proceedings of the Seventeenth Meeting of the International Society for Magnetic Resonance in Medicine. Berkeley, Calif: International Society for Magnetic Resonance in Medicine, 2009; 565 [Google Scholar]
- 24.de Beer R, van den Boogaart A, van Ormondt D, et al. Application of time-domain fitting in the quantification of in vivo 1H spectroscopic imaging data sets. NMR Biomed 1992;5(4):171–178 [DOI] [PubMed] [Google Scholar]
- 25.Bottomley PA. Spatial localization in NMR spectroscopy in vivo. Ann N Y Acad Sci 1987;508:333–348 [DOI] [PubMed] [Google Scholar]
- 26.Ogg RJ, Kingsley PB, Taylor JS. WET, a T1- and B1-insensitive water-suppression method for in vivo localized 1H NMR spectroscopy. J Magn Reson B 1994;104(1):1–10 [DOI] [PubMed] [Google Scholar]
- 27.Vanhamme L, van den Boogaart A, Van Huffel S. Improved method for accurate and efficient quantification of MRS data with use of prior knowledge. J Magn Reson 1997;129(1):35–43 [DOI] [PubMed] [Google Scholar]
- 28.MRUI home page http://sermn02.uab.cat/mrui/. Published December, 2009. Accessed June 30, 2011.
- 29.Naressi A, Couturier C, Devos JM, et al. Java-based graphical user interface for the MRUI quantitation package. MAGMA 2001;12(2-3):141–152 [DOI] [PubMed] [Google Scholar]
- 30.Klose U. In vivo proton spectroscopy in presence of eddy currents. Magn Reson Med 1990;14(1):26–30 [DOI] [PubMed] [Google Scholar]
- 31.Vanhamme L, Fierro RD, Van Huffel S, de Beer R. Fast removal of residual water in proton spectra. J Magn Reson 1998;132(2):197–203 [DOI] [PubMed] [Google Scholar]
- 32.Martínez-Granados B, Monleón D, Martínez-Bisbal MC, et al. Metabolite identification in human liver needle biopsies by high-resolution magic angle spinning 1H NMR spectroscopy. NMR Biomed 2006;19(1):90–100 [DOI] [PubMed] [Google Scholar]
- 33.Duarte IF, Stanley EG, Holmes E, et al. Metabolic assessment of human liver transplants from biopsy samples at the donor and recipient stages using high-resolution magic angle spinning 1H NMR spectroscopy. Anal Chem 2005;77(17):5570–5578 [DOI] [PubMed] [Google Scholar]
- 34.Knijn A, de Beer R, van Ormondt D. Frequency-selective quantification in the time domain. J Magn Reson 1992;97:444–450 [Google Scholar]
- 35.Forbes RM, Cooper AR, Mitchell HH. The composition of the adult human body as determined by chemical analysis. J Biol Chem 1953;203(1):359–366 [PubMed] [Google Scholar]
- 36.Snyder WS, Cook MJ, Nasset ES, Karhausen LR, Howell GP, Tipton IH. Report of the Task Group on Reference Man: chapter 2 gross and elemental content of reference man. Ann ICRP 1975;23:273–334 [Google Scholar]
- 37.Sharma P, Martin DR, Pineda N, et al. Quantitative analysis of T2-correction in single-voxel magnetic resonance spectroscopy of hepatic lipid fraction. J Magn Reson Imaging 2009;29(3):629–635 [DOI] [PMC free article] [PubMed] [Google Scholar]
- 38.Ouwerkerk R, Gharib AM, Skarulis M, Pettigrew RI. Concentrations of glycogen and choline compounds in human liver measured with 1H-MRS at 3T [abstr]. In: Proceedings of the Twentieth Meeting of the International Society for Magnetic Resonance in Medicine. Berkeley, Calif: International Society for Magnetic Resonance in Medicine, 2012; 4094 [Google Scholar]
- 39.Zhu H, Ouwerkerk R, Barker PB. Dual-band water and lipid suppression for MR spectroscopic imaging at 3 Tesla. Magn Reson Med 2010;63(6):1486–1492 [DOI] [PMC free article] [PubMed] [Google Scholar]
- 40.Moreno A, López LA, Fabra A, Arús C. 1H MRS markers of tumour growth in intrasplenic tumours and liver metastasis induced by injection of HT-29 cells in nude mice spleen. NMR Biomed 1998;11(3):93–106 [DOI] [PubMed] [Google Scholar]
- 41.Nilsson LH, Hultman E. Liver and muscle glycogen in man after glucose and fructose infusion. Scand J Clin Lab Invest 1974;33(1):5–10 [DOI] [PubMed] [Google Scholar]
- 42.Gruetter R, Magnusson I, Rothman DL, Avison MJ, Shulman RG, Shulman GI. Validation of 13C NMR measurements of liver glycogen in vivo. Magn Reson Med 1994;31(6):583–588 [DOI] [PubMed] [Google Scholar]
- 43.Zang LH, Rothman DL, Shulman RG. 1H NMR visibility of mammalian glycogen in solution. Proc Natl Acad Sci U S A 1990;87(5):1678–1680 [DOI] [PMC free article] [PubMed] [Google Scholar]
- 44.Künnecke B, Seelig J. Glycogen metabolism as detected by in vivo and in vitro 13C-NMR spectroscopy using [1,2-13C2] glucose as substrate. Biochim Biophys Acta 1991;1095(2):103–113 [DOI] [PubMed] [Google Scholar]
Associated Data
This section collects any data citations, data availability statements, or supplementary materials included in this article.