

Abstract
MicroRNAs are a group of intracellular non-coding RNA molecules that have been implicated in a variety of human diseases. Due to their high stability in blood, microRNAs released into circulation could be potentially utilized as non-invasive biomarkers for diagnosis or prognosis. Current microRNA isolation protocols are specifically designed for solid tissues and are impractical for biomarker development utilizing small-volume serum samples on a large scale. Thus, a protocol for microRNA isolation from serum is needed to accommodate these conditions in biomarker development. To establish such a protocol, we developed a simplified approach to normalize sample input by using single synthetic spike-in microRNA. We evaluated three commonly used commercial microRNA isolation kits for the best performance by comparing RNA quality and yield. The manufacturer’s protocol was further modified to improve the microRNA yield from 200 μL of human serum. MicroRNAs isolated from a large set of clinical serum samples were tested on the miRCURY LNA real-time PCR panel and confirmed to be suitable for high-throughput microRNA profiling. In conclusion, we have established a proven method for microRNA isolation from clinical serum samples suitable for microRNA biomarker development.
Keywords: serum, microRNA, real-time PCR, biomarker
INTRODUCTION
MicroRNAs belong to a new class of endogenous non-coding RNA species that play an essential role in regulating cellular gene expression at post-transcriptional levels [1]. With more than 1,500 human microRNAs identified experimentally or by bioinformatics [2], they are known to be key regulators of many critical biological processes, such as cell cycle progression and cell death [3; 4; 5]; as well as homeostasis of glucose [6], cholesterol [7], and iron [8]. By the same token, microRNAs have been implicated in many important human conditions including viral diseases [9; 10; 11], immune diseases [12; 13; 14], neurological disorders [15; 16; 17], and cancers [18; 19; 20; 21]. As microRNAs are positioned up-stream in regulation cascades [1], their expression patterns could be more predictive of pathological changes, and therefore allow earlier detection of rapidly progressive terminal diseases.
MicroRNAs have been considered a promising candidate for the next generation of diagnostic biomarkers because of the strong correlation between microRNA expression patterns and disease status demonstrated not only in animal models but also in patients [10; 22; 23; 24; 25]. While disease-associated microRNA signatures have been largely identified in solid tissues obtained by invasive procedures, recent proof-of-concept studies suggest that serum microRNAs are reliable indicators of disease status [26; 27], asserting their potential value in early, non-invasive diagnosis. Importantly, microRNAs are remarkably stable in serum for extended periods of time due to two mechanisms: 1. formation of a ribonucleoprotein complex with Argonaute proteins and 2. incorporation into exosomes [28]. These unique properties could allow the continued usage of established specimen collection and processing protocols. Given that phlebotomy is significantly safer and more affordable than the invasive procedures used for solid tissue sampling, serum is an ideal target for diagnostic biomarker development.
To study microRNAs in serum for biomarker identification, a protocol to extract microRNA from a small volume of serum needs to be established for high-throughput microRNA screening. Current serum microRNA isolation protocols require a relatively large volume of sample to yield enough RNA for down-stream applications. Therefore, clinical serum samples from multiple patients were often pooled to meet that requirement [26; 27]. This practice might weaken the power of statistical analyses that are necessary in clinical research, thereby leading to false negative findings. Furthermore, both endogenous and synthetic RNA controls have been used in microRNA quantification to normalize sample input [29]. However, the usage of these controls has not been evaluated in studies involving clinical serum samples, although such a control is essential for accurate microRNA quantification.
In this study, we compared three commonly used microRNA isolation kits for best RNA quality and yield, and were able to improve the microRNA yield by modifying the commercial protocol. We also assessed the use of both synthetic microRNA spike-in and endogenous microRNA as the approach to normalize RNA input. We tested the isolated microRNAs from a large number of patients in high-throughput real-time PCR, a widely used platform for microRNA screening. We believe that the data from our study could serve as good reference for researchers who are interested in studying serum microRNAs for biomarker development.
MATERIAL AND METHODS
Serum samples
All participants provided written informed consent to participate in the study. The protocol for tissue collection was adherence to ethical standards for patient protection and was approved by our institutional review board. Whole blood samples were previously collected, during a randomized, double-blind controlled trial, in red top Vacutainer tubes (BD, NJ) from 66 patients diagnosed with primary sclerosing cholangitis (PSC) [30] and from 51 healthy blood donors. A total of 156 blood samples including 105 disease and 51 disease-free samples were included in this study. Blood samples were left at room temperature for 30 minutes to allow complete coagulation. Coagulated samples were then spun at 1,500 g for 15 minutes at 4 °C to separate serum. Serum was transferred to a new CryoTube (Nunc, NY) with care to not disturb the buffy coat. Serum samples were immediately frozen at −80 °C until RNA extraction.
RNA spike-in
Synthetic C. elegans microRNAs (cel-miR-39, cel-miR-54 and cel-miR-238) (Integrated DNA Technologies, IA) were reconstituted in nuclease-free water (Ambion, TX) to 4 μmol/μL. Then, twelve ten-fold serial dilutions into nuclease-free water were made for titration. The diluted spike-in controls were stored at −80 °C until use.
RNA extraction
The miRNeasy kit (Qiagen, CA), the miRVana PARIS kit (Ambion, TX), and the total RNA isolation kit (Norgen Biotek, Canada) were evaluated for total RNA extraction using 200 μL of serum aliquots from one healthy individual. Before RNA extraction, all serum samples were thawed completely on ice followed by centrifugation once at 20,000 g for 15 minutes at 4°C to remove remaining cell debris. Then, 200 μL of serum sample was carefully transferred to a new 2 mL DNA-LoBind tube (Eppendorf, Germany). Serum was mixed with denaturing buffer in the volumes described within the manufacturers’ protocols. The mixture was placed on a vortex mixer at 3,000 rpm for 15 seconds, and then left at room temperature for 5 minutes to allow complete inactivation of serum RNases. Then, 20 fmol of synthetic microRNA was spiked into the mixture. From here, the manufacturers’ protocols were followed for RNA extraction. Total RNA isolated by all three kits was eluted by 50 μL of nuclease-free water (Ambion TX). The miRNeasy kit was used to extract total RNA from diseased and disease-free samples for microRNA profiling experiments. The RNA concentration was measured using a NanoDrop ND-1000 spectrophotometer (NanoDrop Technologies, DE).
RNA QC
The quality of RNA was evaluated on a Bioanalyzer 2100 instrument (Agilent, CA) using the small RNA kit and the Nano 6000 kit (Agilent, CA). On the electropherogram of the microchip gel electrophoresis, we arbitrarily defined small RNA and microRNA as RNA species in length from 10 nt to 150 nt and from 14 nt to 29 nt, respectively.
Reverse Transcription
Synthetic microRNAs, miR-223, and miR-21 were reverse-transcribed using commercial primers and the Taqman microRNA reverse-transcription kit (Applied Biosystems, CA) according to the manufacturer’s protocol. 5 μL of RNA was reverse-transcribed in a 15 μL reaction volume for each assay. The miRCURY LNA universal cDNA synthesis kit (Exiqon, Denmark) was used to make cDNA for microRNA profiling according to the manufacturer’s protocol. 15 μL of total RNA was reverse-transcribed in a 40 μL reaction volume.
Real-time PCR
Taqman microRNA probes (cel-miR-39, cel-miR-54, cel-miR-238, hsa-miR-21 and hsa-miR-223) and Taqman Master Mix without AmpEase UNG (Applied Biosystems, CA) were used to quantify synthetic microRNA spike-ins and cellular microRNAs in real-time PCR assays according to the manufacturer’s protocols. Individual real-time PCR assays were performed in a 20 μL reaction volume on an ABI 7500 real-time PCR system (Applied Biosystems, CA). The real-time PCR efficiency was calculated using the formula: Efficiency=10(−1/slope)-1. The miRCURY LNA Human microRNA real-time PCR panel I and the miRCURY SYBR green Master Mix (Exiqon, Denmark) were used in microRNA profiling experiments according to the manufacturer’s protocols. cDNA was further diluted 55 fold for a 384-well real-time PCR panel. 1 μL of ROX reference dye (Invitrogen, NY) was added to real-time PCR master mix. A reaction volume of 10 μL was applied. The real-time PCR panel was run on an ABI 7900HT real-time PCR system (Applied Biosystems, CA).
Statistical analyses
Student t-test p-values, and standard deviations (SD) were calculated by MS EXCEL. GenEx 5.0 (MultiD Analyses, Sweden) was used to perform inter-plate normalization among miRCURY LNA real-time PCR plates according to the manufacturer’s manual.
RESULTS AND DISCUSSION
Determination of synthetic microRNA spike-in control
Relative quantification is the most common strategy to assess RNA expression differences between two samples. An endogenous control is routinely used for normalization of sample input. This endogenous control is usually a messenger RNA (mRNA) or a ribosomal RNA (rRNA) that is abundantly expressed in tissue or cultured cells and is unaffected by different treatments or experimental conditions. Finding such controls in serum is difficult because most large RNA species including mRNA and rRNA are absent in serum due to high levels of RNases present in blood. For this reason, endogenous microRNA species have been considered as an alternative control due to their remarkable stability in serum [27; 31]. However, the applicability of an endogenous microRNA control is disease- or treatment- specific [29; 32]; therefore, using endogenous microRNA to normalize sample input may introduce bias.
An alternative to endogenous control is synthetic microRNA spike-ins which have been used previously in serum biomarker identification [27]. In this study, we performed independent evaluation of three synthetic C. elegans spike-in microRNAs that were used previously [27; 28]. First, we established standard curves using real-time PCR cycle numbers. We found that the linear range for all three synthetic microRNAs were within six log-orders, between 0.4 amol to 40 fmol (Figure 1a). Because the cel-miR-54 probe demonstrated the best PCR efficiency among the three tested spike-ins (Table 1), we chose this microRNA as the sole spike-in in order to simplify the normalization process. Next, we evaluated if 20 fmol, the amount used in previous reports [27; 28], was an appropriate amount in our experimental setting. Shown in Figure 1b, the Ct value of 20 fmol cel-miR-54 after RNA extraction fell within the linear range of the standard curve. Therefore, we concluded that 20 fmol of cel-miR-54 was a proper spike-in control for microRNA isolation from 200 μL serum.
Fig. 1. Determination of synthetic microRNA spike-in controls.
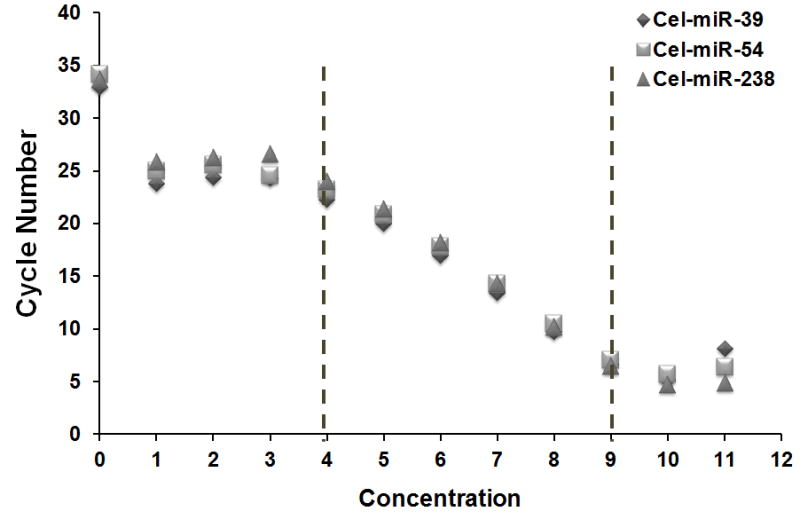
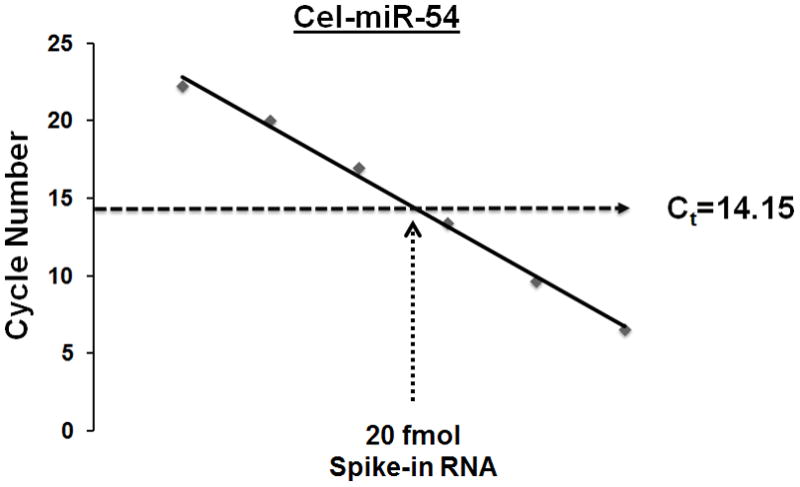
A: Titration of synthetic microRNA spike-in controls. Concentration: 0–3:0–40 zmol/μL; 4–9: 0.4 amol/μL-40 fmol/μL; 10–11: 400 fmol/μL-4 pmol/μL. The average Ct values from quadruplicate wells were used to produce the standard curves. B: The Ct value of 20 fmol cel-miR-54 spiked into 200 μL serum from one healthy individual. The Ct value fell into the linear range of standard curve. The Ct value represents an average of twenty replicate wells from 5 independent extractions.
Table 1.
PCR efficiency of three synthetic spike-in microRNAs. The PCR efficiency and correlation-coefficient values were determined using the data in the linear range.
| Spike in-microRNA | PCR efficiency (%) | Correlation coefficient (R2) |
|---|---|---|
| Cel-miR-39 | 104 | 0.99 |
| Cel-miR-54 | 101 | 0.99 |
| Cel-miR-238 | 91 | 0.99 |
RNA quality
The quality of RNA is critical for accurate microRNA quantification. Unlike the exosome or RNP complex protected endogenous microRNAs in serum, naked spike-in microRNA is subject to rapid degradation if RNases are not completely inactivated at the beginning of the RNA isolation process. The degradation of spike-in microRNA during the RNA isolation process would lead to inaccurate quantification in down-stream applications. To inactivate serum RNases, RNase-inhibiting denaturing reagents are routinely used. However, if RNase-inhibiting denaturing reagents are not removed completely from the RNA extract, the residual denaturing reagents could inhibit enzymatic reactions such as reverse-transcription (RT) and polymerase chain reaction (PCR), thereby compromising the sensitivity of down-stream quantification assays. For this reason, a filtering agent is necessary to remove residual denaturing reagents. Currently, a strategy of combining denaturing reagent and a silica filter has been adopted by commercial kits, such as the miRNeasy kit (Qiagen), the miRVana PARIS kit (Ambion) and the total RNA kit (Norgen). Although these kits are commonly used to isolate total RNA that contains microRNA species, an independent cross-comparison of these kits is not available. We compared the quality of serum total RNA isolated by these three kits. The large RNA species such as mRNAs and ribosomal subunits 18s and 28s were absent in total RNA samples examined using a Bioanalyzer (Data not shown), likely due to the presence of serum RNases. However, the microRNA fraction with sizes of approximately 22 nt were present in total RNA from all three kits (Figure 2a). Due to the absence of 18s and 28s rRNA species in serum, the quality of isolated RNA samples could not be determined by RNA Integrity Number (RIN). Instead, we used the percentage of microRNA in small RNA as the criterion to assess the RNA quality. Since most if not all large RNA species have been degraded in serum, the total RNA extracted from serum should mainly comprise small RNA including microRNA, and short fragments of degraded large RNA species. Here, we arbitrarily define small RNA as RNA species in size between 10–150 nt, different from the size range of 6–150 nt that was automatically set by Bioanalyzer. We chose 10 nt as the low end for accurate measurement by completely excluding the lower marker peak centered at 4 nt. As the size of known human microRNAs is between 16 and 27 nt (miRBase sequence database-release 19, www.miRBase.org), we chose the size range of 14–29 nt for microRNA measurement to completely include microRNAs peaks centered at 16 nt and 27 nt. A higher proportion of microRNA in small RNA indicates less microRNA degradation and therefore higher microRNA quality. Notably, 67.1% and 66.7% of small RNA isolated by the Qiagen kit and the Ambion kit, respectively, were microRNA fractions. This ratio was significantly higher than 21.2% obtained by the Norgen kit (Figure 2b). Our data therefore suggest that RNA isolated by the Qiagen or Ambion kits have better quality than the Norgen Kit.
Fig. 2. RNA quality.

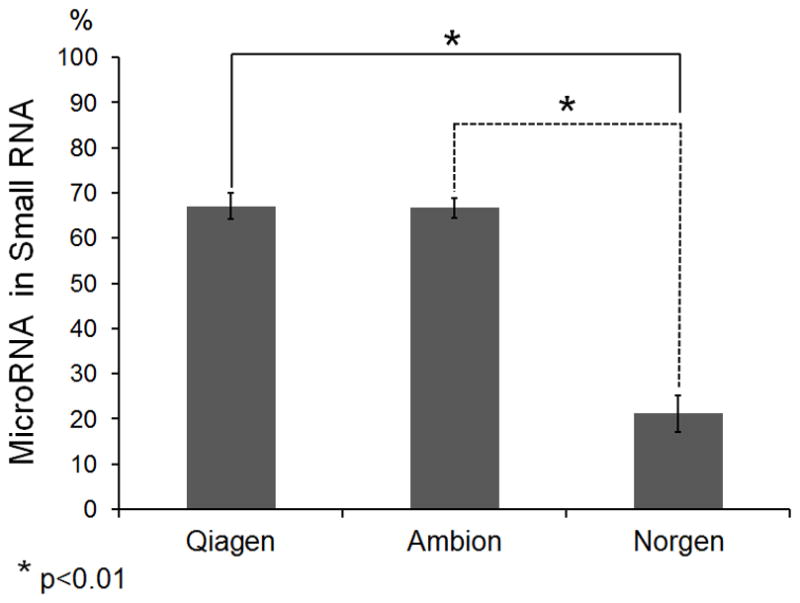
A: Left. Fluorescence intensity of small RNA fractions at different sizes. Two dash-lines (10–150 nt) indicate the size range for small RNA measurement. The lower marker peak centered at 4 nt is partially shown. Right. Gel electrophoresis analysis of small RNA fractions on an Agilent small RNA chip. Gel images demonstrate small RNA profiles of RNA samples isolated by Qiagen, Ambion and Norgen kits. The “Gel Enhanced View” function of Bioanalyzer was turned on to show low abundant RNA species. It is a representation of three repeat extractions. B: Percentage of microRNA in small RNA fractions. Small RNA and microRNA were defined as RNA species in size between 10 nt and 150 nt, and between 14 nt and 29 nt, respectively. The quantification of each RNA species was performed using a Bioanalyzer. A student t-test was performed to evaluate statistical significance. The percentage was an average of three repeat extractions.
RNA yield
It is important to maximize the yield of isolated microRNA. As microRNA abundance in serum is significantly lower than that in solid tissues, low RNA yield would result in failure of detection of microRNA signatures present in low abundance. Among the three kits we tested, the Qiagen kit yielded the microRNA with highest concentration (Figure 3a). As RNA was eluted in the same volume of solution in using all three kits, the concentration of microRNA would directly indicate the microRNA yield. While the concentration of microRNA from the Qiagen kit was 48.8 pg/μL, the concentrations of microRNA from the Ambion kit and the Norgen kit were 29.3 pg/μL and 11.7 pg/μL, respectively. In addition, we measured the relative abundance of two circulating microRNAs miR-223 and miR-21 using cel-miR-54 spike-in to normalize sample input. Consistent with the Bioanalyzer result, our quantitative real-time PCR results indicated that the Qiagen Kit was able to recover more endogenous microRNA than the other kits (Figure 3b). Serum miR-223 and miR-21 were recently demonstrated as potential biomarkers in diagnosis of liver cancer [31]. As the levels of miR-223 and miR-21 could be reliably measured in this study as well, our data confirm that this novel serum RNA isolation protocol could be used for measuring serum microRNA levels by individual real-time PCR assays.
Fig. 3. RNA Yield.
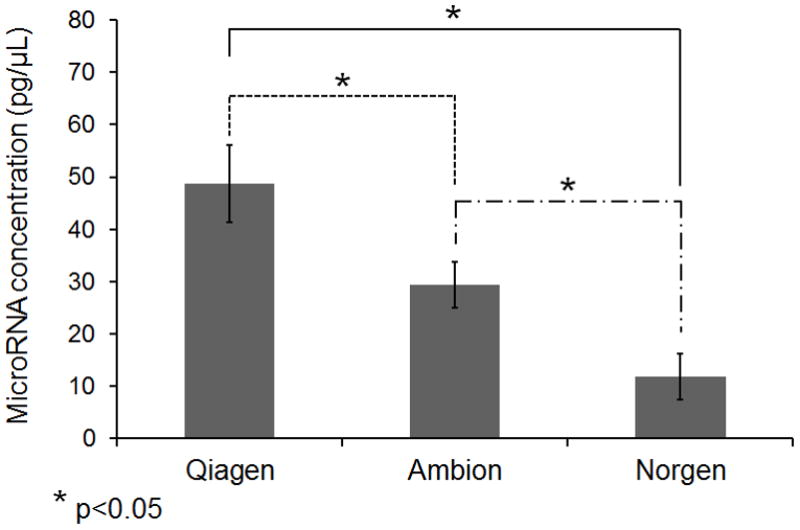
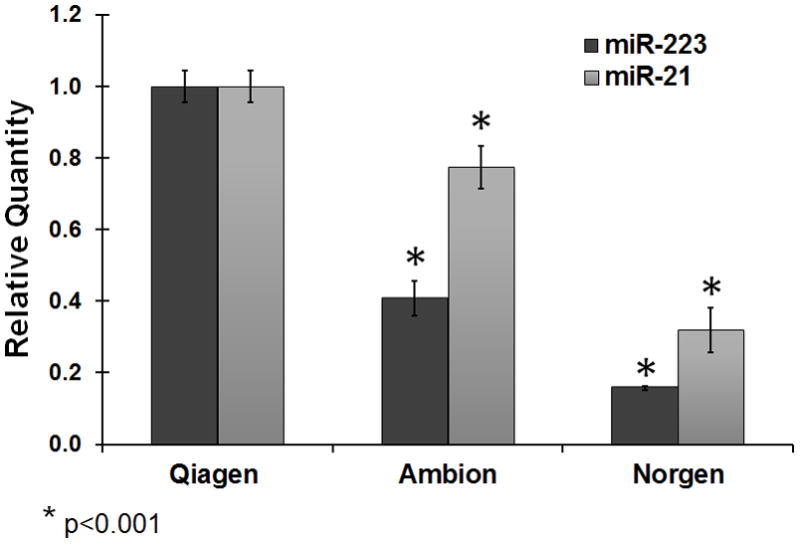
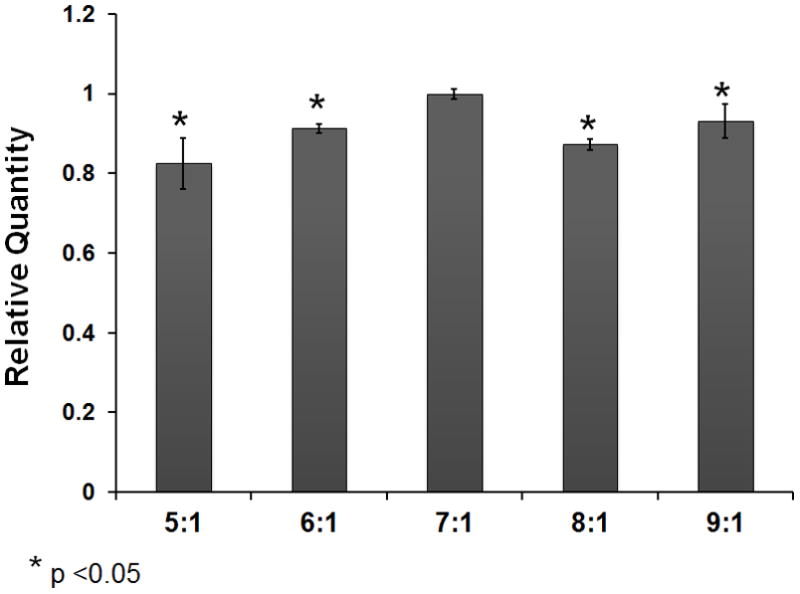
A: MicroRNA concentrations in RNA samples extracted from 200 μL serum from one healthy individual measured using a Bioanalyzer. MicroRNA was defined as RNA species in size between 14 and 29 nt. The concentration represents an average of three repeat extractions. B: Relative quantification (RQ) of miR-21 and miR-223 in extracted serum RNA samples using three kits. The miR-21 and miR-223 abundance in samples extracted using the Ambion and Norgen kits was relative to that in samples extracted using the Qiagen kit. The relative abundance of microRNAs was measured by real-time PCR assays. The microRNA RQ was normalized by the abundance of cel-miR-54. RQ represents the average RQ of three repeat extractions. Quadruplicate wells were used in PCR assays. C: microRNA yield at different Qiazol:Serum ratio using the miRNeasy kit. The microRNA quantification at other ratio was relative to that at the ratio of 7:1. The calculation was based on the ΔCt of cel-miR-54 between two samples. 200 μL serum was used. A student t-test was performed to evaluate statistical significance. The RQ represents an average of three repeat extractions.
We also measured the quantity of extracted total RNA with a NanoDrop spectrophotometer for individual variation. The RNA concentrations were low and in a wide range. Among 156 human serum samples, the average quantity of recovered total RNA from 200 μL of serum was 258.2±97.6 ng [mean±SD] in disease-free samples and 218.1±111.6 ng [mean±SD] in disease samples (Table 2). This quantity was significantly higher than that in previous studies, wherein recovery was reported to be approximately 120 ng total RNA yield from 200 μL serum [31]. Our results indicate that the abundance of total RNA in serum is highly variable among individuals. It also suggests that the quality of total RNA should not be used for input normalization in relative quantification of serum microRNA. Notably, the total RNA yield between disease samples and disease-free samples was significantly different (student t-test p-value <0.01) (Table 2). It may implicate distinct serum microRNA expression profiles between these two groups.
Table 2.
Quantity of RNA extracted from 156 human serum samples. The RNA quantities were determined using a Nanodrop. A student t-test was used to evaluate statistical significance.
| Total RNA* | Healthy (n=51) | Diseased (n=105) |
|---|---|---|
| Average** (ng) | 258.2 [139.5–560] | 218.1 [56–853.5] |
| Median (ng) | 252.0 | 189.5 |
| Standard Deviation (ng) | 97.6 | 111.6 |
| Abs Ratio260nm/280nm | 1.15 [0.92–1.5] | 1.07 [0.8–1.66] |
| Abs Ratio260nm/230nm | 0.19 [0.04–0.41] | 0.24 [0.06–0.42] |
Recovered from 200 μL serum
p-value <0.01
[Range]
Since the Qiagen kit was not specifically designed for microRNA extraction from serum samples, we sought to further improve the yield by modifying its current protocol designed for tissue and cells. For this purpose, we assessed the relationship between the ratios of the denaturing buffer Qiazol to serum and the resulting yields. Our results indicate that the RNA yield was positively correlated with Qiazol:Serum ratio with highest yield at the ratio of 7:1 (Figure 3c). When the ratio is above 7, the sample cannot be accommodated in a 2 mL Eppendorf tube and must be processed in separate tubes, resulting in greater RNA loss (Figure 3c). We also considered increasing the ratio by lowering the initial serum input. However, the yield increase by raising the ratio could not fully compensate for lower quantity of microRNA extracted from a smaller volume of serum. Taken together, although increasing the Qiazol/serum ratio higher than 7 could increase the microRNA yield in theory, this would require either sacrificing microRNA quantity or developing specialized processing equipment.
Application
Next generation sequencing (NGS), microarray, and real-time PCR are the currently available methods used to measure microRNA abundance in expression profiling studies. NGS is not yet practical for serum microRNA profiling studies involving large number of patients due to the requirement of significantly larger RNA input [33]. Although the RNA input required by microRNA microarrays is comparable to real-time PCR [34], microarrays offer less sensitivity and require significantly more effort for data processing. Thus, real-time PCR is the most commonly used approach in microRNA quantification. The sensitivity and specificity of real-time PCR, as well as its flexibility in both high-throughput expression profiling and quantification by individual assays makes this approach of measuring microRNA abundance most attractive. In this study, we tested the RNA isolated from 200 μL human serum on the real-time PCR assay panel using locked nucleic acid (LNA) modified probes [35], an increasing popular approach in the field [28; 36].
We compared the cycle numbers of reverse-transcribed serum microRNAs and non-RT controls in real-time PCR assays. The cycle numbers of 375 human microRNAs with RT were between 22 to 40; while none of the cycle numbers in the non-RT control was smaller than 35 (Figure 4). This suggests that serum microRNAs can be detected in the LNA real-time PCR panel. It also suggests that the DNA contamination in the serum RNA samples extracted using our protocol is negligible. Then, we assessed the variations of microRNA quantities among a large number of samples using standard deviation (SD) of cycle numbers. We found that the cycle number of most microRNAs vary greatly among samples. The microRNAs with the lowest SD are miR-103, miR-191 and miR-423-5p. Nevertheless, their SD values were still significantly greater than that of the synthetic spike-in cel-miR-54 (Table 3). Thus, synthetic spike-in microRNA performed better for normalizing sample input than the most stably expressed endogenous microRNAs, as its abundance was less affected by sample variations. Interestingly, the abundance of U6 and miR-16, two commonly used endogenous controls for microRNA quantification, were highly variable among a large number of clinical serum samples compared with spike-in RNA controls (Table 3), suggesting that they should not be used as the control in serum microRNA biomarker identification. Taken together, our results indicate that serum microRNA isolated by our protocol is suitable for real-time PCR based microRNA profiling experiments.
Fig. 4. Down-stream Application.
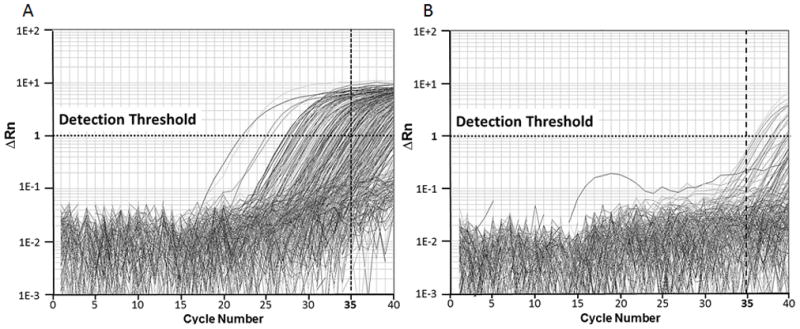
Amplification plot of 375 human cellular microRNAs. The detection threshold was set at 1. Cycle number of 35 was set as cutoff for positive amplification. A: With reverse transcription (RT): a large number of microRNAs were detected before the 35th cycle; B: non-RT control: None of microRNAs were detected before the 35th cycle.
Table 3.
Average cycle number and standard deviation of synthetic spike-in microRNA, endogenous microRNAs and small RNAs. The standard deviations of spike-in RNA and endogenous RNAs in 105 PSC samples were calculated.
| Small RNA Controls | Ct Average | Ct Standard Deviation |
|---|---|---|
| cel-miR-54# | 13.72 | 0.39 |
| miR-423-5p | 31.02 | 0.69 |
| miR-103 | 30.09 | 0.96 |
| miR-191 | 31.9 | 1.15 |
| U6 | 32.35 | 1.32 |
| miR-16 | 25.78 | 1.36 |
Synthetic Spike-in
Circulating microRNA signatures can be identified in either serum or plasma [37]; however, because serum is free of anti-coagulants such as heparin, a potent inhibitor of down-stream PCR reactions, it delivers more consistent measurements [38]. Because of this, use of archived plasma samples is discouraged for biomarker identification. Also important to note when processing patient blood, serum samples may be less affected by hemolysis than plasma samples. A recent study suggested that significant variation of microRNA expression in plasma may be contributed by blood-cell specific and platelet specific microRNAs from hemolysis [39]. Improper handling of plasma sample could increase the risk of hemolysis and dilute the quality of down-stream data analysis. By contrast, the standard serum isolation procedure is relatively more consistent, as whole blood samples are set to coagulate naturally. Thus, data comparison of serum samples collected at different research centers would be more feasible.
In conclusion, we established a protocol to isolate microRNA from 200 μL of human serum. This protocol was able to extract high quality microRNAs with enough yield for high-throughput real-time PCR profiling experiments. Synthetic microRNA spike-in was found to be a more effective control than an endogenous microRNA for input normalization. We believe the information provided in this report is valuable for researchers interested in developing serum microRNA biomarkers for diagnosis or prognosis of a wide range of disease.
Acknowledgments
We thank James Nelson, J. Barton Rose III and Bryan Maliken for helpful discussions and editing assistance of the manuscript. This study was supported by the NIDDK grant 3R01DK056924-08S1.
Footnotes
DISCLOSURE: The authors declare no conflict of interest.
Publisher's Disclaimer: This is a PDF file of an unedited manuscript that has been accepted for publication. As a service to our customers we are providing this early version of the manuscript. The manuscript will undergo copyediting, typesetting, and review of the resulting proof before it is published in its final citable form. Please note that during the production process errors may be discovered which could affect the content, and all legal disclaimers that apply to the journal pertain.
References
- 1.Bartel DP. MicroRNAs: Genomics, Biogenesis, Mechanism, and Function. Cell. 2004;116:281–297. doi: 10.1016/s0092-8674(04)00045-5. [DOI] [PubMed] [Google Scholar]
- 2.Kozomara A, Griffiths-Jones S. miRBase: integrating microRNA annotation and deep-sequencing data. Nucleic acids research. 2011;39:D152–7. doi: 10.1093/nar/gkq1027. [DOI] [PMC free article] [PubMed] [Google Scholar]
- 3.Ng R, Song G, Roll GR, Frandsen NM, Willenbring H. A microRNA-21 surge facilitates rapid cyclin D1 translation and cell cycle progression in mouse liver regeneration. The Journal of Clinical Investigation. 2012;0:0. doi: 10.1172/JCI46039. [DOI] [PMC free article] [PubMed] [Google Scholar]
- 4.Raver-Shapira N, Marciano E, Meiri E, Spector Y, Rosenfeld N, Moskovits N, Bentwich Z, Oren M. Transcriptional Activation of miR-34a Contributes to p53-Mediated Apoptosis. Molecular cell. 2007;26:731–743. doi: 10.1016/j.molcel.2007.05.017. [DOI] [PubMed] [Google Scholar]
- 5.Feng S, Cong S, Zhang X, Bao X, Wang W, Li H, Wang Z, Wang G, Xu J, Du B, Qu D, Xiong W, Yin M, Ren X, Wang F, He J, Zhang B. MicroRNA-192 targeting retinoblastoma 1 inhibits cell proliferation and induces cell apoptosis in lung cancer cells. Nucleic acids research. 2011;39:6669–6678. doi: 10.1093/nar/gkr232. [DOI] [PMC free article] [PubMed] [Google Scholar]
- 6.Teleman AA, Cohen SM. Drosophila lacking microRNA miR-278 are defective in energy homeostasis. Genes & Development. 2006;20:417–422. doi: 10.1101/gad.374406. [DOI] [PMC free article] [PubMed] [Google Scholar]
- 7.Rayner KJ, Suárez Y, Dávalos A, Parathath S, Fitzgerald ML, Tamehiro N, Fisher EA, Moore KJ, Fernández-Hernando C. MiR-33 Contributes to the Regulation of Cholesterol Homeostasis. Science. 2010;328:1570–1573. doi: 10.1126/science.1189862. [DOI] [PMC free article] [PubMed] [Google Scholar]
- 8.Castoldi M, Vujic Spasic M, Altamura S, Elmén J, Lindow M, Kiss J, Stolte J, Sparla R, D’Alessandro LA, Klingmüller U, Fleming RE, Longerich T, Gröne HJ, Benes V, Kauppinen S, Hentze MW, Muckenthaler MU. The liver-specific microRNA miR-122 controls systemic iron homeostasis in mice. The Journal of Clinical Investigation. 2011;121:1386–1396. doi: 10.1172/JCI44883. [DOI] [PMC free article] [PubMed] [Google Scholar]
- 9.Jopling CL, Yi M, Lancaster AM, Lemon SM, Sarnow P. Modulation of hepatitis C virus RNA abundance by a liver-specific MicroRNA. Science. 2005;309:1577–81. doi: 10.1126/science.1113329. [DOI] [PubMed] [Google Scholar]
- 10.Li Y, Chan EY, Li J, Ni C, Peng X, Rosenzweig E, Tumpey TM, Katze MG. MicroRNA Expression and Virulence in Pandemic Influenza Virus-Infected Mice. Journal of Virology. 2010;84:3023–3032. doi: 10.1128/JVI.02203-09. [DOI] [PMC free article] [PubMed] [Google Scholar]
- 11.Huang J, Wang F, Argyris E, Chen K, Liang Z, Tian H, Huang W, Squires K, Verlinghieri G, Zhang H. Cellular microRNAs contribute to HIV-1 latency in resting primary CD4+ T lymphocytes. Nat Med. 2007;13:1241–1247. doi: 10.1038/nm1639. [DOI] [PubMed] [Google Scholar]
- 12.Murugaiyan G, Beynon V, Mittal A, Joller N, Weiner HL. Silencing MicroRNA-155 Ameliorates Experimental Autoimmune Encephalomyelitis. The Journal of Immunology. 2011;187:2213–2221. doi: 10.4049/jimmunol.1003952. [DOI] [PMC free article] [PubMed] [Google Scholar]
- 13.Kurowska-Stolarska M, Alivernini S, Ballantine LE, Asquith DL, Millar NL, Gilchrist DS, Reilly J, Ierna M, Fraser AR, Stolarski B, McSharry C, Hueber AJ, Baxter D, Hunter J, Gay S, Liew FY, McInnes IB. MicroRNA-155 as a proinflammatory regulator in clinical and experimental arthritis. Proceedings of the National Academy of Sciences. 2011;108:11193–11198. doi: 10.1073/pnas.1019536108. [DOI] [PMC free article] [PubMed] [Google Scholar]
- 14.Mattes J, Collison A, Plank M, Phipps S, Foster PS. Antagonism of microRNA-126 suppresses the effector function of TH2 cells and the development of allergic airways disease. Proceedings of the National Academy of Sciences. 2009;106:18704–18709. doi: 10.1073/pnas.0905063106. [DOI] [PMC free article] [PubMed] [Google Scholar]
- 15.Siegel C, Li J, Liu F, Benashski SE, McCullough LD. miR-23a regulation of X-linked inhibitor of apoptosis (XIAP) contributes to sex differences in the response to cerebral ischemia. Proceedings of the National Academy of Sciences. 2011;108:11662–11667. doi: 10.1073/pnas.1102635108. [DOI] [PMC free article] [PubMed] [Google Scholar]
- 16.Cohen JE, Lee PR, Chen S, Li W, Fields RD. MicroRNA regulation of homeostatic synaptic plasticity. Proceedings of the National Academy of Sciences. 2011;108:11650–11655. doi: 10.1073/pnas.1017576108. [DOI] [PMC free article] [PubMed] [Google Scholar]
- 17.Lukiw WJ, Zhao Y, Cui JG. An NF-κB-sensitive Micro RNA-146a-mediated Inflammatory Circuit in Alzheimer Disease and in Stressed Human Brain Cells. Journal of Biological Chemistry. 2008;283:31315–31322. doi: 10.1074/jbc.M805371200. [DOI] [PMC free article] [PubMed] [Google Scholar]
- 18.Calin GA, Dumitru CD, Shimizu M, Bichi R, Zupo S, Noch E, Aldler H, Rattan S, Keating M, Rai K, Rassenti L, Kipps T, Negrini M, Bullrich F, Croce CM. Frequent deletions and down-regulation of micro- RNA genes miR15 and miR16 at 13q14 in chronic lymphocytic leukemia. Proceedings of the National Academy of Sciences. 2002;99:15524–15529. doi: 10.1073/pnas.242606799. [DOI] [PMC free article] [PubMed] [Google Scholar]
- 19.Gramantieri L, Ferracin M, Fornari F, Veronese A, Sabbioni S, Liu CG, Calin GA, Giovannini C, Ferrazzi E, Grazi GL, Croce CM, Bolondi L, Negrini M. Cyclin G1 Is a Target of miR-122a, a MicroRNA Frequently Down-regulated in Human Hepatocellular Carcinoma. Cancer Research. 2007;67:6092–6099. doi: 10.1158/0008-5472.CAN-06-4607. [DOI] [PubMed] [Google Scholar]
- 20.Hayashita Y, Osada H, Tatematsu Y, Yamada H, Yanagisawa K, Tomida S, Yatabe Y, Kawahara K, Sekido Y, Takahashi T. A Polycistronic MicroRNA Cluster, miR-17-92, Is Overexpressed in Human Lung Cancers and Enhances Cell Proliferation. Cancer Research. 2005;65:9628–9632. doi: 10.1158/0008-5472.CAN-05-2352. [DOI] [PubMed] [Google Scholar]
- 21.Tazawa H, Tsuchiya N, Izumiya M, Nakagama H. Tumor-suppressive miR-34a induces senescence-like growth arrest through modulation of the E2F pathway in human colon cancer cells. Proceedings of the National Academy of Sciences. 2007;104:15472–15477. doi: 10.1073/pnas.0707351104. [DOI] [PMC free article] [PubMed] [Google Scholar]
- 22.Ji J, Shi J, Budhu A, Yu Z, Forgues M, Roessler S, Ambs S, Chen Y, Meltzer PS, Croce CM, Qin LX, Man K, Lo CM, Lee J, Ng IOL, Fan J, Tang ZY, Sun HC, Wang XW. MicroRNA Expression, Survival, and Response to Interferon in Liver Cancer. New England Journal of Medicine. 2009;361:1437–1447. doi: 10.1056/NEJMoa0901282. [DOI] [PMC free article] [PubMed] [Google Scholar]
- 23.Schetter AJ, Leung SY, Sohn JJ, Zanetti KA, Bowman ED, Yanaihara N, Yuen ST, Chan TL, Kwong DLW, Au GKH, Liu CG, Calin GA, Croce CM, Harris CC. MicroRNA Expression Profiles Associated With Prognosis and Therapeutic Outcome in Colon Adenocarcinoma. JAMA: The Journal of the American Medical Association. 2008;299:425–436. doi: 10.1001/jama.299.4.425. [DOI] [PMC free article] [PubMed] [Google Scholar]
- 24.Sarasin-Filipowicz M, Krol J, Markiewicz I, Heim MH, Filipowicz W. Decreased levels of microRNA miR-122 in individuals with hepatitis C responding poorly to interferon therapy. Nat Med. 2009;15:31–33. doi: 10.1038/nm.1902. [DOI] [PubMed] [Google Scholar]
- 25.Li Y, Li J, Belisle S, Baskin CR, Tumpey TM, Katze MG. Differential microRNA expression and virulence of avian, 1918 reassortant, and reconstructed 1918 influenza A viruses. Virology. 2011;421:105–113. doi: 10.1016/j.virol.2011.09.011. [DOI] [PMC free article] [PubMed] [Google Scholar]
- 26.Moussay E, Wang K, Cho JH, van Moer K, Pierson S, Paggetti J, Nazarov PV, Palissot V, Hood LE, Berchem G, Galas DJ. MicroRNA as biomarkers and regulators in B-cell chronic lymphocytic leukemia. Proceedings of the National Academy of Sciences. 2011;108:6573–6578. doi: 10.1073/pnas.1019557108. [DOI] [PMC free article] [PubMed] [Google Scholar]
- 27.Mitchell PS, Parkin RK, Kroh EM, Fritz BR, Wyman SK, Pogosova-Agadjanyan EL, Peterson A, Noteboom J, O’Briant KC, Allen A, Lin DW, Urban N, Drescher CW, Knudsen BS, Stirewalt DL, Gentleman R, Vessella RL, Nelson PS, Martin DB, Tewari M. Circulating microRNAs as stable blood-based markers for cancer detection. Proceedings of the National Academy of Sciences. 2008;105:10513–10518. doi: 10.1073/pnas.0804549105. [DOI] [PMC free article] [PubMed] [Google Scholar]
- 28.Arroyo JD, Chevillet JR, Kroh EM, Ruf IK, Pritchard CC, Gibson DF, Mitchell PS, Bennett CF, Pogosova-Agadjanyan EL, Stirewalt DL, Tait JF, Tewari M. Argonaute2 complexes carry a population of circulating microRNAs independent of vesicles in human plasma. Proceedings of the National Academy of Sciences. 2011;108:5003–5008. doi: 10.1073/pnas.1019055108. [DOI] [PMC free article] [PubMed] [Google Scholar]
- 29.Bihrer V, Waidmann O, Friedrich-Rust M, Forestier N, Susser S, Haupenthal J, Welker M, Shi Y, Peveling-Oberhag J, Polta A, von Wagner M, Radeke HH, Sarrazin C, Trojan J, Zeuzem S, Kronenberger B, Piiper A. Serum MicroRNA-21 as Marker for Necroinflammation in Hepatitis C Patients with and without Hepatocellular Carcinoma. PLoS ONE. 2011;6:e26971. doi: 10.1371/journal.pone.0026971. [DOI] [PMC free article] [PubMed] [Google Scholar]
- 30.Lindor KD, Kowdley KV, Luketic VAC, Harrison ME, McCashland T, Befeler AS, Harnois D, Jorgensen R, Petz J, Keach J, Mooney J, Sargeant C, Braaten J, Bernard T, King D, Miceli E, Schmoll J, Hoskin T, Thapa P, Enders F. High-dose ursodeoxycholic acid for the treatment of primary sclerosing cholangitis. Hepatology. 2009;50:808–814. doi: 10.1002/hep.23082. [DOI] [PMC free article] [PubMed] [Google Scholar]
- 31.Qi P, Cheng S-q, Wang H, Li N, Chen Y-f, Gao C-f. Serum MicroRNAs as Biomarkers for Hepatocellular Carcinoma in Chinese Patients with Chronic Hepatitis B Virus Infection. PLoS ONE. 2011;6:e28486. doi: 10.1371/journal.pone.0028486. [DOI] [PMC free article] [PubMed] [Google Scholar]
- 32.Song J, Bai Z, Han W, Zhang J, Meng H, Bi J, Ma X, Han S, Zhang Z. Identification of Suitable Reference Genes for qPCR Analysis of Serum microRNA in Gastric Cancer Patients. Digestive Diseases and Sciences. :1–8. doi: 10.1007/s10620-011-1981-7. [DOI] [PubMed] [Google Scholar]
- 33.Chen X, Ba Y, Ma L, Cai X, Yin Y, Wang K, Guo J, Zhang Y, Chen J, Guo X, Li Q, Li X, Wang W, Zhang Y, Wang J, Jiang X, Xiang Y, Xu C, Zheng P, Zhang J, Li R, Zhang H, Shang X, Gong T, Ning G, Wang J, Zen K, Zhang J, Zhang CY. Characterization of microRNAs in serum: a novel class of biomarkers for diagnosis of cancer and other diseases. Cell Res. 2008;18:997–1006. doi: 10.1038/cr.2008.282. [DOI] [PubMed] [Google Scholar]
- 34.Zhao H, Shen J, Medico L, Wang D, Ambrosone CB, Liu S. A Pilot Study of Circulating miRNAs as Potential Biomarkers of Early Stage Breast Cancer. PLoS ONE. 2010;5:e13735. doi: 10.1371/journal.pone.0013735. [DOI] [PMC free article] [PubMed] [Google Scholar]
- 35.RAYMOND CK, ROBERTS BS, GARRETT-ENGELE P, LIM LP, JOHNSON JM. Simple, quantitative primer-extension PCR assay for direct monitoring of microRNAs and short-interfering RNAs. RNA. 2005;11:1737–1744. doi: 10.1261/rna.2148705. [DOI] [PMC free article] [PubMed] [Google Scholar]
- 36.Bryant RJ, Pawlowski T, Catto JWF, Marsden G, Vessella RL, Rhees B, Kuslich C, Visakorpi T, Hamdy FC. Changes in circulating microRNA levels associated with prostate cancer. Br J Cancer. 2012 doi: 10.1038/bjc.2011.595. [DOI] [PMC free article] [PubMed] [Google Scholar]
- 37.Kosaka N, Iguchi H, Ochiya T. Circulating microRNA in body fluid: a new potential biomarker for cancer diagnosis and prognosis. Cancer Science. 2010;101:2087–2092. doi: 10.1111/j.1349-7006.2010.01650.x. [DOI] [PMC free article] [PubMed] [Google Scholar]
- 38.Yokota M, Tatsumi N, Nathalang O, Yamada T, Tsuda I. Effects of heparin on polymerase chain reaction for blood white cells. Journal of Clinical Laboratory Analysis. 1999;13:133–140. doi: 10.1002/(SICI)1098-2825(1999)13:3<133::AID-JCLA8>3.0.CO;2-0. [DOI] [PMC free article] [PubMed] [Google Scholar]
- 39.Pritchard CC, Kroh E, Wood B, Arroyo JD, Dougherty KJ, Miyaji MM, Tait JF, Tewari M. Blood cell origin of circulating microRNAs: a cautionary note for cancer biomarker studies. Cancer Prevention Research. 2011 doi: 10.1158/1940-6207.CAPR-11-0370. [DOI] [PMC free article] [PubMed] [Google Scholar]