Abstract
Purpose: Spectral/multienergy CT has the potential to distinguish different materials by K-edge characteristics. K-edge imaging involves the two energy bins on both sides of a K-edge. The authors propose a K-edge imaging optimization model to determine these two energy bins.
Methods: K-edge image contrast with spectral CT depends on the specifications of the two energy bins on both sides of a K-edge in the attenuation profile of a relatively high atomic number material. The wider the energy bin width is, the lower the noise level is, and the poorer the reconstructed image contrast is. Here the authors introduce the signal difference to noise ratio (SDNR) criterion to optimize the energy bin widths on both sides of the K-edge for the maximum SDNR.
Results: The authors study K-edge imaging with spectral CT, analyze the effect of K-edge energy bins on the resultant image quality, and establish guidelines for the optimization of energy thresholds. In simulation, the authors demonstrate that our K-edge imaging optimization approach maximizes SDNR in reconstructed images.
Conclusions: This proposed approach can be readily generalized to deal with more general settings and determine the best energy bins for K-edge imaging.
Keywords: spectral/multienergy CT, K-edge imaging, energy bins, image reconstruction, signal difference to noise ratio (SDNR)
INTRODUCTION
X-ray CT has a central role in clinical imaging, often as the first and only imaging examination for a wide variety of diseases and procedures. The universal acceptance of x-ray CT in clinical practice is a result of numerous technical innovations. Now, CT scanners in multi-slice/cone-beam geometry perform 100 × 106 scans annually worldwide and represent the largest share of the imaging equipment market. Despite the importance and widespread use of CT, there are well-recognized challenges associated with the technology.1, 2 A primary problem with CT is that conventional CT often does not have sufficiently high contrast resolution for biological soft tissues. It would be invaluable if conventional x-ray CT could have much-improved biological resolution and complement MRI, PET, and SPECT. Fortunately, contrast resolution or biological resolution, may be significantly improved by the development of spectral detectors and novel contrast agents.
Spectral CT is an emerging area of CT research and development.3, 4, 5, 6, 7 A common x-ray tube produces a broad spectrum of x-rays, and the conventional x-ray CT detector is a photon-integrating sensor whose output is proportional to the energy fluence over the entire x-ray spectrum. Given that x-ray attenuation is dependent both on the object material and photon energy, a conventional x-ray CT detector loses spectrally varying attenuation information due to the energy integration. In contrast, an energy-discriminative photon-counting detector has the capability to resolve the energy levels of incident photons,8, 9, 10, 11 which helps identify additional information. X-ray K-edge imaging is an important application of spectral/multienergy CT, which involves capturing attenuation signals on both sides of a K-edge. The detectability of a K-edge depends on the finite widths of the energy bins, and then images can be reconstructed from the corresponding projections in the two energy bins. Different materials can be easily distinguished according to their unique K-edges, while their Hounsfield numbers may be very similar in conventional CT images.12, 13, 14, 15 This opens a door for spectral CT to support functional, cellular, and molecular imaging studies. For K-edge imaging, threshold settings for energy bins on both sides of a K-edge have a major impact on spectral image quality in terms of image contrast and noise level.16, 17, 18, 19 Hence, it is important to partition the two energy bins optimally around a K-edge.
In this paper, we propose a K-edge imaging optimization model. Based on this model, we investigate how to select two energy bins for optimal K-edge imaging. Specifically, we formulate the K-edge imaging process and introduce a signal difference to noise ratio (SDNR) where the signal difference is defined between reconstructed target region values on both sides of the K-edge.3, 20 With the SDNR maximization criterion, we specify the best energy bins for K-edge imaging. Also, we perform numerical experiments to demonstrate the feasibility and utility of our proposed energy bin optimization approach. The remainder of this paper is organized as follows. In Sec. 2, we introduce our proposed K-edge imaging model and derive relevant formulas.21 In Sec. 3, we describe our experimental design and simulation results. In Sec. 4, we discuss several relevant issues and conclude the paper.
THEORETICAL MODEL
Tomographic imaging
Physically, the number of photons n produced by an x-ray source obeys a Poisson random distribution, and its probability density function is given by
| (1) |
where I0 is the mean of the Poisson random variable n. We assume that n photons from the x-ray source interact with an object, and the photon survival probability is
| (2) |
where p = e−g by the Beer-Lambert law, and is the integral of the linear attenuation coefficient distribution along an x-ray path. Thus, the probability function of m survived photons is expressed as
| (3) |
From Eq. 3, we have the expected value of the survived photons
| (4) |
and their variance
| (5) |
where I0 is a known flat field value. When an object is in the beam, the number of photons I recorded by the detector per unit time can be written as
| (6) |
where NI is random noise depending on I0e−g. From Eq. 6, we have
| (7) |
| (8) |
For image reconstruction, a sinogram Sθ can be calculated from the measured intensities I and I0 at each angle θ,
| (9) |
We further express the sinogram Sθ as
| (10) |
Then, we have the mean and variance of the sinogram Sθ as follows,
| (11) |
| (12) |
Hence, the noise in the sinogram Sθ is
| (13) |
From the sinogram Sθ, an image can be reconstructed using the filtered backprojection (FBP) formula,
| (14) |
where t = xcos θ + ysin θ. Based on the independence of different detector readings, the expected image f (r) is computed as
| (15) |
and the variance of reconstructed image f (r) is
| (16) |
That is, the reconstructed image f (r) can be decomposed into the expected value E(f (r)) and the noise components Nf
| (17) |
Then, we have
| (18) |
| (19) |
K-edge imaging
In this section, we optimize the energy bin widths by the SDNR criterion. Without loss of generality, K-edge image contrast with spectral CT depends on the two energy bins on both sides of a K-edge in the attenuation profile of a relatively high atomic number material. The wider the energy bin width is, the lower the noise level is, but the poorer the reconstructed image contrast is. How to determine these two energy bins is important for K-edge imaging performance. Let the energy distribution function of an x-ray source be C(E) and we have the photon number at both sides of the K-edge
| (20) |
| (21) |
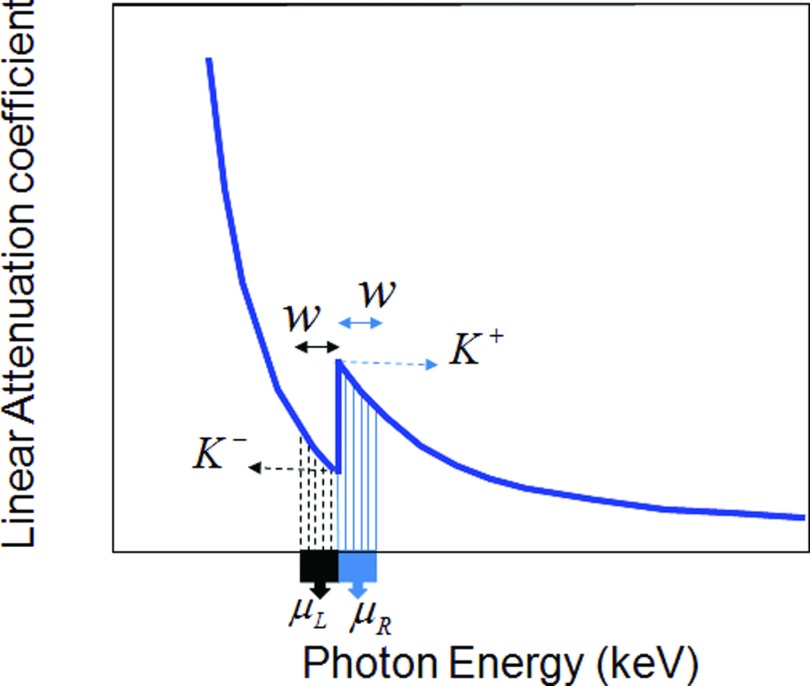
An attenuation profile of a relatively high atomic number material is shown in Fig. 1. In Fig. 1, K− is the attenuation coefficient before the sudden increment in linear attenuation and K+ is the attenuation coefficient after the increment. If we perform K-edge imaging at the left and right points K− and K+, there are few photons to carry the information. Hence, we must use two energy bins of finite width away from the points K− and K+ respectively. Let a(r, E) be the attenuation coefficient function for a position r and energy E, and μR(r) be the average attenuation coefficient within the energy bin after the K-edge jump, and μL(r) the average attenuation coefficient within the energy bin before the jump. We have
| (22) |
| (23) |
Then, the SDNR criterion for this K-edge is defined as
| (24) |
where fL(r) and fR(r) are the reconstructed images before and after the K-edge jump. From Eqs. 15, 16, 22, 23, we can reconstruct images f (r) and compute variances of the image noise Nf as a function of the energy bin width w. In other words, the SDNR will depend on the energy bin width w, and can be maximized in this context. Explicitly, Eq. 24 can be rewritten as follows:
| (25) |
where gR(w, t) and gL(w, t) are the sinograms defined by
| (26) |
| (27) |
where μRother(w, t) and μLother(w, t) are the background projection data on both sides of the contrast agent K-edge respectively, excluding the contribution due to the contrast agent.
Figure 1.
Attenuation profile of a relatively high atomic number material.
Equation 25 represents an optimization problem, suggesting the optimal w to maximize the SDNR for the K-edge. Before optimizing the SDNR, we need to determine a reasonable interval for the energy bin width w. In theory, the average attenuation coefficient μR over the energy bin after the K-edge should be greater than the average attenuation coefficient μL over the energy bin before the K-edge:
| (28) |
Then, we can use Eq. 28 as a constraint to calculate the maximum energy bin width and search for the optimal w value from this domain of w to maximize the SDNR for the K-edge.
NUMERICAL SIMULATION
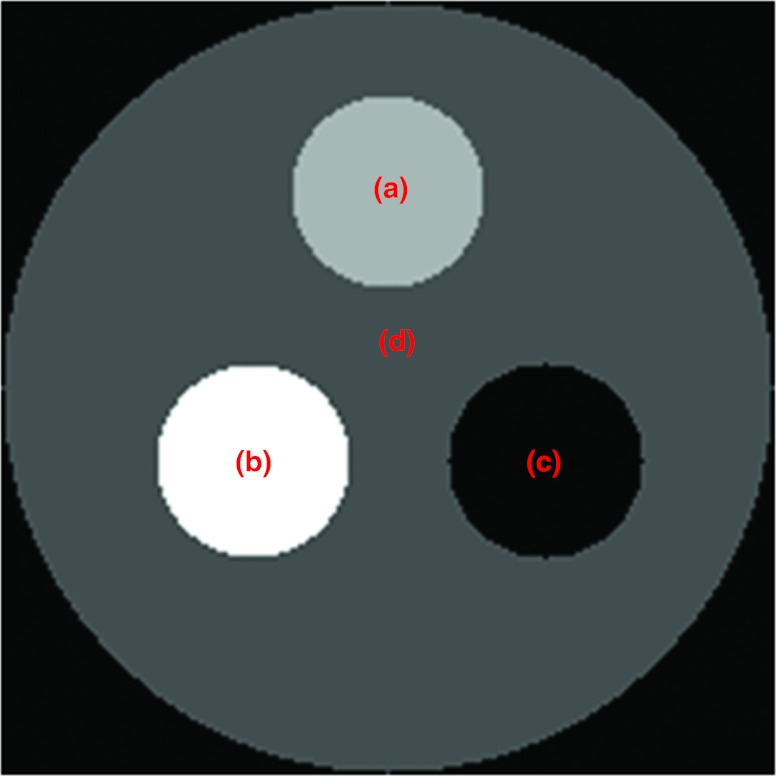
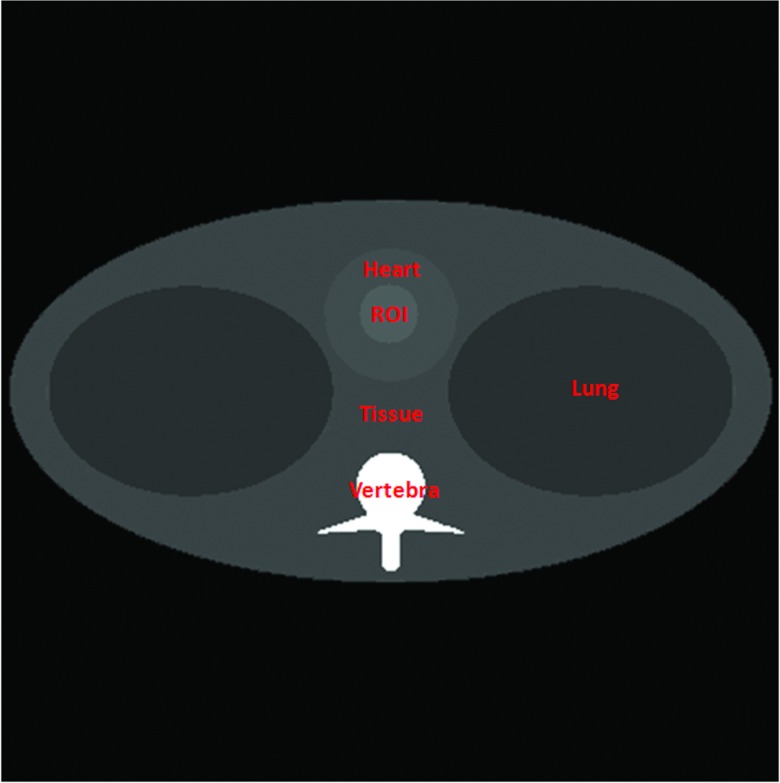
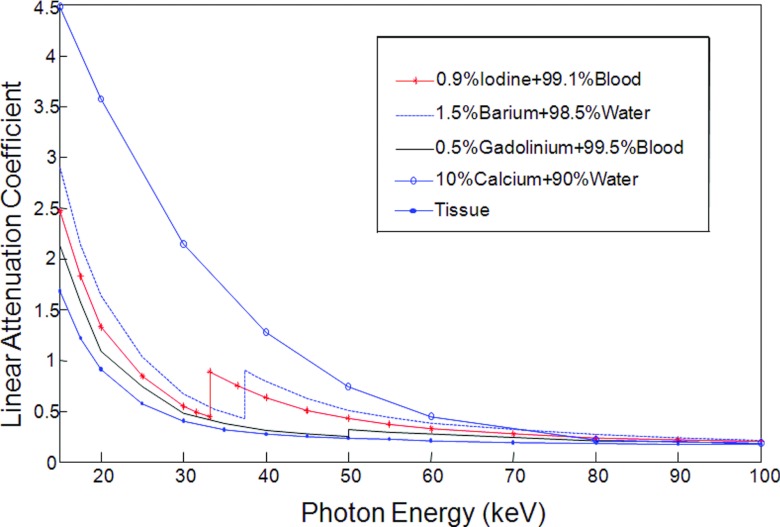
We applied the proposed K-edge imaging theory in numerical simulation. In our simulation, we analyzed two phantoms: a multimaterial phantom (Fig. 2) and a thorax phantom (Fig. 6). As shown in Fig. 2, the multimaterial phantom is a circular phantom of 2 cm diameter and contains three disks of 0.5 cm diameter, which was discretized into a 200 × 200 matrix (the pixel size: 0.01 cm × 0.01 cm). The phantom has a contrast agent test region and a background with calcium solution, soft tissue, and air. We used iodine solution, barium solution, and gadolinium solution as testing contrast agents respectively to analyze K-edge imaging performance. The goal of the multimaterial phantom design is to mimic a small animal (i.e., a mouse). The concentrations of these contrast agents were selected in reference to the biomedical imaging literature.13, 14, 22, 23, 24, 25, 26, 27, 28, 29 Biologically relevant contrast concentrations in the literature are summarized in Table 1. Our numerical simulation was accordingly designed. Specifically, we had barium mixed with water, iodine, and gadolinium separately mixed with blood. The concentrations of these contrast agents are shown in Table 2. In Fig. 3, we plotted the linear attenuation coefficient curves of phantom materials according to the x-ray attenuation data reported by the National Institute of Standards and Technology (NIST).30 According to the linear attenuation coefficient curves in Fig. 3, we synthesized phantom sinograms in different energy bins.
Figure 2.
Multimaterial phantom. (a) The testing contrast agent ROI, (b) the calcium solution, (c) the air, and (d) the soft tissue.
Figure 6.
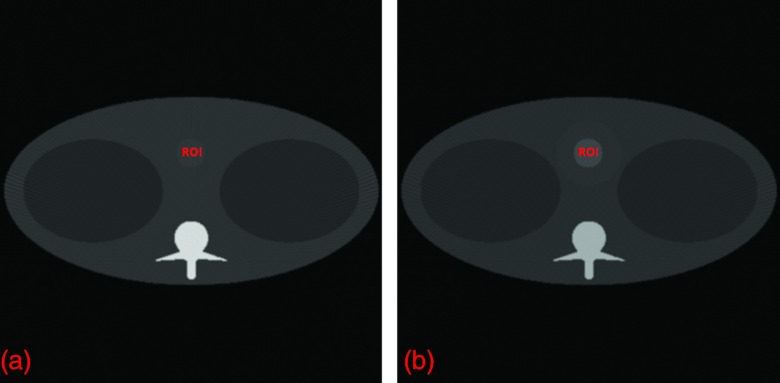
Thorax phantom.
Table 1.
Biologically relevant concentrations of contrast agents in the literature.
| Contrast agents | Concentrations in literature | |||
|---|---|---|---|---|
| Barium sulfate | 0.83% barium + 99.17% water (Ref. 23) | 1.5% barium + 98.5% water (Ref. 24) | 1.0% barium + 99.0% water (Ref. 25) | 0.1455 g/ml ± 0.0021 and 0.1957 g/ml ± 0.0024 (Ref. 26) |
| Iodine | 15, 30, and 150 mg/ml (Ref. 27) | 37.5, 75, and 150 μmol/ml (Ref. 14) | 1.1% iodine + 98.9% water (Ref. 23) | 1.7, 5, and 15 mg/cc (Ref. 28) |
| Gadolinium | 78.5 mg/ml (Ref. 29) | 1.00, 5.05, 20.76, and 31.76 mg/ml (6.37, 32.1, 132.0, and 202.0 μmol/ml) (Ref. 13) | 37.5, 75, and 150 μmol/ml (Ref. 14) | 1.1, 3.3, and 10 mg/cc (Ref. 28) |
Table 2.
The concentrations of iodine, barium, and gadolinium solutions.
| Contrast agents | Concentration (mg/ml) | Relative density |
|---|---|---|
| Barium | 15 | 1.5% |
| Iodine | 10 | 0.9% |
| Gadolinium | 5 | 0.5% |
Figure 3.
Linear attenuation coefficient curves of the selected phantom materials.
To determine the w value for the maximization of the SDNR in the reconstructed images on both sides of a K-edge, we need to determine a feasible interval [wmin, wmax] for w. Theoretically, the attenuation coefficient on the left of the K-edge decreases faster than that on the right of the K-edge. Therefore, we can calculate the maximum wmax (when μR = μL) according to Eq. 28 and Fig. 1 by setting
| (29) |
and use the Newton method to find the solution numerically.
By the Taylor expansion, the mth order Taylor polynomial of y(w) is expressed as
| (30) |
By taking a linear approximation for y(w), we obtain a Newton iterative scheme
| (31) |
| (32) |
Equation 29 is an unconstrained optimization problem, and its optimal solution is assigned as the maximum of the feasible interval of w, which is (0,wmax ).
According to Eq. 32, we can calculate the domain of w for iodine solution (0.9%), barium solution (1.5%), and gadolinium solution (0.5%) respectively, and summarized the parameter values in Table 3.
Table 3.
Summary of the optimal and maximum domain widths, and maximum SDNR for different contrast agents.
| Domain width | Optimal | Maximum | |
|---|---|---|---|
| Contrast agent | w (keV) | w (keV) | SDNR |
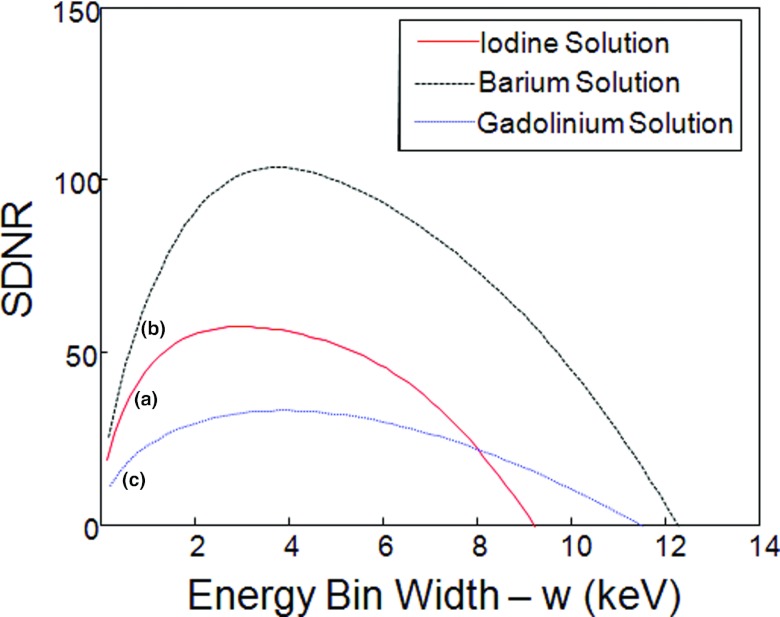
| Iodine solution (0.9%) | (0, 9.2) | 3.2 | 57.3 |
| Barium solution (1.5%) | (0, 12.2) | 3.7 | 103.6 |
| Gadolinium solution (0.5%) | (0, 11.5) | 3.8 | 33.0 |
Then, in reference to Table 3 we further determined the optimal w value that maximizes the SDNR in the domain of w. For that purpose, we considered Eq. 25 as a constrained optimization problem, which maximizes the SDNR in the domain of w. This constrained optimization problem was solved in the following steps:
Given a w value, calculate the average attenuation coefficient value of contrast agents using Eqs. 22, 23.
Capture the projection data in parallel beam geometry and generate the full-scan sinogram g(x) of 360 equiangular views.
Add Gaussian noise to the sinogram g(x) according to Eqs. 11, 12.
Use the FBP to reconstruct images on both sides of the K-edge, and calculate the mean and variances in the testing region and the SDNR according to Eq. 25.
Repeat the above four steps for different w values under the constrained condition (the domain of w), and determine the optimal w value for the maximum SDNR.
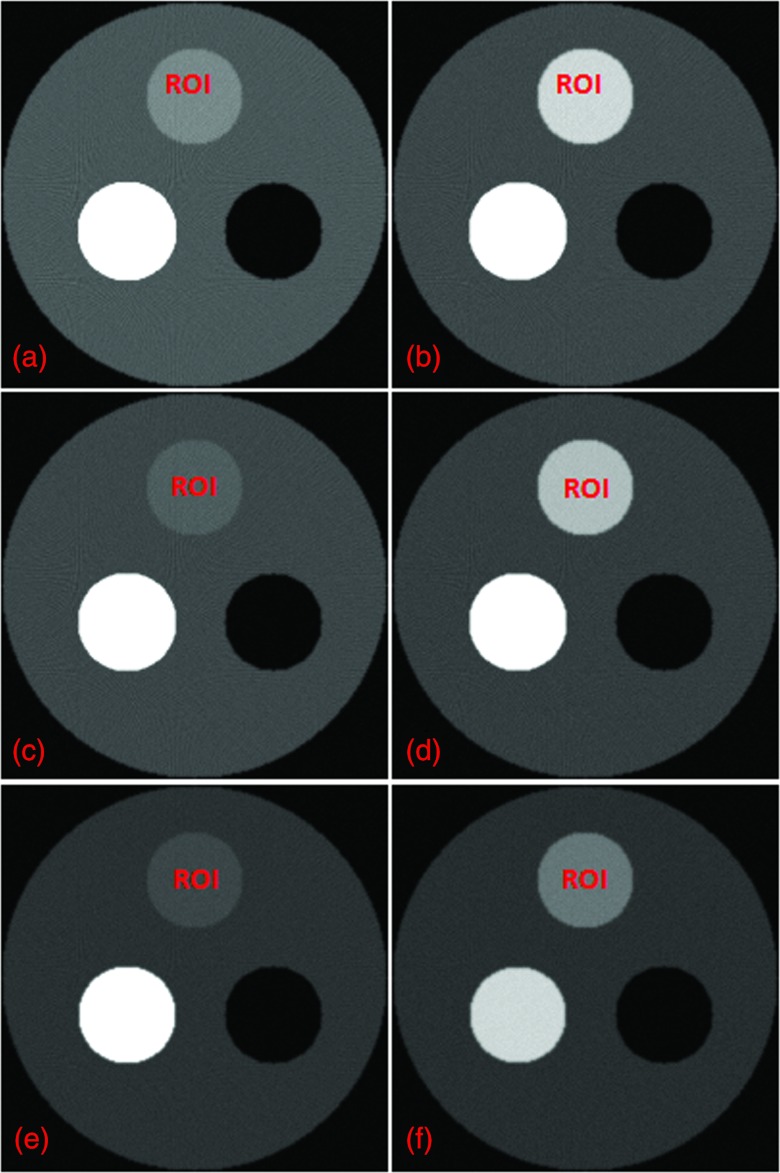
In Fig. 4, we plotted the relationships between w and SDNR. In our analysis, it was assumed that the photon count in a unit energy bin was 10 000 [C(E) = 10 000 in Eqs. 20, 21]. Also, we used the optimal w values to perform K-edge imaging for each tested contrast agent and reconstructed images in Fig. 5.
Figure 4.
Relationship between the energy bin width (w) and SDNR. (a) The curve for iodine solution (0.9%), (b) barium solution (1.5%), and (c) gadolinium solution (0.5%).
Figure 5.
K-edge imaging results with the maximum SDNR values for the target regions. (a) and (b) The reconstructed images on both sides of the iodine solution (0.9%) K-edge, (c) and (d) the reconstructed images on both sides of the barium solution (1.5%) K-edge, and (e) and (f) the reconstruction images on both sides of the gadolinium solution (0.5%) K-edge. The left column images are reconstructed on the left side of the contrast agent K-edge, and the right column images are on the right side of the K-edge. The display window for all the images is [0, 1].
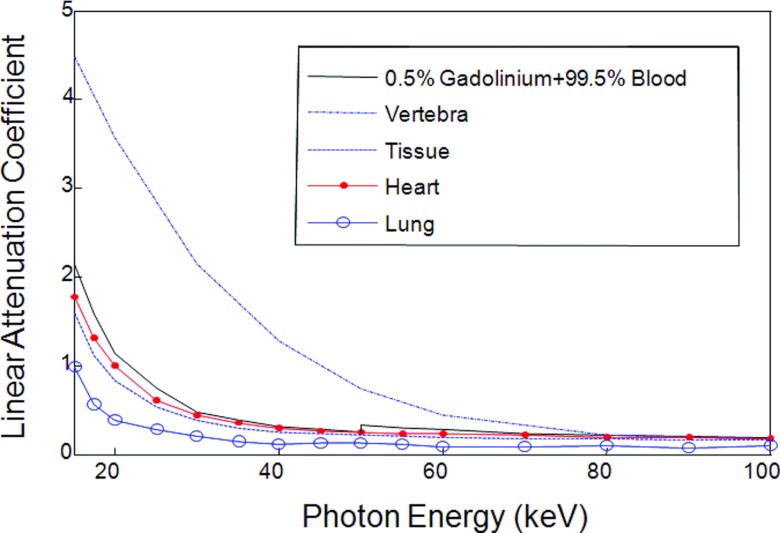
As shown in Fig. 6, the thorax phantom was designed to be more preclinically relevant, in reference to the Forbild thorax phantom defined on http://www.imp.uni-erlangen.de/forbild. The thorax phantom of 20 cm × 20 cm was discretized into a 400 × 400 matrix (the pixel size: 0.05 cm × 0.05 cm). The phantom contains a heart region, a tissue region, a lung region, a vertebra region, and a contrast enhancement region. As an example, we used gadolinium solution (0.5%) as a testing contrast agent to analyze the K-edge imaging performance in an (ROI) inside the heart region. In Fig. 7, we plotted the linear attenuation coefficient curves of the thorax phantom materials according to the same x-ray attenuation database hosted by NIST.
Figure 7.
Linear attenuation coefficient curves of the thorax phantom materials.
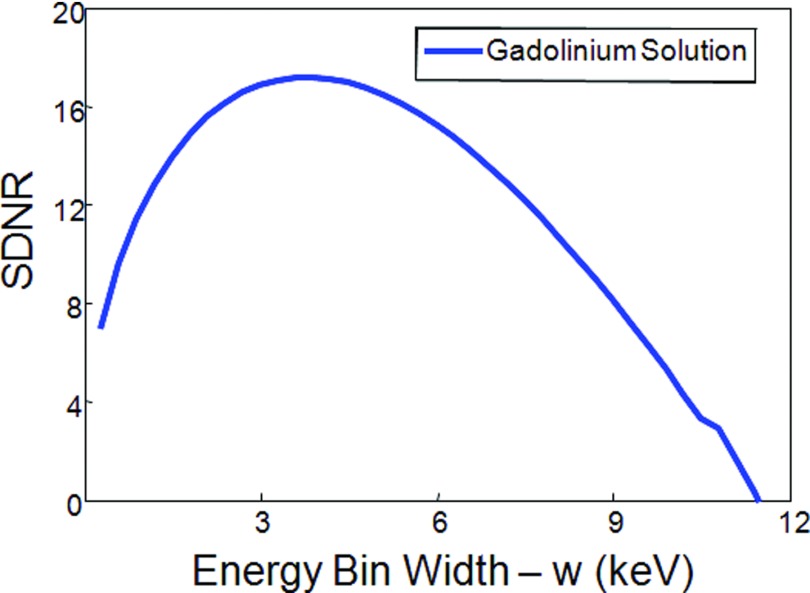
Then, we used our proposed approach to analyze the thorax phantom and determine the best energy bins for K-edge imaging, and plotted the relationship between w and SDNR, as shown in Fig. 8. Also, we calculated the optimal and maximum domain widths, and maximum SDNR for gadolinium solution in the thorax phantom. The results are shown in Table 4. In our analysis, it was assumed that the photon count in a unit energy bin was 100 000 [C(E) = 100 000 in Eqs. 20, 21]. Finally, we used the optimal w value to perform K-edge imaging for the contrast agent (gadolinium solution) in the thorax phantom and reconstructed images in Fig. 9.
Figure 8.
Relationship between the energy bin width (w) SDNR for gadolinium solution (0.5%) in the thorax phantom.
Table 4.
Summary of the optimal and maximum domain widths, and maximum SDNR for gadolinium solution in the thorax phantom.
| Domain width | Optimal | Maximum | |
|---|---|---|---|
| Contrast agent | w(keV) | w(keV) | SDNR |
| Gadolinium solution (0.5%) | (0, 11.4) | 3.9 | 17.1 |
Figure 9.
K-edge imaging results. (a) and (b) the reconstructed images on both sides of the gadolinium solution (0.5%) K-edge with the maximum SDNR for the target region. The display window for the two images is [0, 1].
DISCUSSIONS AND CONCLUSION
In our simulation, there are three key factors worth further discussion. First, the material attenuation coefficient function a(r, E) was calculated using the x-ray attenuation database at NIST.30 Although the x-ray attenuation datasets are accurate, the sampling points are sparse and insufficient to calculate the exact attenuation coefficient function continuously. Hence, we interpolated the x-ray attenuation coefficients with respect to the photon energy. As a result, it is inevitable having generated some errors, compromising the estimation of the optimal energy bin width. Second, the noise in a reconstructed image is random and depends on specific phantom configurations. Thus, the optimal energy bin width is application-specific. Nevertheless, our optimization approach is rigorous and can be applied once the application context or the class of images is known. Additionally, in this initial study we did not take scattering into account, which generates errors when the optimal energy bin width is estimated. In a followup study, the scattering component could be analytically compensated for, to the first-order approximation.
Our proposed optimization approach was applied assuming the same energy bin width w on both sides of a K-edge and the same number of incoming photons in the two energy bins. In principle, our approach can be applied to discuss more general cases such as different energy bin widths and nonuniform incoming x-ray fluxes over a spectral range. More general settings may give multiple solutions and can be addressed with additional constraints. For example, the best solution can be singled out of the multiple solutions according to the lowest image noise criterion. A systematic study along this line is beyond the scope of this initial investigation and will be performed in the future.
Currently, there are limitations for clinical applications of spectral CT, such as the low count rate of the photon-counting energy-discriminative detector, spatial inhomogeneity of the spectral detection performance, and premature contrast agent studies that have already yielded exciting results but not yet been approved by the Food and Drug Administration (FDA). However, spectral CT has been widely reported and well tested in preclinical studies. Therefore, K-edge imaging by spectral CT has a great potential for clinical applications including, but not limited, to tissue characterization and contrast studies.This initial methodological study is mainly focused on spectral micro-CT of small animals. Our approach can be readily generalized to deal with more general settings for clinical applications, which will be done in a followup study.
In conclusion, we have proposed an optimization approach for K-edge imaging with spectral CT and applied it to optimize the energy bin width analytically and numerically. This approach can be readily generalized for biomedical imaging. Based on our work, it is now feasible to determine the best energy bins for any K-edge in a given application.
References
- Hsieh J., Computed Tomography, Principles, Design, Artifacts, and Recent Advances (SPIE, Bellingham, WA, 2002). [Google Scholar]
- Wang G., Yu H. Y., and DeMan B., “An outlook on x-ray CT research and development,” Med. Phys. 35, 1051–1064 (2008). 10.1118/1.2836950 [DOI] [PubMed] [Google Scholar]
- Alvarez R. E. and Macovski A., “Energy-selective reconstructions in x-ray computerized tomography,” Phys. Med. Biol. 21, 733–744 (1976). 10.1088/0031-9155/21/5/002 [DOI] [PubMed] [Google Scholar]
- Giersch J., Firsching M., Niederlohner D., and Anton G., “Material reconstruction with spectroscopic pixel x-ray detectors,” Nucl. Instrum. Methods Phys. Res. A 546, 125–130 (2005). 10.1016/j.nima.2005.03.104 [DOI] [Google Scholar]
- Firsching M., Talla P. T., Michel T., and Anton G., “Material resolving x-ray imaging using spectrum reconstruction with Medipix2,” Nucl. Instrum. Methods Phys. Res. A 591, 19–23 (2008). 10.1016/j.nima.2008.03.017 [DOI] [Google Scholar]
- Firsching M., Butler A. P., Scott N., Anderson N. G., Michel T., and Anton G., “Contrast agent recognition in small animal CT using the Medipix2 detector,” Nucl. Instrum. Methods Phys.Res. A 607, 179–192 (2009). 10.1016/j.nima.2009.03.141 [DOI] [Google Scholar]
- He P., Yu H. Y., Thayer P., Jin X., Xu Q., Bennett J., Tappenden R., Wei B., Goldstein A., Renaud P., Butler A., Butler P., and Wang G., “Preliminary experimental results from a MARS micro-CT system,” J. X-Ray Sci. Technol. 20, 199–211 (2012). 10.3233/XST-2012-0329 [DOI] [PMC free article] [PubMed] [Google Scholar]
- Llopart X., Campbell M., Segundo D. S., Pernigotti E., and Dinapoli R., “Medipix2: a 64-k pixel readout chip with 55-μm square elements working in single photon counting mode,” IEEE Trans. Nucl. Sci. 49, 2279–2283 (2002). 10.1109/TNS.2002.803788 [DOI] [Google Scholar]
- Manuilskiy A., Norlin B., Nilsson H. E., and Frojdh C., “Spectroscopy applications for the Medipix photon counting x-ray system,” Nucl. Instrum. Methods Phys. Res. A 531, 251–257 (2004). 10.1016/j.nima.2004.06.013 [DOI] [Google Scholar]
- Baumer C., Martens G., Menser B., Roessl E., Schlomka J. P., Steadman R., and Zeitler G., “Testing an energy-dispersive counting-mode detector with hard x-rays from a synchrotron source,” IEEE Trans. Nucl. Sci. 55, 1785–1790 (2008). 10.1109/TNS.2008.924083 [DOI] [Google Scholar]
- Wang X., Meier D., Mikkelsen S., Maehlum G. E., Wagenaar D. J., Tsui B. M. W., Patt B. E., and Frey E. C., “Micro-CT with energy-resolved photon-counting detectors,” Phys. Med. Biol. 56, 2791–2816 (2011). 10.1088/0031-9155/56/9/011 [DOI] [PMC free article] [PubMed] [Google Scholar]
- Riederer S. J. and Mistretta C. A., “Selective iodine imaging using K-edge energies in computerized x-ray tomography,” Phys. Med. Biol. 4, 474–481 (1977). 10.1118/1.594357 [DOI] [PubMed] [Google Scholar]
- Roessl E. and Proksa R., “K-edge imaging in x-ray computed tomography using multi-bin photon counting detectors,” Phys. Med. Biol. 52, 4679–4696 (2007). 10.1088/0031-9155/52/15/020 [DOI] [PubMed] [Google Scholar]
- Schlomka J. P., Roessl E., Dorscheid R., Dill S., Martens G., Istel T., Baumer C., Herrmann C., Steadman R., Zeitler G., Livne A., and Proksa R., “Experimental feasibility of multi-energy photon-counting K-edge imaging in pre-clinical computed tomography,” Phys. Med. Biol. 53, 4031–4047 (2008). 10.1088/0031-9155/53/15/002 [DOI] [PubMed] [Google Scholar]
- Schultke E., Fiedler S., Nemoz C., Ogieglo L., Kelly M. E., Crawford P., Esteve F., Brochard T., Renier M., Requardt H., Duc G. L., Juurlink B., and Meguro K., “Synchrotron-based intra-venous K-edge digital subtraction angiography in a pig model: A feasibility study,” Eur. J. Radiol. 73, 677–681 (2010). 10.1016/j.ejrad.2009.01.019 [DOI] [PubMed] [Google Scholar]
- Kijewski M. F. and Judy P. F., “The noise power spectrum of CT images,” Phys. Med. Biol. 32, 565–575 (1987). 10.1088/0031-9155/32/5/003 [DOI] [PubMed] [Google Scholar]
- Cunningham I. A., Westmore M. S., and Fenster A., “A spatial-frequency dependent quantum accounting diagram and detective quantum efficiency model of signal and noise propagation in cascaded imaging systems,” Med. Phys. 21, 417–427 (1994). 10.1118/1.597401 [DOI] [PubMed] [Google Scholar]
- Tapiovaara M. J. and Wagner R. F., “SNR and DQE analysis of broadspectrum x-ray imaging,” Phys. Med. Biol. 30, 519–529 (1985). 10.1088/0031-9155/30/6/002 [DOI] [Google Scholar]
- Wang G. and Vannier M. W., “Helical CT image noise – Analytical results,” Med. Phys. 20, 1635–1640 (1993). 10.1118/1.596950 [DOI] [PubMed] [Google Scholar]
- Firsching M., Niederlohner D., Michel T., and Anton G., “Quantitative material reconstruction in CT with spectroscopic x-ray pixel detectors—A simulation study,” IEEE Nucl. Sci. Symp. Conf. Rec. 4, 2257–2259 (2006). 10.1109/NSSMIC.2006.354363 [DOI] [Google Scholar]
- Kak A. C. and Slaney M., Principles of Computerized Tomographic Imaging (IEEE, New York, 1988). [Google Scholar]
- Anderson N. G. et al. , “Spectroscopic (multi-energy) CT distinguishes iodine and barium contrast material in mice,” Eur. Radiol. 20, 2126–2134 (2010). 10.1007/s00330-010-1768-9 [DOI] [PubMed] [Google Scholar]
- Dizendorf E., Hany T. F., Buck A., von Schulthess G. K., and Burger C., “Cause and magnitude of the error induced by oral CT contrast agent in CT-based attenuation correction of PET emission studies,” J. Nucl. Med. 44, 732–738 (2003). [PubMed] [Google Scholar]
- Xu Q. et al. , “Image reconstruction for hybrid true-color micro-CT,” IEEE Trans. Biomed. Eng. 59, 1711–1719 (2012). 10.1109/TBME.2012.2192119 [DOI] [PMC free article] [PubMed] [Google Scholar]
- Gao H., Yu H. Y., Osher S., and Wang G., “Multi-energy CT based on a prior rank, intensity and sparsity model (PRISM),” Inverse Probl. 27, 1–22 (2011). 10.1088/0266-5611/27/11/115012 [DOI] [PMC free article] [PubMed] [Google Scholar]
- Depypere M. et al. , “An iterative dual energy CT reconstruction method for a K-edge contrast material,” Proc. SPIE 7961, 79610M-79610M-7 (2011). 10.1117/12.878162 [DOI] [Google Scholar]
- Sato E. et al. , “Demonstration of enhanced iodine K-edge imaging using an energy-dispersive x-ray computed tomography system with a 25 mm/s-scan linear cadmium telluride detector and a single comparator,” Appl. Radiat. Isot. 70, 831–836 (2012). 10.1016/j.apradiso.2012.02.007 [DOI] [PubMed] [Google Scholar]
- Schlomka J. P. and Fritz S. G., “Photon counting spectral CT versus conventional CT: Comparative evaluation for breast imaging application,” Phys. Med. Biol. 56, 1905–1930 (2011). 10.1088/0031-9155/56/7/001 [DOI] [PubMed] [Google Scholar]
- Gierada D. S. and Bae K. T., “Gadolinium as a CT contrast agent: Assessment in a porcine model,” Radiology 210, 829–834 (1999). [DOI] [PubMed] [Google Scholar]
- see http://www.nist.gov/pml/data/xraycoef/index.cfm.


