Abstract
Bovine liver catalase (BLC), catalase-related allene oxide synthase (cAOS) from Plexaura homomalla, and a recently isolated protein from the cattle pathogen Mycobacterium avium ssp. paratuberculosis (MAP-2744c (MAP)) are all tyrosinate-ligated heme enzymes whose crystal structures have been reported. cAOS and MAP have low (< 20%) sequence similarity to, and significantly different catalytic functions from, BLC. cAOS transforms 8R-hydroperoxy-eicosatetraenoic acid to an allene epoxide, whereas the MAP protein is an organic peroxide-dependent peroxidase. To shed light on the functional differences among these three proteins, we have investigated the heme iron coordination properties of these tyrosinate-ligated heme proteins in their ferric and ferrous states using magnetic circular dichroism and UV-visible absorption spectroscopy. The MAP protein shows remarkable spectral similarities to cAOS and BLC in its native Fe(III) state, but clear differences from ferric His93Tyr Mb, which may be attributed to the presence of an Arg+-Nω-H … O-Tyr (proximal heme axial ligand) hydrogen bond in the first three heme proteins. Furthermore, the spectra of Fe(III)-CN−, Fe(III)-NO, Fe(II)-NO (except for five-coordinate MAP), Fe(II)-CO, and Fe(II)-O2 states of cAOS and MAP, but not H93Y Mb, are also similar to the corresponding six-coordinate complexes of BLC, suggesting that a tyrosinate (Tyr-O−) is the heme axial ligand trans to the bound ligands in these complexes. The Arg+-Nω-H to −O-Tyr hydrogen bond would be expected to modulate the donor properties of the proximal tyrosinate oxyanion and, combined with the subtle differences in the catalytic site structures, affect the activities of cAOS, MAP and BLC.
Keywords: Coral allene oxide synthase, Mycobacterium avium ssp. Paratuberculosis heme protein, Bovine liver catalase, Magnetic circular dichroism, Tyrosinate-ligated heme proteins, Heme axial ligand, Peroxide-dependent hydroperoxidases
1. Introduction
Bovine liver catalase (BLC) and other heme-containing catalases have long been known to have tyrosinate as their proximal ligand [1]. More recently, catalase-related allene oxide synthase (cAOS), identified as part of a fusion protein from the Caribbean coral Plexaura homomalla [2], has also been found to be tyrosinate-ligated. Plexaura homomalla is renowned for its high content of prostaglandin esters, which contribute 2-3% of the coral dry weight [3]. Brash and co-workers have further characterized two domains of this fusion protein, a lipoxygenase domain that transforms arachidonic acid to its 8R-hydroperoxide, and the AOS component that forms the 8,9-epoxy allene oxide, a key intermediate in cyclopentenone biosynthesis [4, 5].
Heme-containing catalases convert two molecules of H2O2 to one molecule of O2 and two molecules of H2O [1, 6]. The catalase catalytic cycle involves two consecutive reactions with H2O2. First, native resting state ferric catalase reacts with H2O2 to form compound I, a ferryl [Fe(IV)=O] moiety coupled to a porphyrin π-cation radical, while releasing a molecule of H2O. A second H2O2 molecule is used as a reductant of compound I, producing dioxygen and regenerating the ferric resting state of enzyme via a one-step two-electron reduction.
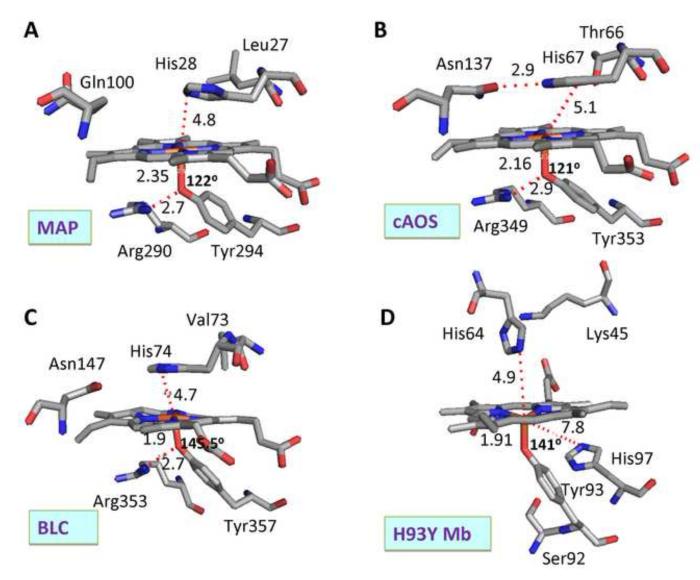
AOS in plants was discovered before cAOS and was originally identified as a member of the cytochrome P450 (cysteinate-ligated) heme protein family based on spectral properties [7]. Both enzymes convert fatty acid hydroperoxides to an allene oxide product as a key step in the biosynthesis of specific cyclopentane ring-containing fatty acids. Recently, a new tyrosinate-ligated heme protein (MAP-2744c (MAP), 33 kDa subunit) has been cloned, expressed, and crystallized from the cattle pathogen Mycobacterium avium ssp. paratuberculosis [8]. Like cAOS, MAP exhibits negligible catalase activity. It displays weak peroxidatic activity using H2O2 (20 s−1), but has strong peroxidase activity (~300 s−1) using organic hydroperoxides as co-substrates [8]. The X-ray crystal structures of the heme and its environments of BLC [9], cAOS [4] and MAP [8] (and H93Y Mb [10]) are shown in Fig. 1.
Fig. 1.
Active site structures of native ferric (A) MAP, (B) cAOS, (C) BLC and (D) ferric H93Y Mb mutant. In this comparison, the structures of the heme, the proximal tyrosinate ligand and several amino acid groups that are located near the heme at both the proximal and distal sides are illustrated and selected inter-atomic distances and Fe–O–C-Tyr bond angles are shown. These structures were drawn using PDB numbers 3E4W (MAP) [8], 1U5U (cAOS) [4], 8CAT (BLC) [9] and 1HRM (H93Y Mb) [10].
Even though cAOS and BLC show some sequence homology (~11% amino acid identity), the two enzymes do not share their respective enzymatic functions. cAOS shows no catalase reaction with H2O2 even under forcing conditions [4, 11], a property attributed in part to an active site Val-to Thr substitution next to the distal heme histidine (vide infra) [11]. Similarly, catalases do not show any AOS activity [4]. cAOS has four tyrosines, Y193, Y209, and Y269 and the axial ligand Y353, that are equivalent to Y214, Y230, Y324 and Y357 in BLC, respectively [12, 9]. However, there is no sequence similarity to BLC Y369 and its immediate neighbors in cAOS [4]. Wu and co-workers have studied the role of radical formation at Tyr193 in cAOS and its mutants using EPR spectroscopy [12]. Their study indicated that cAOS can cleave non-substrate hydroperoxides by a heterolytic cleavage path, although the normal allene oxide-producing reaction involves initial homolytic cleavage of the 8R-hydroperoxy-eicosatetraenoic acid substrate [4].
Thus the fundamental mechanistic difference between catalases and AOS is that catalases heterolytically cleave the peroxide bond of H2O2 to generate the compound I whereas AOS homolytically cleaves the peroxide bond to yield an alkoxyl radical [4]). Comparison of the crystal structures of cAOS and BLC suggest that the imidazole ring of the distal His in cAOS is rotated by 180° relative to that of catalase due to the H-bond between Thr-66 and His-67 (Fig. 1B, the hydrogen bond is hidden from view). This likely contributes to the functional differences between cAOS and catalases. Tosha et al. have examined this possibility by mutating Thr to Val and found that T66V cAOS has acquired modest catalase activity [11]. On the other hand, the mutation suppressed the native AOS enzymatic activity to 14% of that of wild-type enzyme. They proposed that the H-bond between Thr-66 and His-67 modulates the orientation of distal His, thereby regulating the enzymatic activity in cAOS.
In the present study, we compare the spectral properties of these three tyrosinate-ligated heme enzymes to each other and with those of His93Tyr axial mutant myoglobin in an effort to understand the factors that contribute to their different catalytic activities. Abraham et al. reported initial spectroscopic [magnetic circular dichroism (MCD) and EPR] studies of ferric cAOS [13]. Herein, we have extended their MCD studies of cAOS to ferric-NO, dithionite-reduced (ferrous), ferrous-NO, ferrous-CO and oxyferrous complexes. Comparison of deoxyferrous and oxyferrous complexes of cAOS and MAP with bovine liver catalase gives very interesting findings relevant to the axial heme ligation. The resulting information is useful in understanding the unresolved mechanistic problems and intermediates in the AOS catalytic cycle.
2. Materials and methods
2.1. Materials
Nitric oxide gas was obtained from Matheson Co. All other chemicals were purchased from Sigma Aldrich and used as received.
2.2. Native ferric proteins preparation
cAOS and MAP proteins were expressed in BL21 cells and purified as described previously [2, 4]. All cAOS and MAP samples were studied in 50 mM Tris buffer at pH 7.5 containing 150 mM NaCl unless otherwise specified. H93Y human myoglobin (Mb), prepared as reported [14], was a gift from Dr. Masao Ikeda-Saito (Tohoku University, Japan).
2.3. Ferric-cyanide (CN−) MAP and H93Y Mb
The ferric-CN− complex of MAP and H93Y Mb were prepared by addition of KCN from a 1M KCN stock solution (pH adjusted to ~7) into the ferric protein until saturation was reached.
2.4. Ferric-NO cAOS and MAP
Ferric-NO samples were prepared by bubbling NO gas into ferric protein samples that had been degassed under N2 gas for ~3 h on ice.
2.5. Deoxyferrous and ferrous-CO cAOS and MAP
The deoxyferrous states of cAOS and MAP were generated by addition of a few grains of solid sodium dithionite into ferric protein samples which had been degassed under N2 for ~3 h on ice in a sealed cuvette. Ferrous-CO samples of cAOS and MAP were prepared by bubbling CO gas into deoxyferrous protein samples.
2.6. Ferrous-NO cAOS and MAP
Ferrous-NO AOS and MAP complexes were prepared by addition of dithionite into ferric-NO protein samples. Then NO gas was further bubbled gently into the samples to assure saturation of the heme with NO. Alternatively, NO gas was bubbled into deoxyferrous samples.
2.7. Preparation of oxyferrous samples
Oxyferrous samples were prepared in a mixed cryosolvent containing 60-70% (v/v) glycerol and 30-40% 50 mM Tris buffer, at pH 7.5 containing 150 mM NaCl. The ferric enzyme was degassed thoroughly by a continuous flow of N2 gas for 3 h on ice in a sealed cuvette and reduced with a nearly minimum amount of an aqueous solution of sodium dithionite (~25 mg/mL) to generate deoxyferrous cAOS and MAP. Deoxyferrous cAOS and MAP were cooled to −50 °C and bubbled with pre-cooled O2 in a −50 °C chest freezer.
2.8. Preparation of photoreduced BLC and its CO complex
Reduction of ferric BLC was performed by photoreduction under argon according to the method reported by Ward and Chang [15] in buffer (0.1 M potassium phosphate buffer, pH 7.0) containing 2% (v/v) isopropanol and ~0.1% (v/v) acetophenone in a rubber septum-stoppered cuvette (path length 0. 2 cm) and made anaerobic by gently bubbling with argon gas on ice for ~3 h through a syringe needle inserted through the rubber septum. The anaerobic solution of the sample thus prepared was subjected to photoreduction in a circulating ice water bath to protect the sample from heat while keeping slight positive pressure with argon in the cuvette. The photoreduction apparatus consisted of a 400-watt quartz mercury arc immersion UV lamp (Ace Glass Inc.) and a power supply. The reduction of the sample was monitored from its spectral changes after each photoirradiation.
2.9. Spectroscopic measurements
UV-visible (UV-Vis) absorption spectra were recorded with a Cary 400 spectrometer (at ~4 °C) or a JASCO J600A spectropolarimeter (at ~ −50 °C). MCD spectra were measured in a 1 cm or 0.2 cm cuvette at a magnetic field of 1.41T with the JASCO J600A spectropolarimeter (at ~4 °C or ~-50 °C) as described [16]. Data acquisition and manipulation were done as reported [16], with JASCO software.
3. Results
3.1 Native ferric MAP, cAOS and BLC compared with H93Y Mb
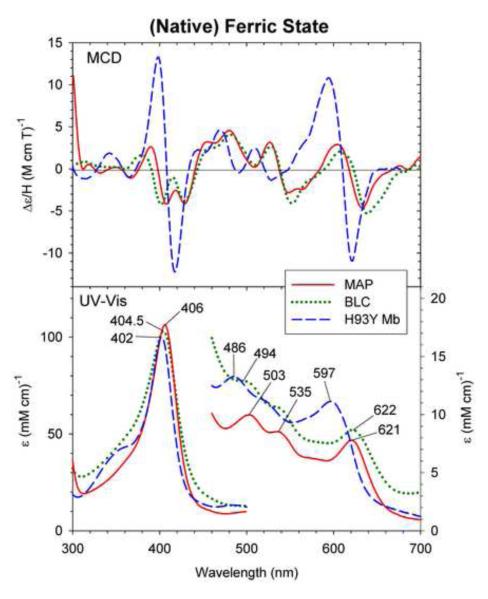
In Fig. 2, the MCD and UV-Vis absorption spectra of the native ferric state of MAP, cAOS and BLC are overlaid and compared with the spectra of ferric human H93Y Mb, a proximal cavity mutant of Mb. The MCD spectra of cAOS [13], BLC [13, 17, 18] and H93Y Mb [19] have been reported previously, and only the spectrum of MAP is new. All of these proteins contain a tyrosinate-ligated five-coordinate ferric heme and have distal His as established from their crystal structures (vide supra).
Fig. 2.
MCD and UV-Vis absorption spectra of native ferric Mycobacterium avium ssp. paratuberculosis protein-2744c (MAP) (solid line), bovine liver catalase (BLC) (dotted line) and ferric H93Y Mb (dashed line). The spectra of MAP was measured in 50 mM Tris, pH 7.5 containing 150 mM NaCl at 4 °C. The spectra of BLC and H93Y were replotted from refs. [13] and [19], respectively.
It can be seen that the first three heme enzymes share very similar MCD and UV-Vis absorption spectral patterns. In particular, a charge transfer band is seen at ~620 nm in their absorption spectra and the corresponding MCD spectra exhibit a prominent peak (~605 nm)-cross-over (~620 nm)-trough (~635 nm) pattern with the trough that is about twice as intense as the peak. The cross-over points (~620 nm) roughly correspond to the UV-Vis absorption peak positions. In the Soret region, the MCD spectra have split double troughs with nearly equal intensities. The MCD spectral band intensities and patterns in both the Soret and visible regions for BLC have been shown to be temperature-dependent due to the presence of Faraday C-terms (arising from the ground state degeneracy) [18]. Attempts to assign these transitions for BLC have not been done. Such temperature effects on the MCD spectra of cAOS and MAP have not been examined in this study.
In contrast, the spectral line shapes (MCD) and peak positions (UV-Vis) of ferric H93Y Mb are distinct from those of the other three proteins. In particular, a charge-transfer absorption band of H93Y Mb (597 nm) is considerably blue-shifted (by ~20 nm) from those of the other three proteins. In the Soret region, H93Y Mb has a slightly (by 2.5 – 4.5 nm) blue-shifted peak (402 nm) compared with the other three heme proteins. Furthermore, the MCD spectrum of H93Y Mb has two major derivative-shaped line shapes at ~410 (Soret) and ~610 nm (visible) with comparable peak-to-trough intensities. Apparently the heme electronic structure of ferric H93Y Mb differs noticeably from those of the other tyrosinate-ligated heme enzymes.
3.2 Ferric–cyanide (CN−) complexes
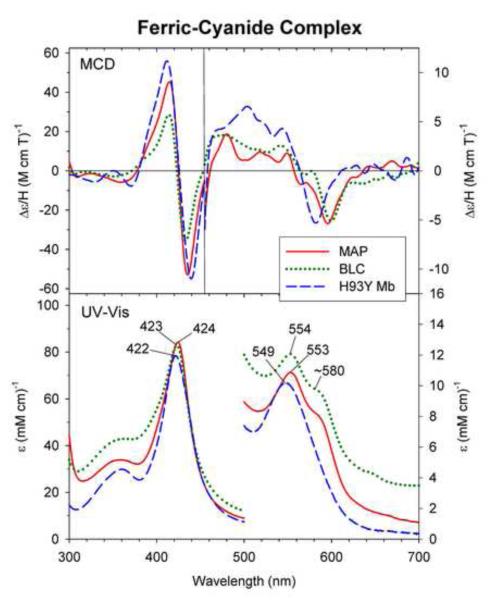
MCD and UV-Vis absorption spectra of ferric-cyanide (CN−) MAP show spectral characteristics that are similar to those previously reported for BLC [13, 17, 18] (Fig. 3) and cAOS [13]. The cyanide complexes of these heme enzymes are low spin [12, 17, 18] and exhibit absorption peaks at 420 – 424 nm (Soret region) and 550 – 544 nm (visible region) with an additional visible region peak (shoulder) at ~580 nm (Fig. 3). Ferric H93Y Mb also forms a cyanide complex with an absorption spectrum with peaks at 422 and 549 nm (Fig. 3, gray solid line). However, the MCD and absorption spectra of the H93Y Mb-cyanide complex can be distinguished from those of the cyanide adducts of MAP, cAOS and BLC in their visible region spectral features, namely the apparent lack of a longer wavelength side UV-Vis peak (shoulder at ~580 nm) (Fig. 3, bottom) and a detectably blue-shifted trough (~580 nm) position (MCD) (Fig. 3, top) for H93Y Mb. Instead, the spectra of the ferric-cyanide H93Y Mb complex are very similar to those of wild-type (wt) Mb-cyanide complex (except for about 2/3 and 1/2 Soret absorption and MCD intensities, respectively; see Supplementary Information, Fig. S1). This difference may be attributed to different heme iron axial ligands trans to the bound cyanide, most likely deprotonated tyrosinate oxyanion donor in cAOS, MAP and BLC and neutral distal His64 in H93Y Mb.
Fig. 3.
MCD and UV-Vis absorption spectra of ferric cyanide complex of MAP (solid line), BLC (dotted line) and H93Y Mb (dashed line). The spectra of MAP and H93Y Mb were measured under the conditions described in Fig. 2 in the presence of 7.3 μM and 100 mM potassium cyanide, respectively. The spectra of BLC were replotted from ref. [13].
3.3 Ferric-NO complexes
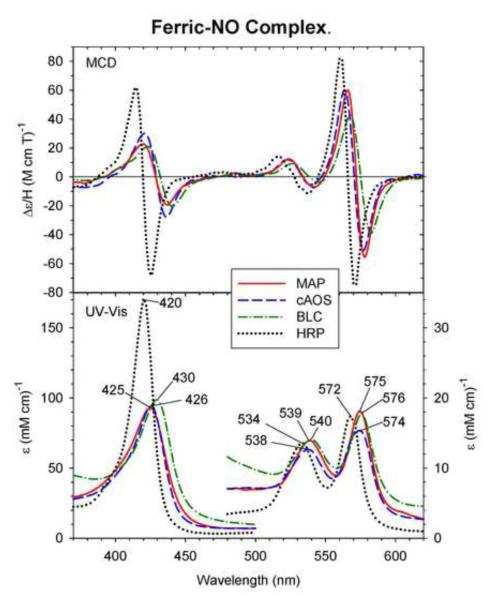
Fig. 4 compares the MCD and UV-Vis spectra of ferric-NO adducts of cAOS, MAP and BLC. Corresponding spectra of ferric-NO HRP [21], a His-ligated heme peroxidase, are also overlaid. The UV-Vis spectra of the ferric-NO complexes of these three tyrosinate-ligated heme proteins are very similar in absorption peak positions (Soret: 425 – 430 nm and visible: 538 – 540 nm and 574 – 576 nm) and are considerably red-shifted (by 5 – 10 nm in the Soret and 4 - 8 nm in the visible regions) from those of ferric-NO HRP. Although the overall line shapes for both the MCD (three derivative-shaped features centered around their absorption peak positions) and UV-Vis absorption spectra of all of them are similar to each other, the Soret absorption peak and MCD intensities of the three tyrosinate-ligated heme enzymes are much (by ~50%) smaller than those of the ferric-NO HRP. It is highly likely that tyrosinate (i.e., anionic oxygen donor atom) is retained as the proximal ligand trans to the heme iron-bound NO (a neutral ligand) for cAOS, MAP and BLC.
Fig. 4.
MCD and UV-Vis absorption spectra of the ferric-NO complex of MAP (solid line), cAOS (dashed line), BLC (dot-dashed line) and HRP (dotted line). The spectra of MAP, cAOS, and BLC were measured under the conditions described in Fig. 2. The MCD spectrum of HRP is replotted from Ref. [20].
3.4 Deoxyferrous state
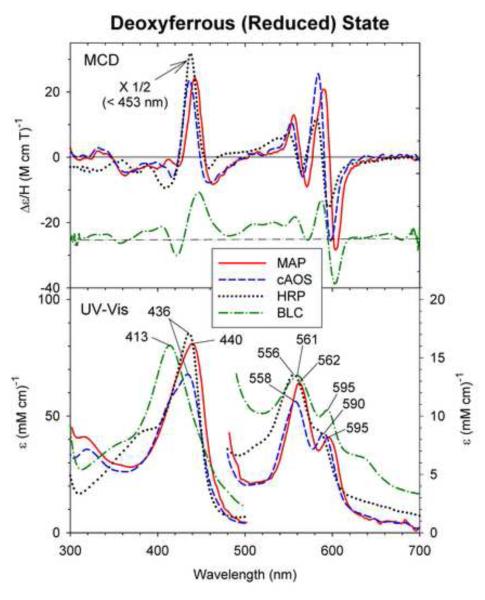
The MCD and UV-Vis spectra of the dithionite-reduced (deoxyferrous) cAOS, MAP and BLC, reported here for the first time, are compared with those of reduced HRP [21, 22] in Fig. 5. The UV-Vis spectrum of deoxyferrous BLC shown here, which was prepared by a photo-reduction method [15] (see Discussion), has the Soret peak at 413 nm and prominent visible region peaks at 561 and 595 nm. A similar absorption spectrum of photoreduced BLC was reported by Shimizu et al. [23] (Soret: 411 nm; visible region: 567 and 600 nm). In contrast, the Soret absorption peaks of the dithionite-reduced form of cAOS and MAP are seen at a considerably red-shifted positions, 436 and 440 nm, respectively, compared with that of BLC (413 nm) although the visible region absorption maxima (558 and 590 nm for cAOS, 562 and 595 nm for MAP, and 561 and 595 nm for BLC) are found at similar positions for reduced cAOS, MAP and BLC (Fig. 5, bottom). These UV-Vis spectral features of cAOS and MAP are quite similar to those of deoxyferrous HRP, a histidine-ligated heme peroxidase (Fig. 5 bottom, dotted line). The MCD spectra of reduced cAOS and MAP are also similar to the spectrum of HRP (Fig. 5, top) and exhibit a predominant Soret peak at ~440 nm (which corresponds to the absorption peak position) and two derivative-shaped visible region features (with the cross-over points that are close to the absorption peak positions) at 4 °C. It should be noted, however, the dithionite-reduced HRP is a five-coordinate high-spin species and these Soret and visible region MCD spectral features and intensities are temperature dependent, i.e., they consist of the Faraday C-terms [22]. These data suggest that the proximal axial tyrosinate ligand (anionic and thus negatively charged) in AOS and MAP might have been replaced by the distal histidine (neutral) from the opposite side upon dithionite reduction. Alternatively, the results could also be due to ligation of neutral (i.e., protonated) tyrosine oxygen donor from the proximal side to the five-coordinate ferrous heme iron (see Discussion).
Fig. 5.
MCD and UV-Vis absorption spectra of dithionite-reduced (deoxyferrous) cAOS (solid line), MAP (dashed line), BLC (dot-dashed line) and HRP (dotted line). The deoxyferrous cAOS and MAP spectra were measured in 70/30 (v/v) mixture of glycerol and 50 mM Tris, pH 7.5 containing 150 mM NaCl, at 4 °C and deoxyferrous HRP spectra were measured in 100 mM potassium phosphate buffer, pH 7.0, at 4 °C (the MCD spectrum replotted from ref. [20]. The spectra of BLC were recorded in at 4 °C under the conditions described in the materials and methods section. The ordinate for the MCD spectrum of BLC is offset downward by Δε/H = 25 M−1 cm−1 T−1 for clarity.
3.5 Ferrous-NO complexes
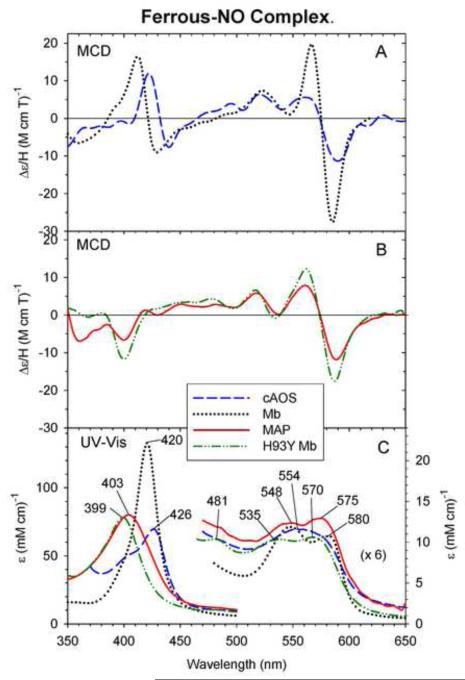
Fig. 6 compares the UV-Vis and MCD spectra of ferrous-NO cAOS and MAP with those of the ferrous-NO H93Y Mb and HRP. We have not attempted to prepare the NO complex of ferrous catalase for MCD measurements in this study. A previous study from our laboratory has shown that H93Y forms a five-coordinate Fe(II)-NO complex [24], i.e., upon reduction of the ferric-NO H93Y Mb, the tyrosinate axial ligand dissociate from the heme iron. The UV-Vis absorption (Fig. 6, bottom) and MCD spectra of ferrous-NO MAP (Fig. 6, middle) show spectral patterns that are similar to those of the NO complex of ferrous H93Y Mb, namely the presence of absorption peaks at ~400 nm (a main Soret peak) and at ~480 nm (an extra visible region peak) and a prominent MCD trough at ~400 nm, indicating that ferrous-NO MAP is also five-coordinate. In the visible region, both complexes have two broad absorption peaks at 535-540 and 570-575 nm (Fig. 6, bottom) and a similar MCD spectral pattern that consists of a peak (~520 nm), peak (~560 nm) and trough (~590 nm) with greater intensities toward the longer wavelengths (Fig. 6, middle).
Fig. 6.
MCD (A and B) and UV-Vis absorption spectra (C) of ferrous-NO MAP (solid line) (B and C), cAOS (dashed line) (A and C), H93Y Mb (dot-dashed line) (B and C) and wt Mb (sperm whale, dotted line) (A and C). The ferrous-NO MAP and cAOS spectra were measured under the conditions described in Fig. 2. The ferrous-NO H93Y Mb and wt Mb spectra were replotted from [24] and [25], respectively.
In contrast, ferrous-NO cAOS exhibits a Soret absorption peak at 426 nm with a shoulder at ~400 nm and a peak (~420 nm)-crossover (~430 nm)-trough (~440 nm) MCD spectral pattern that is roughly similar to that of ferrous-NO wt Mb except that the band positions for the cAOS complex in the Soret region are detectably red-shifted (420 vs. 426 nm Soret absorption peaks) (Fig. 6, bottom). In the visible region, the two absorption peaks for Fe(II)-NO cAOS (~555 and ~~580 nm) almost coalesce into one broad peak (~554 nm) while two bands (548 and 580 nm) are seen for the wt Mb complex (Fig. 6, bottom). These results suggest that ferrous-NO cAOS is mainly six-coordinate as is the wild type (wt) Mb complex and that the axial heme iron ligand trans to bound NO in these two heme proteins are different, i.e., the distal His is not the axial ligand in ferrous-NO cAOS.
3.6 Ferrous-CO complexes
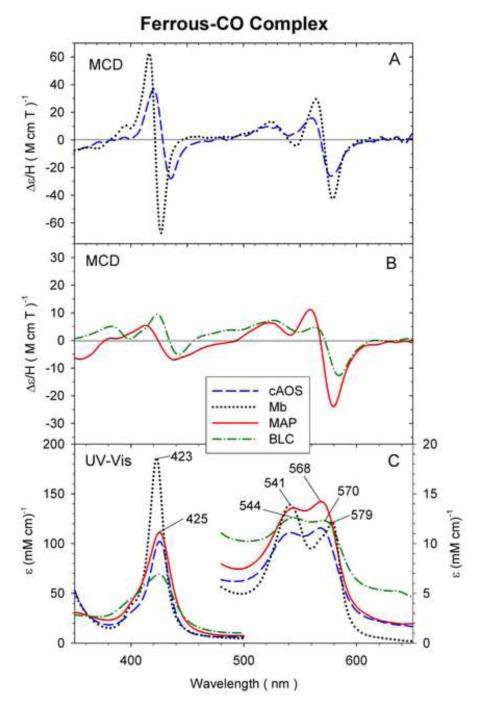
Fig. 7 shows the MCD and UV-Vis spectra of ferrous-CO cAOS and MAP (top and bottom) and those of BLC and wt Mb (SW) (middle and bottom). The absorption spectra of all of these ferrous-CO adducts are overall similar exhibiting a single Soret and two visible region peaks (Fig. 7, bottom). However, the Soret absorption peaks of cAOS, MAP and BLC are considerably lower in intensity (ε425 nm < 120 mM−1 cm−1) and slightly red-shifted from that of Mb (423 nm) (Fig. 7, bottom) or other histidine-ligated ferrous-CO heme proteins (Soret: ~420 nm). In the visible region, Mb shows relatively sharp peaks at 541 and 579 nm while cAOS, MAP and BLC exhibit two broad peaks at 540 and 569 nm (cAOS), at 544 and 568 nm (MAP) and at 544 and 579 nm (BLC) (Fig. 7, bottom). The MCD spectra of these ferrous-CO heme proteins have three derivative-shaped patterns (one in the Soret and two in the visible regions) with varying intensities. MAP and BLC have the smallest peak-to-trough Soret MCD intensities among the four proteins.
Fig. 7.
MCD (A and B) and UV-Vis absorption spectra (C) of ferrous-CO cAOS (dashed line) (A and C), wt Mb (sperm whale, dotted line) (A and C), MAP (solid line) (B and C) and BLC (dot-dashed line) (B and C). The ferrous-CO cAOS and MAP spectra were measured under the conditions described in Fig. 2. The ferrous-CO Mb spectra were measured in 100 mM phosphate, pH 7.0, at 4 °C. The spectra of ferrous-CO BLC were recorded at 4 °C under the conditions described in the materials and methods section.
3.7 Oxyferrous complexes of cAOS and MAP
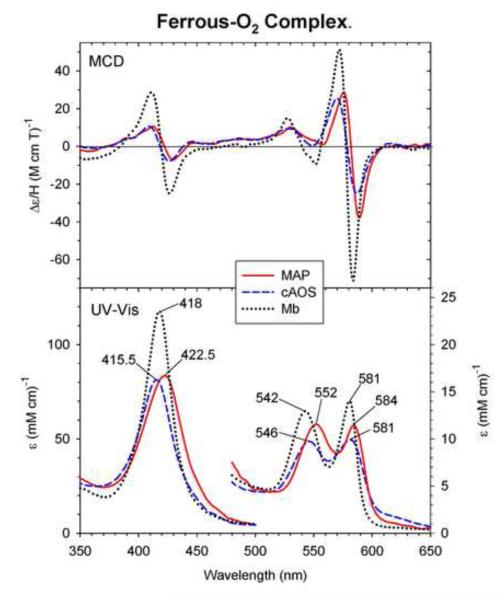
Fig. 8 displays the MCD and UV-Vis absorption spectra of the O2 complexes of ferrous cAOS, MAP and Mb recorded at ~-50 °C (for the first two, this study) or −30 °C (Mb) [25]. The MCD spectra of oxy cAOS and MAP show similarities to that of oxy Mb. The absorption peaks of the oxyferrous complexes of cAOS and MAP occur at 415.5, 546 and 580 nm (cAOS) and 422.5, 552 and 584 nm (MAP), somewhat close to the absorption peaks of oxy Mb at 418, 543 and 581 nm [25, 26]. In the visible region, the oxyferrous forms of cAOS, MAP and Mb all show two peaks at 546 and 580 nm (cAOS), 552 and 584 nm (MAP), and 543 and 581 nm (Mb).
Fig. 8.
MCD and UV-Vis absorption spectra of ferrous-O2 MAP (solid line) and cAOS (dashed line) and Mb (dotted line). The ferrous-O2 MAP and cAOS spectra were measured in 70/30 (v/v) mixture of glycerol and 50 mM Tris, pH 7.5 containing 150 mM NaCl, at −50 °C. The ferrous-O2 Mb spectra were replotted from Ref. [25].
4. Discussion
4.1 The origin(s) for the two types of UV-Vis absorption and MCD spectra in tyrosinate-ligated ferric heme proteins
We have recently demonstrated that the axial ligand mutant H93Y Mb, phenol-bound cavity mutant H93G Mb (which lacks the proximal His), and an axial ligand P450 mutant (C436S CYP2B4) all have very similar UV-Vis absorption and MCD spectra in the ferric state [27]. The results have led us to conclude that the latter two mutant heme proteins have an anionic oxygen atom donor ligated to the heme iron in a five-coordinate mode [27], as established for H93Y Mb [10], i.e., with an axial ligand being provided by tyrosinate for H93Y Mb, phenolate for H93G Mb and serinate for C436S CYP2B4. To propose a basis (or bases) for the spectral differences (see Results, section 3.1) between this group of phenolate (or alkoxylate)-ligated (mutant) heme proteins and the aforementioned tyrosinate-ligated (native) heme enzymes (cAOS, MAP and BLC), we compare the active site structures of the latter three proteins with that of H93Y Mb in detail (Fig. 8). Several possibilities emerge: (a) the Fe–O–Tyr bond angles, (b) the positions (distances, angles) of the distal His imidazole plane relative to the porphyrin plane, (c) the magnitude of the porphyrin plane ruffling, (d) degree of out of porphyrin plane positions of the heme iron and (e) effects of the presence and absence of the proximal side Arg+-Nω-H -- −O-Tyr hydrogen bond. Points (c) [19] and (e) [28] have been previously considered. We can rule out the first three factors (a – c) for the following reasons. Although the Fe–O–Tyr bond angles differ among the four proteins from 121-122° (cAOS and MAP) to 141° (H93Y Mb) to 145.5° (BLC) (cf. 136° for human erythrocyte catalase [29]), the angle for H93Y Mb is not much different from that for BLC. The imidazole planes of the distal His of cAOS, MAP and BLC are positioned nearly parallel to their heme planes with a plane-to-plane distance of 4.7 – 4.8 A in contrast to the nearly perpendicular angle in H93Y Mb. However, there are no direct or indirect (e.g., via water) contacts between the distal histidine imidazole ring and the heme plane or iron to influence its electronic structures for any of the four proteins. With regard to point (d), a high degree of porphyrin plane ruffling is only seen for BLC, i.e., not for the other two enzymes of the group. Thus, we propose that the marked spectral differences between H93Y Mb and the three tyrosinate-ligated heme enzymes (cAOS, MAP and BLC) (Fig. 1) are a consequence of the hydrogen bond from the Arg+-Nω-H to −O-Tyr (axial heme ligand) (point e). The degree of the out-of-plane positions of the heme iron (~0.43 A for H93Y Mb vs. nearly in-plane for cAOS, MAP and BLC) may be related to the absence and presence of the hydrogen bond.
4.2 Heme axial ligand identity in the ferrous states of cAOS and MAP
Despite the lack of catalase (catalatic) activity, the active site heme environments of cAOS and MAP are highly homologous to those of catalases such as BLC as described above. Yet, while cAOS and MAP can be readily reduced with sodium dithionite to generate deoxyferrous species and its ligand (NO, CO and O2) complexes ([13], this study), even the strong reductant sodium dithionite is incapable of reducing native ferric catalases [23, 30]. This has been attributed to the lack of dithionite access to the deeply buried catalase heme iron (~20 Å from the surface [9]). Thus, preparation of ferrous BLC derivatives requires alternative methods. Even though ferrous states are not involved in the normal catalytic reactions of BLC (as well as of cAOS and MAP), ferrous BLC species have been generated by photoreduction of ferric BLC under anaerobic conditions in the absence (for deoxyferrous form) and presence of CO (for ferrous-CO complex) or by the reactions of ferric BLC with H2O2 in the presence of azide under N2 (for ferrous-NO enzyme) or under CO (for ferrous-CO complex), where generation of azidyl radicals (N3·) are involved [31]. Furthermore, oxy-BLC (BLC compound III), which has absorption peak positions similar to those of oxy-cAOS and oxy-MAP (Fig. 8, bottom), has been prepared by adding excess H2O2 to BLC compound II [32]. Absorption spectral data (Soret and visible region peaks) of all of these ferrous derivatives of BLC are listed in Table 1 together with corresponding states of cAOS, MAP, H93Y Mb and WT Mb or HRP, whenever relevant, for comparison.
Table 1.
UV-Vis absorption peak positions and postulated heme iron coordination modes in several Tyr- or His-ligated ferrous heme proteins and their ligand complexes
| Ferrous derivative |
Heme protein | Soret peak | Visible | peaks | Coordination mode | Coordination number |
Preparation method |
Ref (s) |
|---|---|---|---|---|---|---|---|---|
| Deoxyferrous | BLC | 411 | 567 | 600 | Tyr-O-Fe(II) | 5 | Photoreduction | [25] |
| BLC | 413 | 561 | 595 | Tyr-O-Fe(II) a | 5 | Photoreduction | This study | |
| cAOS | 436 | 558 | 590 | Tyr-O(H)-Fe(II) a | 5 | Dithionite | This study | |
| MAP | 440 | 562 | 595 | Tyr-O(H)-Fe(II) a | 5 | Dithionite | This study | |
| HRP | 436 | 556 | 580 sh | His-N-Fe(II) | 5 | Dithionite | This study b | |
| H93Y Mb (sperm whale) |
428 | 556 | ( -- ) c | Tyr-O(H)-Fe(II) a | 5 | Dithionite | [39] | |
| H93Y Mb (human) | 427-429 | 558-560 | (~580sh) | His-N-Fe(II) | 5 | Dithionite | [14] | |
| H93G Mb | 427-428 | 558 | (~580sh) | H2O-Fe(II) | 5 | Dithionite | [43, 45] | |
| Mb (wt) | 433 | 558 | (~580sh) | His-N-Fe(II) | 5 | Dithionite | [20] | |
| Ferrous-NO | BLC | nr | 559 | 587 | Tyr-O-Fe(II)-NOa | 6 | H2O2 + azide | [36] |
| BLC | nr | 555 | 585 | Tyr-O-Fe(II)-NOa | 6 | H2O2 + azide | [40] | |
| BLC | 425 | 556 | ~580 sh | Tyr-O-Fe(II)-NOa | 6 | H2O2 + azide | [41] | |
| cAOS | 426 | ~555 bp | Tyr-O-Fe(II)-NOa | 6 | NO + dithionite | This study | ||
| MAP | 403 | 548 | 575 | Fe(II)-NO | 5 | NO + ditdithionite |
This study | |
| Ferrous-CO | BLC | nr | 540 | 575 | Tyr-O-Fe(II)-COa | 6 | H2O2 + azide + CO | [36] |
| BLC | 427 | 545 | 580 | Tyr-O-Fe(II)-CO | 6 | H2O2 + azide + CO | [42]. | |
| BLC | 425 | 541 | 568 | Tyr-O-Fe(II)-COa | 6 | Photoreduction + CO | [25] | |
| BLC | 425 | 544 | 570 | Tyr-O-Fe(II)-COa | 6 | Photoreduction + CO | This study | |
| cAOS | 425 | 541 | 568 | Tyr-O-Fe(II)-COa | 6 | Dithionite + CO | This study | |
| MAP | 425 | 541 | 568 | Tyr-O-Fe(II)-COa | 6 | Dithionite + CO | This study | |
| H93Y Mb | 420 | 539 | 569 | Tyr-O(H)-Fe(II)-CO | 6 | Dithionite + CO | [20] | |
| H93G Mb | 418 | nr | nr | H2O-Fe(II)-CO | 6 | Dithionite + CO | [43] | |
| Ferrous-O2 | BLC (compound III) |
414 | 550 | 583 | Tyr-O-Fe(II)-O2a | 6 | Compound II + H2O2 | [38] |
| cAOS | 415.5 | 546 | 580 | Tyr-O-Fe(II)-O2a | 6 | Fe(II) + O2 | This study | |
| MAP | 422.5 | 552 | 584 | Tyr-O-Fe(II)-O2a | 6 | Fe(II) + O2 | This study | |
| Mb (sperm whale) |
418 | 543 | 581 | His-N-Fe(II)-O2 | 6 | Fe(II) + O2 | [28] |
The identity of the axial ligand, deprotonated (tyrosinate, Tyr-O−) or neutral tyrosine [Tyr-O(H)], was postulated in this study. The axial ligand identity was not explicitly indicated or speculated in the cited references except for “This study”.
The presence and position of a shoulder are not specifically reported.
Not reported.
Shoulder.
Broad peak.
The spectral data in Table 1 indicate that ferrous-CO complexes of cAOS, MAP and BLC have relatively similar absorption peak positions (Soret 425 – 427 nm) that are detectably red-shifted from those of wt Mb (423 nm), H93Y Mb (420 nm) and H93G Mb (418 nm). Obviously, proximal His is the axial ligand for ferrous-CO wt Mb. Thus, it may be reasonable to consider tyrosinate (Tyr-O−) to be the axial heme iron ligand trans to bound CO for cAOS, MAP and BLC. On the other hand, neutral (protonated) Tyr (Tyr-OH) and water (H2O) have been postulated to be the axial ligand for Fe(II)-CO H93Y Mb [27] and H93G Mb [37], respectively. It has been shown that, in H93Y Mb (as well as H93C Mb), the negatively charged axial ligand (Tyr-O− or Cys-S−) to the ferric heme iron cannot be retained upon reduction of the iron [38, 39]. This is most likely due to a change of the overall charge of the ferric heme center from neutral [porphyrin dianion (2−), ferric iron (3+) and tyrosinate proximal ligand (1−)] to 1-upon reduction of the heme iron. In contrast, the ligation of the anionic tyrosinate to the ferrous heme iron in ferrous-CO cAOS, MAP and BLC proteins may be tolerated or supported by the presence of a cationic (protonated) arginine residue near the proximal Tyr ligand that not only neutralizes the anionic charge on the heme center but also forms a hydrogen bond to the heme iron-ligated tyrosinate oxygen donor as described above. The same explanation can be applied to the formation of stable ferric-cyanide derivative of these heme proteins, which is a bis-anionic ligand complex (see Results).
In the O2 complex, the Soret absorption peak positions for cAOS (415.5 nm), MAP (422 nm) and BLC (414 nm) are not clearly distinguishable from that of wt oxy-Mb (418 nm). The MCD spectra of all these three ferrous-O2 adducts are also similar to each other. However, some noticeable differences are also observed; the peak-to-trough intensities for cAOS and MAP are about half of those of Mb (Fig. 8, top). In addition, the Soret (422.5 vs. 418 nm) and visible β-peak positions (552 vs. 542 nm) of oxy-MAP (but not oxy-cAOS) are significantly red-shifted from those of oxy-Mb. Although the O2 complex of BLC (compound III) has not been prepared and its MCD spectrum not examined in this study, it appears that tyrosinate oxygen donor is the axial ligand in the O2 complex of all the three heme enzymes (cAOS, MAP, BLC) analogous to the case of their ferrous-CO adducts. Apparently, the trans ligand difference (Tyr-O− vs. His) does not cause large absorption spectral effects on the oxyferrous form of these heme proteins.
UV-Vis absorption, MCD and EPR spectra of ferrous-NO heme proteins can provide unique information as to whether the species is six- or five-coordinate [24] and whether the trans ligand in six-coordinate complexes is a nitrogen or non-nitrogen donor [40]. Ferrous-NO MAP exhibits UV-Vis absorption (Soret peak at ~400 nm and a small band at ~480 nm) and MCD spectra (Soret trough at ~400 nm) (Fig. 6, solid line) that are characteristic of a five-coordinate species as seen for ferrous-NO H93Y Mb (Fig. 6, dot-dot-dash line) [24]. In contrast, the ferrous-NO cAOS is mainly six-coordinate with a small fraction of five-coordinate species present (a shoulder at ~400 nm in its UV-Vis spectrum, Fig. 6, bottom). For the ferrous-NO adducts, the main Soret absorption peak position (426 nm) of cAOS is considerably red-shifted from the corresponding peak (420 nm) of Mb, but similar to a peak at 425 nm of BLC [35] (Table 1). The visible region absorption bands for cAOS, which seem to have coalesced into a wide single peak at ~550 nm (cf. 550 and ~580 (shoulder) nm for BLC), are broader than those of the Mb complex. Based on these results, we assign the axial ligand to the ferrous heme iron trans to NO as a tyrosinate oxygen donor (Tyr-O−) in ferrous-NO cAOS and BLC.
Finally, we discuss the identity of the axial ligand in the exogenous ligand-free reduced (deoxyferrous) state of the three heme enzymes (cAOS, MAP and BLC) and H93Y Mb by comparing their spectral properties with those of two His-ligated heme proteins (Mb and HRP). Unlike the case of ferrous-CO and -O2 complexes, reduced cAOS and MAP exhibit UV-Vis absorption spectra that have drastically red-shifted Soret peaks (436 – 440 nm) compared with that of reduced BLC (Soret 413 nm) (Fig. 5, bottom; Table 1). Both the absorption and MCD spectra of cAOS and MAP are very similar to those of HRP (Fig. 5), which contains a His-ligated five-coordinate heme. Thus, it could be speculated that distal His may be the axial ligand in reduced cAOS and MAP.
The deoxyferrous forms of these Mbs have been postulated to have water (H2O) (H93G Mb) [37], distal His (human H93Y Mb [14]) or non-His ligand (sperm whale H93Y Mb [38]) and obviously proximal His (wt Mb). Yet, we have found that the spectral properties (UV-Vis and MCD) of dithionite-reduced H93G Mb, H93Y Mb (human) and wt Mb are very similar in terms of absorption peak positions and MCD spectral line shape as shown in Fig. S2 (Supplementary Information). Thus, the apparent spectral similarity does not necessarily indicate that reduced cAOS and MAP have His (distal) axial ligand as HRP does (proximal His). Neutral Tyr (Tyr-OH) could be the axial ligand for reduced cAOS and MAP and they could still exhibit deoxyferrous HRP-type spectra. Although distal His ligation in reduced cAOS and MAP is possible, large structural changes in their heme active sites would be required for the distal His to ligate to the heme iron (see Fig. 1). For this reason we propose that the proximal tyrosine ligand is maintained in the reduced state of cAOS and MAP, but in a protonated (neutral) form (i.e., Tyr-OH) rather than being replaced with distal His. Since all the ligand complexes (NO, CO and O2) of ferrous cAOS and MAP (except for the NO adduct, see above) are six-coordinate and thus have the heme iron in-plane in contrast to having out-of-plane heme iron in the five-coordinate deoxyferrous state, a neutral rather than deprotonated tyrosine might be preferred in deoxyferrous cAOS and MAP.
5. Conclusions
The UV-Vis absorption and MCD spectra of the native ferric tyrosinate-ligated heme enzymes cAOS, MAP and BLC detectably differ from those of ferric H93Y Mb and the phenol-H93G Mb complex. In addition, unlike the case of H93Y Mb, the proximal tyrosinate (Tyr-O−) heme ligand is most likely retained in the ligand (NO, CO and O2) complexes of ferrous cAOS, MAP (except for the NO adduct) and BLC as well as in their neutral (NO) and anionic ligand (CN−) adducts of the ferric state. We attribute these spectral differences in the ferric state and the retention of the tyrosinate oxyanion heme axial ligand in the ferrous state to the presence (cAOS, MAP and BLC) and absence (H93Y Mb) of a hydrogen bond from the Arg+-Nω-H to the −O-Tyr (axial heme ligand). This hydrogen bond would be expected to moderate the donor properties of the proximal tyrosinate and, in turn, influence the catalytic activities of cAOS, MAP and BLC by stabilizing the oxyanionic tyrosinate ligand. Subtle differences in the catalytic site structures such as substrates accessibilities and the positions of the distal His in these three structurally related heme enzymes would further differentiate their catalytic functions [4, 9, 11, 13]. The information provided in the present study would also be helpful in understanding the functions of several known heme transporter proteins that utilize tyrosinate-ligation to form a protein-heme complex for heme acquisition and delivery [28, 41-44].
Supplementary Material
Acknowledgements
We thank Dr. M. Ikeda-Saito for the human H93Y Mb protein, Dr. Benlian Gao for the MAP protein, and William E. Boeglin for providing the cAOS. This research was supported by grants from the National Institutes of Health [GM-26730 to J.H.D. and GM-74888 to A.R.B.] and the Research Corp to J.H.D.
Footnotes
Appendix A. Supplementary material
The following spectral data (Figs. S1 and S2) are available as Supplementary Materials. (Fig. S1): MCD and UV-Vis absorption spectra of ferric-cyanide complex of MAP, H93Y Mb and wt Mb (sperm whale); (Fig. S2): MCD and UV-Vis absorption spectra of dithionite-reduced H93Y Mb (human), H93G Mb (sperm whale) and wt Mb (sperm whale). Supplementary data associated with this article can be found in the online version at doi:
Publisher's Disclaimer: This is a PDF file of an unedited manuscript that has been accepted for publication. As a service to our customers we are providing this early version of the manuscript. The manuscript will undergo copyediting, typesetting, and review of the resulting proof before it is published in its final citable form. Please note that during the production process errors may be discovered which could affect the content, and all legal disclaimers that apply to the journal pertain.
References
- [1].Zamocky M, Furtmüller PG, Obinger C. Antioxid. Redox Signal. 2008;10:1527–1547. doi: 10.1089/ars.2008.2046. [DOI] [PMC free article] [PubMed] [Google Scholar]
- [2].Koljak R, Boutland O, Shieh B, Samel N, Brash AR. Science. 1997;277:1994–1996. doi: 10.1126/science.277.5334.1994. [DOI] [PubMed] [Google Scholar]
- [3].Bundy G. Adv. Prostaglandin Thromboxone Leukotriene Res. 1985;14:229–262. [PubMed] [Google Scholar]
- [4].Oldham ML, Brash AR, Newcomer ME. Proc. Nat. Acad. Sci. USA. 2005;102:297–302. doi: 10.1073/pnas.0406352102. [DOI] [PMC free article] [PubMed] [Google Scholar]
- [5].Gao B, Boeglin WE, Brash AR. Arch. Biochem. Biophys. 2008;477:285–290. doi: 10.1016/j.abb.2008.07.011. [DOI] [PMC free article] [PubMed] [Google Scholar]
- [6].Jones P. In: Peroxidases and Catalases: Biochemistry, Biophysics and Physiology. 2nd Ed Dunford HB, editor. John Wiley & Sons; Hoboken, New Jersey, U.S.A.: 2011. pp. 233–256. [Google Scholar]
- [7].Song WC, Brash AR. Science. 1991;253:781–784. doi: 10.1126/science.1876834. [DOI] [PubMed] [Google Scholar]
- [8].Pakhomova S, Gao IB, Boeglin WE, Brash AR, Newcomer ME. Protein Sci. 2009;18:2559–2568. doi: 10.1002/pro.265. [DOI] [PMC free article] [PubMed] [Google Scholar]
- [9].Fita I, Rossmann MG. J. Mol. Biol. 1985;185:21–37. doi: 10.1016/0022-2836(85)90180-9. [DOI] [PubMed] [Google Scholar]
- [10].Hildebrand DP, David L, Burk DL, Maurus R, Ferrer JC, Gary D, Brayer GD, Mauk AG. Biochemistry. 1995;34:1997–2005. doi: 10.1021/bi00006a021. [DOI] [PubMed] [Google Scholar]
- [11].Tosha T, Uchida T, Brash AR, Kitagawa T. J. Biol. Chem. 2006;281:12610–12617. doi: 10.1074/jbc.M600061200. [DOI] [PubMed] [Google Scholar]
- [12].Wu F, Leron KJ, Seavy M, Gaffney BJ. Biochemistry. 2003;42:6871–6880. doi: 10.1021/bi027427y. [DOI] [PMC free article] [PubMed] [Google Scholar]
- [13].Abraham BD, Sono M, Boutland O, Shriner A, Dawson JH, Brash AR, Gaffney BJ. Biochemistry. 2001;40:2251–2259. doi: 10.1021/bi002121h. [DOI] [PubMed] [Google Scholar]
- [14].Adachi S, Nagano S, Ishimori K, Watanabe Y, Morishima I, Egawa T, Kitagawa T, Makino R. Biochemistry. 1993;32:241–252. doi: 10.1021/bi00052a031. [DOI] [PubMed] [Google Scholar]
- [15].Ward B, Chang CK. Photochem. Photobiol. 1982;35:757–759. doi: 10.1111/j.1751-1097.1982.tb02643.x. [DOI] [PubMed] [Google Scholar]
- [16].Huff AM, Chang CK, Cooper DK, Smith KM, Dawson JH. Inorg. Chem. 1993;32:1460–1466. [Google Scholar]
- [17].Browett WR, Stillman MJ. Biochim. Biophys. Acta. 1979;577:291–306. doi: 10.1016/0005-2795(79)90033-3. [DOI] [PubMed] [Google Scholar]
- [18].Eglinton DG, Gadsby PMA, Sievers G, Peterson J, Thomson AJ. Biochim. Biophys. Acta. 1983;742:648–658. doi: 10.1016/0167-4838(83)90284-4. [DOI] [PubMed] [Google Scholar]
- [19].Pond AE, Roach MP, Sono M, Rux A. Huff, Franzen S, Hu R, Thomas MR, Wilks A, Dou Y, Ikeda-Saito M, de Montellano P. R. Ortiz, Woodruff WH, Boxer SG, Dawson JH. Biochemistry. 1999;38:7601–7608. doi: 10.1021/bi9825448. [DOI] [PubMed] [Google Scholar]
- [20].Dawson JH, Kadkhodayan S, Zhuang C, Sono M. J. Inorg. Biochem. 1992;45:179–192. doi: 10.1016/0162-0134(92)80043-u. [DOI] [PubMed] [Google Scholar]
- [21].Nozawa T, Kobayashi N, Hatano M. Biochim. Biophys. Acta. 1976;427:652–662. doi: 10.1016/0005-2795(76)90209-9. [DOI] [PubMed] [Google Scholar]
- [22].Sharonov YA, Mineyev AP, Livshitz MA, Sharonova NA, Zhurkin VB, Lysov YP. Biophys. Struc. Mech. 1978;4:139–158. doi: 10.1007/BF00539228. [DOI] [PubMed] [Google Scholar]
- [23].Shimizu N, Kobayashi K, Hayashi K. J. Biochem. 1988;104:136–140. doi: 10.1093/oxfordjournals.jbchem.a122409. [DOI] [PubMed] [Google Scholar]
- [24].Voegtle HL, Sono M, Adak S, Pond AE, Tomita T, Perera R, Goodin DB, Ikeda-Saito M, Stuehr DJ, Dawson JH. Biochemistry. 2003;42:2475–2484. doi: 10.1021/bi0271502. [DOI] [PubMed] [Google Scholar]
- [25].Sono M, Eble KS, Dawson JH, Hager LP. J. Biol. Chem. 1985;260:15530–15535. [PubMed] [Google Scholar]
- [26].Antonini E, Brunori M. Hemoglobin and myoglobin in their reactions with ligands. North-Holland Publishing Co.; Amsterdam: 1971. p. 19. [Google Scholar]
- [27].Perera R, Sono M, Voegtle HL, Dawson JH. Arch. Biochem. Biophys. 2011;507:119–125. doi: 10.1016/j.abb.2010.12.010. [DOI] [PMC free article] [PubMed] [Google Scholar]
- [28].Ghosh K, Thompson AM, Goldbeck RA, Shi X, Whitman S, Oh E, Zhiwu Z, Vulpe C, Holman TR. Biochemistry. 2005;44:16729–16736. doi: 10.1021/bi0511585. [DOI] [PMC free article] [PubMed] [Google Scholar]
- [29].Putnam CD, Arvai AS, Bourne Y, Tainer JA. J. Mol. Biol. 2000;296:295–309. doi: 10.1006/jmbi.1999.3458. [DOI] [PubMed] [Google Scholar]
- [30].Keilin D, Hartree EF. Biochem. J. 1945;37:148–157. doi: 10.1042/bj0390148. [DOI] [PMC free article] [PubMed] [Google Scholar]
- [31].Kalyanaraman B, Janzen EG, Mason RP. J. Biol. Chem. 1985;260:4003–4006. [PubMed] [Google Scholar]
- [32].Lardinois OM. Free Rad. Res. 1995;22:251–274. doi: 10.3109/10715769509147544. [DOI] [PubMed] [Google Scholar]
- [33].Egeberg KD, Springer BA, Martinis SA, Sligar SG, Morikiss D, Champion PM. Biochemistry. 1190;29:9783–9791. doi: 10.1021/bi00494a004. [DOI] [PubMed] [Google Scholar]
- [34].Nicholls P. Biochem. J. 1964;90:331–343. doi: 10.1042/bj0900331. [DOI] [PMC free article] [PubMed] [Google Scholar]
- [35].Lardinois OM, Rouxhet PG. Biochim. Biophys. Acta. 1996;1298:180–190. doi: 10.1016/s0167-4838(96)00130-6. [DOI] [PubMed] [Google Scholar]
- [36].Hu S, Kincaid JR. FEBS Lett. 1992;314:293–296. doi: 10.1016/0014-5793(92)81492-5. [DOI] [PubMed] [Google Scholar]
- [37].Franzen S, Bailey J, Dyer RB, Woodruff WH, Hu RB, Thomas MR, Boxer SG. Biochemistry. 2001;40:5299–5305. doi: 10.1021/bi0023403. [DOI] [PubMed] [Google Scholar]
- [38].Roach MP, Pond AE, Thomas MR, Boxer SG, Dawson JH. J. Am. Chem. Soc. 1999;121:12088–12093. [Google Scholar]
- [39].Perera R, Sono M, Sigman JA, Pfister TD, Lu Y, Dawson JH. Proc. Nat. Acad. Sci. U.S.A. 2003;100:3641–3646. doi: 10.1073/pnas.0737142100. [DOI] [PMC free article] [PubMed] [Google Scholar]
- [40].Praneeth VKK, Haupt E, Lehnert N. J. Inorg. Biochem. 2005;99:940–948. doi: 10.1016/j.jinorgbio.2005.02.007. [DOI] [PubMed] [Google Scholar]
- [41].Ho WW, Li H, Eakanunkul S, Tong Y, Wilks A, Guo M, Poulos TL. J. Biol. Chem. 2007;282:35286–35292. doi: 10.1074/jbc.M706761200. [DOI] [PubMed] [Google Scholar]
- [42].Lukat-Rodgers GS, Rodgers KR, Caillet-Saguy C, Izadi-Pruneyre N, Lecroisey A. Biochemistry. 2008;47:2087–2098. doi: 10.1021/bi7019518. [DOI] [PubMed] [Google Scholar]
- [43].Muryoi N, Tiedemann MT, Pluym M, Cheung J, Heinrichs DE, Stillman MJ. J. Biol. Chem. 2008;283:28125–28136. doi: 10.1074/jbc.M802171200. [DOI] [PMC free article] [PubMed] [Google Scholar]
- [44].Tong Y, Guo M. Arch. Biochem. Biophys. 2009;481:1–15. doi: 10.1016/j.abb.2008.10.013. [DOI] [PMC free article] [PubMed] [Google Scholar]
Associated Data
This section collects any data citations, data availability statements, or supplementary materials included in this article.


