Abstract
Protein nitration has been recognized as an important biomarker for nitroxidative stress associated with various diseases. While identification of protein targets for nitration is important, its quantitative profiling also is necessary to understand the biological impact of this low-abundance posttranslational modification. We have previously reported an efficient and straightforward enrichment method for nitropeptides to reduce sample complexity and permit unambiguous site-specific identifications by LC–MS analyses. This approach relies on two chemical derivatization steps: specifically reductive methylation of aliphatic amines and, then, conversion of nitrotyrosines to the corresponding aminotyrosines before their selective capture by a solid-phase reagent we introduced previously. Hence, the method inherently offers the opportunity for relative quantitation of nitropeptides by using isotopic variants of formaldehyde for reductive methylation. This simple method was tested via LC–MS analyses of differently N-methylated nitropeptides and nitroubiquitin as a model nitroprotein enriched from human serum albumin digest and from human plasma, respectively.
Keywords: Protein nitration, Stable-isotope labeling, Enrichment, Relative quantitation, LC–MS, Tandem mass spectrometry
1. Introduction
Protein nitration is a low-abundance posttranslational modification (PTM) that is associated with a variety of diseases [1-7]. Therefore, quantification and site-specific identification of this process may enhance our understanding of the role of this PTM in biological and pathological processes. It has been a challenging task to reliably detect and measure protein nitration due to its low stoichiometry in a biological system [8,9], which may also contribute to misidentifications of nitropeptides by “shotgun” proteomics [10,11]. While several direct and indirect methods based on chromatography, mass spectrometry, and/or immunoassay have been developed for identification and quantitation of protein nitration [12-20], recent publications have highlighted caveats associated with these techniques [12,13,15-17]. For example, the “native reference peptide” method reported for quantitative analysis of protein nitration compares the nitropeptide with a peptide in the sample that serves as an internal standard [21]. The narrow criteria set for the selection of suitable reference peptides, however, raise serious limitations for its general usefulness. On the other hand, chemoprecipitation-based enrichments use covalent immobilization of targeted peptides on a solid-phase reagent. This approach has been successfully applied for the analyses of protein carbonyls [22-25]. As an extension of this work, we have recently introduced a simple and efficient enrichment method for which a solid-phase active ester reagent (SPAER) on glass beads was designed and synthesized. The procedure requires only two well-established chemical derivatizations on the nitrotyrosines (N-dimethylation of aliphatic amines followed by reduction of nitrotyrosines to the corresponding aminotyrosines) before their capture by SPAER and subsequent release of tagged nitropeptides by acid-catalyzed hydrolysis under mild conditions [26]. Previous multi-step chemoprecipitation techniques have utilized sepharose or agarose beads as solid supports [27,28]. The use of glass beads allows for more aggressive washing with aqueous and organic solvents to remove absorbed but not covalently immobilized (“carryover”) peptides and impurities.
For MS-based quantitative proteomics, stable-isotope labeling has been applied to increase the accuracy of quantitative results [29]. Stable isotopes are introduced by various tagging techniques, such as metabolic, enzymatic and chemical labeling [30,31]. The latter method employs externally introduced tags. We have recently reported the use of light- and heavy-isotopic N-dimethyl labeling of aliphatic amines in peptides combined with chemoprecipitation-based enrichment for relative quantification of posttranslational protein carbonylation by 4-hydroxy-2-nonenal [22]. Others have used 13C0/13C4- or d0/d6-acetic anhydride for the labeling of aliphatic amines to quantify nitropeptides by matrix-assisted laser desorption/ionization time-of-flight mass spectrometry [32]. However, acylation is not selective, as O-acylation also occurs [33], and it also alters peptide charge and, therefore, it may significantly reduce ionization when ESI is used for MS analysis [34]. Additionally, we have shown that (unlike reductive methylation that proceeds with practically quantitative yield [35]), the yield of acylation strongly depends on peptide sequence [26].
While the isotope-coded affinity-tag (ICAT) method is well known in quantitative proteomics, it only targets cysteine-containing peptides [36]. The tandem mass tag (TMT) and isobaric tags for relative and absolute quantitation (iTRAQ) methods, however, enable quantitative labeling of proteins extracted from cells or tissues for MS analyses by targeting amino groups [37,38]. The iTRAQ method also has been adapted for relative quantification of protein nitration (i.e., measuring extent of protein nitration among samples relative to each other, but without actually obtaining nitropeptide concentrations from the assay, which is sufficient in most discovery-driven proteomics studies) [39]. The drawback of this method is the requirement of instrumentation capable of MS/MS at low m/z (below 150 Da) [35], which is usually not amenable or cumbersome on routine ion traps. On the other hand, isotopic N-dimethylation via reductive alkylation [35,40,41] has been shown to be an inexpensive, fast and efficient method with over 99% reaction yield for global labeling of aliphatic amines in peptides at the N-termini and the side-chains of lysine residues for quantitative proteome analysis [22,26,35,40-42]. Since the SPAER approach inherently involves reductive methylation to block aliphatic amines [26], this technique could easily be adapted, therefore, to permit relative quantitation of nitropeptides by simply using isotopic variants of formaldehyde. The introduction and testing of this approach is reported in the present study.
2. Experimental
2.1. Chemicals and materials
All chemicals and reagents were purchased from Sigma–Aldrich (St. Louis, MO) unless otherwise specified. Stable isotope labeled D13CDO (formaldehyde-13C, d2, 99 at% 13C and 98 at% D isotopic purity, as 20% w/v solution in D2O) was purchased from Isotec (Miamisburg, OH). Synthetic peptides containing 3-nitrotyrosine (Y*) residues, Y*LQEIYNSNNQK, EGYY*GYTGAFR and GDY*DLNAVR, were custom synthesized by Synthetic Biomolecules (San Diego, CA) and were purified by RPLC by the manufacturer providing >75% peptide content. Ubiquitin (Enzo Life Sciences, Plymouth Meeting, PA, USA) was nitrated by adding 1 μL of tetranitromethane (TNM) into 1 mg/mL protein solution in 50 mM ammonium bicarbonate [43,44]. After 4 h of reaction at room temperature, excess TNM was removed by dichloromethane extraction and the product was purified by gradient semi-preparative RPLC. Trypsin (TPCK-treated) was purchased from Applied Biosystems Inc. (Foster City, CA). SPAER on glass beads was synthesized in our laboratory as reported earlier [26].
2.2. Dimethylation of nitropeptides by reductive alkylation
Two-hundred microliters of nitropeptide stock solution (1 μg/μL) in 100 mM sodium acetate buffer (pH 5.5) was mixed with freshly prepared sodium cyanoborohydride (1 M, 10 μL) and 3.5 μL of formaldehyde (HCHO, 30%, w/v, in H2O) or 5 μL of D13CDO (20%, w/v, in D2O). The mixture was incubated at 40 °C for 1 h. The reaction was then quenched first with ammonium hydroxide (20%, 5 μL) to consume the excess of formaldehyde, followed by acidification to pH ~3 by adding formic acid to decompose sodium cyanoborohydride. The N-(CH3)2- and N- (13CHD2)2-labeled nitropeptides were combined in various ratios (1:10, 1:3, 1:1, 3:1 and 10:1, respectively). After desalting by solid phase extraction (SPE, C18 Sep-Pak, Waters, Milford, MA), these samples were used for verifying accuracy and reproducibility of the differential dimethyl labeling.
2.3. Preparation of tryptic digests of human serum albumin (HSA) containing light and heavy dimethyl-labeled nitropeptides
HSA (4 mg) was dissolved in 50 mM ammonium bicarbonate. The disulfide bonds of HSA were reduced with freshly prepared 5 mM dithiothreitol (DTT) at 56 °C for 30 min and alkylated with 10 mM iodoacetamide (IAA) at room temperature for 30 min in the dark in a customary manner. Then, trypsin was added to a final ratio of 1:50 (w/w, protein:enzyme) and the solution was kept at 37 °C overnight. The enzymatic reaction was terminated by adding acetic acid to adjust pH to 3. The digested peptides were desalted by solid phase extraction. The sample was divided and dimethylated with either H12CHO or D13CDO. Then the differentially labeled samples were mixed in 1:1 ratio to provide matrices used for spiking with various ratios of light- and heavy-N-dimethylated nitropeptides. Then 400 μg of matrix in 400 μL of phosphate buffer was spiked with 5 ng/μL of each of the light and heavy labeled peptides (#Y*LQEIYNSNNQK#, #EGYY*GYTGAFR and #GDY*DLNAVR, where # denotes either the light or heavy N-dimethyl label, respectively) corresponding to 1:1 light to heavy ratio. Other samples were spiked with light to heavy labeled peptides in 1:0.33 and 0.33:1 ratios, respectively.
2.4. Preparation of differently labeled tryptic digests from human plasma–nitroubiquitin mixture
Protein content of human plasma was measured by BCA protein assay reagent kit (Pierce, Rockford, IL). Samples were prepared to contain 0.5, 1.5, 5.0 and 15 μg of nitroubiquitin per mg total plasma protein. Proteins were precipitated using 200 μL (~10 mg proteins) of sample by adding four volumes of cold (−20 °C) acetone according to a technical note available online (http://www.piercenet.com/files/TR0049-Acetone-precipitation.pdf). The precipitate was then centrifuged at 12,000 rpm at 4 °C for 10 min, and the pellet was resuspended in 1 mL of 8 M urea and the mixture was vortexed thoroughly. Six hundred micrograms of protein was aliquoted into 2 mL of 50 mM ammonium bicarbonate buffer. The disulfide bonds of plasma proteins were reduced with 10 μL of 100 mM DTT and then alkylated with 10 μL of 200 mM IAA in a customary manner. Trypsin was added to a final protease:protein ratio of 1:50 (w/w) for overnight digestion at 37 °C. The digested peptides were desalted by solid phase extraction and the samples were divided into two aliquots that were N-dimethylated with either H12CHO or D13CDO in the presence of sodium cyanoborohydride [26,35,40,41]. The differentially labeled peptides were mixed in 1:1 ratio then captured by SPEAR as described below [26].
2.5. Enrichment of N-dimethyl-labeled nitropeptides with SPAER
Samples containing various ratios of light and heavy labeled nitropeptides were treated with 500-fold molar excess of Na2S2O4 in 100 mM phosphate buffer (pH 8) at room temperature for 30 min to reduce nitrotyrosines to the corresponding aminotyrosines. Excess Na2S2O4 was decomposed by acidifying the solution (acetic acid, pH 3) for 30 min. The pH was then adjusted to 5.5 and 5 mg of SPAER [26] was added. The resultant slurry was rotated end-over-end overnight. SPAER was then pelleted by centrifugation, and the supernatant was removed. The pelleted beads were thoroughly washed in a screw cap spin column (Thermo Scientific, Rockford, IL) with water, 20% methanol/H2O, acetonitrile and dichloromethane. The beads were then transferred to a microcentrifuge tube and the captured peptides were released by treatment with 200 μL of 95% (v/v) trifluoroacetic acid (TFA)/H2O at room temperature for 1 h. The solvent was evaporated under a nitrogen stream and the residue was subjected to LC–MS/MS analyses.
2.6. Liquid chromatography–electrospray ionization tandem mass spectrometry (LC–ESI-MS/MS)
An Eksigent nano-LC-2D system (Dublin, CA) with a 15 cm × 75 μm PepMap C18 (LC Packings, Dionex, San Francisco, CA) nanoflow column was used for the analyses. Mobile phases containing solvent A [0.1% acetic acid and 99.9% water (v/v)] and solvent B [0.1% acetic acid and 99.9% acetonitrile (v/v)] were at a constant flow rate of 250 nL/min. Five microliters of peptide mixture in 4.8% acetonitrile, 95.1% water and 0.1% acetic acid was automatically loaded onto the IntegraFrit™ sample trap (2.5 cm × 75 μm i.d.) (New Objective, Woburn, MA, USA) for sample concentration and desalting, at a flow rate of 1.5 μL/min in a loading solvent of 0.1% (v/v) acetic acid and 5% (v/v) acetonitrile in 94.9% (v/v) water. Separations were performed on the C18 column and equilibrated for 5 min at 4.8% solvent B, followed by 90-min gradient to 40% solvent B. Solvent B was then held at 40% for 5 min, increasing up to 90% for the next 5 min and finally at 4.8% within 10 min. LC–ESI-MS/MS analysis was performed using a hybrid linear ion trap-Fourier transform ion cyclotron resonance (FT-ICR, 7-T) mass spectrometer (LTQ-FT, Thermo Fisher, San Jose, CA) equipped with the manufacturer’s nanoelectrospray ionization source and operated with the Xcalibur (version 2.0) and Tune Plus (version 2.2) data acquisition software.
Data-dependent mode of acquisition was utilized in which an accurate m/z survey scan was performed in the FT-ICR cell followed by parallel MS/MS linear ion trap analysis of the top five most intense precursor ions. FT-ICR full-scan mass spectra were acquired at 50,000 mass resolving power (m/z 400) from m/z 350 to 1500 using the automatic gain control mode of ion trapping. Collision-induced dissociation (CID) was performed in the linear ion trap using a 4.0-Th isolation width and 35% normalized collision energy with helium as the collision gas. Singly charged precursors and unassigned charge states were excluded from the precursor selection. Also, the precursor ion that had been selected for CID was dynamically excluded from further MS/MS analysis for 60 s. Bioworks (version 3.3, Thermo) was used to generate peak lists for database search. Mascot (Matrix Science, London, UK; version 2.2) was used to identify peptides by searching the International Protein Index (IPI) human database (version 3.71). Trypsin was selected as the digesting enzyme and one missed cleavage was allowed. Mascot was searched with parent-ion and fragment-ion mass tolerances of 25 ppm and 0.80 Da, respectively. Carbamidomethylation of cysteine (57.0215 Da) was specified as a static modification, whereas oxidation of methionine (15.99492 Da), and dimethylation of N terminus and of lysine (28.0313 Da) were specified as variable modifications.
The ratios of differentially labeled peptides were calculated by manually extracting ion chromatograms (XIC) using the Xcalibur software for each ion pair and determining ratios of the total area under curve of the first three isotopic clusters of the tagged species observed in the MS (FT-ICR) scan.
3. Results and discussion
3.1. Principle of relative quantification by SPAER enrichment technique
Strategies using isotope labeling and MS/MS have been applied for quantitative analysis of the relative abundance of protein [45,46]. However, efficient and highly selective methods are needed for quantitation of low-abundance PTMs such as protein nitration [12,13,17,26]. The recently reported SPAER enrichment strategy relies on first labeling the nitropeptides by reductive methylation with formaldehyde/sodium cyanoborohydride to block all aliphatic amines present in a peptide digest (Fig. 1) before converting nitrotyrosines to aminotyrosines for their selective capture by SPAER on glass beads (Fig. 2). The enriched peptides can easily be released from the solid support by acid-catalyzed hydrolysis at room temperature. Consequently, relative quantitation of these peptides can also be done by LC–MS analyses when isotopic variants of formaldehyde (H12CHO and D13CDO) are used in the first derivatization step. The mass shift of this tagging produces 28 Da shift for N-(CH3)2 or 34 Da shift for the N-(13CHD2)2 tag yielding thereby a mass difference of Δ = 6 Da per labeling site between the isotopically labeled peptides (Fig. 1). Even for triply charged peptides, the m/z of the isotopomers differs by 2-Th, which permits a sufficient resolution for LC–MS-based quantitative analysis [47]. For tryptic peptides terminating with Lys, Δ = 12 Da mass difference will be produced between the light and heavy labeled peptides, because both the N-terminus and the ε-amino groups of Lys are tagged. The number of labels will also increase with each missed cleavage at this residue [22]. Therefore, peptide ions with “n” number of potential sites for labeling will generally have a mass difference of Δ = 6n Da when heavy and light dimethylation are used. The exception is the prolyl (Pro) residue that ends up with only 14 Da/17 Da added, because Pro’s α-amine is secondary allowing only N-monomethylation. The differential N-methylation is useful for binary labeling of amines and, thus, comparison of two sets of samples. Multiplex labeling strategy using isotopic reagents of formaldehyde (H12CHO, D13CDO) and cyanoborohydride (NaBH3CN, NaBD3CN) may be also applied for comparison of up to four samples [35,41].
Fig. 1.
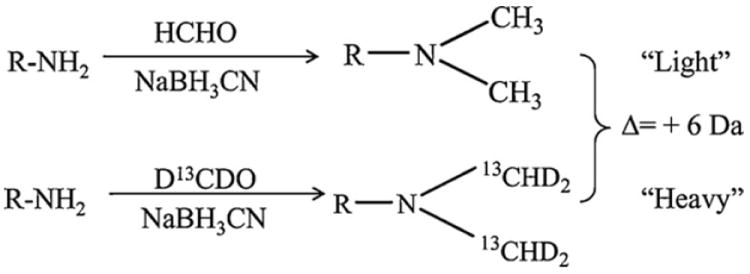
Schematic illustration of isotopic N-dimethyl labeling for relative quantitation of protein nitration. Reductive N-dimethylation of aliphatic amines in a peptide is carried out by using H12CHO or D13CDO and sodium cyanoborohydride. The isotopic mass shift between the light and heavy labeled peptides is Δ = 6 Da.
Fig. 2.
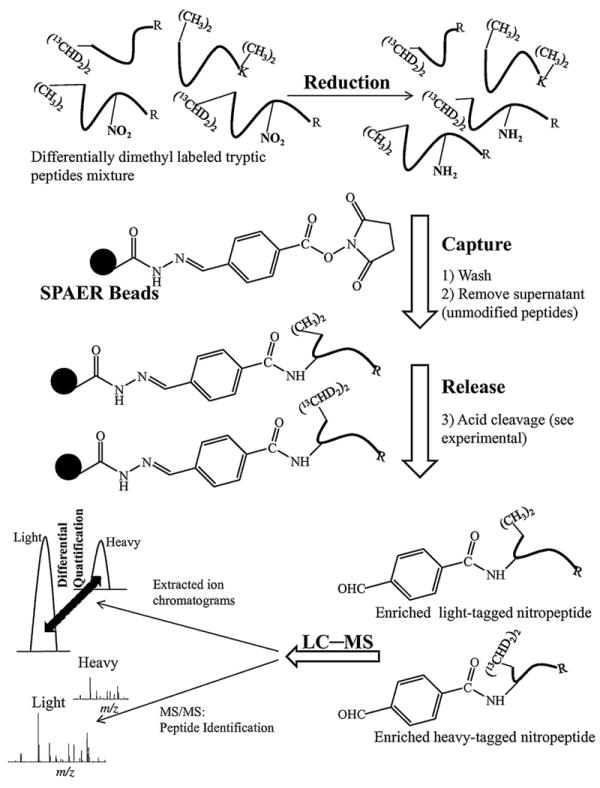
Schematic illustration of the SPAER-based enrichment and relative quantitation of nitropeptides. Reduction of differently N-dimethylated nitropeptides to the corresponding aminopeptides is followed by immobilization via SPAER. The captured species are released upon acid-catalyzed hydrolysis. The relative abundance between light and heavy labeled peptides is determined from the extracted ion chromatograms obtained from LC–MS analyses.
After differential labeling on the aliphatic amines, nitrotyrosines are converted to the corresponding aminotyrosines for their selective capture on SPAER (Fig. 2). Peptides that do not possess free amino group will be washed away. The immobilized peptides are released from the solid support via acid-catalyzed hydrolysis [26] for LC–MS/MS analysis and XICs-based relative quantifications. The SPAER approach has been shown to be simple yet highly specific to enrich nitropeptides by chemoprecipitation involving only two straightforward chemical modifications of the nitropeptides prior to selectively capturing the obtained derivatives [26]. In addition, this method introduces only a small (4-formylbenzoyl) tag to the enriched nitropeptide derivatives after cleavage from SPAER. The 4-formylbenzoyl tagged peptides show fragmentation properties similar to those of parent nitropeptide that permit their unequivocal identification by MS/MS under CID. Moreover, the introduced tag eliminates the electron predator effect of nitro group present in the parent nitropeptide [48], allowing electron capture dissociation (ECD) MS/MS characterization of the enriched nitropeptide derivatives [26]. Therefore, an additional benefit of replacing the nitro-with the 4-formylbenzoylamido-group in the modified peptide is that this conversion will permit ECD and electron transfer dissociation (ETD), complementary activation methods to CID [49,50], for the MS analysis of posttranslational protein nitration [26].
3.2. Relative quantification of isotopically labeled nitropeptides
The differential labeling method was first verified for accuracy and reproducibility. Three synthetic nitropeptides, Y*LQEIYNSNNQK, EGYY*GYTGAFR (identified in nitrated human plasma [26]) and GDY*DLNAVR (found in a nitrated transcription factor [51]) were used as model peptides. They were labeled with light or heavy formaldehyde (H12CHO or D13CDO) with high efficiency (>99%; yield = ≅ area of N-dimethylated nitropeptide/combined area of N-dimethylated nitropeptide and remaining unmodified nitropeptide [26]). The light and heavy N-dimethylated peptides were mixed in various ratios (1:10, 1:3, 1:1, 3:1, and 10:1). This dynamic range should be sufficient for most proteomic analyses [40]. The XICs for [M+2H]2+ ions of light and heavy labeled peptides, #EGYY*EYTGAFR (where # represents N-(CH3)2 or N- (13CHD)2 tag, and *Y represents nitrotyrosine) at m/z 678.79 and m/z 681.81 are shown in Fig. 3A. The XICs from LC–MS analysis of the N-dimethyl-labeled nitropeptides show that the measured light-to-heavy ratios correlate well with the theoretical ratios with r2 of 0.9998 (Fig. 3B). The relative quantification experiments for all three labeled nitropeptides are also highly repeatable with small standard errors (data not shown). The results for relative quantification can be further confirmed by the analysis of full-scan MS spectra of the differentially labeled peptides (Fig. 4). The intensity of light- versus heavy-labeled peptides in the experimental spectra corresponds to their relative abundance.
Fig. 3.
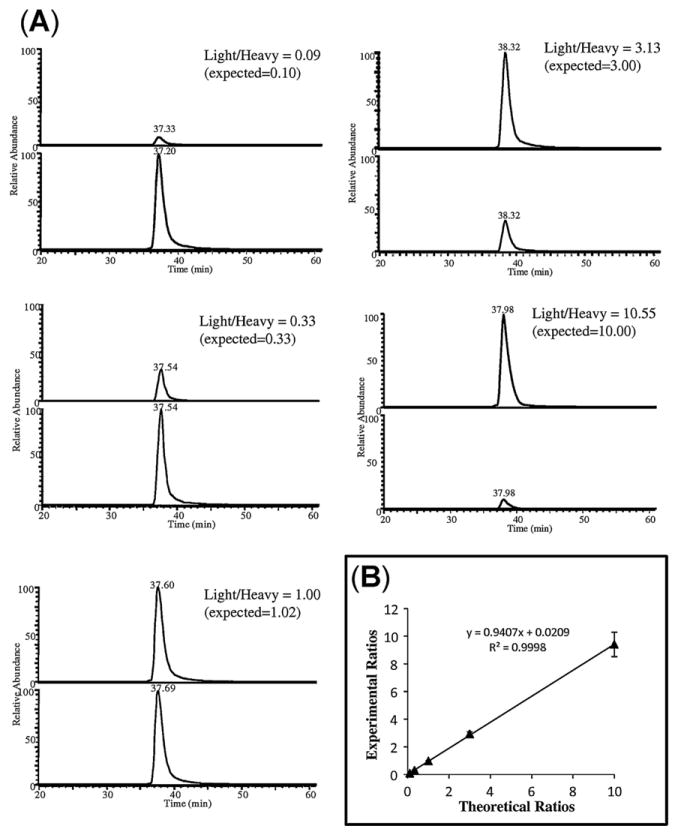
Linearity of relative quantitation for peptide #EGYY*GYTGAFR (where * represents nitrotyrosine, and # denotes either light or heavy N-dimethylation). (A) The differentially labeled peptides were combined in various molar ratios (1:10, 1:3, 1:1, 3:1 and 10:1), and relative quantification of the isotopic pairs was done from the extracted ion chromatograms of [M+2H]2+ at m/z 678.79 (light) and 681.81 (heavy). (B) Linear regression analysis of the quantitation of nitropeptides by LC–MS/MS.
Fig. 4.
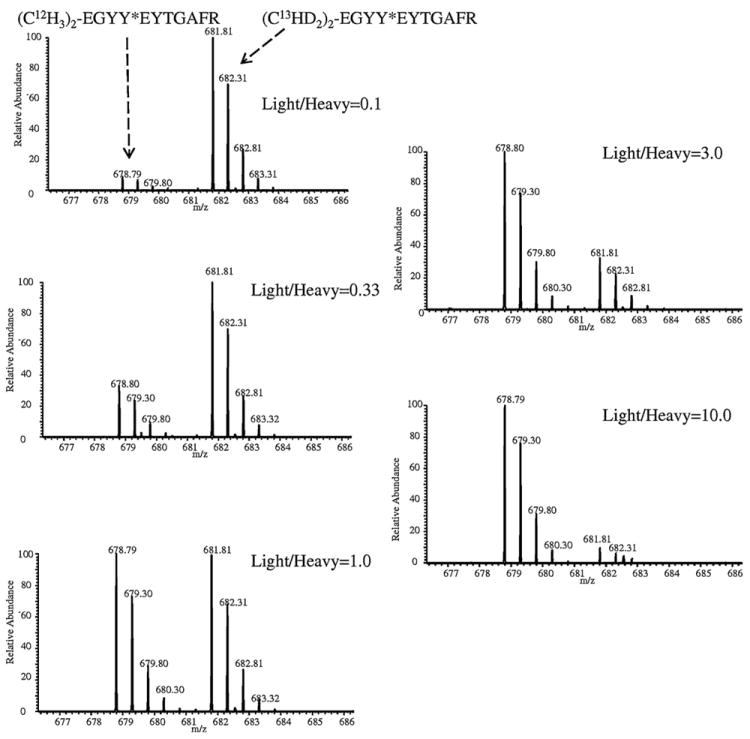
[M+2H]2+ molecular-ion region of the full scan ESI mass spectrum for #EGYY*GYTGAFR differentially labeled with N-dimethylation in various (1:10, 1:3, 1:1, 3:1 and 10:1) molar ratios (* represents nitrotyrosine, and # denotes either light or heavy N-dimethyl label).
3.3. Enrichment and quantification of isotopically labeled nitropeptides
In order to prove that our enrichment procedure maintains the relative ratios of differentially N-dimethyl-labeled nitropeptides, the three model nitropeptides (#Y*LQEIYNSNNQK#, #EGYY*GYTGAFR and #GDY*DLNAVR) with light or heavy dimethyl label were mixed in ratios of 0.33:1, 1:1 and 1:0.33 (light to heavy), respectively, and added into a mixture of the HSA-derived mock biological matrix. Then, nitrotyrosines were converted to the corresponding aminotyrosines via straightforward reduction to selectively capture them by SPAER [26], as described in Section 2. The yield of reduction for peptides #Y*LQEIYNSNNQK#, # EGYY*GYTGAFR and #GDY*DLNAVR were estimated to be 94%, 98% and 91%, respectively. The accuracy of relative quantification using stable isotope N-dimethyl labeling upon SPAER enrichment, based on relative ratios between light and heavy labeled nitropeptides calculated from the corresponding XICs, is summarized in Table 1. The chromatogram and averaged full-scan mass spectrum of HSA digest spiked with three differentially dimethyl-labeled nitropeptides at ratio of 1:1 (light:heavy) are shown in Fig. 5. A remarkable increase in relative intensity of nitropeptides among HSA tryptic peptides was obtained after enrichment of the three spiked nitropeptides as shown in Fig. 6. The high efficiency of SPAER enrichment for nitropeptides after isotope dimethyl labeling was demonstrated by identifying only one carryover peptide (#RHPDYSVVLLLR) originating from HSA tryptic digest after protein database search. This may be due to the improved washing procedure, since we have introduced the method [26].
Table 1.
Theoretical and observed ratios of stable isotope N-dimethyl labeling and enrichment of tagged nitropeptides (observed ratios were calculated from two independent samples and two analytical replicates for each theoretical ratio and peptide).
| Peptides | Ratio (expected 0.33) | Ratio (expected 1.0) | Ratio (expected 3.0) |
|---|---|---|---|
| #Y$LQEIYNSNNQK# | 0.34 | 0.90 | 3.03 |
| #EGYY$GYTGAFR | 0.31 | 0.97 | 3.11 |
| #GDY$DLNAVR | 0.25 | 0.95 | 3.31 |
| Average ratio | 0.30 ± 0.03 | 0.94 ± 0.02 | 3.15 ± 0.08 |
denotes light or heavy N-dimethylation.
denotes 4-Formylbenzoyl (C8H5N1O2) tag.
Fig. 5.
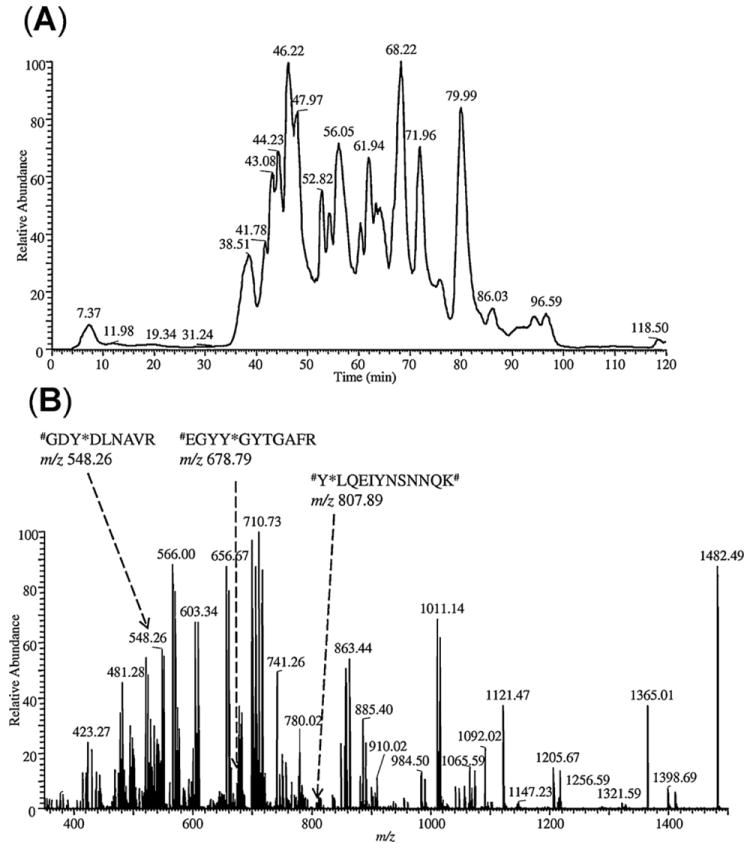
LC–ESI-MS analysis of HSA tryptic digest spiked with 1:1 ratio of differentially dimethyl-labeled nitropeptides (#Y*LQEIYNSNNQK#, #EGYY*GYTGAFR and #GDY*DLNAVR) prior to SPEAR enrichment. (A) Base-peak chromatogram and (B) averaged full-scan mass spectrum from acquisitions in the 0–120-min retention time window. The arrows show ions at m/z 807.89 for #Y*LQEIYNSNNQK#, at m/z 678.79 for #EGYY*GYTGAFR and at m/z 548.26 for #GDY*DLNAVR (* represents nitrotyrosine, and # denotes light or heavy N-dimethylation).
Fig. 6.
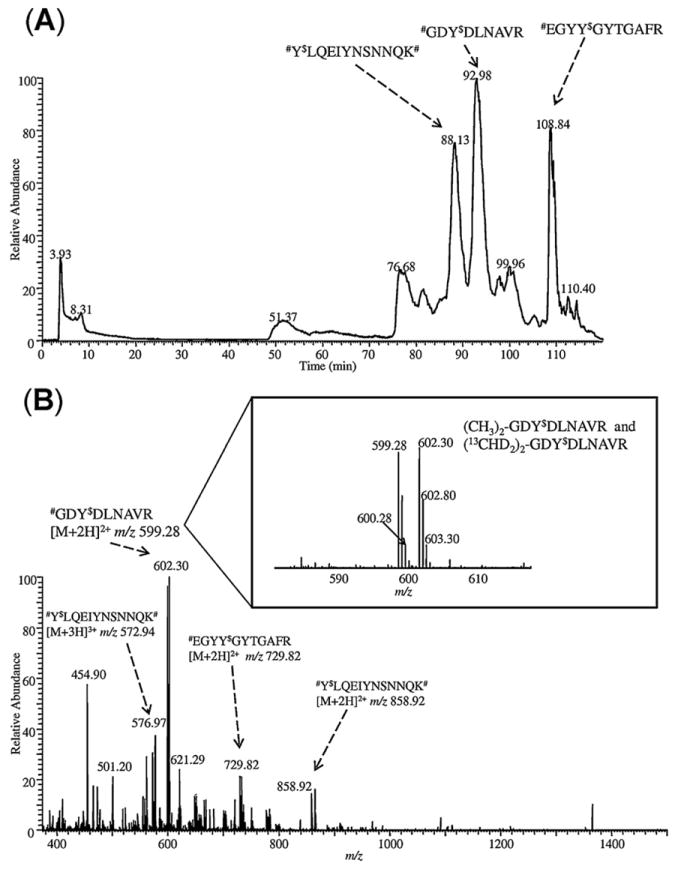
LC–ESI-MS analysis of HSA tryptic digest spiked with 1:1 ratio of differentially dimethyl-labeled nitropeptides (#Y*LQEIYNSNNQK#, #EGYY*GYTGAFR and #GDY*DLNAVR) after SPEAR enrichment. (A) Base-peak chromatogram and (B) averaged full-scan mass spectrum. The expanded view of mass spectrum for ions corresponding to the enriched tagged nitropeptide #GDY$DLNAVR with different isotope labeling (# represents light or heavy N-dimethyl tag) was shown in the inset ($ represents 4-formylbenzoyl tag). The arrows show ions at m/z 572.94 and 858.92 for #Y$LQEIYNSNNQK#, at m/z 729.82 for #EGYY$GYTGAFR and at m/z 599.28 for #GDY$DLNAVR.
The XICs of the enriched nitropeptide #EGYY$GYTGAFR (Fig. 7, # represents light or heavy N-dimethyl tag, and $ denotes 4-formylbenzoyl moiety on tyrosine after enrichment) for the [M+2H]2+ ions at m/z 729.82 (light) and 732.83 (heavy) concord with the expected ratios of 0.33:1, 1:1, 1:0.33 respectively. Moreover, CID-MS/MS spectra of the enriched nitropeptide with light and heavy dimethyl labels (Fig. 7D) indicated that the CID-based fragmentation of the peptides is not affected by the differential dimethylation [26].
Fig. 7.
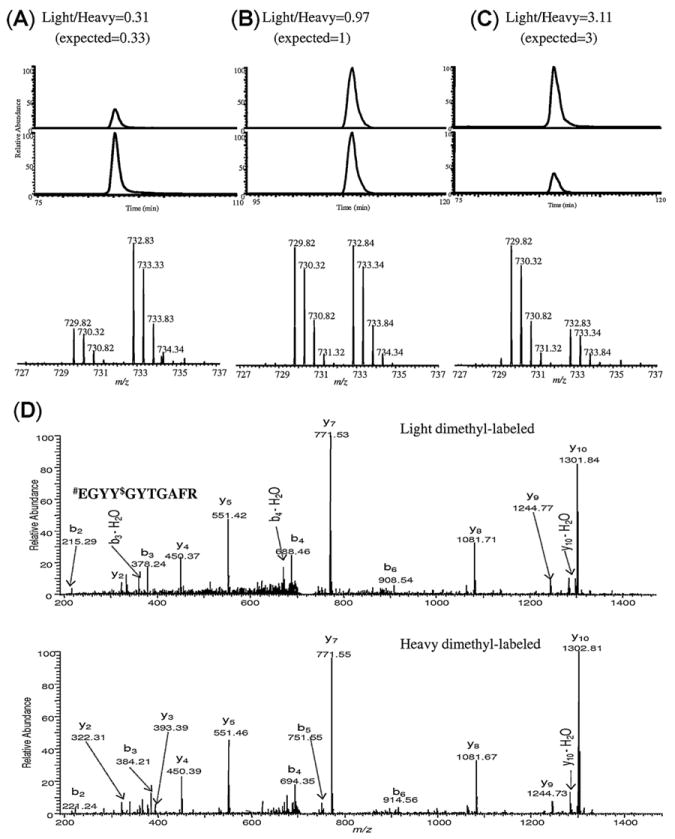
Extracted ion chromatograms and mass spectra of doubly charged precursor ions of #EGYY$GYTGAFR (# represents light or heavy N-dimethyl label and $ indicates 4-formylbenzoyl tag) at m/z 729.82 (light) and m/z 732.84 (heavy) mixed in a theoretical ratio of (A) 0.33:1, (B) 1:1, and (C) 1:0.33 (light to heavy, respectively). The experimental ratios were calculated from the area of extracted ion chromatograms. (D) CID-MS/MS spectra of [M+2H]2+ ions of differentially labeled #EGYY$GYTGAFR after SPAER enrichment.
The relative quantitation by the method presented here was also tested for a nitrated protein (ubiquitin) in human plasma as a matrix (Supplementary Table S1). The nitrotyrosine-containing peptide (TLSDY*NIQK) from the digested nitroubiquitin was enriched and measured at diminishing nitroprotein content (down to as low as 18 pmol/mL). The theoretical 1:1 ratio of light/heavy nitropeptide after SPAER enrichment was reproduced, again, by the measured ratios (1.03 ± 0.09, n = 4), demonstrating the value of the SPEAR approach not only for site-specific recognition of protein nitration [26], but also for the relative quantitation of this PTM.
3.4. Examination of potential isotope effects on chromatographic separation
It has been reported that stable-isotope labeling with deuterium replacing hydrogen may reduce the accuracy of quantification due to chromatographic isotope effects [29]. Deuterium atoms are more hydrophilic than hydrogen atoms, so the chromatographic resolution of light and heavy labeled peptides on the stationary phase may be increased, which could cause different ionization efficiency due to varying matrix interference that results in inaccurate quantification based on XICs. Therefore, it is important for isotopically labeled peptides to elute at essentially identical retention times. With the labeling method used in our approach, the light-labeled #EGYY*GYTGAFR eluted at 37.33 min, while the heavy-labeled isotopomer eluted at 37.20 min even when they were mixed at a ratio of 1:10 (Fig. 3A). As such, the retention time shifts were negligible. No significant differences in retention times between the differentially labeled peptides were detected either (data not shown) for #Y*LQEIYNSNNQK# where both the α- and ε-amino groups were labeled (indicated by #). This may be due to the association of deuterium atoms with hydrophilic amines that diminishes RPLC isotope effects [42].
4. Conclusions
In summary, we have successfully utilized the N-dimethyl labeling component of our recently developed SPAER-based enrichment technique [26] to enable relative quantification of nitropeptides. The simplicity of the method relies on using isotopic variants of formaldehyde (or even those of cyanoborohydride) to not only perform derivatization necessary for the procedure, but also provide relative quantitation without the necessity of employing additional chemical derivatization/tagging. We have also confirmed that heavy-isotope labeling carries no significant chromatographic isotope effects for the tagged nitropeptides. The accuracy and precision of this strategy were revealed through LC–MS analyses of differentially labeled model nitropeptides and a nitroprotein captured from HSA digest and human plasma, respectively. The feasibility of quantitative profiling of modification brought about by tyrosine nitration followed by the SPAER enrichment has also been demonstrated. Accordingly, the technique presented here could be a simple yet effective approach for the identification and exploration of relative changes in the extent of protein nitration.
Supplementary Material
Acknowledgments
This work was supported in part by the National Institutes of Health (grant number AG025384) and the Robert A. Welch Foundation (endowment BK-0031).
Footnotes
Appendix A. Supplementary data
Supplementary data associated with this article can be found, in the online version, at doi:10.1016/j.chroma.2011.12.100.
References
- 1.Pacher P, Beckman JS, Liaudet L. Physiol Rev. 2007;87:315. doi: 10.1152/physrev.00029.2006. [DOI] [PMC free article] [PubMed] [Google Scholar]
- 2.Bakillah A. Clin Chem Lab Med. 2009;47:60. doi: 10.1515/CCLM.2009.017. [DOI] [PubMed] [Google Scholar]
- 3.Aulak KS, Miyagi M, Yan L, West KA, Massillon D, Crabb JW, Stuehr DJ. Proc Natl Acad Sci U S A. 2001;98:12056. doi: 10.1073/pnas.221269198. [DOI] [PMC free article] [PubMed] [Google Scholar]
- 4.Turko IV, Marcondes S, Murad F. Am J Physiol Heart Circ Physiol. 2001;281:H2289. doi: 10.1152/ajpheart.2001.281.6.H2289. [DOI] [PubMed] [Google Scholar]
- 5.Sultana R, Poon HF, Cai J, Pierce WM, Merchant M, Klein JB, Markesbery WR, Butterfield DA. Neurobiol Dis. 2006;22:76. doi: 10.1016/j.nbd.2005.10.004. [DOI] [PubMed] [Google Scholar]
- 6.Butterfield DA, Sultana R. Methods Enzymol. 2008;440:295. doi: 10.1016/S0076-6879(07)00819-1. [DOI] [PubMed] [Google Scholar]
- 7.Zhan X, Desiderio DM. Anal Biochem. 2006;354:279. doi: 10.1016/j.ab.2006.05.024. [DOI] [PubMed] [Google Scholar]
- 8.Radi R. Proc Natl Acad Sci U S A. 2004;101:4003. doi: 10.1073/pnas.0307446101. [DOI] [PMC free article] [PubMed] [Google Scholar]
- 9.Ischiropoulos H. Biochem Biophys Res Commun. 2003;305:776. doi: 10.1016/s0006-291x(03)00814-3. [DOI] [PubMed] [Google Scholar]
- 10.Prokai L. Exp Gerontol. 2009;44:367. doi: 10.1016/j.exger.2009.02.014. [DOI] [PMC free article] [PubMed] [Google Scholar]
- 11.Stevens SM, Jr, Prokai-Tatrai K, Prokai L. Mol Cell Proteomics. 2008;7:2442. doi: 10.1074/mcp.M800065-MCP200. [DOI] [PMC free article] [PubMed] [Google Scholar]
- 12.Duncan MW. Amino Acids. 2003;25:351. doi: 10.1007/s00726-003-0022-z. [DOI] [PubMed] [Google Scholar]
- 13.Tsikas D, Caidahl K, Chromatogr J. B: Anal Technol Biomed Life Sci. 2005;814:1. doi: 10.1016/j.jchromb.2004.10.003. [DOI] [PubMed] [Google Scholar]
- 14.Aulak KS, Koeck T, Crabb JW, Stuehr DJ. Methods Mol Biol. 2004;279:151. doi: 10.1385/1-59259-807-2:151. [DOI] [PubMed] [Google Scholar]
- 15.Bigelow DJ, Qian WJ. Methods Enzymol. 2008;440:191. doi: 10.1016/S0076-6879(07)00811-7. [DOI] [PubMed] [Google Scholar]
- 16.Tsikas D. Amino Acids. 2012;42:45. doi: 10.1007/s00726-010-0604-5. [DOI] [PubMed] [Google Scholar]
- 17.Ryberg H, Caidahl K, Chromatogr J. B: Anal Technol Biomed Life Sci. 2007;851:160. doi: 10.1016/j.jchromb.2007.02.001. [DOI] [PubMed] [Google Scholar]
- 18.Agaton C, Falk R, Hoiden Guthenberg I, Gostring L, Uhlen M, Hober S. J Chromatogr A. 2004;1043:33. doi: 10.1016/j.chroma.2004.06.008. [DOI] [PubMed] [Google Scholar]
- 19.Garbis S, Lubec G, Fountoulakis M. Chromatogr J A. 2005;1077:1. doi: 10.1016/j.chroma.2005.04.059. [DOI] [PubMed] [Google Scholar]
- 20.Reynolds MR, Reyes JF, Fu Y, Bigio EH, Guillozet-Bongaarts AL, Berry RW, Binder LI. J Neurosci. 2006;26:10636. doi: 10.1523/JNEUROSCI.2143-06.2006. [DOI] [PMC free article] [PubMed] [Google Scholar]
- 21.Willard BB, Ruse CI, Keightley JA, Bond M, Kinter M. Anal Chem. 2003;75:2370. doi: 10.1021/ac034033j. [DOI] [PubMed] [Google Scholar]
- 22.Rauniyar N, Prokai L. J Mass Spectrom. 2011;46:976. doi: 10.1002/jms.1978. [DOI] [PMC free article] [PubMed] [Google Scholar]
- 23.Rauniyar N, Prokai-Tatrai K, Prokai L. J Mass Spectrom. 2010;45:398. doi: 10.1002/jms.1725. [DOI] [PubMed] [Google Scholar]
- 24.Rauniyar N, Stevens SM, Prokai-Tatrai K, Prokai L. Anal Chem. 2009;81:782. doi: 10.1021/ac802015m. [DOI] [PMC free article] [PubMed] [Google Scholar]
- 25.Guo J, Prokai-Tatrai K, Ngyuen V, Rauniyar N, Ughy B, Prokai L. J Proteomics. 2011;74:2370. doi: 10.1016/j.jprot.2011.07.009. [DOI] [PMC free article] [PubMed] [Google Scholar]
- 26.Prokai-Tatrai K, Guo J, Prokai L. Mol Cell Proteomics. 2011;10 doi: 10.1074/mcp.M110.002923. M110.002923. [DOI] [PMC free article] [PubMed] [Google Scholar]
- 27.Zhang Q, Qian WJ, Knyushko TV, Clauss TR, Purvine SO, Moore RJ, Sacksteder CA, Chin MH, Smith DJ, Camp DG, 2nd, Bigelow DJ, Smith RD. J Proteome Res. 2007;6:2257. doi: 10.1021/pr0606934. [DOI] [PubMed] [Google Scholar]
- 28.Lee JR, Lee SJ, Kim TW, Kim JK, Park HS, Kim DE, Kim KP, Yeo WS. Anal Chem. 2009;81:6620. doi: 10.1021/ac9005099. [DOI] [PubMed] [Google Scholar]
- 29.Gevaert K, Impens F, Ghesquiere B, Van Damme P, Lambrechts A, Vandekerckhove J. Proteomics. 2008;8:4873. doi: 10.1002/pmic.200800421. [DOI] [PubMed] [Google Scholar]
- 30.Guo J, Prokai L. J Proteomics. 2011;74:2360. doi: 10.1016/j.jprot.2011.07.013. [DOI] [PMC free article] [PubMed] [Google Scholar]
- 31.Wang J, Zhang Y, Xiang F, Zhang Z, Li L. J Chromatogr A. 2010;1217:4463. doi: 10.1016/j.chroma.2010.02.084. [DOI] [PMC free article] [PubMed] [Google Scholar]
- 32.Tsumoto H, Taguchi R, Kohda K. Chem Pharm Bull (Tokyo) 2010;58:488. doi: 10.1248/cpb.58.488. [DOI] [PubMed] [Google Scholar]
- 33.Miller BT, Rogers ME, Smith JS, Kurosky A. Anal Biochem. 1994;219:240. doi: 10.1006/abio.1994.1263. [DOI] [PubMed] [Google Scholar]
- 34.Nuriel T, Deeb RS, Hajjar DP, Gross SS. Methods Enzymol. 2008;441:1. doi: 10.1016/S0076-6879(08)01201-9. [DOI] [PMC free article] [PubMed] [Google Scholar]
- 35.Boersema PJ, Raijmakers R, Lemeer S, Mohammed S, Heck AJ. Nat Protoc. 2009;4:484. doi: 10.1038/nprot.2009.21. [DOI] [PubMed] [Google Scholar]
- 36.Gygi SP, Rist B, Gerber SA, Turecek F, Gelb MH, Aebersold R. Nat Biotechnol. 1999;17:994. doi: 10.1038/13690. [DOI] [PubMed] [Google Scholar]
- 37.Thompson A, Schafer J, Kuhn K, Kienle S, Schwarz J, Schmidt G, Neumann T, Johnstone R, Mohammed AK, Hamon C. Anal Chem. 2003;75:1895. doi: 10.1021/ac0262560. [DOI] [PubMed] [Google Scholar]
- 38.Ross PL, Huang YN, Marchese JN, Williamson B, Parker K, Hattan S, Khainovski N, Pillai S, Dey S, Daniels S, Purkayastha S, Juhasz P, Martin S, Bartlet-Jones M, He F, Jacobson A, Pappin DJ. Mol Cell Proteomics. 2004;3:1154. doi: 10.1074/mcp.M400129-MCP200. [DOI] [PubMed] [Google Scholar]
- 39.Chiappetta G, Corbo C, Palmese A, Galli F, Piroddi M, Marino G, Amoresano A. Proteomics. 2009;9:1524. doi: 10.1002/pmic.200800493. [DOI] [PubMed] [Google Scholar]
- 40.Hsu JL, Huang SY, Chow NH, Chen SH. Anal Chem. 2003;75:6843. doi: 10.1021/ac0348625. [DOI] [PubMed] [Google Scholar]
- 41.Hsu JL, Huang SY, Chen SH. Electrophoresis. 2006;27:3652. doi: 10.1002/elps.200600147. [DOI] [PubMed] [Google Scholar]
- 42.Ji C, Guo N, Li L. J Proteome Res. 2005;4:2099. doi: 10.1021/pr050215d. [DOI] [PubMed] [Google Scholar]
- 43.Yi D, Perkins PD. J Biomol Tech. 2005;16:364. [PMC free article] [PubMed] [Google Scholar]
- 44.Sokolovsky M, Riordan JF, Vallee BL. Biochemistry. 1966;5:3582. doi: 10.1021/bi00875a029. [DOI] [PubMed] [Google Scholar]
- 45.Bantscheff M, Schirle M, Sweetman G, Rick J, Kuster B. Anal Bioanal Chem. 2007;389:1017. doi: 10.1007/s00216-007-1486-6. [DOI] [PubMed] [Google Scholar]
- 46.Ong SE, Mann M. Nat Chem Biol. 2005;1:252. doi: 10.1038/nchembio736. [DOI] [PubMed] [Google Scholar]
- 47.Lill J. Mass Spectrom Rev. 2003;22:182. doi: 10.1002/mas.10048. [DOI] [PubMed] [Google Scholar]
- 48.Jones AW, Mikhailov VA, Iniesta J, Cooper HJ. J Am Soc Mass Spectrom. 2010;21:268. doi: 10.1016/j.jasms.2009.10.011. [DOI] [PubMed] [Google Scholar]
- 49.Guan Z, Yates NA, Bakhtiar R. J Am Soc Mass Spectrom. 2003;14:605. doi: 10.1016/S1044-0305(03)00201-0. [DOI] [PubMed] [Google Scholar]
- 50.Alley WR, Jr, Mechref Y, Novotny MV. Rapid Commun Mass Spectrom. 2009;23:161. doi: 10.1002/rcm.3850. [DOI] [PubMed] [Google Scholar]
- 51.Park SW, Huq MD, Hu X, Wei LN. Mol Cell Proteomics. 2005;4:300. doi: 10.1074/mcp.M400195-MCP200. [DOI] [PubMed] [Google Scholar]
Associated Data
This section collects any data citations, data availability statements, or supplementary materials included in this article.


