

Abstract
It is well established that dietary intake of n-3 fatty acids is associated with anti-inflammatory effects, and this has been linked to modulation of the oxylipin and endocannabinoid metabolomes. However, the amount of data on specific tissue effects is limited, and it is not known how inflammation affects this relation. In the present study we systematically explored the combined effects of n-3 fatty acid diets and inflammation on the in vivo endocannabinoid and oxylipin metabolomes using a multicompartment, detailed targeted lipidomics approach. Male C57BL/6 mice received diets containing 0, 1, or 3 % w/w fish oil (FO) for 6 weeks, after which 2 mg/kg LPS or saline was administered i.p. Levels of endocannabinoids/N-acylethanolamines (NAEs) and oxylipins, covering n-3 and n-6 fatty acid derived compounds, were determined in plasma, liver, ileum and adipose tissue using LC–MS/MS. FO generally increased ‘n-3’ NAEs and oxylipins at the expense of compounds derived from other fatty acids, affecting all branches of the oxylipin metabolome. LPS generally increased levels of endocannabinoids/NAEs and oxylipins, with opposing effects across plasma and tissues. Multivariate data analysis revealed that separation between diet groups in the saline treated groups was primarily explained by decreases in other than n-3 derived compounds. In the LPS treated groups, the separation was primarily explained by increases in n-3 derived compounds. In conclusion, FO caused marked changes in the n-3 to n-6 balance of the endocannabinoid and oxylipin metabolomes, with specific effects depending on inflammatory status.
Electronic supplementary material
The online version of this article (doi:10.1007/s11306-012-0421-9) contains supplementary material, which is available to authorized users.
Keywords: Endocannabinoids, Oxylipins, Fish oil, Inflammation, Lipidomics, Multivariate data analysis
Introduction
Dietary intake of long-chain n-3 polyunsaturated fatty acids (PUFAs), like docosahexaenoic acid (DHA; 22:6 n-3) and eicosapentaenoic acid (EPA; 20:5 n-3), is known to have beneficial health effects in both humans and animals, which are partly explained by a reduction of inflammatory processes (Calder 2006, 2009a; Carpentier et al. 2006; Schmitz and Ecker 2008). The mechanisms behind this are not completely understood, but involve binding of n-3 PUFAs to GPR120 (Oh et al. 2010), their conversion to resolvins (Serhan et al. 2004), and the alteration of the eicosanoid balance (Calder 2009a). Increased dietary intake of n-3 PUFAs leads to enhanced incorporation of DHA and EPA in cell membranes, at the expense of incorporation of the n-6 PUFA arachidonic acid (ARA; 20:4 n-6). This results in decreased synthesis of ARA-derived eicosanoids, for example PGE2, after e.g. an inflammatory stimulus (Calder 2009b). At the same time, increased levels of n-3 fatty acid derived eicosanoids are observed. These n-3 fatty acid derived metabolites are often referred to as ‘3-series’ or ‘5-series’ oxylipins, comprising structures like prostaglandin D3 (PGD3), PGE3, thromboxane B3 (TBXB3), and 5-hydroxyeicosapentaenoic acid (5-HEPE), or leukotriene B5 (LTB5), respectively (see Fig. 1 for an overview of oxylipins and their origin). These compounds are in general also pro-inflammatory, but considered less potent than the ARA-derived metabolites under certain circumstances, thereby contributing to a reduction of the general inflammatory status and specific inflammatory processes associated with fish oil (FO) consumption (Calder 2006, 2009a; Schmitz and Ecker 2008).
Fig. 1.
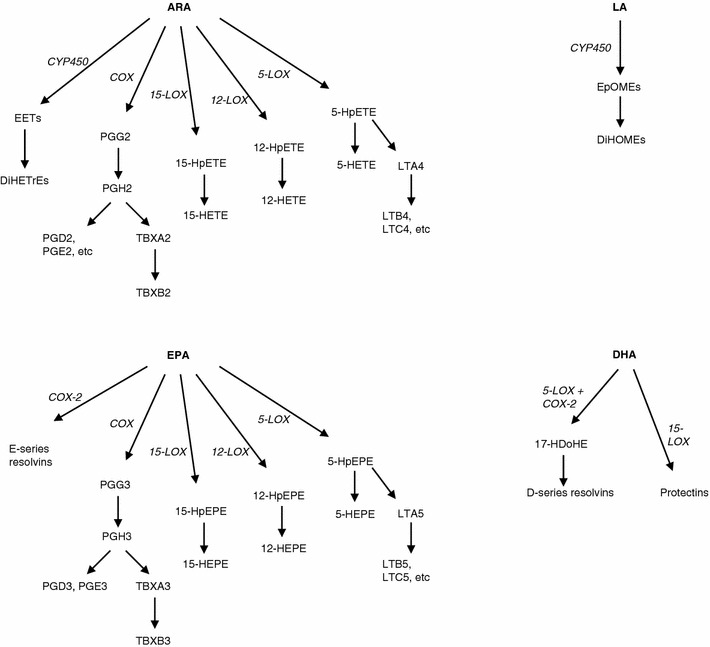
Overview of several enzymatic pathways involved in oxylipin synthesis, which are under investigation in the present paper. ARA, LA, EPA and DHA can serve as substrates, yielding distinct oxylipins and intermediates
Over the last decades, several endocannabinoids and related N-acyl ethanolamines (NAEs) have emerged as important regulators of metabolism and inflammation (De Petrocellis et al. 2000; Di Marzo 2008; Matias et al. 2006; O’Sullivan 2007). Like the oxylipins, these compounds are also derived from fatty acids following incorporation in cell membranes (Bisogno 2008; Ueda et al. 2010). Arachidonoyl ethanolamide (anandamide, AEA) and 2-arachidonoyl glycerol (2-AG) are two endocannabinoids which are derived from ARA, but combinations derived with other fatty acids also exist, such as palmitoyl ethanolamide (PEA) and the n-3 fatty acid derived NAEs docosahexaenoyl ethanolamide (DHEA), eicosapentaenoyl ethanolamide (EPEA). Both AEA and PEA are known for their anti-inflammatory properties (Cencioni et al. 2010; Re et al. 2007).
Several in vitro and animal studies have demonstrated a link between availability of specific fatty acids in the diet and the presence of endocannabinoids and related NAEs. Berger and coworkers reported enhanced levels of anandamide and 2-AG in piglet brain after feeding milk supplemented with ARA, with a diet rich in DHA showing even higher levels of its NAE metabolite, DHEA (Berger et al. 2001). Wood and coworkers showed that a two-week diet rich in DHA elevated plasma and brain levels of DHEA in mice, while decreasing plasma 2-AG (Wood et al. 2010). Artmann and coworkers demonstrated that feeding rats a FO diet, by nature rich in n-3 PUFAs, decreased jejunal levels of AEA and PEA, but increased the levels of n-3 NAEs DHEA and EPEA (Artmann et al. 2008). Fish oil also decreased adipose tissue levels of AEA and 2-AG in a rat model of obesity (Batetta et al. 2009). It thus seems that the profile of NAEs represents the relative abundance of fatty acids in the diet. Recently, is was shown that DHEA and EPEA display anti-inflammatory properties in macrophages and adipocytes (Balvers et al. 2010; Meijerink et al. 2011), indicating that these compounds might be involved in the anti-inflammatory effects which are related to dietary n-3 PUFA intake.
In addition to diet, inflammation is known to affect the synthesis and/or release of both oxylipins and NAEs (Maccarrone et al. 2001), but it is not known how inflammation itself affects e.g. DHEA and EPEA tissue levels in vivo. Moreover, it is not known if changes induced by dietary fatty acids also persist under inflammatory conditions, or if the effect of diet is different under inflammatory conditions.
In the present study, we systematically explored in detail the (combined) effect of dietary FO and inflammation on levels of endocannabinoids/NAEs and oxylipins in plasma, liver, ileum and adipose tissue of wild type C57BL/6 mice using a targeted lipidomic approach. In total, levels on 61 compounds were analyzed, including levels of PGE3, PGD3, TBX-B3, 5-HEPE, resolvin D1, DHEA and EPEA. Both univariate and multivariate data analysis tools were used to assess differences in metabolite patterns between the intervention groups. Our data show in detail that dietary intake of FO shifted the n-3 to n-6 balance in the endocannabinoid and oxylipin metabolomes in all tissues examined. In addition, the direction of this shift appeared to be affected by inflammation, and was different between the examined tissues.
Materials and methods
Chemicals and reagents
Lipopolysaccharide (0111: B4; LPS), indomethacin, paraoxon and butylated hydroxytoluene (BHT) were from Sigma (Steinheim, Germany). Phenylmethylsulfonyl fluoride (PMSF) was from Fluka (Steinheim, Germany). 12-[(tricyclo[3.3.1.13,7]dec-1-ylamino)carbonyl]amino]-dodecanoic acid (AUDA) and URB602 was purchased from Cayman (Ann Arbor, MI, USA). Milli-Q water (Milli-Q Advantage unit, Millipore, Amsterdam, The Netherlands) was used in all analyses. ULC-grade acetonitrile (ACN), formic acid (FA) and trifluoro acetic acid (TFA) were obtained from Biosolve (Valkenswaard, The Netherlands). LC–MS grade methanol was from Riedel-de-Häen (Steinheim, Germany). Isopropanol and ethanol were from JT Baker (Deventer, The Netherlands). All analytical and internal standards, except EPEA, were purchased from Cayman. EPEA was synthesized as described earlier (Plastina et al. 2009a). For oxylipins, stock solutions were prepared in ethanol, aliquoted and stored at −80 °C until analysis. For endocannabinoids/NAEs, stocks were prepared in ACN, aliquoted and stored at −80 °C until analysis. C8 SPE columns (Bond Elut; 200 mg, 3 mL) were from Varian Inc. (Lake Forest, CA, USA). HLB SPE columns (Oasis, 60 mg, 3 mL) were from Waters (Etten-Leur, The Netherlands). ELISA kits were from R&D Systems (Minneapolis, MN, USA).
Animal experiment
Wild type male C57BL/6 mice were obtained from Harlan (Horst, The Netherlands) and housed two or three per cage in a temperature controlled environment with a 12 h light–dark cycle (light at 6.00–18.00). The mice, 4 weeks old at arrival, had free access to a standard run-in diet (AIN93-M, with a 4 % w/w fat content whereof 1 % soy bean oil and 3 % high-oleic acid sunflower oil (HOSF)) for 2 weeks. At the age of 6 weeks the mice were divided into three groups of 16 mice; group 1 was kept on the standard diet (control diet), group 2 received a diet containing AIN93-M with 1 % fish oil (1 % FO diet) (Marinol®), 2 % HOSF, and 1 % soy bean oil. The third group had access to a diet containing AIN93-M with 1 % soy bean oil and 3 % fish oil (3 % FO diet). The diets and water were available ad libitum. Diets were prepared by Research Diet Services (Wijk bij Duurstede, The Netherlands) and the Marinol® was a kind gift from Lipid Nutrition (Wormerveer, The Netherlands). Diets were stored in air-tight bags at −20 °C until just before feeding, and fresh food was provided two times per week to minimize oxidation of the fatty acids in the diet. GC–MS based analysis of the diets confirmed that the correct amounts of DHA and EPA were present, and re-analysis after 4 weeks revealed that its amounts were stable under the described conditions (data not shown). Food consumption and animal weight were measured two times per week, revealing no differences between the diet groups.
The diets were continued for 6 weeks, after which the animals received either i.p. saline (eight mice per diet group) or 2 mg/kg LPS (eight mice per diet group). After 24 h, the animals were anesthetized, blood was collected from the orbital sinus and captured in 1.3 mL EDTA coated tubes (Sarstedt; Etten-Leur, The Netherlands) and put on ice until centrifugation (10′, 10,000 rpm at 4 °C). After centrifugation, plasma was aliquoted. For oxylipin analysis, 200 μL plasma was stored in 1 mL methanol containing paraoxon, BHT, AUDA, indomethacin, and PMSF to prevent oxylipin oxidation and breakdown. For endocannabinoid/NAE analysis, 100 μL plasma was stored in the presence of PMSF and URB602. Subsequently, the animals were sacrificed by cervical dislocation after which liver, ileum and adipose tissue were collected and immediately snap-frozen in liquid nitrogen. All plasma and tissue samples were stored at −80 °C until further analysis. Analysis of plasma IL-6 and MCP-1 levels confirmed that LPS had triggered an inflammatory response by showing strongly increased IL-6 and MCP-1 levels in LPS-treated mice (data not shown).
The study was conducted according to the Netherlands Law on Animal Experiments, and approved by the local Animal Experiments Committee of Wageningen University.
Extraction of endocannabinoids/NAEs from plasma
Plasma (100 μL) was thawed and 400 μL extraction mixture containing 100 μM PMSF and internal standards (AEA-d8, 2-AG-d8 and OEA-d4) in ACN was added while the sample was gently vortexed. After subsequent centrifugation (5 min at 13,000 rpm and RT), the supernatant was transferred to a clean Eppendorf tube and evaporated to dryness in a vacuum concentrator (Scanvac; Lynge, Denmark). The dried extracts were reconstituted in 100 μL ACN containing 0.1 % TFA and used for LC–MS/MS analysis.
Extraction of endocannabinoids/NAEs from tissues
Endocannabinoid/NAE were extracted from freeze–dried liver and ileum using a method adapted from a previously published protocol for plasma (Balvers et al. 2009). Approximately 50 mg freeze–dried liver or 10 mg freeze–dried ileum were extracted by adding 1 mL extraction mixture (ACN) and sonication. The samples were centrifuged (5 min at 14,000 rpm), the supernatant was transferred to a clean 15 mL tube, and this was repeated once. The pooled ACN fractions were diluted with MQ water containing 0.13 % TFA until the final ACN concentration was 20 % prior to SPE clean-up as described before (Balvers et al. 2009). In short, columns were washed with 20 % v/v ACN in MQ water containing 0.1 % TFA, eluted with 80 % v/v ACN in MQ water containing 0.1 % TFA and evaporated to dryness using vacuum centrifugation. The dried extracts were reconstituted in 100 μL ACN containing 0.1 % TFA and used for LC–MS/MS analysis.
For adipose tissue, approximately 100 mg ‘wet’ tissue was extracted with 1 mL extraction solution (ACN) by sonication. The samples were centrifuged for 5 min at 14,000 rpm and RT, the supernatant was transferred to a clean 2.0 mL Eppendorf tube, and the ACN extraction was repeated once. The 2 mL ACN extract was subsequently evaporated to dryness, reconstituted in 100 μL ACN containing 0.1 % TFA and used for LC–MS/MS analysis.
LC–MS/MS analysis of endocannabinoids/NAEs
Two LC–MS/MS systems were used for endocannabinoid/NAE analysis. Plasma extracts were analyzed by UPLC coupled to a Xevo TQ-S mass spectrometer (Waters; Etten-Leur, The Netherlands) because high sensitivity was essential for adequate quantification in extracts obtained from 100 μL plasma samples. Liver, ileum and adipose tissue were analyzed on a Surveyor HPLC coupled to a TSQ Quantum Discovery mass spectrometer (Thermo Finnigan; Breda, The Netherlands).
For the UPLC-Xevo system, 3 μL plasma extract was injected on a Acquity C8 BEH UPLC column (2.1 × 100 mm, 1.7 μm) and was separated using gradient elution with a stable flow of 500 μL/min. The gradient started with 100 % A (40:40:20 v/v/v of MQ water:methanol:ACN with 0.1 % FA) which was maintained until 0.35 min, followed by a linear increase to 100 % B (7:3 v/v methanol:ACN with 0.1 % FA) which was achieved at 7.0 min and was maintained until 9.0 min. Finally, the column equilibrated for 3 min at 100 % A. The column was maintained at 60 °C during analysis, and the samples were kept at 10 °C. The MS was operating in selective reaction mode using electrospray ionization in positive ion mode, with a capillary voltage of 1.5 kV, a source temperature of 150 °C and a desolvation temperature of 500 °C. Cone voltage and collision energy were optimized for each compound individually (see supplemental data S-1 for parent and product m/z values). Peak identification and quantification was performed using MassLynx software version 4.1. Calibration curves were run in duplicate from which one regression equation was generated.
For the analysis of liver, ileum and adipose tissue, a TSQ Quantum Discovery was used as described before (Balvers et al. 2009). Five microliters extract was separated on an Xterra C8 MS column (2.1 × 150 mm, 3.5 μm) using gradient elution with a constant flow of 150 μL/min. The same solutions were used as in the Xevo system, but now 1 g/L ammonium acetate was added (the most dominant parent for 2-AG in this MS is the ammonium adduct). The gradient started with 100 % A which was maintained until 2.0 min, followed by a linear increase to 100 % B which was achieved at 8.00 min and maintained until 16.0 min, and the column was left to equilibrate for 5 min at 100 % A. The column was maintained at 40 °C during analysis and the samples were cooled at 4 °C. The MS was operating in selective reaction mode using electrospray ionization in positive ion mode, with a capillary voltage of 4.5 kV and a capillary temperature of 350 °C. Cone voltage and collision energy were optimized for each compound individually. Peak identification and quantification was performed using LCquan software version 2.5.5. Calibration curves were run in duplicate from which one regression equation was generated. Quality control samples were included in each analytical run to check the quality of the analysis and to correct for accuracy.
Extraction of oxylipins from plasma
Internal standards were added to the plasma samples which were already precipitated with methanol (see section ‘2.2’), and the samples were put on ice for 30 min. Samples were subsequently centrifuged (5 min at 3,000×g and 4 °C) and the supernatant was transferred to a glass tube. Just before loading on activated HLB columns, 4.75 mL MQ water containing 0.1 % v/v FA was added to the methanol extract, diluting the extract to 20 % methanol. After loading, the columns were washed with 2 mL 20 % methanol in MQ water containing 0.1 % FA, and the columns were allowed to dry for 15 min. The SPE columns were eluted with 2 mL methanol and the samples were captured in tubes already containing 20 μL of 10 % glycerol and 500 μM BHT in ethanol. The tubes were placed in a water bath at 40 °C and the methanol was evaporated under a gentle stream of nitrogen, after which the samples were reconstituted in 100 μL ethanol containing another internal standard (CUDA) and immediately used for LC–MS/MS analysis.
Extraction of oxylipins from tissues
The extraction of oxylipins from liver, ileum and adipose tissue was similar to plasma oxylipin extraction. Approximately 100 mg liver and adipose tissue, and 50 mg ileum was extracted with 1 mL methanol containing internal standards and sonication. After centrifugation (5 min at 3,000×g and 4 °C), the supernatants were transferred to clean tubes and the methanol extraction was repeated once. Just before loading on HLB SPE columns, 8 mL MQ water containing 0.1 % FA was added to the methanol extracts. For the SPE procedure and further, (see section ‘2.6’) Extraction of oxylipins from plasma’.
LC–MS/MS analysis of oxylipins
All oxylipin analyses were performed on a UPLC coupled to a Xevo TQ-S mass spectrometer (Waters). Five microliters extract was injected on a Acquity C18 BEH UPLC column (2.1 × 100 mm, 1.7 μm) and was separated using gradient elution with a stable flow of 600 μL/min. The gradient started with 95 % A (MQ water with 0.1 % FA) and 5 % B (ACN with 0.1 % FA) followed by a linear increase to 70 % A and 30 % B which was achieved at 5.0 min. This was followed by a linear increase towards 50 % B which was achieved at 11.25 min and maintained until 13.25 min. The system was subsequently switched to 100 % B, which was achieved at 15.75 min and maintained until 16.75 min, after which the column was left to equilibrate at 5 % B for approximately 3 min. The column was maintained at 50 °C during analysis, and the samples were kept at 10 °C. The MS was operating in selective reaction mode using electrospray ionization in negative ion mode, with a capillary voltage of 3.3 kV, a source temperature of 150 °C and a desolvation temperature of 600 °C. Cone voltage and collision energy were optimized for each compound individually (see supplemental data S-1 for parent and product m/z values). Peak identification and quantification was performed using MassLynx software version 4.1. Calibration curves were run in duplicate from which one regression equation was generated. During data analysis, five peaks of unknown identity were found to be influenced by diet or LPS treatment, and these compounds are listed UK1–UK5. These peaks were visible in the transitions m/z 295.2 > 195.2 and m/z 295.2 > 171.1. ARA, DHA and EPA were also determined using this method. Quality control samples were included in each analytical run to check the quality of the analysis and to correct for accuracy.
Data analysis
Univariate analysis was performed with SAS version 9.1 (2002–2003 by SAS Institute Inc., Cary, NC, USA). ANOVA assumptions were checked for each variable. If these assumptions were not met, rank transformation was applied for that particular variable. Partial tests were performed using Tukey–Kramer multiple comparison correction. Benjamini and Hochberg false discovery rate correction (q = 5 %) was applied to correct for false positives (Benjamini and Hochberg 1995). In all statistical tests that were performed, the null hypothesis (no effect) was rejected at the 0.05 level of probability (α = 5 %).
The added value of multivariate data analysis in addition to univariate statistics is that correlations between variables are taken into account, and thus also allows to reveal combinations of variables which are associated with differences between treatment groups. Multivariate data analysis summarizes all the variables into one variable by means of a linear combination, now called the ‘principal component’ (PC), which adds higher weights to variables that account for the highest level of variance in the original data. Using principal component analysis (PCA), we screened for group separation, outliers, (undesired) patterns and this was further analyzed with principal component discriminant analysis (PCDA). PCDA includes the original group designation of the animals in the model and is therefore called a supervised classification technique. PCA and PCDA were performed in the Matlab environment (R2008b, 1984–2008, The Mathworks Inc., Natick, MA, USA) using the PLS toolbox for Matlab version 5.0.3 (r 6466, 1995–2008, Eigenvector Research Inc., Wenatchee, WA, USA). PCA and PCDA are described in more detail elsewhere (Hoogerbrugge et al. 1983; Joliffe 1986). For all multivariate models data were autoscaled to mean zero and variance 1 for each variable. For PCDA, stability of the model was evaluated by 10-fold cross-validation, revealing correct classification rates of typically 80–100 %. PCA and PCDA were performed on the combined data (‘fused data’), containing data on both endocannabinoids/NAEs and oxylipins from plasma, liver ileum and adipose tissue combined in one data set.
Results
FO diet and inflammation alter the endocannabinoid/NAE balance
To investigate the effect of dietary n-3 fatty acids and inflammation on endocannabinoid/NAE and oxylipin levels, wild-type male C57BL/6 mice received a diet containing either no, 1 or 3 % w/w FO followed by either saline or 2 mg/kg LPS i.p. injection. Endocannabinoid/NAE levels were determined in plasma, liver, ileum and adipose tissue.
Detailed (quantitative) effects of dietary administration of fish-oil and administering LPS after 6 weeks compared to their relevant control treatments are provided in the supplemental data (S2-7), including some representative chromatograms (S-8). Significant differences between diet groups and LPS treatment were obtained with the ANOVA test and are summarized in Tables 1, 2 for endocannabinoids/NAEs and Tables 3, 4 for oxylipins. A diet effect is here defined as an effect of the diet which (in magnitude and direction) was the same for saline and LPS-treated mice. The term LPS effect refers to situations in which LPS induced a change in a concentration of a compound, which was similar for all diet groups. An interaction effect indicates that only certain (combinations of) diets with saline or LPS resulted in significant differences, and therefore separate comparisons (‘partial tests’) should be interpreted rather than main effects. Table 1 shows diet effects on NAEs/endocannabinoids, and 2 LPS effects. Compounds with an interaction effect are highlighted with * in the tables, with further details provided in the supplemental data (S-5).
Table 1.
Effect of the fish oil diets on endocannabinoid/NAE levels in plasma, liver, ileum and adipose tissue (diet effect)
| Plasma | Liver | Ileum | Adi. tiss. | |||
|---|---|---|---|---|---|---|
| Ctrl vs 1 % FO | n-3 derived | EPEA | 2.51 | * | 24.159 | 43.096 |
| DHEA | 1.915 | 2.908 | 2.123 | 3.241 | ||
| Other | AEA | * | 0.312 | 0.374 | 0.350 | |
| 2-AG | 0.403 | 0.216 | 0.304 | 0.465 | ||
| DGLEA | 0.282 | – | 0.650 | 0.562 | ||
| OEA | 0.710 | 0.777 | – | * | ||
| Ctrl vs 3 % FO | n-3 derived | EPEA | 3.688 | * | 67.069 | 116.975 |
| DHEA | 2.166 | 4.691 | 2.774 | 5.484 | ||
| Other | AEA | * | – | 0.811 | 0.423 | |
| 2-AG | 0.301 | 0.156 | 0.272 | 0.607 | ||
| DGLEA | 0.250 | – | ↓ | 0.578 | ||
| OEA | 0.522 | 0.663 | – | * | ||
| SEA | 0.692 | – | – | 1.574 | ||
| 1 % FO vs 3 % FO | n-3 derived | EPEA | – | * | 2.776 | 2.714 |
| DHEA | – | 1.613 | 1.306 | 1.692 | ||
| Other | 2-AG | – | 0.724 | – | 1.304 | |
| OEA | 0.735 | – | – | * | ||
| SEA | 0.700 | – | – | 1.284 | ||
Only statistically significant effects are listed, presented as fold-control values, calculated by comparing mean metabolite concentration from one diet to another. Means were calculated from saline and LPS treated animals together per diet group. ↑ or ↓ were used when the fold-control value would disagree with the outcome outcome of the ANOVA in cases of variables which were rank-transformed
ND the compound was not detected in the particular matrix, and – indicates that no statistical significant differences were observed
* Interaction effect (see supplemental data for details)
Table 2.
Effect of LPS on endocannabinoid/NAE levels in plasma, liver, ileum and adipose tissue (LPS effect)
| Plasma | Liver | Ileum | Adi. tiss. | |||
|---|---|---|---|---|---|---|
| Saline vs LPS | n-3 derived | EPEA | 2.019 | * | – | 1.766 |
| DHEA | 2.101 | 4.130 | 1.338 | 1.584 | ||
| Other | AEA | * | 3.375 | 1.274 | – | |
| 2-AG | 0.651 | – | – | 1.366 | ||
| DGLEA | 1.961 | 1.611 | ↑ | – | ||
| PEA | * | 0.743 | 1.406 | * | ||
| OEA | 3.097 | 2.276 | 1.260 | * | ||
| SEA | 2.073 | 0.540 | 1.676 | 0.711 | ||
Only statistically significant effects are listed, presented as fold-control values, calculated by comparing mean metabolite concentration from the saline to the LPS treated groups. Means were calculated from the different diet groups together for the saline and LPS treated animals. ↑ or ↓ were used when the fold-control value would disagree with the outcome outcome of the ANOVA in cases of variables which were rank-transformed
ND the compound was not detected in the particular matrix, and – no statistical significant differences were observed
* Interaction effect (see supplemental data for details)
Table 3.
Effect of the fish oil diets on oxylipin levels in plasma, liver, ileum and adipose tissue (diet effect)
| Plasma | Liver | Ileum | Adi. tiss. | |
|---|---|---|---|---|
| Ctrl vs 1% FO | ||||
| Fatty acids | ||||
| ARA | * | 0.326 | – | 0.520 |
| DHA | 1.931 | – | 2.128 | – |
| EPA | * | 13.93 | 24.182 | 29.425 |
| n-3 derived oxylipins | ||||
| 5-HEPE | 4.358 | 7.474 | 9.459 | 34.105 |
| 12-HEPE | * | 4.753 | 19.379 | 24.735 |
| PGD3 | ND | ND | 18.828 | 3.937 |
| PGE3 | – | ND | 15.534 | 12.614 |
| 17-HDoHE | – | – | 3.014 | 2.694 |
| 10-17-DiHDoHE | ND | ND | 2.566 | 3.352 |
| 19,20-DiHoPE | 3.040 | 1.534 | 2.381 | 4.447 |
| TBXB3 | * | ND | 20.657 | 4.809 |
| n-6 oxylipins | ||||
| 5,6 EET | – | 0.163 | – | – |
| 11,12 EET | – | 0.293 | 0.495 | 0.484 |
| 14,15 EET | 0.492 | 0.319 | 0.476 | 0.497 |
| LTB4 | ND | 3.356 | 0.470 | * |
| LTD4 | ND | ND | 0.184 | – |
| 5,6-DiHETrE | – | 0.215 | 0.392 | 0.383 |
| 8,9-DiHETrE | 0.314 | 0.213 | 0.378 | * |
| 11,12-DiHETrE | 0.280 | 0.249 | 0.419 | 0.378 |
| 14,15-DiHETrE | 0.327 | 0.251 | 0.404 | * |
| PGE2 | – | 0.205 | – | – |
| PGF2α | – | 0.234 | – | – |
| 8-iso-PGF2α | – | – | – | 0.629 |
| 13,14-dihydro-15-keto-PGD2 | ND | ND | 0.292 | ND |
| 13,14-dihydro-15-keto-PGE2 | ↓ | 0.373 | 0.242 | 0.198 |
| 13,14-dihydro-15-keto-PGF2α | ND | 0.432 | 0.255 | 0.473 |
| 12-HHTrE | – | 0.107 | – | 0.298 |
| 5-HETE | 0.416 | 0.410 | – | 0.632 |
| 11-HETE | – | 0.233 | – | 0.417 |
| 12-HETE | – | 0.150 | – | – |
| 15-HETE | – | 0.211 | – | 0.252 |
| 20-HETE | ND | 0.419 | – | ND |
| TBXB2 | – | 0.209 | – | – |
| 13-HODE | – | 0.570 | – | – |
| 9,10,13-TriHOME | – | * | – | 0.686 |
| Ctrl vs 3% FO | ||||
| Fatty acids | ||||
| ARA | * | 0.302 | – | – |
| DHA | 1.642 | – | 2.828 | – |
| EPA | * | 19.597 | 37.806 | 54.972 |
| 17 keto- 4(z), 7(z), 10(z), 13 (z), 15 (E), 19(z)-DHA | ND | – | 2.830 | * |
| n-3 derived oxylipins | ||||
| 5-HEPE | 7.430 | 12.323 | 19.378 | 163.982 |
| 12-HEPE | * | 7.684 | 33.107 | 55.445 |
| PGD3 | ND | ND | 14.818 | 9.352 |
| PGE3 | – | ND | 23.562 | 32.107 |
| 17-HDoHE | – | 2.051 | 3.362 | 3.148 |
| 10-17-DiHDoHE | ND | ND | 3.384 | 4.768 |
| 19,20-DiHoPE | 5.717 | 2.244 | 4.172 | 18.053 |
| TBXB3 | * | ND | 16.198 | 10.438 |
| Other oxylipins | ||||
| 5,6 EET | – | 0.120 | – | – |
| 8,9 EET | ND | ND | 0.329 | – |
| 11,12 EET | 0.512 | 0.179 | 0.489 | 0.566 |
| 14,15 EET | 0.492 | 0.277 | 0.537 | – |
| LTB4 | ND | 3.524 | 0.357 | * |
| LTD4 | ND | ND | 0.184 | – |
| n-acetyl-leukotriene E4 | ND | 0.628 | * | ND |
| 5,6-DiHETrE | 0.358 | – | 0.246 | 0.496 |
| 8,9-DiHETrE | 0.481 | 0.186 | 0.328 | * |
| 11,12-DiHETrE | 0.303 | 0.221 | 0.388 | 0.593 |
| 14,15-DiHETrE | 0.562 | 0.224 | 0.366 | * |
| PGD2 | 0.363 | * | – | – |
| PGE2 | 0.397 | 0.229 | – | – |
| PGF2α | – | 0.259 | – | – |
| 8-iso-PGF2α | – | – | – | 0.623 |
| 13,14-dihydro-15-keto-PGD2 | ND | ND | 0.180 | ND |
| 13,14-dihydro-15-keto-PGE2 | 0.479 | 0.275 | 0.157 | 0.244 |
| 13,14-dihydro-15-keto-PGF2α | ND | 0.240 | 0.200 | 0.405 |
| 12-HHTrE | 0.421 | 0.094 | – | 0.224 |
| 5-HETE | 0.375 | – | – | – |
| 11-HETE | 0.401 | 0.094 | – | – |
| 12-HETE | 0.265 | 0.159 | – | 0.289 |
| 15-HETE | 0.323 | 0.250 | – | 0.234 |
| 20-HETE | ND | 0.447 | – | ND |
| TBXB2 | 0.403 | 0.215 | – | – |
| 9-HODE | – | – | – | 0.417 |
| 13-HODE | 0.559 | ↓ | – | 0.308 |
| lipoxin A4 | ND | 1.771 | 2.533 | 7.181 |
| 1% FO vs 3% FO | ||||
| Fatty acids | ||||
| DHA | – | – | 1.329 | – |
| EPA | * | – | 1.563 | 1.868 |
| 17 keto- 4(z), 7(z), 10(z), 13 (z), 15 (E), 19(z)-DHA | ND | – | 1.786 | * |
| n-3 derived oxylipins | ||||
| 5-HEPE | – | 1.649 | 2.049 | 4.808 |
| 12-HEPE | * | – | 1.708 | 2.242 |
| PGD3 | ND | ND | – | 2.545 |
| PGE3 | – | ND | – | 2.375 |
| 17-HDoHE | – | 1.435 | – | – |
| 19,20-DiHoPE | – | 1.463 | - | 4.060 |
| Other oxylipins | ||||
| 5-HETE | – | – | 0.416 | 1.739 |
| 11-HETE | 0.487 | – | – | – |
| 13-HODE | 0.651 | – | – | – |
| 15-HETE | 0.442 | – | – | – |
| PGE2 | 0.492 | – | – | – |
| 13,14-dihydro-15-keto-PGE2 | – | – | 0.648 | – |
| 13,14-dihydro-15-keto-PGF2α | ND | 0.555 | – | – |
| lipoxin A4 | ND | 2.075 | 2.877 | 6.588 |
| TBXB2 | 0.433 | – | – | – |
Only statistically significant effects are listed, presented as fold-control values, calculated by comparing mean metabolite concentration from one diet to another. Means were calculated from saline and LPS treated animals together per diet group. ↑ or ↓ were used when the fold-control value would disagree with the outcome outcome of the ANOVA in cases of variables which were rank-transformed
ND the compound was not detected in the particular matrix, and ‘–’ indicates that no statistical significant differences were observed
* Interaction effect (see supplemental data for details)
Table 4.
Effect of LPS on oxylipin levels in plasma, liver, ileum and adipose tissue (LPS effect)
| Plasma | Liver | Ileum | Adi. tiss. | |||
|---|---|---|---|---|---|---|
| Saline vs LPS | Fatty acids | ARA | * | 1.827 | – | 1.854 |
| DHA | 2.033 | 1.590 | – | – | ||
| EPA | * | – | – | 1.791 | ||
| n-3 derived oxylipins | 5-HEPE | 2.049 | – | – | 5.626 | |
| PGD3 | ND | ND | – | 2.498 | ||
| PGE3 | – | ND | 3.256 | 4.217 | ||
| 10(S)-17(S)-DiHDoHE | ND | ND | – | 2.249 | ||
| 19,20-DiHoPE | 3.886 | 1.376 | 1.874 | 3.822 | ||
| TBXB3 | * | ND | 2.637 | 4.752 | ||
| Other oxylipins | 5,6 EET | – | – | – | 2.847 | |
| 11,12 EET | – | – | – | 1.843 | ||
| 14,15 EET | – | 1.890 | – | – | ||
| LTB4 | ND | 0.538 | – | * | ||
| LTD4 | ND | ND | – | 2.445 | ||
| n-acetyl leukotriene E4 | ND | 1.627 | * | ND | ||
| 5,6 DiHETrE | – | – | – | 1.744 | ||
| 8,9-DiHETrE | 2.170 | – | – | * | ||
| 11,12-DiHETrE | 2.167 | – | – | – | ||
| 14,15-DiHETrE | 1.943 | – | – | * | ||
| PGE2 | 1.958 | 2.449 | – | 2.039 | ||
| PGF2α | – | – | – | 1.777 | ||
| 8-iso-PGF2α | – | 1.778 | – | – | ||
| 13,14-dihydro-15-keto-PGE2 | 2.600 | – | – | 1.243 | ||
| 13,14-dihydro-15-keto-PGF2α | ND | 1.815 | – | – | ||
| 12-HHTrE | 0.201 | – | – | 2.252 | ||
| 5-HETE | 2.240 | – | – | 2.435 | ||
| 11-HETE | 0.561 | 1.887 | – | 1.925 | ||
| 12-HETE | – | 0.782 | – | – | ||
| 15-HETE | 0.433 | – | – | – | ||
| 20-HETE | ND | 2.399 | – | ND | ||
| TBXB2 | 0.175 | – | 2.560 | 2.277 | ||
| 9-HODE | 1.267 | – | 2.768 | 2.014 | ||
| 13-HODE | – | – | 2.086 | 1.206 | ||
| 9,10,13-TriHOME | 1.301 | * | – | – | ||
| Lipoxin A4 | ND | – | – | 2.372 | ||
Only statistically significant effects are listed, presented as fold-control values, calculated by comparing mean metabolite concentration from the saline to the LPS groups. Means were calculated from the different diet groups together for saline and LPS treated animals.
ND the compound was not detected in the particular matrix, and – indicates that no statistical significant differences were observed
* Interaction effect (see supplemental data for details)
The FO diets altered endocannabinoid levels with different effects in plasma, liver, ileum and adipose tissue (Table 1). DHEA was increased by both FO diets in all compartments compared to control diet. For EPEA, an interaction effect (see supplemental data) was observed in liver, but the compound was increased by the FO diets in plasma, ileum and adipose tissue. The endocannabinoids/NAEs derived from other fatty acids, such as AEA and 2-AG, were in general decreased by the FO diets, but some deviations were observed. For instance, 2-AG levels in adipose tissue and liver were decreased in both FO groups compared to the control diet. When comparing the 1 % versus the 3 % FO group, liver 2-AG was lower in the 3 % group, but higher in adipose tissue. DGLEA (also known as DLE) in liver was not influenced by the diets, but was decreased in plasma, ileum and adipose tissue in the FO groups. OEA was decreased in liver and plasma, but not in ileum. When comparing the control diet group with the 3 % FO group, SEA displayed opposite effects in adipose tissue and plasma; FO was found to decrease plasma levels, but increased adipose tissue levels of SEA. This was also observed when comparing the 1 % versus the 3 % FO groups.
The effect of LPS on endocannabinoids appeared to be both compound and tissue specific (Table 2; for effects of LPS on endocannabinoids for each diet group, please refer to the supplemental data). LPS increased DHEA levels in all compartments, but for some compounds tissue-specific effects were seen. LPS decreased plasma 2-AG, whereas it increased adipose tissue 2-AG. A similar divergence is seen for SEA and PEA. LPS increased plasma and ileum SEA levels, but decreases liver and adipose tissue SEA levels. PEA levels were decreased in liver by LPS, but increased in ileum.
In summary, both the FO diets and the LPS treatment affected plasma and tissue endocannabinoid/NAE levels. In general, DHEA and EPEA were increased by the FO diets, and compounds derived from other fatty acids were decreased, with different effects for 1 and 3 % FO diets. LPS raised endocannabinoid/NAE levels in general, but opposing effects were seen for 2-AG, PEA and SEA across the tissues investigated.
FO diet and inflammation alter the oxylipin balance
The results of the oxylipin analyses in plasma, liver, ileum and adipose tissue are presented in Tables 3 and 4, with Table 3 showing diet effects and Table 4 LPS effects. Compounds with an interaction effects are highlighted with an * in the tables, with details provided in the supplemental data (S-5 and S-6). UK compounds are not presented in Table 5, but can be found in the supplemental data.
Table 5.
Top lists generated from PCA analysis
| PC1 | PC2 | ||
|---|---|---|---|
| P_AEA | 0.13562 | F_pea | 0.148486 |
| P_AA | 0.128696 | L_dhea | 0.141097 |
| P_DLE | 0.12706 | F_TBXB3 | 0.138751 |
| L_13,14-dihydro-15-keto-PGF2a | 0.120315 | P_DHEA | 0.137637 |
| L_AA | 0.12015 | P_19,20-DiHoPE | 0.137193 |
| L_2-ag | 0.116734 | F_UK3 | 0.136532 |
| P_11,12-DiHETrE | 0.116219 | F_5(S)-HETE | 0.136382 |
| L_8,9-DiHETrE | 0.115152 | F_17 keto- 4(z), 7(z), 10(z), 13 (z), 15 (E), 19(z)-DHA | 0.135592 |
| I_13,14-dihydro-15-keto-PGE2 | 0.114106 | F_PGE3 | 0.133149 |
| I_2-ag | 0.113331 | F_19,20-DiHoPE | 0.133074 |
| L_15(S)-HETE | 0.112971 | F_oea | 0.132124 |
| F_aea | 0.112488 | F_UK5 | 0.131976 |
| L_EPA | −0.11245 | F_UK2 | 0.128994 |
| L_14,15 EET | 0.111192 | I_PGE3 | 0.128277 |
| L_5(S)-HEPE | −0.11066 | F_UK4 | 0.127957 |
| L_11(S)-HETE | 0.10907 | P_DHA | 0.127188 |
| P_14,15-DiHETrE | 0.107335 | F_AA | 0.125684 |
| I_13,14-dihydro-15-keto-PGF2a | 0.105203 | F_5(S)-HEPE | 0.12297 |
| P_8,9-DiHETrE | 0.104781 | I_19,20-DiHoPE | 0.121367 |
| L_11,12 EET | 0.103724 | F_12,13-DiHOME | 0.12071 |
| I_13,14-dihydro-15-keto-PGD2 | 0.100174 | P_PEA | 0.120517 |
| L_PGE2 | 0.100147 | P_12,13-DiHOME | 0.118135 |
| I_12(S)-HEPE | −0.09961 | F_lipoxin A4 | 0.115389 |
| F_2-ag | 0.099293 | P_EPEA | 0.115294 |
| L_14,15-DiHETrE | 0.098683 | F_5,6 EET | 0.115132 |
| L_12(S)-HHTrE | 0.098509 | F_PGD3 | 0.114641 |
| I_EPA | −0.09806 | F_dhea | 0.113431 |
| F_dle | 0.09791 | L_epea | 0.112967 |
| F_13,14-dihydro-15-keto-PGF2a | 0.097779 | P_9,10-DiHOME | 0.11289 |
| F_EPA | −0.09662 | F_9,10-DiHOME | 0.109149 |
The D-scores represent the variable’s weight in the separation, and is expressed as the numerical output value as obtained from the PCA model; the further away from zero, the better this variable accounts for group separation. PC1 separated the diets, whereas PC2 separated between saline and LPS treatment
P plasma, L liver, I ileum, F adipose tissue
The FO diets decreased levels of ARA and increased DHA and EPA, confirming that the increased dietary intake of n-3 fatty acids was reflected in tissue fatty acid levels (Table 3). Furthermore, n-3 derived oxylipin levels were increased by the FO diets, with the most pronounced effects observed in ileum and adipose tissue. The oxylipins derived from other fatty acids were in general decreased by the FO diets, with some exceptions, and effects were not always consistent over all tissues tested. Levels of LTB4 were decreased in ileum and adipose tissue by the FO diets, but liver levels were increased. Lipoxin A4 levels were increased in the 3 % FO group compared to the control and 1 % FO diet in liver, ileum and adipose tissue. When comparing the 1 and 3 % FO diets, ileal 5-HETE levels were decreased in the 3 % FO group, but its level was increased in adipose tissue. The FO diets decreased oxylipins belonging to different branches of the fatty acid oxylipin cascade, including the cyclooxygenase pathway (COX; PGD2, PGE2 and their metabolites 13,14-dihydro-15-keto-PGD2 and –PGE2, PGF2α, TBXB2), the 15-lipo-oxygenase pathway (15-LOX; 15-HETE), 12-LOX (11-HETE and 12-HETE), 5-LOX (5-HETE, LTB4 and LTD4) and the cytochrome P450 pathways (EETs and DiHETrEs) (see Fig. 1 for an overview).
Treatment with LPS generally resulted in increased levels of fatty acids, n-3 derived oxylipins and other oxylipins, with the most compounds affected in plasma and adipose tissue, and the least number of compounds altered in ileum (Table 4; for effects of LPS on oxylipins for each diet group, please refer to the supplemental data). Again, opposing effects were observed between compartments for some components. LPS decreased plasma levels of 11-HETE, but increased liver levels. TBXB2 was decreased by LPS in plasma, but increased in ileum and adipose tissue. Effects on UK compounds are listed in the supplemental data.
Multivariate data analysis shows separation between diet groups and LPS treatment
The univariate data analysis approach revealed that both FO and LPS altered endocannabinoid/NAE and oxylipin levels, and effects were seen in plasma, liver, ileum and adipose tissue. In total, 244 variables obtained in four compartments were evaluated, which were, due to complexity, further analyzed with multivariate data analysis to evaluate differences between treatment groups. Two methods were used, the unbiased PCA and the supervised PCDA. In the PCA plot (Fig. 2), a good separation of the six intervention groups can be seen. PC1 separated the diets, with negative loadings associated to n-3 fatty acid derived metabolites, and positive loadings belonging to other metabolites. From the top-30 variables relevant for group separation in PC1 (see Table 5), 13 variables were from liver, whereas plasma, ileum and adipose tissue were equally important. In total four metabolites were derived from n-3 fatty acids, and 26 were derived from other fatty acids. PC2 separated between saline and LPS treatment, containing equal numbers of n-3 derived- and other metabolites. From the top-30 variables accounting in PC2, 19 metabolites were from adipose tissue, with 15 n-3 fatty acid derived metabolites, and 15 derived from other fatty acids.
Fig. 2.
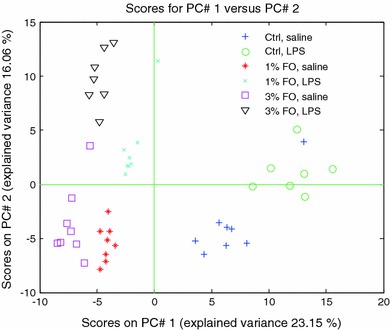
PCA analysis on fused data. The PCA plot shows good separation of the three diet groups. PC1 describes mainly the diet effect, and PC2 mainly the LPS effect
The diet effect in the saline treated mice is explained by other variables than the diet effect in the LPS-treated mice
To further explore differences between diet groups, PCDA was performed. The data was split for saline and LPS-treated mice, thus resulting in two separate PCDA plots. PCDA analyses showed that there is separation based on diet for both the saline and LPS-treated mice (Fig. 3). The contribution of a variable in the PCDA model is expressed as its D-score, with a positive score meaning an increase by the FO diets, and a negative score indicating a decrease. Analysis of D-scores focused on the 50 compounds with the highest D-scores as there was considerable decay in D-score values between the first and 50th compound, meaning that any differences within this range can be considered as a potentially meaningful difference. The analysis revealed that the diet groups are separated by increased levels of n-3 derived compounds in the FO groups, and compounds derived from other fatty acids were generally decreased by the FO diets (Table 6). In addition to this, both endocannabinoids/NAEs and oxylipins show up in the top of the rank lists, indicating that both classes of compounds are important to describe the diet effect. The ranking, number and origin of n-3 derived metabolites in the models is different between the saline and LPS treated animals. Out of the 50 compounds ranking highest for the saline treated mice, only 12 compounds are n-3 fatty acid derived metabolites, while for the LPS treated mice, the top-50 list contains 25 n-3 fatty acid derived metabolites. In addition to this, the majority of n-3 derived compounds in the LPS treated mice from this list originated from adipose tissue.
Fig. 3.
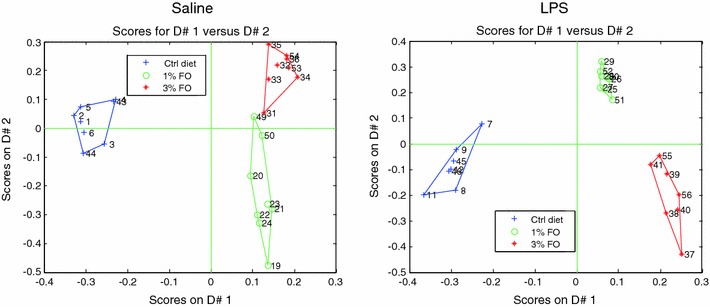
PCDA analysis, split for saline and LPS treated mice. A separation of diet groups is observed in both saline and LPS treated mice, with a more prominent separation in the LPS treated mice
Table 6.
Top lists for saline and LPS treated mice. Lists were generated from PCDA analysis, showing different patterns for saline and LPS treated mice
| Saline | D-score | LPS | D-score | ||
|---|---|---|---|---|---|
| P_AEA | −4,6879 | L_2-AG | −4,3994 | ||
| L_2-AG | −4,5742 | P_AEA | −4,2737 | ||
| P_DGLEA | −4,5412 | 1 | F_EPA | 4,2374 | |
| F_AEA | −4,4914 | 2 | F_12-HEPE | 4,1634 | |
| P_ARA | −4,4486 | 3 | P_EPA | 4,1441 | |
| P_11,12-DiHETrE | −4,4257 | P_2-AG | −4,1053 | ||
| 1 | F_DHEA | 4,3978 | P_AA | −4,0854 | |
| P_14,15-DiHETrE | −4,3961 | 4 | I_PGE 3 | 4,0450 | |
| L_ARA | −4,3915 | 5 | F_TBXB 3 | 4,0374 | |
| L_13,14-dihydro-15-keto-PGF2a | −4,3025 | 6 | F_PGE 3 | 3,9827 | |
| L_12-HETE | −4,2590 | P_DGLEA | −3,9498 | ||
| F_8,9-DiHETrE | −4,2553 | L_14,15-DiHETrE | −3,8977 | ||
| L_15-HETE | −4,2343 | 7 | F_DHEA | 3,8946 | |
| 2 | L_5-HEPE | 4,2162 | 8 | I_EPA | 3,8541 |
| L_11-HETE | −4,1548 | 9 | L_EPEA | 3,7505 | |
| 3 | L_EPA | 4,1323 | L_11,12-DiHETrE | −3,7410 | |
| 4 | P_EPA | 4,1269 | 10 | L_DHEA | 3,7222 |
| F_DGLEA | −4,1166 | L_ARA | −3,6999 | ||
| P_8,9-DiHETrE | −4,0892 | 11 | L_EPA | 3,6953 | |
| I_13,14-dihydro-15-keto-PGE2 | −4,0783 | 12 | I_DHA | 3,6912 | |
| P_OEA | −4,0592 | 13 | I_12-HEPE | 3,6874 | |
| F_11,12 EET | −4,0186 | L_8,9-DiHETrE | −3,6672 | ||
| F_OEA | −4,0148 | 14 | F_EPEA | 3,6327 | |
| L_8,9-DiHETrE | −4,0079 | L_13,14-dihydro-15-keto-PGF2a | −3,6261 | ||
| I_2-AG | −3,9897 | I_2-AG | −3,6231 | ||
| F_9,10-DiHOME | −3,9147 | 15 | P_DHA | 3,5903 | |
| P_9,10-DiHOME | −3,8645 | F_AEA | −3,5678 | ||
| L_LTB4 | 3,8175 | L_PGD2 | −3,5455 | ||
| F_11,12-DiHETrE | −3,7600 | 16 | F_PGD 3 | 3,5197 | |
| F_14,15-DiHETrE | −3,7376 | 17 | F_19,20-DiHoPE | 3,5168 | |
| L_5,6 EET | −3,7094 | L_AEA | −3,5158 | ||
| I_13,14-dihydro-15-keto-PGF2a | −3,7008 | 18 | I_19,20-DiHoPE | 3,4924 | |
| P_12,13-DiHOME | −3,6962 | L_14,15 EET | −3,4871 | ||
| F_12,13-DiHOME | −3,6718 | 19 | I_EPEA | 3,4515 | |
| 5 | P_DHEA | 3,6677 | 20 | I_5-HEPE | 3,4391 |
| P_UK4 | −3,6605 | I_AEA | −3,4310 | ||
| L_14,15 EET | −3,6511 | F_SEA | 3,4187 | ||
| 6 | F_EPA | 3,6069 | L_20-HETE | −3,4104 | |
| 7 | I_19,20-DiHoPE | 3,5938 | I_13,14-dihydro-15-keto-PGE2 | −3,3956 | |
| F_5,6-DiHETrE | −3,5357 | 21 | P_5-HEPE | 3,3787 | |
| P_2-AG | −3,5155 | 22 | L_5-HEPE | 3,3617 | |
| 8 | I_12-HEPE | 3,4899 | L_TBXB2 | −3,3200 | |
| L_11,12 EET | −3,4781 | L_12-HHTrE | −3,3155 | ||
| 9 | F_EPEA | 3,4723 | P_5,6-DiHETrE | −3,3080 | |
| 10 | L_19,20-DiHoPE | 3,4679 | 23 | F_5-HEPE | 3,3048 |
| L_12-HHTrE | −3,4525 | 24 | P_DHEA | 3,2978 | |
| P_UK2 | −3,4144 | P_11,12-DiHETrE | −3,2966 | ||
| L_PGE2 | −3,4143 | 25 | F_17 keto- 4(z), 7(z), 10(z), 13 (z), 15 (E), 19(z)-DHA | 3,2931 | |
| 11 | I_EPA | 3,3758 | L_11-HETE | −3,2792 | |
| 12 | P_5-HEPE | 3,3581 | P_15-HETE | −3,2618 |
The D-scores represent their weight, expressed as the numerical output value as obtained from the PCDA model; the further away from zero, the better this variable accounts for group separation. Negative scores indicate that the compound is decreased in the fish oil groups; positive scores mean that it is increased by fish oil. Decrease of other than n-3 derived compounds ranks relatively high in the saline diet effect, whereas an increase in n-3 derived compounds (printed in bold) ranks high for the diet effect in the LPS treated mice
P plasma, L liver, I ileum, F adipose tissue
From these results, it can be concluded that the diet effect of FO in the saline treated animals is mainly explained by a decrease of compounds derived from other than n-3 fatty acids, and to a lesser extent by an increase of n-3 derived metabolites. However, for the LPS treated mice, the diet effect is principally explained by an increase of n-3 derived metabolites, and to a lesser extent by a decrease of metabolites derived from other than n-3 fatty acids.
Discussion
Our results support the general idea that increasing dietary n-3 fatty intake results in increased levels of n-3 derived-endocannabinoids/NAEs and oxylipins. However, to the best of our knowledge, our study is the first one describing effects of dietary FO on the balance between the “endocannabinoid” and oxylipin pathways in such detail, in different compartments simultaneously, and in relation with inflammation. In addition, our study illustrates the risk of obtained potentially premature conclusions when only a few mediators are analyzed in a limited number of matrices. Several studies, focusing on for example AEA (anandamide) and 2-AG only, have concluded that dietary FO leads to an overall down regulation of the endocannabinoid system (Banni et al. 2011; Batetta et al. 2009). However, as we show other (n-3 derived-) endocannabinoids might be affected in an opposite direction following FO intake, and our data shows that the sum of all NAE levels in liver, ileum and plasma are actually quite stable with the different diets (data not shown). Although there are still several questions regarding their biological role, there are reports showing that n-3 derived ethanolamides have affinity for CB1 and CB2 receptors (Brown et al. 2010; Plastina et al. 2009b), and have anti-inflammatory properties (Balvers et al. 2010; Meijerink et al. 2011).
LPS was found to produce a general increase of in vivo endocannabinoid/NAE and oxylipin levels, although there were some exceptions (see below). Multivariate data analysis showed that the diet effect was also present during inflammatory conditions. Without LPS, the effect of a FO diet was mainly explained by a reduction of mediators other than those derived from n-3 fatty acids, and to a lesser degree by increased levels of n-3 derived metabolites. However, after LPS, the balance was shifted in favor of an increase of n-3 derived mediators while lower associations were found with reductions of non n-3 derived metabolites.
The relation between dietary fatty acid intake and the presence of endocannabinoids/NAEs and oxylipins in plasma and tissues has been established before (Banni and Di Marzo 2010; Hansen and Artmann 2008), but not under conditions of inflammation. Previous work with rats demonstrated that patterns of organ levels of NAEs follow the relative abundance of fatty acids in the diet (Artmann et al. 2008). Other work, investigating the effect of DHA on murine levels of endocannabinoids/NAEs in brain and plasma, showed strongest changes in plasma (Wood et al. 2010). Interestingly, plasma AEA levels were not significantly affected by DHA alone, whereas other NAEs were decreased by DHA. Other work, supplementing krill oil or menhaden oil to human subjects also did not show an effect on plasma AEA levels (Banni et al. 2011). Our work shows that 6 weeks of a FO diet is capable of reducing plasma AEA and 2-AG levels. This discrepancy might originate from differences in n-3 fatty acids sources, daily dose, or length of the period in which the n-3 fatty acids were supplemented.
Many studies analyze plasma levels of endocannabinoids/NAEs or oxylipins. The present work shows that plasma levels do not always reflect effects in liver, ileum or adipose tissue. For example, plasma 2-AG levels decreased after LPS, but were increased in adipose tissue, and similar divergences were also observed for PEA, SEA, several HETEs, and TBXB2. The origin and significance of these findings are not known yet, but this could be related to synthesis, release, uptake or breakdown which might be differentially regulated by LPS or other factors across different organs. Nevertheless, based on our results, extrapolating effects found in plasma to effects on peripheral tissues is not always appropriate. It should be noted that the recovery of endogenous metabolites from tissues might not be complete, potentially underestimating actual effects of the diet and inflammation in the tissues.
The LPS treated mice had a lower food intake combined with a small loss of body weight (data not shown), whereas the saline treated animals displayed normal food consumption and stable body weight. Previous work showed that levels of endocannabinoids and related NAEs depend on fasting status (Hansen and Diep 2009; Joosten et al. 2010; Li et al. 2011); their tissue levels being high during fasting, followed by a rapid postprandial decrease. Possibly, the effect of LPS on endocannabinoid levels might in part be mediated through such a ‘fasting’ effect. In addition, inflammation reduces FAAH expression, and inhibition of FAAH or monoacyl glycerol lipase (MGL) has been shown to reduce disease symptoms in several models of inflammation (Alhouayek et al. 2011; Maccarrone et al. 2001; Naidu et al. 2010). Similarly, studies using CB2 knock-out models under induced inflammatory conditions showed that increased levels of NAEs likely contribute to suppress inflammation (Bátkai et al. 2007). Together, this suggests that increased levels of endocannabinoids/NAEs are part of a normal response protecting against inflammatory stress. Previous work identified DHEA and EPEA as having anti-inflammatory properties in macrophages and adipocytes (Balvers et al. 2010; Meijerink et al. 2011), and these compounds could be another link between FO and its anti-inflammatory effects as n-3 derived NAEs were more effective than AEA in suppressing nitric oxide release from macrophages (Meijerink et al. 2011).
The FO diets also influenced levels of oxylipins, including metabolites from the COX, CYP450, and 5-LOX, 12-LOX and 15-LOX pathways (Fig. 1), and these effects were in general also seen during inflammatory conditions. Another strength of the present study is that we analyzed both n-6 and n-3 related oxylipins simultaneously in different compartments. In general, levels of n-3 fatty acid derived oxylipins (e.g. PGD3, PGE3, 5-HEPE, 12-HEPE and TBXB3) were increased with FO at the expense of oxylipins derived from other fatty acids (e.g. PGD2, PGE2, PGF2α, TBXB2 and members of the EET and HETE subclasses). A functional role in inflammation has been described for several of these compounds, and it is likely that the changes in profiles which are found in this study (and before) are causally related to the anti-inflammatory effects which are associated with n-3 fatty acid intake. For example, PGE3 is less potent than PGE2 in inducing COX-2 expression and IL-6 release (Bagga et al. 2003). A similar principle applies to the thromboxanes (Fischer and Weber 1983; von Schacky et al. 1985) and for 5-HETE/5-HEPE (Heidel et al. 1989), which were also altered by the FO diets.
Interestingly, the FO diets increased liver LTB4 levels, whereas ileum LTB4 levels were decreased. LTB4 has multiple pro-inflammatory functions in the immune system (Calder 2003), but the different effect of FO on organ levels of LTB4 is not understood. Lipoxin A4, a compound with anti-inflammatory properties (Schwab and Serhan 2006), was increased by the 3 % FO diet. This indicates that at least for this compound, which is synthesized from ARA, its levels are not directly related to dietary supply of precursors, but that other presently unknown factors are involved.
Levels of several EETs were reduced by the FO diets, especially in the liver. EETs play regulatory roles in heart and vascular physiology with effects on blood pressure regulation, but also have anti-inflammatory effects (Spector 2009). It thus seems that EETs do not play a role in the anti-inflammatory properties of n-3 fatty acids, but it should be noted that n-3 fatty acid derived EET analogues are reported to be endogenously present and have potent analgesic properties (Morisseau et al. 2010), but these specific EETs were not quantified in the current study. Another line of evidence suggests that EETs very specifically alter the release of either insulin or glucagon (Falck et al. 1983; Sacerdoti et al. 2003), pointing to a potential link between n-3 fatty acids and glucose metabolism. EETs might therefore also be part in mediating effects of dietary fatty acids on metabolism, but this relation has not been given much attention yet.
In the present study we did not detect resolvins in any of the samples. It might be that these compounds are not formed in quantities high enough to be detected with our method during the first 24 h after the initiation of the inflammatory response, or the detection limit of the analytical method was not sufficient to detect these compounds. The single time-point approach in the present study is a limitation of the work, and investigating a broader time range, e.g. studying multiple time points beyond 24 h after the initiation of inflammation, might reveal temporal changes in lipid mediators including resolvins.
The presence of 17-HDoHE (also known as 17-HDHA), a marker for resolvin synthesis (Poulsen et al. 2008) with anti-inflammatory properties (González-Périz et al. 2006), was increased by the FO diets. The FO diets as well as LPS increased levels of 10,17-DiHDoHE, (also known as protectin DX) which was previously shown to reduce inflammation and accelerate its resolution (Serhan et al. 2006). Altogether, the FO diets altered all branches in the oxylipin metabolome in a way that is largely associated with suppression of inflammation.
A major finding of this work is that the effects of FO were also persistent under inflammatory conditions. Multivariate data analysis revealed that both endocannabinoids and oxylipins are responsible for separation between diet groups. Under non-inflammatory conditions, the diet groups could be primarily separated based on the reduction of other than n-3 derived endocannabinoids and oxylipins. In contrast, with LPS treatment, the diet groups were primarily separated by increases in levels of n-3 fatty acid derived endocannabinoids and oxylipins. The combined approach of comparing normal versus inflammatory conditions was thus useful in demonstrating that effects of diet on oxylipins and endocannabinoids are depending on inflammatory status.
Recent evidence suggested that relatively high intakes of FO impairs the host’s resistance to microbial infection (Bonilla et al. 2010; Irons et al. 2003; Snel et al. 2010). In our study, the mice that had received 3 % FO showed relatively more severe signs of shock after LPS, and one mouse from the 3 % FO + LPS group died shortly before the end of the experiment. This would be in line with the notion that high FO intake might impair the host’s resistance to inflammatory stress, or to suppress the capability to overcome the inflammatory stimulus. We observed that plasma TBXB2 levels, a compound related to TBXA2 which is involved in vasoconstriction (Sellers and Stallone 2008), was decreased in the 3 % FO group compared to the 1 % FO group, but also by LPS. The combination 3 % FO and LPS treatment might have caused a decrease in TBXA2 levels below its physiological range, potentially increasing the risk of inducing excessive vasodilatation and shock. Alternatively, pre-treatment of rats with a CB1 blocker was effective in reducing hypotension after LPS administration (Varga et al. 1998), suggesting that increases in endocannabinoids after LPS might also contribute to the shock observed for the 3 % FO + LPS group. Future work should point out which (combination of) metabolites account for the impaired resistance in the 3 % FO + LPS group. Furthermore, future work should clarify which intake levels of n-3 fatty acids are beneficial to reduce symptoms of inflammatory diseases and where the inhibition of inflammation starts to interfere with an efficient response to an inflammatory stimulus.
In conclusion, dietary FO caused marked changes in the n-3 to n-6 balance of the endocannabinoid and oxylipin metabolomes, with specific effects depending on inflammatory status. The effects on metabolites are in line with the anti-inflammatory effects associated with n-3 fatty acid intake.
Electronic supplementary material
Below is the link to the electronic supplementary material.
Acknowledgments
The authors acknowledge M. Poland, A. Kreikamp and staff at the animal facility of Wageningen University for technical assistance, and staff and management of TNO Triskelion Ltd. (Zeist, The Netherlands) for facilitating the LC–MS analyses. This work was funded by a research grant from TNO (Balance/VP9).
Open Access
This article is distributed under the terms of the Creative Commons Attribution License which permits any use, distribution, and reproduction in any medium, provided the original author(s) and the source are credited.
Abbreviations
- 2-AG
2-Arachidonoyl glycerol
- ACN
Acetonitrile
- AEA
Arachidonoyl ethanolamide
- ARA
Arachidonic acid
- COX
Cyclooxygenase
- CYP450
Cytochrome P450
- DGLEA
Dihomo-γ-linolenoyl ethanolamide (also abbreviated as DLE)
- DHA
Docosahexaenoic acid
- DHEA
Docosahexaenoyl ethanolamide
- DiHDoHE
Dihydroxydocosahexaenoic acid
- DiHETrE
Dihydroxyeicosatrienoic acid (also abbreviated as DHET)
- DiHOME
Dihydroxyoctadecenoic acid
- DiHoPE
Dihydroxydocosapentaenoic acid (also abbreviated as DiHDPA)
- EET
Epoxyeicosatrienoic acid
- EPA
Eicosapentaenoic acids
- EPEA
Eicosapentaenoyl ethanolamide
- FO
Fish oil
- HDoHE
Hydroxydocosahexaenoic acid
- HEPE
Hydroxyeicosapentaenoic acid
- HETE
Hydroxyeicosatetraenoic acid
- HHTrE
Hydroxyheptadecatrienoic acid
- HODE
Hydroxyoctadienoic acid
- HOME
Hydroxyoctadecenoic acid
- LA
Linoleic acid
- LC–MS/MS
Liquid chromatrography–tandem mass spectrometry
- LPS
Lipopolysaccharide
- LOX
Lipooxygenase
- LT
Leukotriene
- NAE
N-Acyl ethanolamine
- OEA
Oleoyl ethanolamide
- PEA
Palmitoyl ethanolamide
- PG
Prostaglandin
- PUFA
Polyunsaturated fatty acid
- SEA
Stearoyl ethanolamide
- TBX
Thromboxane
Contributor Information
Michiel G. J. Balvers, Email: michiel.balvers@wur.nl
Kitty C. M. Verhoeckx, Phone: +31-8886-65136, FAX: +31-8886-68766, Email: kitty.verhoeckx@tno.nl
References
- Alhouayek M, Lambert DM, Delzenne NM, Cani PD, Muccioli GG. Increasing endogenous 2-arachidonoylglycerol levels counteracts colitis and related systemic inflammation. FASEB Journal. 2011;25(1):2711–2721. doi: 10.1096/fj.10-176602. [DOI] [PubMed] [Google Scholar]
- Artmann A, Petersen G, Hellgren LI, Boberg J, Skonberg C, Nellemann C, et al. Influence of dietary fatty acids on endocannabinoid and N-acylethanolamine levels in rat brain, liver and small intestine. Biochimica et Biophysica Acta (BBA): Molecular and Cell Biology of Lipids. 2008;1781(4):200–212. doi: 10.1016/j.bbalip.2008.01.006. [DOI] [PubMed] [Google Scholar]
- Bagga D, Wang L, Farias-Eisner R, Glaspy JA, Reddy ST. Differential effects of prostaglandin derived from w-6 and w-3 polyunsaturated fatty acids on COX-2 expression and IL-6 secretion. Proceedings of the National Academy of Sciences. 2003;100(4):1751–1756. doi: 10.1073/pnas.0334211100. [DOI] [PMC free article] [PubMed] [Google Scholar]
- Balvers MGJ, Verhoeckx KCM, Plastina P, Wortelboer HM, Meijerink J, Witkamp RF. Docosahexaenoic acid and eicosapentaenoic acid are converted by 3T3-L1 adipocytes to N-acyl ethanolamines with anti-inflammatory properties. Biochimica et Biophysica Acta (BBA): Molecular and Cell Biology of Lipids. 2010;1801(10):1107–1114. doi: 10.1016/j.bbalip.2010.06.006. [DOI] [PubMed] [Google Scholar]
- Balvers MGJ, Verhoeckx KCM, Witkamp RF. Development and validation of a quantitative method for the determination of 12 endocannabinoids and related compounds in human plasma using liquid chromatography-tandem mass spectrometry. Journal of Chromatography B. 2009;877(14–15):1583–1590. doi: 10.1016/j.jchromb.2009.04.010. [DOI] [PubMed] [Google Scholar]
- Banni S, Carta G, Murru E, Cordeddu L, Giordano E, Sirigu A, et al. Krill oil significantly decreases 2-arachidonoylglycerol plasma levels in obese subjects. Nutrition and Metabolism. 2011;8(1):7. doi: 10.1186/1743-7075-8-7. [DOI] [PMC free article] [PubMed] [Google Scholar]
- Banni S, Di Marzo V. Effect of dietary fat on endocannabinoids and related mediators: Consequences on energy homeostasis, inflammation and mood. Molecular Nutrition and Food Research. 2010;54(1):82–92. doi: 10.1002/mnfr.200900516. [DOI] [PubMed] [Google Scholar]
- Batetta B, Griinari M, Carta G, Murru E, Ligresti A, Cordeddu L, et al. Endocannabinoids may mediate the ability of (n-3) fatty acids to reduce ectopic fat and inflammatory mediators in obese zucker rats. Journal of Nutrition. 2009;139(8):1495–1501. doi: 10.3945/jn.109.104844. [DOI] [PubMed] [Google Scholar]
- Bátkai S, Osei-Hyiaman D, Pan H, El-Assal O, Rajesh M, Mukhopadhyay P, et al. Cannabinoid-2 receptor mediates protection against hepatic ischemia/reperfusion injury. FASEB Journal. 2007;21(8):1788–1800. doi: 10.1096/fj.06-7451com. [DOI] [PMC free article] [PubMed] [Google Scholar]
- Benjamini Y, Hochberg Y. Controlling the false discovery rate: A practical and powerful approach to multiple testing. Journal of the Royal Statistical Society (Methodological) 1995;57(1):289–300. [Google Scholar]
- Berger A, Crozier G, Bisogno T, Cavaliere P, Innis S, Di Marzo V. Anandamide and diet: Inclusion of dietary arachidonate and docosahexaenoate leads to increased brain levels of the corresponding N-acylethanolamines in piglets. Proceedings of the National academy of Sciences of the United States of America. 2001;98(11):6402–6406. doi: 10.1073/pnas.101119098. [DOI] [PMC free article] [PubMed] [Google Scholar]
- Bisogno, T. (2008). Endogenous cannabinoids: Structure and metabolism. Journal of Neuroendocrinology, 20(Suppl. 1), 1–9. [DOI] [PubMed]
- Bonilla D, Ly L, Fan Y-Y, Chapkin R, McMurray D. Incorporation of a dietary omega 3 fatty acid impairs murine macrophage responses to Mycobacterium tuberculosis. PLoS One. 2010;5(5):5e10878. doi: 10.1371/journal.pone.0010878. [DOI] [PMC free article] [PubMed] [Google Scholar]
- Brown I, Cascio MG, Wahle KWJ, Smoum R, Mechoulam R, Ross RA, et al. Cannabinoid receptor-dependent and -independent anti-proliferative effects of omega-3 ethanolamides in androgen receptor-positive and -negative prostate cancer cell lines. Carcinogenesis. 2010;31(9):1584–1591. doi: 10.1093/carcin/bgq151. [DOI] [PMC free article] [PubMed] [Google Scholar]
- Calder PC. Long-chain n-3 fatty acids and inflammation: Potential application in surgical and trauma patients. Brazilian Journal of Medical and Biological Research. 2003;36:36433–36446. doi: 10.1590/S0100-879X2003000400004. [DOI] [PubMed] [Google Scholar]
- Calder PC. n-3 Polyunsaturated fatty acids, inflammation, and inflammatory diseases. The American Journal of Clinical Nutrition. 2006;83(6):S1505–1519S. doi: 10.1093/ajcn/83.6.1505S. [DOI] [PubMed] [Google Scholar]
- Calder PC. Polyunsaturated fatty acids and inflammatory processes: New twists in an old tale. Biochimie. 2009;91(6):791–795. doi: 10.1016/j.biochi.2009.01.008. [DOI] [PubMed] [Google Scholar]
- Calder PC. The relationship between the fatty acid composition of immune cells and their function. Prostaglandins Leukotrienes and Essential Fatty Acids. 2009;79(3–5):101–108. doi: 10.1016/j.plefa.2008.09.016. [DOI] [PubMed] [Google Scholar]
- Carpentier YA, Portois L, Malaisse WJ. n-3 Fatty acids and the metabolic syndrome. American Journal of Clinical Nutrition. 2006;83(6):S1499–S1504. doi: 10.1093/ajcn/83.6.1499S. [DOI] [PubMed] [Google Scholar]
- Cencioni MT, Chiurchiù V, Catanzaro G, Borsellino G, Bernardi G, Battistini L, et al. Anandamide suppresses proliferation and cytokine release from primary human T-lymphocytes mainly via CB2 receptors. PLoS One. 2010;5(1):e8688. doi: 10.1371/journal.pone.0008688. [DOI] [PMC free article] [PubMed] [Google Scholar]
- De Petrocellis L, Melck D, Bisogno T, Di Marzo V. Endocannabinoids and fatty acid amides in cancer, inflammation and related disorders. Chemistry and Physics of Lipids. 2000;108(1–2):191–209. doi: 10.1016/S0009-3084(00)00196-1. [DOI] [PubMed] [Google Scholar]
- Di Marzo V. The endocannabinoid system in obesity and type 2 diabetes. Diabetologia. 2008;51(8):1356–1367. doi: 10.1007/s00125-008-1048-2. [DOI] [PubMed] [Google Scholar]
- Falck JR, Manna S, Moltz J, Chacos N, Capdevila J. Epoxyeicosatrienoic acids stimulate glucagon and insulin release from isolated rat pancreatic islets. Biochemical and Biophysical Research Communications. 1983;114(2):743–749. doi: 10.1016/0006-291X(83)90843-4. [DOI] [PubMed] [Google Scholar]
- Fischer S, Weber PC. Thromboxane A3 (TXA3) is formed in human platelets after dietary eicosapentaenoic acid (C20:5[omega]3) Biochemical and Biophysical Research Communications. 1983;116(3):1091–1099. doi: 10.1016/S0006-291X(83)80254-X. [DOI] [PubMed] [Google Scholar]
- González-Périz A, Planagumà A, Gronert K, Miquel R, López-Parra M, Titos E, et al. Docosahexaenoic acid (DHA) blunts liver injury by conversion to protective lipid mediators: Protectin D1 and 17S-hydroxy-DHA. FASEB Journal. 2006;20(14):2537–2539. doi: 10.1096/fj.06-6250fje. [DOI] [PubMed] [Google Scholar]
- Hansen HS, Artmann A. Endocannabinoids and Nutrition. Journal of Neuroendocrinology. 2008;20(1):94–99. doi: 10.1111/j.1365-2826.2008.01687.x. [DOI] [PubMed] [Google Scholar]
- Hansen HS, Diep TA. N-acylethanolamines, anandamide and food intake. Biochemical Pharmacology. 2009;78(1):553–560. doi: 10.1016/j.bcp.2009.04.024. [DOI] [PubMed] [Google Scholar]
- Heidel J, Taylor S, Laegreid W, Silflow R, Liggitt H, Leid R. In vivo chemotaxis of bovine neutrophils induced by 5-lipoxygenase metabolites of arachidonic and eicosapentaenoic acid. American Journal of Pathology. 1989;134(3):671–676. [PMC free article] [PubMed] [Google Scholar]
- Hoogerbrugge R, Willig SJ, Kistemaker PG. Discriminant analysis by double stage principal component analysis. Analytical Chemistry. 1983;397:551710–551712. [Google Scholar]
- Irons R, Anderson MJ, Zhang M, Fritsche KL. Dietary fish oil impairs primary host resistance against Listeria monocytogenes more than the immunological memory response. The Journal of Nutrition. 2003;133(4):1163–1169. doi: 10.1093/jn/133.4.1163. [DOI] [PubMed] [Google Scholar]
- Joliffe, I. T. (1986). Principal Component Analysis. Springer Verlag, New York.
- Joosten M, Balvers M, Verhoeckx K, Hendriks H, Witkamp R. Plasma anandamide and other N-acylethanolamines are correlated with their corresponding free fatty acid levels under both fasting and non-fasting conditions in women. Nutrition and Metabolism. 2010;7(1):49. doi: 10.1186/1743-7075-7-49. [DOI] [PMC free article] [PubMed] [Google Scholar]
- Li C, Jones PM, Persaud SJ. Role of the endocannabinoid system in food intake, energy homeostasis and regulation of the endocrine pancreas. Pharmacology and Therapeutics. 2011;129(3):307–320. doi: 10.1016/j.pharmthera.2010.10.006. [DOI] [PubMed] [Google Scholar]
- Maccarrone M, De Petrocellis L, Bari M, Fezza F, Salvati S, Di Marzo V, et al. Lipopolysaccharide downregulates fatty acid amide hydrolase expression and increases anandamide levels in human peripheral lymphocytes. Archives of Biochemistry and Biophysics. 2001;393(2):321–328. doi: 10.1006/abbi.2001.2500. [DOI] [PubMed] [Google Scholar]
- Matias I, Gonthier MP, Orlando P, Martiadis V, De Petrocellis L, Cervino C, et al. Regulation, function, and dysregulation of endocannabinoids in models of adipose and b-pancreatic cells and in obesity and hyperglycemia. Journal of Clinical Endocrinology and Metabolism. 2006;91(8):3171–3180. doi: 10.1210/jc.2005-2679. [DOI] [PubMed] [Google Scholar]
- Meijerink, J., Plastina, P., Vincken, J.-P., Poland, M., Attya, M., Balvers, M. G. et al. (2011). The ethanolamide metabolite of DHA, docosahexaenoylethanolamine, shows immunomodulating effects in mouse peritoneal and RAW264.7 macrophages: evidence for a new link between fish oil and inflammation. British Journal of Nutrition, 105(1), 1798–1807. [DOI] [PubMed]
- Morisseau C, Inceoglu B, Schmelzer K, Tsai H, Jinks S, Hegedus C, Hammock B. Naturally occuring monoepoxides of eicosapentaenoic acid and docosahexaenoic acid are bioactive antihyperalgesic lipids. Journal of Lipid Research. 2010;51(12):3481–3490. doi: 10.1194/jlr.M006007. [DOI] [PMC free article] [PubMed] [Google Scholar]
- Naidu PS, Kinsey SG, Guo TL, Cravatt BF, Lichtman AH. Regulation of inflammatory pain by inhibition of fatty acid amide hydrolase. Journal of Pharmacology and Experimental Therapeutics. 2010;334(1):182–190. doi: 10.1124/jpet.109.164806. [DOI] [PMC free article] [PubMed] [Google Scholar]
- Oh DY, Talukdar S, Bae EJ, Imamura T, Morinaga H, Fan W, et al. GPR120 is an omega-3 fatty acid receptor mediating potent anti-inflammatory and insulin-sensitizing effects. Cell. 2010;142(5):687–698. doi: 10.1016/j.cell.2010.07.041. [DOI] [PMC free article] [PubMed] [Google Scholar]
- O’Sullivan SE. Cannabinoids go nuclear: Evidence for activation of peroxisome proliferator-activated receptors. British Journal of Pharmacology. 2007;152(5):576–582. doi: 10.1038/sj.bjp.0707423. [DOI] [PMC free article] [PubMed] [Google Scholar]
- Plastina P, Meijerink J, Vincken J-P, Gruppen H, Witkamp R, Gabriele B. Selective synthesis of unsaturated N-acylethanolamines by lipase-catalyzed N-acylation of ethanolamine with unsaturated fatty acids. Letters in Organic Chemistry. 2009;6(1):444–447. doi: 10.2174/157017809789124885. [DOI] [Google Scholar]
- Plastina P, Meijerink J, Vincken J-P, Poland M, Witkamp RF. Inhibition of nitric oxide production in RAW264.7 macrophages by N-acyl ethanolamides. Naunyn-Schmiedebergs’ Archives of Pharmacology. 2009;380(1):268. [Google Scholar]
- Poulsen RC, Gotlinger KH, Serhan CN, Kruger MC. Identification of inflammatory and proresolving lipid mediators in bone marrow and their lipidomic profiles with ovariectomy and omega-3 intake. American Journal of Hematology. 2008;83(6):437–445. doi: 10.1002/ajh.21170. [DOI] [PubMed] [Google Scholar]
- Re G, Barbero R, Miolo A, Di Marzo V. Palmitoylethanolamide, endocannabinoids and related cannabimimetic compounds in protection against tissue inflammation and pain: Potential use in companion animals. The Veterinary Journal. 2007;173(1):21–30. doi: 10.1016/j.tvjl.2005.10.003. [DOI] [PubMed] [Google Scholar]
- Sacerdoti D, Gatta A, McGiff JC. Role of cytochrome P450-dependent arachidonic acid metabolites in liver physiology and pathophysiology. Prostaglandins and Other Lipid Mediators. 2003;72(1–2):51–71. doi: 10.1016/S1098-8823(03)00077-7. [DOI] [PubMed] [Google Scholar]
- Schmitz G, Ecker J. The opposing effects of n-3 and n-6 fatty acids. Progress in Lipid Research. 2008;47(2):147–155. doi: 10.1016/j.plipres.2007.12.004. [DOI] [PubMed] [Google Scholar]
- Schwab JM, Serhan CN. Lipoxins and new lipid mediators in the resolution of inflammation. Current Opinion in Pharmacology. 2006;6(4):414–420. doi: 10.1016/j.coph.2006.02.006. [DOI] [PubMed] [Google Scholar]
- Sellers MM, Stallone JN. Sympathy for the devil: the role of thromboxane in the regulation of vascular tone and blood pressure. American Journal of Physiology: Heart and Circulatory Physiology. 2008;294(5):H1978–H1986. doi: 10.1152/ajpheart.01318.2007. [DOI] [PubMed] [Google Scholar]
- Serhan C, Arita M, Hong S, Gotlinger K. Resolvins, docosatrienes, and neuroprotectins, novel omega-3-derived mediators, and their endogenous aspirin-triggered epimers. Lipids. 2004;39(11):1125–1132. doi: 10.1007/s11745-004-1339-7. [DOI] [PubMed] [Google Scholar]
- Serhan CN, Gotlinger K, Hong S, Lu Y, Siegelman J, Baer T, et al. Anti-inflammatory actions of neuroprotectin D1/protectin D1 and its natural stereoisomers: Assignments of dihydroxy-containing docosatrienes. The Journal of Immunology. 2006;176(3):1848–1859. doi: 10.4049/jimmunol.176.3.1848. [DOI] [PubMed] [Google Scholar]
- Snel J, Born L, Van Der Meer R. Dietary fish oil impairs induction of g-interferon and delayed-type hypersensitivity during a systemic Salmonella enteritidis infection in rats. APMIS. 2010;118(8):578–584. doi: 10.1111/j.1600-0463.2010.02630.x. [DOI] [PubMed] [Google Scholar]
- Spector AA. Arachidonic acid cytochrome P450 epoxygenase pathway. Journal of Lipid Research. 2009;50(Supplement):S52–S56. doi: 10.1194/jlr.R800038-JLR200. [DOI] [PMC free article] [PubMed] [Google Scholar]
- Ueda N, Tsuboi K, Uyama T. Enzymological studies on the biosynthesis of N-acylethanolamines. Biochimica et Biophysica Acta (BBA): Molecular and Cell Biology of Lipids. 2010;1801(12):1274–1285. doi: 10.1016/j.bbalip.2010.08.010. [DOI] [PubMed] [Google Scholar]
- Varga K, Wagner JA, Bridgen DT, Kunos G. Platelet- and macrophage-derived endogenous cannabinoids are involved in endotoxin-induced hypotension. FASEB Journal. 1998;12(11):1035–1044. doi: 10.1096/fasebj.12.11.1035. [DOI] [PubMed] [Google Scholar]
- von Schacky C, Fischer S, Weber PC. Long-term effects of dietary marine omega-3 fatty acids upon plasma and cellular lipids, platelet function, and oxylipin formation in humans. The Journal of Clinical Investigation. 1985;76(4):1626–1631. doi: 10.1172/JCI112147. [DOI] [PMC free article] [PubMed] [Google Scholar]
- Wood JT, Williams JS, Pandarinathan L, Janero DR, Lammi-Keefe CJ, Makriyannis A. Dietary docosahexaenoic acid supplementation alters select physiological endocannabinoid-system metabolites in brain and plasma. Journal of Lipid Research. 2010;51(6):1416–1423. doi: 10.1194/jlr.M002436. [DOI] [PMC free article] [PubMed] [Google Scholar]
Associated Data
This section collects any data citations, data availability statements, or supplementary materials included in this article.