

Abstract
The recently developed ribosome profiling technique (Ribo-Seq) allows mapping of the locations of translating ribosomes on mRNAs with subcodon precision. When ribosome protected fragments (RPFs) are aligned to mRNA, a characteristic triplet periodicity pattern is revealed. We utilized the triplet periodicity of RPFs to develop a computational method for detecting transitions between reading frames that occur during programmed ribosomal frameshifting or in dual coding regions where the same nucleotide sequence codes for multiple proteins in different reading frames. Application of this method to ribosome profiling data obtained for human cells allowed us to detect several human genes where the same genomic segment is translated in more than one reading frame (from different transcripts as well as from the same mRNA) and revealed the translation of hitherto unpredicted coding open reading frames.
The human genome, containing slightly more than 20,000 protein coding genes (Clamp et al. 2007), generates a substantially more diverse proteome by encoding more than one protein in a single gene. The proteome is diversified through a number of molecular mechanisms that alter the sequence of the main gene product, such as alternative splicing (Matlin et al. 2005), RNA editing (Kiran and Baranov 2010; Wulff et al. 2011), utilization of alternative translation initiation sites (Ingolia et al. 2011; Ivanov et al. 2011), and post-translational modifications (Mann and Jensen 2003). However, in addition to modifications of existing protein sequences, examples are known where the same genomic region codes for entirely different protein sequences. This occurs when it is decoded in alternative reading frames, a phenomenon known as dual coding. Dual coding hampers the evolutionary flexibility of nucleotide sequences (Firth and Brown 2006; Rancurel et al. 2009). Consequently, it is expected to be rare in genomes with weakly constrained size, and indeed, it is currently considered to be atypical. Nonetheless, comparative sequence analysis provides growing evidence that multiple instances of dual decoding do occur in humans (Liang and Landweber 2006; Chung et al. 2007; Ribrioux et al. 2008). Here we present a method that facilitates the detection of dual decoding instances in human using data obtained by the recently developed ribosome profiling technique (Ingolia et al. 2009; Guo et al. 2010).
Ribosome profiling is based on the isolation of mRNA fragments protected by ribosomes followed by massively parallel sequencing of cDNA libraries derived from the ribosome protected fragments (RPFs). The technique allows mapping the locations of translating ribosomes on the entire set of mRNA molecules produced under given physiological conditions, thus providing a unique opportunity to obtain quantitative genome-wide information on protein synthesis (GWIPS) (Weiss and Atkins 2011).
This is important since protein abundance is mainly regulated at the level of protein biosynthesis (Schwanhausser et al. 2011). The area of GWIPS is rapidly growing. Since the publication of the technique in 2009 (Ingolia et al. 2009), an increasing number of studies have been carried out using the ribosome profiling technique (Guo et al. 2010; Ingolia et al. 2011; Oh et al. 2011; Stadler and Fire 2011; Brar et al. 2012; Reid and Nicchitta 2012).
When RPF sequences are aligned to mRNA, a characteristic triplet periodicity can be observed for the locations of the 5′ ends of the RPFs. Such triplet periodicity was observed in ribosome profiling experiments carried out in both yeast (Ingolia et al. 2009) and human cells (Guo et al. 2010).
The triplet periodicity observed in human cells (HeLa) is illustrated in Figure 1A. This periodicity occurs because ribosomes move not by one, but by three nucleotides, one codon at a time. As a result when RPFs are aligned to mRNA sequences, the majority of RPF 5′ ends align at a specific distance from the first nucleotide of the A-site codon of the elongating ribosome. Allowing 15 nt for the distance from the decoding center to the 5′ end of an RPF (Guo et al. 2010), the RPFs align predominantly to either the first or the third positions of the A-site codon, as can be seen in Figure 1A. The second position has the lowest proportion of matching RPFs. Thus, the phase of the triplet periodicity can be used as a signature of one of the three potentially translated reading frames. Therefore, by analyzing the periodicity of aligned RPFs, it is possible to determine the frame that is being translated.
Figure 1.

Utilization of triplet periodicity for detecting translated reading frames. (A) A plot of the number of RPFs aligning to particular mRNA positions between the 30th and the 47th nucleotide downstream from the start codon aggregated over 6000 human RefSeq mRNAs. In each codon, subcodon position 2 is shown as a red bar, while subcodon positions 1 and 3 are shown as blue and green bars, respectively. (B) A schematic representation of the generation of a subcodon profile from the corresponding RPF profile. Each subcodon position (blue indicates 1; red, 2; green, 3) is shown on separated plots. (C) The absolute number of RPFs aligning to each subcodon position is shown for the coding region of human Antizyme 1 (OAZ1) mRNA. The location of the programmed ribosomal frameshift site is indicated by a broken black line. (D) The distribution of the number of RPFs aligning to different subcodon positions, upstream of the frameshift site (left) and downstream (right). It can be seen that the subcodon position with the lowest RPF count shifts from the second to the third upon ribosomal frameshifting.
From the aligned RPFs for each mRNA transcript, the subcodon profile can be generated to determine the translated reading frame. A schematic representation of how a subcodon profile is generated is given in Figure 1B. Subcodon position 2 typically has the lowest number of RPFs, and this feature can be used as a signature for detecting which out of the three reading frames is being translated. Moreover, this feature can be used for detecting shifts between reading frames, such as the one known to occur in the expression of human ornithine decarboxylase antizyme 1 (OAZ1) gene (Matsufuji et al. 1995). The OAZ1 mRNA subcodon profile is shown in Figure 1C. It can be seen that when RPF counts are separated by their subcodon positions (phased relative to the start codon) (Fig. 1D), there is a transition between the proportions of RPFs aligning to each position. While the second position has the lowest number of RPFs upstream of the frameshift site, it is the third position that has the lowest number of RPFs downstream from the frameshift site. This is consistent with the +1 directionality of the ribosomal frameshifting (the second coding ORF in the OAZ1 mRNA is in the +1 frame relative to the first ORF).
To find other mRNA sequences where reading phase transitions occur, we developed a computational approach for the analysis of subcodon profiles. This method exploits the subcodon RPF periodicity signature to identify mRNA transcripts with putative reading frame transitions. Application of this method to a number of human mRNAs for which ribosome profiling data are available allowed us to detect dually coding regions of the human genome, where the same nucleotide sequence is used to encode protein sequences in more than one reading frame.
Results
Periodicity Transition Score (PTS)
The most intuitive approach for determining the reading frame would be a sliding window to monitor the transition of the lowest proportion from one subcodon position to another. However, our empirical investigation of such an approach demonstrated that it is impractical for the type of data currently generated by the ribosome profiling technique (see Supplemental Figs. S1, S2). This is largely due to the high nonuniformity of the RPF distribution. While certain coding locations of mRNAs have a large number of aligning RPFs, the majority of mRNA coordinates have no RPFs aligning to them. In the top 10 expressed genes (Fig. 2A, left), ∼16% of CDS codons have no RPFs aligning to them. This increases to just over 63% when we expand the pool to the top 1000 expressed genes (Fig. 2A, right). On the other hand, ∼24% of the top 10 expressed genes have CDS codons where over 100 RPFs align, while <2% of the top 1000 expressed genes have CDS codons where over 100 RPFs align. This heterogeneity may arise from biases introduced during the experimental protocol, oligonucleotide adapter ligations to the 3′ and 5′ ends of short reads for cDNA library preparation introduce biases that may result in the overrepresentation or underrepresentation of some RPFs (Hafner et al. 2011), but also very likely reflects authentic features of translation. Certain locations are translated significantly slower than other mRNA locations (Ingolia et al. 2011). For example, according to the ramp hypothesis (Tuller et al. 2010a), there is an evolutionary selection for slowly decoded codons at the beginning of coding regions, resulting in a relatively higher density of RPFs (Tuller et al. 2010b). Other regions, where ribosomes move quickly, would have insufficient coverage. In addition, we have observed occasional single isolated RPF peaks in subcodon profiles for the second subcodon position. Occurrences of such peaks in regions with otherwise no RPF coverage result in false positives. Such peaks are not necessarily artifacts of the ribosome profiling method but may reflect authentic features of translation. In such locations, it is possible that the size of the region covered by the ribosome may differ from the average due, for example, to specific interactions with components of the ribosome inside the mRNA channel, leading to the generation of peaks that are not consistent with the average periodicity.
Figure 2.

Computational approach for detecting transitions between reading frames and their performance on simulated dual coding. (A) Segments of pie charts represent the number of CDS codons with the specific number of RPFs aligning to them for the top 10 (left) and for the top 1000 (right) most covered mRNAs from the Guo et al. (2010) data set. It can be seen that, even for the most RPF-covered mRNAs, many CDS codons have no RPFs aligning to them. (B) Calculation of cumulative RPF subcodon proportion differences (CSCPD) upstream of and downstream from a sliding point x. Position a represents the annotated CDS start, while position b denotes the annotated CDS stop. Vertical lines represent RPFs that align at given CDS coordinates. (C) Principle of the automated scoring scheme, Periodicity Transition Score (PTS). PTS is calculated as the area (shaded in pink) where CSCPD over the examined CDS exceeds the expected level as estimated from the 95th quantile CSCPDs of the 1000 mRNA transcripts with the highest RPF coverage. For details, see Results. (D) Boxplots representing the distributions of PTS scores (y-axis) obtained for real ribosome profiles for mRNAs with artificially introduced frameshifts at different locations relative to the ends of CDS (x-axis). (E) Distribution of PTS for ribosome profiles on simulated mRNAs containing simultaneously translated dual coding regions of different lengths. The simulations were carried out for three sets of mRNAs with different RPF density as indicated in the figure. The shaded areas represent the lower and upper quartile intervals for each RPF density. (F) Distribution of PTS for simulated mRNAs containing dual coding regions with varying densities of RPFs in the alternative frame. Shading is as in E.
To overcome the problems of profile heterogeneity and local RPF length nonuniformity, we devised a different approach to assess whether a transition between frames exists in the ribosome profile of a particular mRNA. The approach is based on a sliding point where cumulative proportions of RPFs aligning with particular subcodon positions are calculated upstream of and downstream from this point as described below (see Fig. 2B).
For a protein coding region between coordinate a and coordinate b, we can represent a ribosome profile as an array of the number of RPFs aligning their 5′ ends to a particular position, for example, (fa, fa+1, fa+2 … fb-2, fb-1, fb). For each coordinate x within the CDS, the proportion of RPFs corresponding to a particular codon position is calculated for the upstream qu and the downstream qd regions as follows:
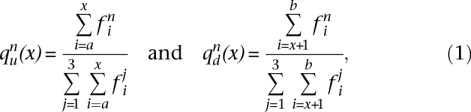 |
where n indicates a position (1, 2, or 3) within a codon relative to the first nucleotide of the start codon. We define the cumulative subcodon proportion difference (CSCPD) as the absolute difference between the upstream and downstream proportions:
The approach is advantageous in that it increases the size of the informative region while the effect of false signals generated by isolated RPFs is reduced.
The statistical confidence of the CSCPD estimation is low when x is close to a or b due to the limited number of RPFs in either the upstream or the downstream region. To account for this, we computed the CSCPD curves for each of the 1000 mRNAs with the highest number of RPFs from the Guo et al. (2010) data set and used the 95th percentile for each subcodon position as a threshold over the length of the CDS. To address the differences in CDS lengths, the CDS coordinates of each mRNA were normalized into their relative positions within the CDS, where the length of the CDS is considered to be 1 (each CDS coordinate is divided by the total length of the coding region with the start taken as 0.0 and the stop as 1.0). Each CSCPD curve is evaluated at 100 equi-spaced normalized CDS positions between 0 and 1 using smoothing spline interpolation. A pointwise 95% confidence envelope for each subcodon position (C1, C2, C3) was then obtained from the 95th percentiles of the 1000 CSCPDs at each normalized CDS position (see Fig. 2C; Supplemental Fig. S3).
Under ideal conditions for detecting a frame transition (high coverage and uniform distribution of RPFs with the second subcodon position counts being higher than the first and the third subcodon position counts), there should be a local point at which the CSCPD reaches its maximum, and such a point should correspond to the location of the frame transition (see Supplemental Material section entitled Testing PTS on Simulated Dual Coding Sequences).
Thus, we used the area of CSCPD excess over the 95th percentiles for each subcodon position. The Periodicity Transition Score (PTS) is calculated as the sum of excess areas for each subcodon position (PTS1, PTS2, PTS3) (Fig. 2C). An example of a PTS plot for an mRNA with a known case of programmed ribosomal frameshifting (human Antizyme 1 mRNA) is shown in Supplemental Figure S4.
To determine the threshold of PTS that can be used as an indicator of a frame transition in an mRNA, we calculated the PTS scores for a random 1000 mRNAs from the pool of 6000 most-covered genes (but outside of the pool of genes used for the 95th percentile calculations) and compared them with the PTS scores obtained for the same 1000 mRNAs, after introducing single nucleotide deletions to mimic translational frame transitions at different locations in the mRNA. The results of these comparisons are shown in Figure 2D. It can be seen that before introducing an artificial frameshift, the majority of mRNAs have a PTS below 10. Since it is expected that some of the 1000 mRNAs may have naturally occurring transitions, we decided to use a PTS of 10 as the threshold for selecting the candidates reported in this study. As can be seen from Figure 2D, when using a PTS threshold of 10, the potential false-negative rate is higher if a reading frame transition occurs closer to either end of the coding region than if the transition occurs closer to the middle of the main reading frame. To estimate the P-value for transcripts with a PTS score of 10 and higher, we permuted the RPF densities of the 1000 most highly expressed transcripts and generated 1 million artificial transcripts (for details, see Supplemental Material). Transcripts with a PTS equal to or higher than 10, were considered as false positives. This yielded a P-value of 0.057. After removing cases where subcodon positions 1 and 3 contribute to a high PTS with no contribution from subcodon position 2 (see section Further Refinements of PTS), the re-estimated P-value for a PTS of 10 or higher, drops to 0.0084.
The above simulations of dual coding regions addresses a simple case, where the transition between alternative frames occurs at a specific location and all ribosomes continuing translation shift their reading frame. Such a situation occurs in the case of ribosomal frameshifting in OAZ1 mRNA (Fig. 1C,D). However, with other examples of dual coding, certain sequence segments could be translated in two alternative frames. To explore how PTS performs on such cases of dual coding and how different features of dual coding affect PTS, we carried out additional simulations that are described in the Supplemental Material section Testing PTS on Simulated Dual Coding Sequences. Figure 2, E and F, shows how PTS depends on features of dual coding, such as the length of the overlapping region and the density (absolute and relative) of RPFs.
Further refinements of PTS
After the PTS had been computed for a set of mRNAs for which ribosome profiles are available, it appeared that the PTS performs well in predicting mRNAs with reading frame transitions. For example, two known cases of ribosomal frameshifting (OAZ1 [Matsufuji et al. 1995] and PEG10 [Shigemoto et al. 2001; Manktelow et al. 2005]) had PTS scores among the highest 10.
However, a large source of false-positive cases (from manual examination) was found in situations where the PTS is high due to mutual fluctuations in the proportions of RPFs corresponding to the first and the third subcodon positions, with the second position proportion unaffected. That is, PTS2, calculated for the second position alone, is low. In our experience, the profiles containing bona fide transitions (either known or artificially introduced) always result in a high PTS2, along with an increase in either PTS1 or PTS3. This is because the number of RPFs aligning to subcodon position 2 increases as a result of the transition in the reading frame. Correspondingly, the number of RPFs aligning to subcodon position 1 or 3, depending on whether the alternative frame is +1 or −1, decreases. Therefore, in this work, all mRNA sequences with PTS2 lower than both PTS1 and PTS3 were removed without further analysis.
In addition, our empirical manual analysis revealed many false positives with less than 100-or-so RPF locations per mRNA. Therefore we decided to apply an additional filter—the minimal number of RPF locations required in subcodon position 2—to reduce the false-discovery rate. We found that 12 RPF locations or more in subcodon position 2 greatly reduced the inclusion of false positives. To reduce the effect of single high peaks in subcodon position 2 contributing to a high PTS, we removed the highest RPF peak in position 2 and recalculated PTS for each candidate. We then used this corrected PTS to score the candidates (see Supplemental Table S1).
Yet further manual examination of profiles revealed that a high PTS can occur for an mRNA transcript whose profiles are inconsistent with the behavior expected in the case of a frame transition. The most prominent example of how a high PTS could be generated for an mRNA without a transition is the existence of a single isolated peak of RPFs corresponding to a second position within a codon. As discussed earlier, such peaks do not necessarily reflect fluctuations in the noise of the technique but could be due to a systematic alteration of RPF length in a local region in a sequence-dependent manner. However, irrespective of the origin of such peaks, they significantly contribute to the PTS and generate a large number of false positives in our analysis.
Dual coding genomic sequences
Manual evaluation of subcodon profiles allowed us to categorize these candidates into six groups as outlined in Figure 3A. The functional categories illustrated in Figure 3B include (1) instances where dual coding occurs due to overlaps between regulatory upstream ORFs (uORFs) and main protein coding ORFs (pORFs); (2) overlaps between pORFs and nonupstream ORFs (nORFs); and (3) transcript variants generated as a result of alternative transcription initiation or alternative splicing.
Figure 3.

Classification of dual coding regions. (A) Classification and PTS of 108 candidates. (B) Schematic organization of three major classes of dual coding. pORFs are shown as light blue bars and alternative frames as light pink bars. Splicing organization: green bars correspond to exons included in transcript variants, and lines indicate intronic regions excised during splicing.
The second class of dual coding is the most surprising, as translation of uORFs and dual coding due to alternative splicing has been documented previously. Fifteen mRNAs in our set were classified as containing non-upstream protein coding ORFs (nORFs) (see Fig. 3A; Supplemental Table S1). The subcodon profile of the top-scoring nORF, neuronal transcription factor NPAS2 (RefSeq mRNA NM_002518), is shown in Figure 4A (left panel) and Supplemental Figure S15. This candidate has RPFs aligning in an alternative ORF that is located close to the 5′ UTR. Comparative analysis of the genomic sequences revealed absence of stop codons in the alternative ORF in 22 of the 23 available vertebrate NPAS2 orthologs (see alignments in Fig. 4C). The exact sequence in the vicinity of the predicted start codon is CTAATGGATGAAGATGAGAA (where ATG codons are shown in bold, the predicted pORF start codon is also in italics, and the alternative frame start codons are underlined; for simplicity and consistency, we use T to denote both uridines and thymidines here and elsewhere). It is plausible that start codons in such close proximity to each other compete for initiation (Matsuda and Dreher 2006), and therefore, the role of the alternative ORF may be regulatory. It would be very interesting to investigate a potential relationship between such regulation and a function of NPAS2 as a part of a molecular clock in the human brain (Reick et al. 2001). A somewhat similar situation of competing initiator ATG codons is observed in initiation factor EIF4E2 mRNA (Refseq NM_004846) (see Supplemental Fig. S17). Such a competition could be regulated by changes in the stringency of start codon selection, which has been shown to be mediated by EIF1 and EIF5 factors (Loughran et al. 2011).
Figure 4.

Dual coding in NPAS2 mRNA due to the presence of a translated nonupstream ORF and in THAP7 mRNA due to the overlap of the main ORF with an uORF. (A) Subcodon profile (top three rows) and mRNA-seq (fourth row) for NPAS2 mRNA (left; NM_002518) and THAP7 mRNA (right; NM_001008695). CDS coordinates are marked with dotted vertical lines. (B) ORF organization of NPAS2 mRNA (left) and THAP7 mRNA (right). The three reading frames are indicated as 1, 2, 3. Blue vertical lines indicate stop codons and start codons are indicated in red. Annotated CDS is shaded in light blue. The areas where translation in alternative frames is detected are shaded in light pink. (C) Comparative analysis of orthologous genomic sequences from 23 vertebrate species for NPAS2 (left) and from 19 vertebrate species for THAP7 (right). Colored bars represent codon substitutions within multiple sequence alignments for the standard (top) and alternative (bottom) reading frames (detailed alignments are in Supplemental Figs. S121, S122). Dark green and light green boxes correspond to synonymous and positive (in the BLOSUM62 matrix) substitutions, respectively; red boxes correspond to negative (in BLOSUM62 matrix) nonsynonymous substitutions. Gaps are shown in yellow and stop codons are in black. Stop codons are also aggregated across the entire alignment beneath each bar. Plots of coding likelihood are shown underneath the colored bars for both reading frames as calculated with MLOGD. Synonymous position conservation for the standard translation phase (pORF) is shown above the colored bar. (D) Exon organization of the NPAS2 locus (left) and the THAP7 locus (right). CCDS and RefSeq gene tracks from the UCSC Genome Browser are shown in green and blue bars, respectively. Alternatively decoded regions are indicated in red.
Among all nORF candidates, about one-half are situated entirely within the corresponding pORF (nested nORFs), while the other half extend into the 3′ UTRs.
The largest class of dual coding genomic sequences (29 instances) corresponds to regulatory uORFs overlapping pORFs. The profile of the highest scoring uORF candidate, transcription suppressor THAP7 mRNA, is shown in Figure 4A (right panel) and Supplemental Figure S50. A significantly higher density of RPFs is observed in the region of the uORF that overlaps the pORF. Interestingly, the highest peak of RPF density is situated near the stop codon of the uORF. Perhaps ribosomes stall at the end of this uORF in a manner similar to the well-established ribosome stalling mediated by the MAGDIS peptide encoded by the uORF in S-adenosylmethionine decarboxylase (AMD1) (Hill and Morris 1993) or by a specific mRNA-binding protein as in the regulation of the MSL2 mRNA by Sex lethal (Medenbach et al. 2011). Comparative sequence analysis of available THAP7 orthologs from the genomes of 19 vertebrates (Fig. 4C, right) suggests that the amino acid sequence of the THAP7 uORF evolved faster than the protein sequence encoded in the same region by the pORF frame. However, none of the sequences from other vertebrates contain stop codons within the region corresponding to the THAP7 uORF. Moreover, the position of the uORF stop codon is almost universally conserved among the analyzed orthologs. This points to the evolutionary significance of this uORF and suggests that the significance of its translation may be mainly regulatory rather than for the production of a functional protein product. It also highlights the limitations of dual coding detection by comparative sequence analysis, since alternatively translated regions do not necessarily evolve under the same evolutionary constraints as protein coding regions.
In nearly half of the detected translated uORFs, we failed to find suitable ATG codons for initiation of uORF translation. This could be either due to non-ATG initiation (Ingolia et al. 2009, 2011; Ivanov et al. 2011), incompleteness of the corresponding RefSeq mRNA at the 5′ end, or differences among alternative splice variants in the 5′ UTR.
Another source of dual coding in the human genome is alternative splicing (Liang and Landweber 2006). Some transcript variants contain sequences originated from the same genomic loci, but in different translational phases relative to the initiation codon. An established case where the same exon is translated in two alternative frames is the CDKN2A (also known as INK4a) (Quelle et al. 1995) gene. Among our candidates, we have identified 16 instances of dual coding that can be attributed to alternative splicing events or to initiation of transcription at alternative starts (see Supplemental Table S1). The top-scoring candidate among identified cases is C11orf48 (Fig. 5; Supplemental Fig. S67). The majority of RPFs for C11orf48 mRNA, are located at the end of the predicted RefSeq pORF and extend into the 3′ UTR (Fig. 5A). Examination of mRNA-seq reads for C11orf48 revealed that mRNA-seq density is increased in the area of the alternatively decoded region (Fig. 5A, pink area). This indicates that the RPFs are likely to originate from the translation of additional transcripts whose sequences are not included in the RefSeq database. Indeed, such a transcript exists among Ensembl transcripts (accession number ENST00000524958). The subcodon profile that has been generated for ENST00000524958 and the distribution of RPFs is consistent with the CDS predicted for that transcript (Fig. 5A, right). Additional independent evidence that the area of high RPF density encodes a protein product in an alternative frame corresponding to ENST00000524958 transcript is provided by evolutionary analysis. The multiple alignment of genomic sequences corresponding to the C11orf48 orthologs from 15 vertebrate species is shown in Figure 5C. It can be seen that codon substitutions in the area with high RPF density are consistent with purifying selection acting on ENST00000524958 CDS, which is in the +1 frame relative to RefSeq CDS. Also, it can be seen that conservation of synonymous positions in pORF codons (0 frame) are markedly elevated for the region corresponding to high RPF density. Strikingly, it can also be seen that conservation, positive coding likelihood, and a lack of stop codons in the +1 frame are observed only for the short region with high RPF coverage and not for the full ORF. Moreover, Oyama et al. (2007) has detected expression of this alternative protein using mass spectrometry. Thus, the C11orf48 locus is an example of a situation where the same genomic sequence is simultaneously translated in different frames in two alternative transcripts that coexist in HeLa cells.
Figure 5.

Dual coding in C11orf48 locus. (A) Subcodon profile and mRNA-seq for RefSeq mRNA NM_024099 (left) and predicted Ensembl transcript ENST00000524958 (right). (B) ORF organization of NM_024099 mRNA (left) and ENST00000524958 (right). (C) Comparative sequence analysis of corresponding genomic alignments from 15 vertebrate species for RefSeq mRNA NM_024099. (D) Exon organization of the C11orf48 locus. For detailed description, see legend to Figure 4. The higher density of mRNA-seq reads for NM_024099 (fourth row panel A, left) in the shaded pink area indicates that RNA-seq reads are being generated from an additional transcript variant corresponding to Ensembl transcript ENST00000524958. In panel C, it can be seen that for most of the predicted CDS, codon substitutions are consistent with RefSeq CDS predictions (the area is greener in the zero-frame). However, for the pink shaded area, substitutions are consistent with protein coding evolutionary signatures in the +1 frame. It can be seen that the coding likelihood for the +1 frame exceeds the threshold in the area of dual decoding. The conservation plot of synonymous codon positions, shown above the 0 frame, shows that conservation of synonymous positions is significantly higher in the shaded pink area. This is consistent with the purifying selection acting on protein coding sequences in two frames in this region.
The situation where two alternative transcripts coexist and are translated at the same time is not always the case. We also found situations where only one transcript is present in the cell under the given conditions. Such an example is PHPT1 mRNA (sixth top in Supplemental Table S1), which is illustrated in Figure 6 and Supplemental Figure S60. The PHPT1 gene contains four exons. Two mRNA transcripts are known for this gene: NM_001135861 contains all four exons and encodes isoform 2 of PHPT1, while NM_014172 lacks the third exon and encodes isoform 3 of PHPT1. As a result of exon skipping, the 3′-terminal exon is positioned in different reading frames relative to the initiation codon in these two transcripts (Fig. 6D). The ribosome profile was initially built for the transcript with the longest isoform (see Methods). However it produced a high dual coding score because RPFs at the 3′ end of the CDS originate from the alternative transcript where this region is in a different frame. The analysis of RNA-seq fragments (Fig. 6A) shows the lack of fragments corresponding to the skipped exon, thus suggesting that only the short transcript is expressed in HeLa cells.
Figure 6.

Dual coding in alternatively spliced PHPT1 exon. (A) Subcodon profile and mRNA-seq for PHPT1 mRNA variant NM_001135861 (left) and variant NM_014172 (right). (B) ORF organization for NM_001135861 (left) and NM_014172 (right). (C) Analysis of codon substitutions within the multiple alignments of orthologous genomic sequences for NM_001135861. (D) Exon organization of the two PHPT1 mRNA variants. For notations, see legend to Figure 4. Subcodon profiles for variant NM_001135861 (panel A, left), which is the longest isoform (see Methods), indicate that while the translated frame is the same as the CDS for most of the CDS region (low RPFs density for the second [red] position), the sequence is translated in the +1 frame relative to the CDS frame at its end and downstream (pink shaded area). In addition, there is an evident gap in translation in the subcodon profile and mRNA-seq just prior to the pink shaded area, which corresponds to the third exon in PHPT1 mRNA variant NM_001135861 (panel D). As a result, the fourth exon in the NM_001135861 mRNA is in an alternative frame relative to the CDS start codon. Codon substitution analysis of multiple sequence alignments (panel C) is consistent with the dual decoding of the 5′ end of the fourth exon. Synonymous and positive nonsynonymous substitutions are predominant in both the zero and +1 frames in the locations where RPFs are found.
Although we were able to identify many dual coding regions, a number of mRNAs with a high PTS are false positives. Ribosome profiles of about a third of all candidates produced high scores for reasons other than dual translation. The most prominent example (fourth top in Supplemental Table S1) is a profile for the dystrophin DMD mRNA (RefSeq NM_004010). The subcodon profile for this mRNA (Supplemental Fig. S90) is inconsistent with dual decoding and scored highly due to the limitations of our computational technique (for details, see Supplemental Discussion). In addition to the 33 false-positive candidates, 13 candidates have subcodon profiles that suggest dual coding, but dual coding cannot be explained by their ORF organization. These unexplained cases are discussed in the Supplemental Discussion.
Discussion
Our work demonstrates the applicability of the ribosome profiling technique for the detection of translated reading frames in human mRNAs. This allowed us to identify a number of genomic loci that are being translated in more than one frame. An immediate simple question raised by this study is how many dually decoded regions are in the human genome. A primitive extrapolation of the number of cases identified among 6000 genes would indicate ∼1%. However, this is clearly an underestimate for the following reasons. First, RPF coverage for the majority of analyzed mRNAs is lower than what is required for detecting such regions. Second, the method allows dually coded regions to be detected only if the alternative frame has RPF coverage comparable to, or higher than, that of the standard frame (see Fig. 2E,F; Testing PTS on Simulated Dual Coding Sequences in the Supplemental Material). It is reasonable to expect that there are many cases where an alternative frame is translated less efficiently than the standard one. More sensitive statistical techniques coupled with deeper ribosome profiling are needed for the detection of such cases. Third, ribosome profiling experiments were carried out under particular conditions. Dual decoding is likely to be regulated. Therefore, only the standard frame may be translated under particular experimental conditions. Finally, it is likely that dual coding is more prevalent in low expressed genes, since highly expressed genes are optimized for efficient translation and their coding sequences are too restrained to accommodate additional coding information. The pool of genes analyzed in this study, however, is limited to highly expressed genes.
This is supported by comparison of our list of dual coding candidates with sets of genes that have been predicted as dual coding in previous studies. We have been able to identify reading frame switches in two (OAZ1 and PEG10) out of six known cases of programmed ribosomal frameshifting in humans (Bekaert et al. 2010), three of which did not have sufficient coverage by RPFs. Our method did not detect the well-established examples of dual coding: GNAS, XBP1 (Calfon et al. 2002), and CDKN2A (also known as INK4a) (Quelle et al. 1995). In the case of GNAS (Nekrutenko et al. 2005), the dual coding isoform was not expressed under the conditions of Guo et al. (2010). The XBP1 gene produced a high PTS, but failed to pass our additional filters (see Methods). The longest isoform of CDKN2A, which encodes the 16INK4a protein, had a low PTS and consequently did not appear in our final list of candidates. Among the 40 genes predicted in the Chung et al. (2007) study, transcripts from 12 are part of the 6000 pool that we have used. Three of these ARF-containing genes (DNMT3A, BBX, and RBAK) have a PTS > 10 but were removed from our final list of 108 genes by subsequent filters explained in Methods. Comparative sequence analysis of 29 mammalian genomes revealed 19 (12 sense and seven anti-sense) novel dual coding gene candidates, of which six (sense) were among the 6000 transcripts to which our method was applied (Lin et al. 2011). One of them, UBE2E2 (NM_152653), was identified as dual coding in our study. The discrepancies between our data set and previous predictions do not invalidate either predictions or our approach. It is possible that the translation of an alternative frame in previously described candidates does not occur in HeLa cells or occurs at a rate that is insufficient to be detected by our method.
The present study demonstrates that the coding and translational landscape of the human genome is more sophisticated than previously appreciated. Further development of high-throughput approaches for studying translation, combined with the growing power of comparative sequence analysis, provides an opportunity for obtaining quantitative information on the versatility of decoding and translation at the whole-cell level.
Methods
Analysis of 6000 human mRNAs
The predictive power of PTS depends on the number of RPFs that can be aligned to an mRNA sequence (see Supplemental section Testing PTS on Simulated Dual Coding Sequences). Therefore, we restricted our analysis to a limited set of mRNAs for which a comparatively high number of RPFs are available. We used the 6000 mRNA sequences with the highest RPF coverage from the data set that has been reported by Guo et al. (2010). We found that RPF coverage lower than that of the top 6000 is insufficient for statistically reliable determination of reading frames. Over 800 mRNA profiles scored above the PTS threshold. One hundred eight of these passed the filters described in the Results section. This set of mRNA profiles was analyzed manually using additional information in order to explain the predicted frame transitions for each case. The analysis involved manual examination of the ORF organization and examination of the subcodon profiles for the entire mRNA (as opposed to the analysis of just the previously annotated CDS region for the calculation of the PTS) in conjunction with “naked mRNA” profiles (RNA-seq). The analysis of the entire mRNA profile is required for those cases where an alternatively translated region corresponds to an ORF that overlaps the 5′ or 3′ end of the previously predicted CDS. In such situations, we expect RPFs to also occur outside the CDS region. Such a distribution can then be used as additional evidence that the high PTS results from dual translation. We also expect RPF subcodon proportions to be in accordance with the reading frame of the new ORF in the region in which it does not overlap with the main CDS. In addition, for a subset of cases, we examined multiple sequence alignments of corresponding genomic regions. The regions that are translated in alternative frames are expected to evolve under purifying selection with the ratio of nonsynonymous to synonymous substitutions being significantly below 1 for the amino acid sequences encoded in alternative frames. Also the regions of dual coding are expected to have elevated conservation at synonymous codon positions, since synonymous positions in one reading frame are nonsynonymous in the other. The details of the 108 mRNAs analyzed are given in Supplemental Table S1. For each mRNA sequence, we provide individual subcodon profiles and plots of ORF organization (Supplemental Figs. S9–S116).
There are several mechanisms that can be responsible for the dual decoding of the genomic regions identified in this work. The method described does not allow discrimination between these mechanisms. Our classification of individual cases into mechanistic categories is based on external information that we have obtained from public bioinformatics resources, and therefore, the validity of our predictions relies on what is available in those resources. For example, for a single mRNA variant we may observe the predicted CDS to be overlapped by a translated upstream ORF, and therefore, we would classify such a case as the translation of a uORF overlapping the main CDS. However, we cannot exclude the possibility that the ribosome profiles were derived from a different unreported splicing variant where the regions involved are joined together in such a way that the start codon of the uORF appears in frame with the previously predicted CDS, and therefore, all RPFs have been generated from a single ORF.
Generation of individual mRNA ribosome profiles
Short sequence reads (corresponding to RPFs) generated during ribosome profiling experiments in HeLa cells (Guo et al. 2010) were obtained from the NCBI Gene Expression Omnibus (accession GSE22004) (Edgar et al. 2002). The mRNA sequences for the top 6000 genes from quantification files were downloaded from the NCBI Refseq database (Pruitt et al. 2009) in fasta format in January 2011. Guo et al. (2010) quantification files comprise single RefSeq mRNA references for each gene where, for which genes with multiple isoforms, the longest isoform is chosen. To maximize the total number of RPFs for each gene, short reads from all available experiments in HeLa cells (SRR057511, SRR057512, SRR057516, SRR057517, SRR057521, SRR057522, SRR057526, SRR057529, SRR057532) were aggregated. The aggregated RPFs were then aligned, using the Bowtie short read aligner software package (Langmead et al. 2009). A seed region of the first 25 nt at the 5′ end was used according to the method described by Guo et al. (2010). However, we allowed zero mismatches in the seed region.
Individual mRNA subcodon profiles and ORF plots were then generated using custom Python and R scripts and the Biostrings package from the Bioconductor library (Gentleman et al. 2004). It has been shown previously that the distance between the 5′ end of an RPF and the position of the anticodon in the ribosomal A-site is ∼15 nt (Guo et al. 2010). Therefore, to generate subcodon profiles, each RPF was assigned to the mRNA coordinate corresponding to the 15th RPF nucleotide from the 5′ end. Thus subcodon profiles represent the locations of the A-sites of the translating ribosomes.
The CSCPD and PTS were computed using custom scripts in R according to the algorithms described in the Results section.
Comparative sequence analysis
MULTIZ (Blanchette et al. 2004) multiple alignments for vertebrate species were obtained from the UCSC Genome Browser (Fujita et al. 2011) and visualized with the aid of a cgi script (kindly provided by Mike Lin, CSAIL, MIT) and additionally processed with custom R scripts. Sequences containing long consecutive gaps (≥50 codons) were removed prior to the analysis. The coding likelihood for annotated CDS frames and alternative frames was quantified using MLOGD according to the method described previously (Firth and Brown 2006). Conservation at synonymous codon positions in annotated CDSs was computed according to the method described previously (Firth and Atkins 2009). Full MLOGD and synonymous substitution conservation plots for the examples described in the Results section of the manuscript are shown in Supplemental Figures S117 through S120.
Data access
The R scripts for computing the CSCPD and PTS are provided at the end of the Supplemental Material and are also available on http://lapti.ucc.ie/bicoding.
Acknowledgments
We thank Mike Lin (MIT) for providing us with the cgi script for visualization of codon substitutions in multiple alignments, and Avril Coghlan (UCC) for the R script for generating ORF plots. This work is supported by the Wellcome Trust (grant 094423) to P.V.B and J.F.A. We acknowledge financial support from Science Foundation Ireland to P.V.B. (06/IN.1/B81) and J.F.A. (08/IN.1/B1889). A.M.M. is supported by the IRCSET EMBARK Initiative. A.E.F. is supported by the Wellcome Trust (grant 088789).
Author contributions: N.T.I., J.F.A., and P.V.B conceived the study. A.M.M., K.R.C., and P.V.B. developed the method. A.M.M. carried out the analysis of the subcodon profiles. A.E.F. carried out the comparative sequence analysis. A.M.M. and P.V.B. interpreted the data and drafted the manuscript. All authors discussed the results and commented on the manuscript.
Footnotes
[Supplemental material is available for this article.]
Article published online before print. Article, supplemental material, and publication date are at http://www.genome.org/cgi/doi/10.1101/gr.133249.111.
Freely available online through the Genome Research Open Access option.
References
- Bekaert M, Firth AE, Zhang Y, Gladyshev VN, Atkins JF, Baranov PV 2010. Recode-2: New design, new search tools, and many more genes. Nucleic Acids Res 38: D69–D74 [DOI] [PMC free article] [PubMed] [Google Scholar]
- Blanchette M, Kent WJ, Riemer C, Elnitski L, Smit AF, Roskin KM, Baertsch R, Rosenbloom K, Clawson H, Green ED, et al. 2004. Aligning multiple genomic sequences with the threaded blockset aligner. Genome Res 14: 708–715 [DOI] [PMC free article] [PubMed] [Google Scholar]
- Brar GA, Yassour M, Friedman N, Regev A, Ingolia NT, Weissman JS 2012. High-resolution view of the yeast meiotic program revealed by ribosome profiling. Science 335: 552–557 [DOI] [PMC free article] [PubMed] [Google Scholar]
- Calfon M, Zeng H, Urano F, Till JH, Hubbard SR, Harding HP, Clark SG, Ron D 2002. IRE1 couples endoplasmic reticulum load to secretory capacity by processing the XBP-1 mRNA. Nature 415: 92–96 [DOI] [PubMed] [Google Scholar]
- Chung WY, Wadhawan S, Szklarczyk R, Pond SK, Nekrutenko A 2007. A first look at ARFome: Dual-coding genes in mammalian genomes. PLoS Comput Biol 3: e91 doi: 10.1371/journal.pcbi.0030091 [DOI] [PMC free article] [PubMed] [Google Scholar]
- Clamp M, Fry B, Kamal M, Xie X, Cuff J, Lin MF, Kellis M, Lindblad-Toh K, Lander ES 2007. Distinguishing protein-coding and noncoding genes in the human genome. Proc Natl Acad Sci 104: 19428–19433 [DOI] [PMC free article] [PubMed] [Google Scholar]
- Edgar R, Domrachev M, Lash AE 2002. Gene Expression Omnibus: NCBI gene expression and hybridization array data repository. Nucleic Acids Res 30: 207–210 [DOI] [PMC free article] [PubMed] [Google Scholar]
- Firth AE, Atkins JF 2009. A conserved predicted pseudoknot in the NS2A-encoding sequence of West Nile and Japanese encephalitis flaviviruses suggests NS1′ may derive from ribosomal frameshifting. Virol J 6: 14 doi: 10.1186/1743-422X-6-14 [DOI] [PMC free article] [PubMed] [Google Scholar]
- Firth AE, Brown CM 2006. Detecting overlapping coding sequences in virus genomes. BMC Bioinformatics 7: 75 doi: 10.1186/1471-2105-7-75 [DOI] [PMC free article] [PubMed] [Google Scholar]
- Fujita PA, Rhead B, Zweig AS, Hinrichs AS, Karolchik D, Cline MS, Goldman M, Barber GP, Clawson H, Coelho A, et al. 2011. The UCSC Genome Browser database: Update 2011. Nucleic Acids Res 39: D876–D882 [DOI] [PMC free article] [PubMed] [Google Scholar]
- Gentleman RC, Carey VJ, Bates DM, Bolstad B, Dettling M, Dudoit S, Ellis B, Gautier L, Ge Y, Gentry J, et al. 2004. Bioconductor: Open software development for computational biology and bioinformatics. Genome Biol 5: R80 doi: 10.1186/gb-2004-5-10-r80 [DOI] [PMC free article] [PubMed] [Google Scholar]
- Guo H, Ingolia NT, Weissman JS, Bartel DP 2010. Mammalian microRNAs predominantly act to decrease target mRNA levels. Nature 466: 835–840 [DOI] [PMC free article] [PubMed] [Google Scholar]
- Hafner M, Renwick N, Brown M, Mihailovic A, Holoch D, Lin C, Pena JT, Nusbaum JD, Morozov P, Ludwig J, et al. 2011. RNA-ligase-dependent biases in miRNA representation in deep-sequenced small RNA cDNA libraries. RNA 17: 1697–1712 [DOI] [PMC free article] [PubMed] [Google Scholar]
- Hill JR, Morris DR 1993. Cell-specific translational regulation of S-adenosylmethionine decarboxylase mRNA. Dependence on translation and coding capacity of the cis-acting upstream open reading frame. J Biol Chem 268: 726–731 [PubMed] [Google Scholar]
- Ingolia NT, Ghaemmaghami S, Newman JR, Weissman JS 2009. Genome-wide analysis in vivo of translation with nucleotide resolution using ribosome profiling. Science 324: 218–223 [DOI] [PMC free article] [PubMed] [Google Scholar]
- Ingolia NT, Lareau LF, Weissman JS 2011. Ribosome profiling of mouse embryonic stem cells reveals the complexity and dynamics of mammalian proteomes. Cell 147: 789–802 [DOI] [PMC free article] [PubMed] [Google Scholar]
- Ivanov IP, Firth AE, Michel AM, Atkins JF, Baranov PV 2011. Identification of evolutionarily conserved non-AUG-initiated N-terminal extensions in human coding sequences. Nucleic Acids Res 39: 4220–4234 [DOI] [PMC free article] [PubMed] [Google Scholar]
- Kiran A, Baranov PV 2010. DARNED: A DAtabase of RNa EDiting in humans. Bioinformatics 26: 1772–1776 [DOI] [PubMed] [Google Scholar]
- Langmead B, Trapnell C, Pop M, Salzberg SL 2009. Ultrafast and memory-efficient alignment of short DNA sequences to the human genome. Genome Biol 10: R25 doi: 10.1186/gb-2009-10-3-r25 [DOI] [PMC free article] [PubMed] [Google Scholar]
- Liang H, Landweber LF 2006. A genome-wide study of dual coding regions in human alternatively spliced genes. Genome Res 16: 190–196 [DOI] [PMC free article] [PubMed] [Google Scholar]
- Lin MF, Kheradpour P, Washietl S, Parker BJ, Pedersen JS, Kellis M 2011. Locating protein-coding sequences under selection for additional, overlapping functions in 29 mammalian genomes. Genome Res 21: 1916–1928 [DOI] [PMC free article] [PubMed] [Google Scholar]
- Loughran G, Sachs MS, Atkins JF, Ivanov IP 2011. Stringency of start codon selection modulates autoregulation of translation initiation factor eIF5. Nucleic Acids Res 40: 2898–2906 [DOI] [PMC free article] [PubMed] [Google Scholar]
- Manktelow E, Shigemoto K, Brierley I 2005. Characterization of the frameshift signal of Edr, a mammalian example of programmed −1 ribosomal frameshifting. Nucleic Acids Res 33: 1553–1563 [DOI] [PMC free article] [PubMed] [Google Scholar]
- Mann M, Jensen ON 2003. Proteomic analysis of post-translational modifications. Nat Biotechnol 21: 255–261 [DOI] [PubMed] [Google Scholar]
- Matlin AJ, Clark F, Smith CW 2005. Understanding alternative splicing: Towards a cellular code. Nat Rev Mol Cell Biol 6: 386–398 [DOI] [PubMed] [Google Scholar]
- Matsuda D, Dreher TW 2006. Close spacing of AUG initiation codons confers dicistronic character on a eukaryotic mRNA. RNA 12: 1338–1349 [DOI] [PMC free article] [PubMed] [Google Scholar]
- Matsufuji S, Matsufuji T, Miyazaki Y, Murakami Y, Atkins JF, Gesteland RF, Hayashi S 1995. Autoregulatory frameshifting in decoding mammalian ornithine decarboxylase antizyme. Cell 80: 51–60 [DOI] [PMC free article] [PubMed] [Google Scholar]
- Medenbach J, Seiler M, Hentze MW 2011. Translational control via protein-regulated upstream open reading frames. Cell 145: 902–913 [DOI] [PubMed] [Google Scholar]
- Nekrutenko A, Wadhawan S, Goetting-Minesky P, Makova KD 2005. Oscillating evolution of a mammalian locus with overlapping reading frames: An XLαs/ALEX relay. PLoS Genet 1: e18 doi: 10.1371/journal.pgen.0010018 [DOI] [PMC free article] [PubMed] [Google Scholar]
- Oh E, Becker AH, Sandikci A, Huber D, Chaba R, Gloge F, Nichols RJ, Typas A, Gross CA, Kramer G, et al. 2011. Selective ribosome profiling reveals the cotranslational chaperone action of trigger factor in vivo. Cell 147: 1295–1308 [DOI] [PMC free article] [PubMed] [Google Scholar]
- Oyama M, Kozuka-Hata H, Suzuki Y, Semba K, Yamamoto T, Sugano S 2007. Diversity of translation start sites may define increased complexity of the human short ORFeome. Mol Cell Proteomics 6: 1000–1006 [DOI] [PubMed] [Google Scholar]
- Pruitt KD, Tatusova T, Klimke W, Maglott DR 2009. NCBI Reference Sequences: Current status, policy and new initiatives. Nucleic Acids Res 37: D32–D36 [DOI] [PMC free article] [PubMed] [Google Scholar]
- Quelle DE, Zindy F, Ashmun RA, Sherr CJ 1995. Alternative reading frames of the INK4a tumor suppressor gene encode two unrelated proteins capable of inducing cell cycle arrest. Cell 83: 993–1000 [DOI] [PubMed] [Google Scholar]
- Rancurel C, Khosravi M, Dunker AK, Romero PR, Karlin D 2009. Overlapping genes produce proteins with unusual sequence properties and offer insight into de novo protein creation. J Virol 83: 10719–10736 [DOI] [PMC free article] [PubMed] [Google Scholar]
- Reick M, Garcia JA, Dudley C, McKnight SL 2001. NPAS2: An analog of clock operative in the mammalian forebrain. Science 293: 506–509 [DOI] [PubMed] [Google Scholar]
- Reid DW, Nicchitta CV 2012. Primary role for endoplasmic reticulum-bound ribosomes in cellular translation identified by ribosome profiling. J Biol Chem 287: 5518–5527 [DOI] [PMC free article] [PubMed] [Google Scholar]
- Ribrioux S, Brungger A, Baumgarten B, Seuwen K, John MR 2008. Bioinformatics prediction of overlapping frameshifted translation products in mammalian transcripts. BMC Genomics 9: 122 doi: 10.1186/1471-2164-9-122 [DOI] [PMC free article] [PubMed] [Google Scholar]
- Schwanhausser B, Busse D, Li N, Dittmar G, Schuchhardt J, Wolf J, Chen W, Selbach M 2011. Global quantification of mammalian gene expression control. Nature 473: 337–342 [DOI] [PubMed] [Google Scholar]
- Shigemoto K, Brennan J, Walls E, Watson CJ, Stott D, Rigby PW, Reith AD 2001. Identification and characterisation of a developmentally regulated mammalian gene that utilises −1 programmed ribosomal frameshifting. Nucleic Acids Res 29: 4079–4088 [DOI] [PMC free article] [PubMed] [Google Scholar]
- Stadler M, Fire A 2011. Wobble base-pairing slows in vivo translation elongation in metazoans. RNA 17: 2063–2073 [DOI] [PMC free article] [PubMed] [Google Scholar]
- Tuller T, Carmi A, Vestsigian K, Navon S, Dorfan Y, Zaborske J, Pan T, Dahan O, Furman I, Pilpel Y 2010a. An evolutionarily conserved mechanism for controlling the efficiency of protein translation. Cell 141: 344–354 [DOI] [PubMed] [Google Scholar]
- Tuller T, Waldman YY, Kupiec M, Ruppin E 2010b. Translation efficiency is determined by both codon bias and folding energy. Proc Natl Acad Sci 107: 3645–3650 [DOI] [PMC free article] [PubMed] [Google Scholar]
- Weiss RB, Atkins JF 2011. Molecular biology. Translation goes global. Science 334: 1509–1510 [DOI] [PubMed] [Google Scholar]
- Wulff BE, Sakurai M, Nishikura K 2011. Elucidating the inosinome: Global approaches to adenosine-to-inosine RNA editing. Nat Rev Genet 12: 81–85 [DOI] [PMC free article] [PubMed] [Google Scholar]