Abstract
The GTPase ADP-ribosylation factor-related protein 1 (ARFRP1) is located at the trans-Golgi compartment and regulates the recruitment of Arf-like 1 (ARL1) and its effector golgin-245 to this compartment. Here, we show that liver-specific knockout of Arfrp1 in the mouse (Arfrp1liv−/−) resulted in early growth retardation, which was associated with reduced hepatic insulin-like growth factor 1 (IGF1) secretion. Accordingly, suppression of Arfrp1 in primary hepatocytes resulted in a significant reduction of IGF1 release. However, the hepatic secretion of IGF-binding protein 2 (IGFBP2) was not affected in the absence of ARFRP1. In addition, Arfrp1liv−/− mice exhibited decreased glucose transport into the liver, leading to a 50% reduction of glycogen stores as well as a marked retardation of glycogen storage after fasting and refeeding. These abnormalities in glucose metabolism were attributable to reduced protein levels and intracellular retention of the glucose transporter GLUT2 in Arfrp1liv−/− livers. As a consequence of impaired glucose uptake into the liver, the expression levels of carbohydrate response element binding protein (ChREBP), a transcription factor regulated by glucose concentration, and its target genes (glucokinase and pyruvate kinase) were markedly reduced. Our data indicate that ARFRP1 in the liver is involved in the regulation of IGF1 secretion and GLUT2 sorting and is thereby essential for normal growth and glycogen storage.
INTRODUCTION
Whole-body glucose homeostasis is achieved through coordinating events of different tissues via hormonal, neuronal, and nutritional signals to protect the organism from irreparable damage (13). In this regulatory system, the liver plays a central role. In addition to its key role in metabolism, the liver is also a major site of the synthesis of plasma proteins and endocrine factors such as insulin-like growth factor 1 (IGF1), its binding proteins (IGFBPs), fetuin A, and ANGPTL4 and thereby influences whole-body metabolism and body growth (4, 26, 34, 37).
The monomeric GTPase ARF-related protein 1 (ARFRP1) (24) is a member of the family of ADP-ribosylation factors (ARFs) that operate as GTP-dependent molecular switches in the regulation of intracellular protein traffic and in Golgi function (14). ARFRP1 associates with trans-Golgi membranes (35) and controls the recruitment of ARL1 and golgin-245 to this compartment (21, 25, 35). In addition, ARFRP1 is required for E-cadherin processing and/or targeting to the cell surface (36). Due to related adhesion defects, conventional Arfrp1−/− embryos died during early gastrulation (20). In the intestinal epithelium, ARFRP1 is involved in the final lipidation of chylomicrons within the Golgi apparatus (11). Similarly, lipid droplet growth was impaired after adipose tissue-specific deletion of Arfrp1 which resulted in a lipodystrophic phenotype (8). Furthermore, Arfrp1−/− adipocytes showed a missorting and an insulin-independent targeting of GLUT4 to the plasma membrane (7). These results indicate an important role of ARFRP1 in the sorting and trafficking of specific proteins at the Golgi compartment and a possible role of ARFRP1 in hepatic glucose metabolism.
In order to define the role of ARFRP1 in hepatic glucose metabolism, we generated and characterized mice with a liver cell-specific deletion of Arfrp1 (termed Arfrp1liv−/− mice).
MATERIALS AND METHODS
Generation of Arfrp1liv−/− mice.
For disruption of Arfrp1 in the liver, homozygous floxed mice (Arfrp1flox/flox) (36), N10 generation, were crossed with transgenic mice expressing the Cre recombinase under the control of the albumin promoter/enhancer (Alb-Cre) (22). PCR-based genotyping of Arfrp1liv−/− mice was performed as described previously (8). All experiments were performed at the age of 5 weeks.
IGF1 treatment of mice was performed according to Tropea et al. (31), starting at 2 weeks after birth and continuing until the age of 5 weeks.
The animals were housed in a controlled environment (20 ± 2°C, 12 h/12 h light/dark cycle) and had free access to water and standard diet (V153x; Sniff, Soest, Germany). All animal experiments were approved by the ethics committee of the State Agency of Environment, Health and Consumer Protection (State of Brandenburg, Germany).
RNA preparation, cDNA synthesis, and qRT-PCR.
Total RNA from different tissues of mice was extracted, and cDNA synthesis was performed as described previously (1). For quantitative real-time PCR (qRT-PCR), a 7500 Fast real-time PCR system by Applied Biosystems (with 7500 software, version 2.0.1; Darmstadt, Germany,) and a TaqMan gene expression assay (Applied Biosystems) were applied. TaqMan gene expression assays are identified in Table 1. Data were normalized as described previously (18), whereas Eef2 expression (17) was used as an endogenous control.
Table 1.
TaqMan gene expression assays applied to determine mRNA expression levels by qRT-PCRa
| Gene symbol | Description | Assay no. |
|---|---|---|
| Ahsg | Alpha 2 HS glycoprotein fetuin A | Mm00442674_m1 |
| Alb | Albumin | Mm00500078_m1 |
| Arfrp1 | ADP-ribosylation factor related protein 1 | Mm01220415_g1 |
| Eef2 | Eukaryotic translation elongation factor 2 | Mm00833287_g1 |
| Foxa2 | Forkhead box A2 | Mm00839704_mH |
| Gck | Glucokinase | Mm00439129_m1 |
| Gys2 | Glycogen synthase 2 | Mm00523953_m1 |
| Hnf4a | Hepatic nuclear factor 4, alpha | Mm00433964_m1 |
| Igf1 | Insulin-like growth factor 1 | Mm00439560_m1 |
| Mlxipl | MLX interacting protein-like (ChREBP)b | Mm00498811_m1 |
| Onecut1 | One cut domain, family member 1 (hepatic nuclear factor 6-HNF6) | Mm00839394_m1 |
| Pck1 | Phosphoenolpyruvate carboxykinase (PEPCK) | Mm01247058_m1 |
| Pklr | Pyruvate kinase liver and red blood cell | Mm00443090_m1 |
| Pygl | Liver glycogen phosphorylase | Mm00500078_m1 |
| Slc2a1 | Solute carrier family 2 (facilitated glucose transporter), member 1 (GLUT1) | Mm00441473_m1 |
| Slc2a2 | Solute carrier family 2 (facilitated glucose transporter), member 2 (GLUT2) | Mm00446224_m1 |
TaqMan gene expression assay (Applied Biosystems, Darmstadt, Germany).
ChREBP, carbohydrate response element binding protein.
Body composition, glucose, insulin, and pyruvate tolerance tests.
Body composition and oral glucose tolerance tests (20% glucose solution by oral gavage; 10 μl/g body weight) were performed as described previously (1). For insulin tolerance tests, mice were fasted for 2 h, and insulin was injected intraperitoneally (i.p.) (0.25 U/kg of body weight). Blood glucose was determined before and at 15, 30, and 60 min after insulin application. Pyruvate tolerance tests were performed as described by Rodgers and Puigserver (23). Therefore, mice were starved overnight prior to receiving an i.p. administration of sodium pyruvate (2 g/kg of body weight; Sigma) to induce hepatic gluconeogenesis.
Plasma analysis.
Blood glucose levels were determined with a Glucometer Elite (Bayer, Leverkusen, Germany). Enzyme-linked immunosorbent assays (ELISAs) were used to quantify insulin (DRG Diagnostics, Marburg, Germany), insulin-like growth factor 1 (IGF1) in plasma and in liver lysates (mouse-IGF1, DY791; R&D Systems, Wiesbaden-Nordenstadt, Germany), and insulin-like growth factor binding protein 2 in plasma (mouse-IGFBP2, DY797; R&D Systems) and were applied according to the manufacturers' instructions.
Detection of hepatic glycogen.
Quantification of hepatic glycogen content was performed by photometric measurement. Pestled tissue samples were lysed with 1 M KOH and neutralized with concentrated acetic acid. Assay buffer (350 U/ml amyloglucosidase) was added and incubated overnight at 37°C. After centrifugation, glucose detection kit solution (Glucose Liquicolor; Human GmbH, Wiesbaden, Germany) was added to the supernatant, and the absorption was measured at 500 nm.
In vivo DOG transport.
In vivo glucose uptake into different peripheral organs was measured as described previously (15). Briefly, 2-deoxy-d-[14C]glucose ([DOG] 0.25 μCi/g body weight; Beckman Coulter, Germany) was added to a 20% glucose solution and given as a single oral bolus. Organs were excised after 2 h, weighed, and solubilized to determine incorporated radioactivity. In order to analyze basal glucose uptake, 2-deoxy-d-[14C]glucose (5 μCi) was injected into the tail vein of mice that were fasted for 2 h, and after 30 min tissues were collected. According to Sokoloff et al. (27) the uptake of deoxyglucose reflects glucose uptake due to their similarity in transport properties.
Histological analysis, immunohistochemistry, and antibodies.
Livers of Arfrp1flox/flox and Arfrp1liv−/− mice were fixed in 4% paraformaldehyde, dehydrated, and embedded in paraffin. Sections (2 μm) were stained with periodic acid-Schiff (PAS) or with hematoxylin and eosin. We used a polyclonal antiserum against ARFRP1 which was raised against two peptides (GGQEELQSLWDKYYAEC; CRNVHRPPRQRDIT) in guinea pig. The anti-GLUT2 antibody was used at a dilution of 1:20 for immunohistochemistry and at 1:1,500 for Western blotting; anti-GLUT1 antibody was used at 1:500 (both Santa Cruz). Anti-TGN38 (Serotec) was employed in a dilution of 1:100 for immunohistochemistry. Antiglucokinase antibody (H-88; Santa Cruz) was used at 1:500. Glycogen synthase and phosphorylated glycogen synthase (Ser641) (both Cell Signaling) were used at a concentration of 1:1,000. The antibody against ChREBP was purchased from Novus Biologicals and used at 1:1,000. For cell surface staining anti-N-cadherin was diluted 1:500 (BD Transduction Laboratories), and anti-insulin receptor beta antiserum was diluted 1:200 (Calbiochem). Nuclei were stained with TO-PRO 3 iodide. Glyceraldehyde-3-phosphate dehydrogenase (GAPDH; Ambion) was used at 1:10,000 as a loading control in Western blot analyses. Alexa Fluor 546-F(ab′)2 fragment of goat anti-rabbit IgG(H+L) or Alexa Fluor 488-F(ab′)2 fragment of goat anti-mouse IgG(H+L) (Molecular Probes) was used at a dilution of 1:200 as a secondary antibody. The primary antibodies were applied overnight at 4°C in a humid chamber. Subcellular distribution of proteins was visualized by fluorescence-conjugated secondary antibodies. The sections were analyzed with a Leica TCS SP2 Laser Scan inverted microscope.
Nuclear and cytoplasmic extraction of proteins for Western blot analysis was performed using a kit by Thermo Fisher Scientific (NE-PER; Bonn, Germany) according to the manufacturer's instructions.
Measurement of RQ.
To determine fuel utilization of animals, the respiratory quotient (RQ) was measured by indirect calorimetry and calculated by the ratio of CO2 produced to O2 consumed (PhenoMaster/LabMaster; TSE Systems, Bad Homburg, Germany). Airflow rate was set at 0.4 liters/min, and each animal was measured at least five times per hour. After adaptation to the system, animals were measured over two consecutive days.
Semiquantitative in vivo analysis of glucose oxidation by stable isotopes.
To measure in vivo glucose oxidation, 13CO2 breath tests of mice were performed as described previously (9).
Isolation and cultivation of primary hepatocytes.
Male C57BL/6 mice were anesthetized, and livers were perfused via the vena cava with perfusion buffer (Earle's balanced salt solution [EBSS] without CaCl2-MgCl2 [Gibco] supplemented with 50 mM EGTA), followed by digestion buffer (Hank's balanced salt solution [HBSS]; Gibco) supplemented with collagenase (0.3 mg/ml; Worthington Biochemical). After excision of the liver, hepatocytes were carefully released through slight pressure on the liver lobes. Then, the cell suspension was filtered through a 100-μm-pore-size mesh and separated by centrifugation through a Percoll gradient (Biochrom). Hepatocytes were seeded on 12-well collagen I-coated plates at a density of 3.5 × 10⁵ cells per well in Dulbecco's modified Eagle's medium (DMEM) containing 10% fetal bovine serum (FBS) and 1% penicillin-streptomycin (Gibco).
siRNA-mediated suppression of Arfrp1 in primary hepatocytes of C57BL/6 mice.
After the attachment of freshly isolated hepatocytes to the cell culture plate, medium was replaced by serum-free DMEM. Cells were transfected by overnight incubation with small interfering RNA (siRNA) oligonucleotides (1 nmol for 3.5 × 10⁵ cells; the sequence used for Arfrp1 is from reference 8; for Rab6, the sequence used was 5′-CCAAAGAGCUGAAUGUUAU-3′) (Thermo Scientific) and Lipofectamine 2000 (Invitrogen), according to the manufacturer's instructions. The next morning, medium was replaced by DMEM containing 10% FBS and 1% penicillin-streptomycin. Protein depletion was verified 72 h after transfection by quantitative real-time PCR and Western blotting. Secreted IGF1 was measured in cell supernatant by ELISA.
Data analysis.
Statistical differences were determined by a nonparametric Mann-Whitney-Wilcoxon test with significance levels set at P values of <0.05, <0.01, and <0.001. For larger sample sizes, normal distribution (Kolmogorov-Smirnov test) was tested, and data were analyzed by a Student's t test. Data are presented as means ± standard errors of the means (SEM). Statistical analysis was performed by SPSS (version 14.0; Chicago, IL), and SigmaPlot (version 10.0; Systat Software, Erkrath, Germany) was used for graphical presentation.
RESULTS
Growth retardation after liver-specific deletion of Arfrp1.
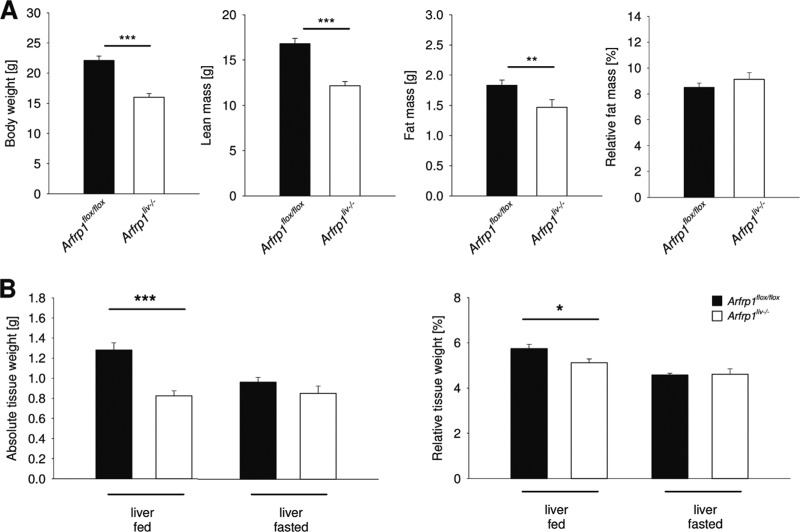
At birth, Arfrp1liv−/− mice (Fig. 1) were of normal size and were indistinguishable from Arfrp1flox/flox littermates. However, at the age of 5 weeks body weight of Arfrp1liv−/− mice was significantly lower (P < 0.001) (Fig. 2A); this was associated with both reduced fat (−20%; P < 0.01) and lean mass (−27.6%; P < 0.001) in comparison to Arfrp1flox/flox mice. The calculated relative fat mass (P = 0.582) was comparable between genotypes, indicating postnatal growth retardation of Arfrp1liv−/− mice.
Fig 1.
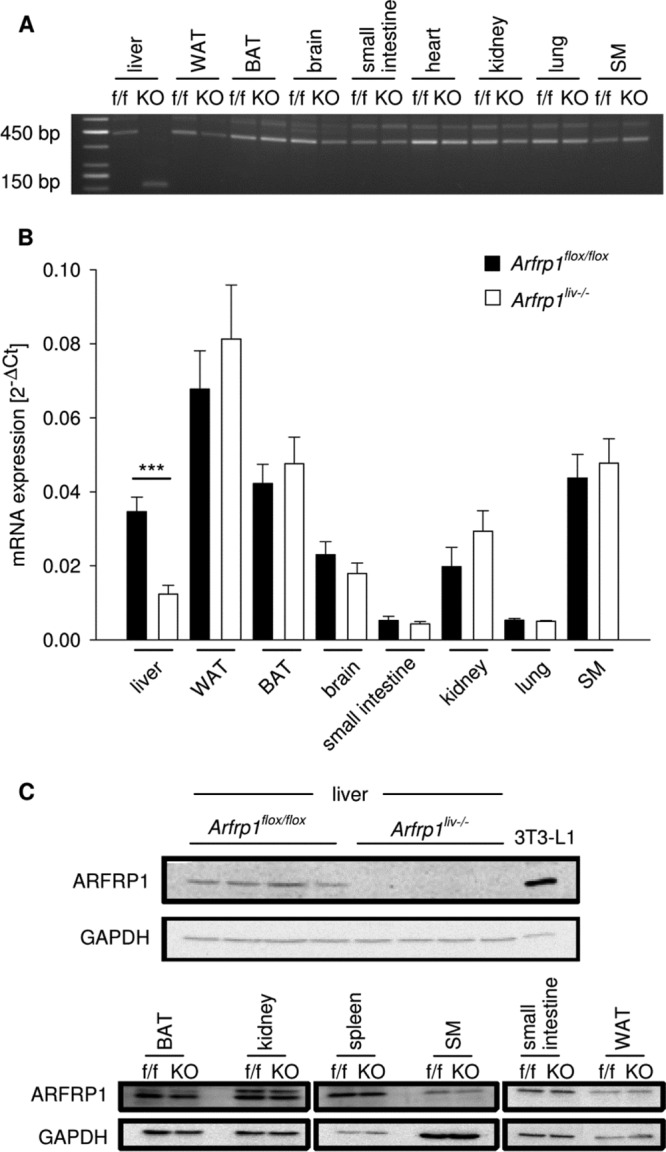
Liver-specific deletion of Arfrp1 after Cre-mediated recombination. (A) Deletion of exons 2 to 4 of the Arfrp1 gene was detected by RT-PCR performed on cDNA generated from isolated RNA. RT-PCR with primers located on exons 1 and 5 amplified a 450-bp fragment in control Arfrp1flox/flox (f/f) animals and in nonhepatic tissues of Arfrp1liv−/− (KO) mice, whereas Cre recombinase-mediated deletion generated a truncated smaller 150-bp fragment in livers of Arfrp1liv−/− mice. (B) Arfrp1 mRNA levels in different tissues detected by qRT-PCR in Arfrp1liv−/− and control mice resulted in reduced mRNA exclusively in Arfrp1liv−/− livers at the age of 5 weeks (37.8% ± 7.5%; U = 3, n = 20, and P < 0.001). (C) ARFRP1 protein in indicated tissues of Arfrp1liv−/− and control mice detected by Western blotting. ARFRP1 protein was absent exclusively in livers of 5-week-old Arfrp1liv−/− mice. Lysates from 3T3-L1 adipocytes were positive controls. WAT, white adipose tissue; BAT, brown adipose tissue; SM, skeletal muscle. GAPDH antibody was used as a loading control. ***, P < 0.001.
Fig 2.
Growth retardation of liver-specific Arfrp1liv−/− mice. (A) Body weight of Arfrp1liv−/− and control mice. Absolute lean mass and fat mass of Arfrp1liv−/− and control mice were detected by nuclear magnetic resonance spectroscopy. The relative fat masses of Arfrp1liv−/− and control mice are shown in the right panel. (B) Absolute and relative liver weights in fed (left panel) and fasted (right panel) Arfrp1liv−/− and control mice. *P < 0.05; **P < 0.01; ***P < 0.001.
In accordance with the reduced body weight, the total liver weight (absolute) of Arfrp1liv−/− mice was significantly lower (P < 0.001) (Fig. 2B), and this value remained lower than that of Arfrp1flox/flox mice even after normalization for body weight (relative) (P < 0.05). Reduced liver weight may be accounted for by the fact that Arfrp1liv−/− mice have reduced glycogen stores (see below) as fasted liver weight was not different between the genotypes (for absolute weight, P = 0.381; for relative weight, P = 0.497). Interestingly, the difference in total liver weights was much smaller when mice were kept on a high-fat diet (60% of calories from fat) (D12492; Research Diets, New Brunswick, NJ): for Arfrp1flox/flox mice, absolute liver weight was 1.0012 ± 0.0490 g, and for Arfrp1liv−/− mice it was 0.8322 ± 0.0156 g (P < 0.01). In accordance with the difference in the sizes of these mice, relative liver weights were comparable between control and Arfrp1liv−/− mice that were kept on a high-fat diet (for Arfrp1flox/flox mice, 5.3121% ± 0.2599%; for Arfrp1liv−/− mice, 5.0578% ± 0.1092%; P = 0.49).
Reduced plasma IGF1 concentration in Arfrp1liv−/− mice.
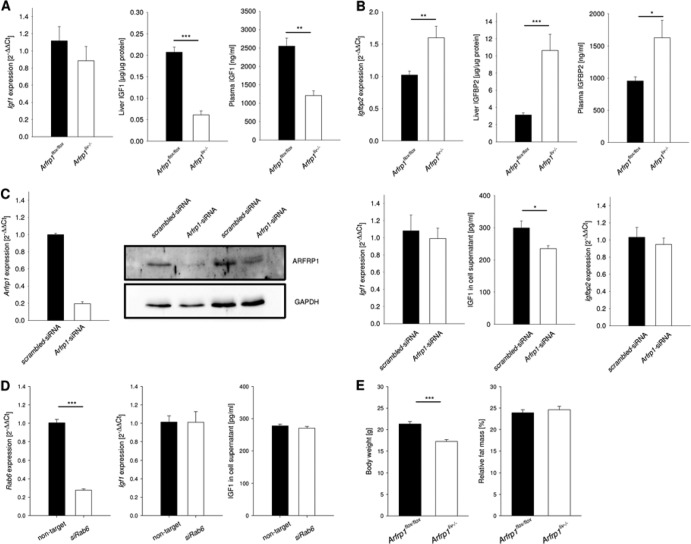
Since the liver is a major organ for the synthesis and secretion of insulin-like growth factor 1 (IGF1), we investigated IGF1 levels in plasma and liver of mice. Igf1 mRNA extracted from Arfrp1liv−/− and control livers was not changed (P = 0.456) (Fig. 3A), whereas both IGF1 protein content in liver tissue and plasma IGF1 concentration were diminished in Arfrp1liv−/− mice at the age of 5 weeks (for liver, P < 0.001; for plasma, P = 0.002) (Fig. 3A). We also investigated the plasma levels of the IGF-binding protein 2 (IGFBP2) since it has a role in the regulation of growth and is also highly expressed in the liver (32). The Igfbp2 mRNA and IGFBP2 protein levels were significantly higher in the livers of Arfrp1liv−/− mice than in controls (for mRNA, P = 0.01; for protein, P < 0.001) (Fig. 3B). Furthermore, IGFBP2 plasma concentration was elevated in Arfrp1liv−/− mice (P < 0.05) (Fig. 3B).
Fig 3.
Lower insulin-like growth factor 1 (IGF1) concentrations in livers and plasma of Arfrp1liv−/− mice. (A) Igf1 mRNA expression determined by qRT-PCR from livers of Arfrp1liv−/− and control mice. IGF1 protein in plasma and livers of Arfrp1liv−/− and control mice was detected by ELISA. (B) IGFBP2 protein in plasma of Arfrp1liv−/− and control mice was detected by ELISA. Igfbp2 mRNA was determined by qRT-PCR. (C) Downregulation of Arfrp1 by siRNA in primary hepatocytes was verified by qRT-PCR and Western blotting. Igf1 and Igfbp2 mRNAs were determined by qRT-PCR. Secreted IGF1 from primary hepatocytes was detected by ELISA. (D) Measurement of IGF1 secretion and Igf1 mRNA from primary hepatocytes after siRNA-mediated downregulation of Rab6. (E) Attenuated growth retardation of Arfrp1liv−/− mice after treatment with IGF1. Body weight and composition were determined at the age of 5 weeks. Arfrp1liv−/− mice received a daily injection of IGF1 from the age of 2 weeks; control mice were exposed to saline. *, P < 0.05; **, P < 0.01; ***, P < 0.001.
Reduced IGF1 secretion from primary hepatocytes after knockdown of Arfrp1.
To prove the causal role of ARFRP1 disruption in IGF1 and IGFBP2 secretion, the expression of Arfrp1 was downregulated by siRNA treatment in isolated primary hepatocytes. After successful depletion of ARFRP1 (P = 0.02) (Fig. 3C, left panel), the IGF1 concentration in cell culture supernatant was significantly lower in hepatocytes treated with siRNA targeting Arfrp1 (Arfrp1-siRNA)than in scrambled siRNA-transfected cells (P = 0.012) (Fig. 3C, right panel) although Igf1 mRNA levels were not different between the two groups. This indicates a direct role of ARFRP1 in hepatic IGF1 secretion. In addition, there was no alteration in the amount of Igfbp2 mRNA in primary hepatocytes in response to reduced expression of Arfrp1. Furthermore, to prove the specificity of the impact of ARFRP1 on IGF1 secretion, another Golgi-associated GTPase, Rab6 (28), was downregulated in primary hepatocytes, and IGF1 was detected in the supernatant (Fig. 3D). After successful inhibition of the expression of Rab6, neither the amount of Igf1 mRNA nor the amount of IGF1 released into the supernatant was altered compared to amounts in cells treated with a nontargeting siRNA.
Partial rescue of growth retardation by IGF1 treatment of Arfrp1liv−/− mice.
In order to define the contribution of reduced plasma IGF1 levels to the observed growth retardation of Arfrp1liv−/− mice, 2-week-old mice were treated daily with an i.p. injection of IGF1, whereas control mice received saline. At the age of 5 weeks, the Arfrp1liv−/− mice remained significantly smaller than the controls (P < 0.001) (Fig. 3E). However, growth retardation was less pronounced after IGF1 injection (body weight 19% lower in Arfrp1liv−/− mice) than in nontreated animals (27.4%). This was also reflected in the body length of the mice. Without IGF1 treatment, Arfrp1liv−/− mice were 9.14% shorter than controls; after IGF1 application, this difference was attenuated to 6.51%.
Impaired glycogen storage in the liver and reduced blood glucose levels of Arfrp1liv−/− mice.
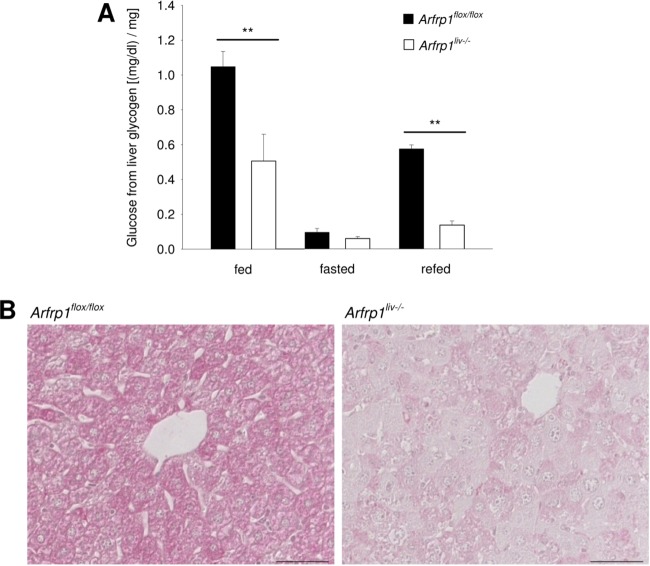
Since we were not able to totally rescue the growth retardation by IGF1 treatment, we investigated glucose metabolism in order to test whether impaired glucose metabolism participates in the reduced size of Arfrp1liv−/− mice. A large part of liver weight reflects the storage of glycogen. Measurement of glycogen content from total liver (Fig. 4A) and histochemical detection of glycogen by PAS staining (Fig. 4B) of fed mice confirmed the impaired glycogen storage of Arfrp1liv−/− livers (P < 0.01). After fasting, glycogen content was reduced to the same levels in Arfrp1flox/flox and Arfrp1liv−/− mice (P = 0.132), whereas the increase after 2-h refeeding was much lower in livers of Arfrp1liv−/− mice (P < 0.01) (Fig. 4A). Therefore, the discrepancy between liver weight and body weight in Arfrp1liv−/− mice (Fig. 2) was observed only in the fed state and can be attributed to reduced glycogen storage.
Fig 4.
Reduced glycogen storage in livers of Arfrp1liv−/− mice. (A) Liver glycogen content in the indicated states. (B) Histological PAS staining of glycogen storage in livers of fed Arfrp1liv−/− and control mice. Scale bar, 50 μm. **, P < 0.01.
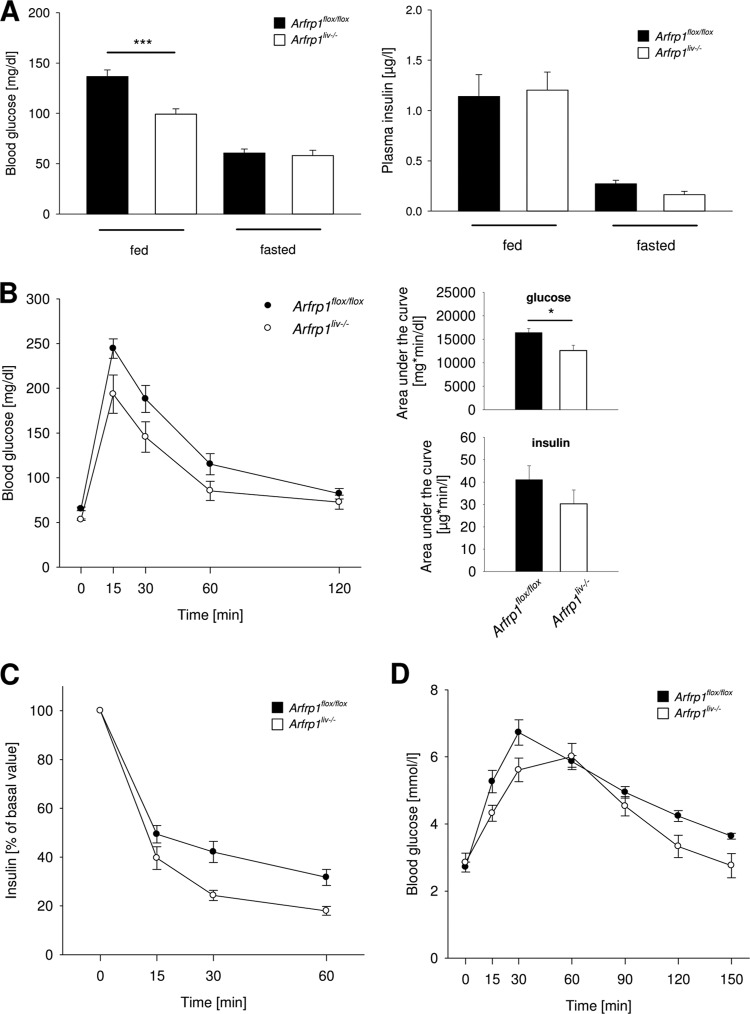
Since defects in glycogen storage are often associated with altered blood glucose levels, we measured blood glucose and insulin concentrations under fed and fasted conditions. Arfrp1liv−/− mice showed significantly reduced blood glucose levels in the fed state (P < 0.001) (Fig. 5A), whereas the difference disappeared after fasting (P = 0.809). Insulin levels in the fed and fasted states were not significantly different between genotypes (Fig. 5A). Furthermore, blood glucose levels during oral glucose tolerance tests were lower in Arfrp1liv−/− mice and resulted in a significant reduction of the calculated area under the curve (P < 0.05) (Fig. 5B). This was not attributed to significant alterations in insulin levels between both genotypes (P = 0.195); presumably in accordance with lower glucose levels, the plasma insulin concentration showed a tendency towards a reduced value. In addition, an insulin tolerance test resulted in a stronger clearance of blood glucose levels in Arfrp1liv−/− mice, indicating increased insulin sensitivity (Fig. 5C). However, gluconeogenesis appeared not to be affected (Fig. 5D) (see also below).
Fig 5.
Altered glucose metabolism of Arfrp1liv−/− mice. (A) Lower blood glucose of Arfrp1liv−/− mice at fed stage. Blood glucose was measured in mice fed randomly or after overnight fasting. Plasma insulin levels were unaltered in the fed and fasted states between genotypes. (B) Oral glucose tolerance test in Arfrp1liv−/− and control mice. The area under the curve for blood glucose and insulin was calculated. (C) Insulin tolerance test in Arfrp1liv−/− and control mice. (D) Pyruvate tolerance test in Arfrp1liv−/− and control mice. *, P < 0.05; ***, P < 0.001.
Decreased glucose transport into the liver of Arfrp1liv−/− mice.
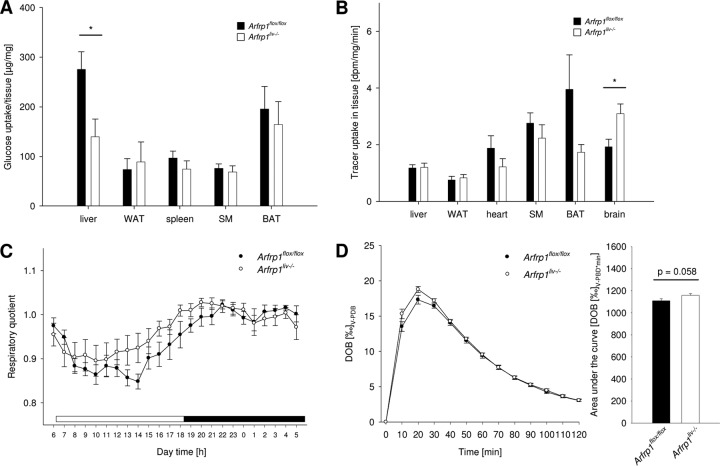
Data described above indicated an alteration in hepatic glucose uptake. Therefore, the uptake of the tracer 2-[14C]deoxyglucose into different tissues was measured. The deoxyglucose uptake into the liver was significantly reduced in Arfrp1liv−/− mice (P < 0.05), whereas no marked alterations were detected in skeletal muscle, adipose tissues, and spleen (Fig. 6A). Under basal conditions without an additional glucose bolus (tracer only), the uptake of 2-[14C]deoxyglucose was unaltered in most investigated tissues including the liver (Fig. 6B).
Fig 6.
Altered peripheral glucose metabolism of Arfrp1liv−/− mice. (A) Reduced glucose uptake into livers of Arfrp1liv−/− mice after an oral application of glucose traced with [14C]deoxyglucose. BAT, brown adipose tissue; SM, skeletal muscle; WAT, white adipose tissue. (B) Basal uptake of [14C]deoxyglucose in the indicated tissues. dpm, decays per minute. (C) Respiratory quotient of Arfrp1liv−/− and control mice. The white bar indicates the light phase; the black bar indicates the dark phase. n = 5 to 9. (D) Glucose oxidation in Arfrp1liv−/− and control mice. *, P < 0.05. DOB, delta over baseline; V-PDB, Vienna PeeDee belemnite limestone carbonate.
To further study carbohydrate metabolism, we conducted indirect calorimetry measurements and determined the respiratory quotient. During the light period, the respiratory quotient was slightly higher in Arfrp1liv−/− mice than in controls (Fig. 6C). Although this tendency did not result in a significant difference in the area under the curve, the moderate but constantly elevated respiratory quotient of Arfrp1liv−/− mice indicated elevated carbohydrate oxidation. The assumption of a higher rate of carbohydrate metabolism was confirmed by measuring glucose oxidation via detection of 13CO2 accumulation in the breath of mice receiving 13C-labeled glucose. Arfrp1liv−/− mice showed a tendency to oxidize more glucose than controls (t test, df = 38.054, t = −1.953, and P = 0.058) (Fig. 6D). In addition to glucose uptake and storage, the liver is able to perform gluconeogenesis and to release glucose into the bloodstream. To clarify whether the capacity to perform gluconeogenesis and to release glucose from the liver is altered after deletion of Arfrp1, a pyruvate tolerance test was performed (Fig. 5D). Starved mice received pyruvate, and blood glucose levels were measured over a time period of 150 min. Livers of mice of both genotypes released glucose into the blood to similar extents. However, blood glucose concentration rose slightly slower in Arfrp1liv−/− mice and dropped again faster after reaching the maximum compared to control mice.
Altered glucose metabolism after hepatic deletion of Arfrp1.
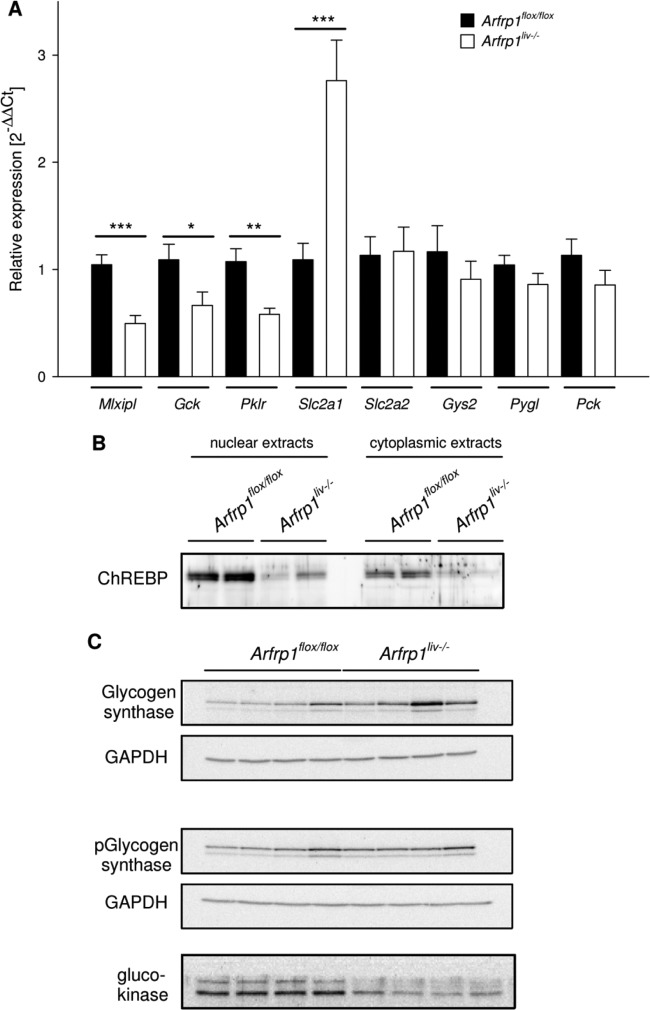
Impaired glycogen storage of Arfrp1liv−/− mice in the fed state and after a 2-h refeeding period appears to be a result of altered glucose transport into the hepatocytes, as indicated by the results described above. However, to rule out that glycogen synthesis or other metabolic pathways are affected by the absence of ARFRP1, we analyzed mRNA expression of glucose transporters and enzymes involved in hepatic glucose metabolism. As shown in Fig. 7A, expression of ChREBP (for Mlxipl, U = 8, n = 20, and P < 0.001) as a major regulatory transcription factor in glucose metabolism as well as enzymes of glycolysis (for Gck [glucokinase], P < 0.05; Pklr [pyruvate kinase], P < 0.01) were significantly reduced in livers of Arfrp1liv−/− mice. mRNA levels of the glucose transporter GLUT2 (Slc2a2, P = 0.941), enzymes involved in glycogen storage (Gys2 [glycogen synthase], P = 0.657; Pygl [glycogen phosphorylase], P = 0.206), and the gluconeogenic enzyme phosphoenolpyruvate carboxykinase (PEPCK) (Pck, P = 0.295) were unaltered in livers of Arfrp1liv−/− mice, whereas expression of the glucose transporter isotype GLUT1 was markedly increased (Slc2a1, P < 0.001). Western blot analysis of selected targets supported findings from expression analysis. The amount as well as the nuclear localization of ChREBP was reduced in liver samples of Arfrp1liv−/− mice (Fig. 7B). Glucokinase protein levels were lower in Arfrp1liv−/− livers than in control mice. In accordance with mRNA analysis, the total amount of glycogen synthase as well as of the phosphorylated less active form was unaltered between genotypes (Fig. 7C).
Fig 7.
Expression profiling of transcripts relevant for hepatic glucose metabolism. (A) mRNA expression of indicated transcripts was detected by qRT-PCR (Mlxipl [ChREBP], Gck [glucokinase], Pklr [pyruvate kinase], Slc2a1 [GLUT1], Slc2a2 [GLUT2], Gys2 [glycogen synthase], Pygl [glycogen phosphorylase], Pck [phosphoenolpyruvate carboxykinase]). (B) Western blot analysis of ChREBP in nuclear and cytoplasmic extracts of livers from Arfrp1liv−/− and control mice. (C) Western blot of glycogen synthase, phosphorylated (p-) glycogen synthase, and glucokinase of Arfrp1liv−/− and control livers. *, P < 0.05; **, P < 0.01; ***, P < 0.001.
Reduced levels of GLUT2 protein in hepatocytes of Arfrp1liv−/− mice.
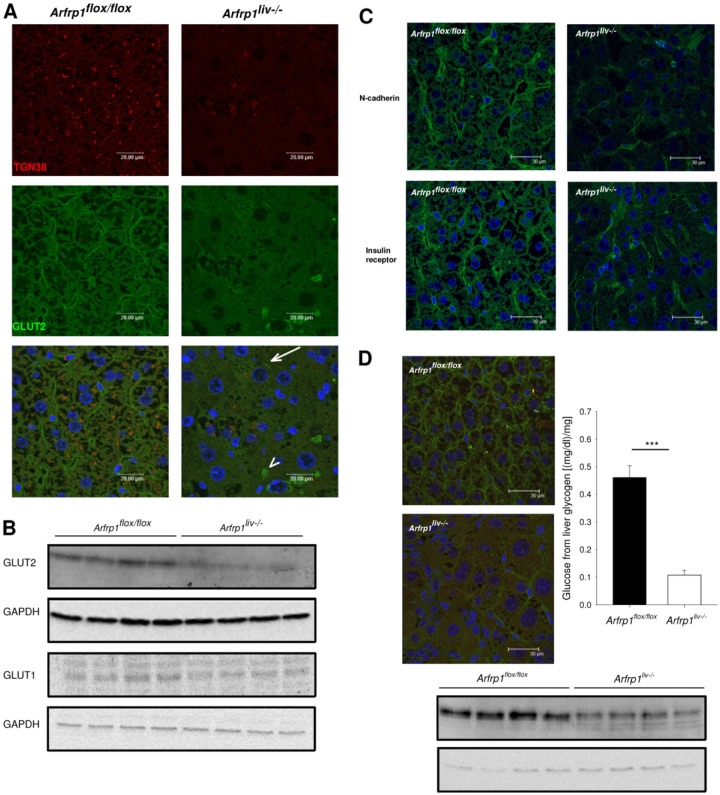
As the expression of the transcription factor ChREBP is regulated by the intracellular glucose concentration (19), the protein that limits glucose availability in hepatocytes, the glucose transporter GLUT2, was investigated. We have previously shown that ARFRP1 is required for the sorting of specific proteins to the trans-Golgi compartment (35, 36). TGN38, for instance, is located in the cytosol in cells lacking ARFRP1 (7). Similarly, TGN38 was nearly undetectable in Arfrp1liv−/− cells, whereas Arfrp1flox/flox cells exhibited a distinct distribution of TGN38 in the perinuclear region (Fig. 8A). Immunohistochemical staining for GLUT2 demonstrated typical cell surface localization of the transporter (Fig. 8A). In contrast, most Arfrp1liv−/− hepatocytes lacked cell surface localization of GLUT2, which was associated with the absence of membranous staining of TGN38. Only a few cells of Arfrp1liv−/− livers with positive TGN38 staining showed GLUT2 signals at the plasma membrane (Fig. 8A, arrow). Furthermore, GLUT2 was detected in intracellular compartments of some cells (Fig. 8A, arrowhead). As indicated by the immunohistochemical studies, GLUT2 protein levels were markedly reduced in lysates of Arfrp1liv−/− livers (Fig. 8B). This effect was also visible when mice were fed a high-fat diet; Arfrp1liv−/− livers exhibited lower GLUT2 levels at the cell surface and reduced amounts of GLUT2 in total lysates (Fig. 8D). In contrast, the increase in Slc2a1 mRNA expression resulted in comparable protein amounts of GLUT1 between the genotypes (Fig. 8B).
Fig 8.
Reduced plasma membrane localization and protein levels of the glucose transporter GLUT2 in livers of Arfrp1liv−/− mice. (A) Immunohistochemical staining on sections of livers of Arfrp1liv−/− and control mice with an anti-GLUT2 antibody. Cells with successful Arfrp1 deletion were identified by no detectable costaining with an antibody against TGN38. Arrows point to GLUT2 in the plasma membrane of Arfrp1liv−/− mice; arrowheads depict intracellular staining. (B) Western blotting of liver lysates of Arfrp1liv−/− and control mice performed with the indicated antibodies. (C) Normal cell surface localization of N-cadherin and insulin receptor in livers of Arfrp1liv−/− mice as detected by immunohistochemistry. (D) Immunohistochemistry and Western blot of GLUT2 of livers of Arfrp1liv−/− and control mice after 2 weeks of a high-fat diet. The graph shows liver glycogen content in fed Arfrp1liv−/− and control mice.
To rule out the possibility that the deletion of Arfrp1 in the liver resulted in general nonspecific missorting of plasma membrane proteins, two additional surface proteins were stained. The adhesion protein N-cadherin as well as the insulin receptor showed normal cell surface distributions (Fig. 8C).
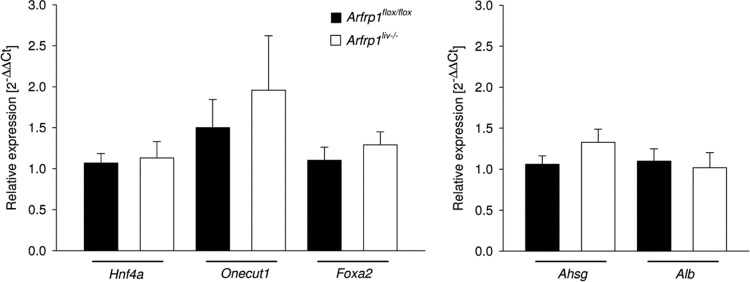
Our data indicate that the phenotype of Arfrp1liv−/− mice is the result of impaired glucose metabolism. However, since the conventional knockout mouse exhibited a defect in mesoderm development (20), we wanted to test whether the maturation of hepatocytes is affected and thereby is responsible for the altered liver function. mRNA expression levels of hepatic transcripts and transcription factors involved in hepatocyte differentiation (Fig. 9) were determined. Expression levels of these genes did not differ significantly between livers of Arfrp1liv−/− and control mice. Therefore, these results supported the assumption that general differentiation processes were not affected upon postnatal deletion of Arfrp1 and that, rather, the altered glucose metabolism and the reduced hepatic IGF1 release were causal for the growth retardation.
Fig 9.
Expression of hepatocyte differentiation-related transcription factors and hepatocyte-specific transcripts in livers of control and Arfrp1liv−/− mice as determined by qRT-PCR (for Hnf4α, U = 44, n = 20, and P = 0.710; for Hnf6/Onecut1, U = 41, n = 20, and P = 0.552; for Foxa2, U = 35, n = 20, and P = 0.295; for Ahsg (fetuin A), U = 37, n = 20, and P = 0.370; for Alb (albumin), U = 44, n = 20, and P = 0.710).
DISCUSSION
In this study, we identified two proteins whose transport is affected by the lack of ARFRP1 in the liver. The glucose transporter GLUT2 and insulin-like growth factor IGF1 were sorted only to a minor extent into the plasma membrane and secreted in Arfrp1liv−/− mice, respectively, leading to alterations in glucose metabolism and a marked retardation of growth. Since the sorting of other proteins (N-cadherin and insulin receptor) (Fig. 8C) was normal in the absence of ARFRP1 as was IGF1 secretion after downregulation of another Golgi-associated GTPase, Rab6 (Fig. 3D), we hypothesize that the specific action of ARFRP1 at the trans-Golgi compartment is needed for the appropriate release of IGF1-containing vesicles and the correct distribution of GLUT2. The specificity of the action of ARFRP1 on the trafficking of proteins is associated with a recently described connection of ARFRP1, ARL1, and golgin proteins to different Rab GTPases (11).
Impact of hepatic ARFRP1 on growth.
The most prominent phenotype of Arfrp1liv−/− mice was growth retardation, which appears to be at least partially a result of impaired IGF1 secretion. Daily i.p. application of an active peptide fragment of IGF1 led to attenuation of the growth retardation of Arfrp1liv−/− mice, indicating that reduced IGF1 in Arfrp1liv−/− mice contributes substantially to the reduced body weight and length (Fig. 3E). IGF1 is a circulating hormone with anabolic effects predominantly produced and secreted by the liver (26). The direct link between ARFRP1 action and IGF1 secretion was demonstrated after specific depletion of Arfrp1 in primary hepatocytes, which then also exhibited reduced IGF1 release (Fig. 3C). Interestingly, although a liver-specific deletion of Igf1 in mice leads to reduced plasma levels of IGF1, these mice exhibit normal growth (33). This discrepancy with the observed phenotype of Arfrp1liv−/− mice might be caused by a family of six IGF binding proteins (IGFBP1 to IGFBP6) that bind, stabilize, and regulate IGF1 in the plasma (32). IGFBPs may protect IGFs against degradation; they are able to potentiate or inhibit the biological actions of IGFs and may have IGF-independent actions. IGFBPs modulate growth and development by regulating IGF transport to tissues and IGF bioavailability (32). We analyzed IGFBP2 in plasma of the mice because it is predominantly expressed in liver in addition to being expressed in adipocytes and the reproductive and central nervous systems, and we observed a marked elevation of IGFBP2 in the plasma of Arfrp1liv−/− mice, indicating that secretion of proteins from the liver is not generally impaired in Arfrp1liv−/− livers (Fig. 3B). However, since siRNA-mediated depletion of Arfrp1 in primary hepatocytes did not affect Igfbp2 expression and release, we believe that the increased Igfbp2 mRNA levels and IGFBP2 concentration in plasma of Arfrp1liv−/− mice are secondary effects, presumably induced by reduced hepatic glucose content.
Role of ARFRP1 in hepatic glucose metabolism.
Since the growth retardation could not completely be rescued by systemic IGF1 treatment, we believe that the impaired hepatic glucose metabolism is also partially responsible for the smaller size of Arfrp1liv−/− mice. Arfrp1liv−/− mice exhibited strong phenotypical traits associated with lower liver weight and reduced glycogen storage (Fig. 2B and 4). Alterations in glucose metabolism can be regarded as the main reason for these effects as a 2-week feeding of a high-fat diet resulted in comparable liver-to-body weight ratios in Arfrp1liv−/− and control mice although the reduced amount of GLUT2 and its localization at the plasma membrane of Arfrp1liv−/− hepatocytes remained (Fig. 8). Analysis of the low-affinity hepatic glucose transporter GLUT2 revealed that the liver-specific deletion of Arfrp1 resulted in a smaller amount of GLUT2 in the plasma membrane and reduced GLUT2 protein levels (Fig. 8). As the quantification of mRNA levels (Slc2a2) showed no alteration between the genotypes (Fig. 7), these results indicated that the lack of ARFRP1 in the liver might lead to the degradation and reduced abundance of GLUT2 on the cell surface. This increased degradation might be caused by a mistargeting of the protein during sorting procedures at the trans-Golgi compartment. Like all facilitative glucose transporters (12), GLUT2 is glycosylated in the endoplasmic reticulum (ER) and Golgi apparatus and is thereafter transported to the plasma membrane by the constitutive pathway (30), which could be impaired in livers of Arfrp1liv−/− mice. The finding that glucose uptake into the Arfrp1liv−/− liver is affected only when mice received a glucose bolus with a high glucose concentration but not when basal glucose uptake was measured supports the specific impairment of GLUT2 (Fig. 8A and B) because GLUT2 facilitates glucose transport at high concentrations; GLUT1, which is not affected, mediates basal uptake (29). However, the fact that the Arfrp1liv−/− mouse does not entirely mimic the phenotype of the GLUT2-knockout mouse indicates that the loss of cell surface localization of GLUT2 is not the only factor responsible for limited glycogen storage in the absence of ARFRP1.
Conventional knockout mice of Slc2a2 die postnatally due to the lack of GLUT2 in β cells, which leads to a defect in insulin secretion and a diabetic phenotype (6). Slc2a2−/− mice (GLUT2) rescued by the transgenic expression of GLUT1 in β cells (2) differ from Arfrp1liv−/− mice; they have normal glycogen stores but show impaired glucose release upon fasting. Similarly to Arfrp1liv−/− mice, these mice exhibit increased glucose utilization, improved glucose clearance, and elevated glucokinase expression (2, 3). However, the two models are not entirely comparable; the Arfrp1liv−/− mouse lacks ARFRP1 exclusively in the liver where it modifies GLUT2 localization, while the Slc2a2−/− mouse lacks GLUT2 in several tissues (including intestine and β cells), which might have an impact on whole-body glucose homeostasis and hepatic glucose metabolism.
In contrast to GLUT2, the abundance of the GLUT1 protein was not markedly altered (Fig. 8) even though the amount of mRNA (Slc2a1) was significantly increased (Fig. 7). GLUT1 and GLUT2 possess 55% identical amino acid sequences (29), and their affinities to glucose differ. Whereas GLUT2 is described to have symmetric kinetics with identical Kms for both influx and efflux of glucose transport, these processes are asymmetrical for GLUT1. Glucose efflux is an order of magnitude higher than glucose uptake (29). This fact could explain why glucose uptake was impaired in Arfrp1liv−/− mice after a bolus of high-concentration glucose was applied (20% solution; 10 μl/g body weight) (Fig. 6A), whereas glucose release appeared to be only slightly affected, as indicated by the capacity to reduce glycogen after fasting and by normal glucose release after pyruvate application (Fig. 4 and 5D) (see below). However, glucose uptake into the liver was unaltered between genotypes at low blood glucose concentrations under conditions in which mainly GLUT1 is responsible for hepatic glucose transport (Fig. 6B). During fasting, glucose is released by hepatocytes via both glucose transporters at a very high rate (29). Therefore, GLUT1 localization at the cell surface could be sufficient for glucose release. This assumption was supported by a pyruvate tolerance test which serves as a predictor for hepatic glucose production (Fig. 5D). Although in Arfrp1liv−/− mice the hepatic release of glucose appeared slightly slower than in control mice, the maximum blood glucose level after pyruvate injection was not significantly different. This indicated undisturbed glucose production and release from Arfrp1liv−/− livers. Alternative trafficking pathways within the Golgi apparatus (16) could explain why GLUT2 and not GLUT1 was affected by mistargeting due to the lack of ARFRP1.
The reduced glucose availability in livers of Arfrp1liv−/− mice resulted in a reduction of the expression of glycolytic enzymes, suggesting downregulation of the glycolytic pathway. As the lack of ARFRP1 cannot directly lead to transcriptional activation, a glucose-regulated transcription factor like the carbohydrate response element binding protein (ChREBP) is most likely involved. In livers of Arfrp1liv−/− mice, the mRNA concentration of ChREBP (Mlxipl) as well as its protein level and its nuclear localization was significantly lower than that of control livers (Fig. 7B), which resulted in downregulation of the expression of glycolytic enzymes such as pyruvate kinase. Furthermore, a low intracellular glucose concentration could lead to inhibition of glucokinase expression, as observed in Arfrp1liv−/− mice (Fig. 7C) (10). Mice with a complete deletion of Gck die within a few days after birth (5). However, a liver-specific deletion of Gck results in reduced glycogen storage in the liver and a defect in glucose turnover rates (22). This is highly comparable to the phenotype of Arfrp1liv−/− mice described here.
Conclusion.
In summary, our data show that a liver-specific deletion of Arfrp1 resulted in postnatal growth retardation which, though most likely due to reduced IGF1 levels, was also due to impaired glucose metabolism caused by a reduced amount of GLUT2 and decreased glucose uptake into the liver, in turn resulting in reduced hepatic glycogen storage. Therefore, ARFRP1 is responsible for the correct targeting of proteins such as IGF1 and GLUT2 in the liver.
ACKNOWLEDGMENTS
We are grateful to Mark Magnusson, Center for Stem Cell Biology, Vanderbilt University Medical Center, Nashville, TN, for providing the Alb-Cre. The skillful technical assistance of Michaela Rath, Andrea Teichmann, Kathrin Warnke, Anna Rusaczonek, and Elisabeth Meyer is gratefully acknowledged.
This work was supported by the German Research Foundation (Schu 750/5-3, SFB 958), the German Ministry of Education and Research (BMBF, DZD, grant 01GI0922) and European Community's 7 FB Prepobedia (grant 201681). M.S. is supported by the German Research Foundation Emmy-Noether (Schu 2546/1-1).
Footnotes
Published ahead of print 27 August 2012
REFERENCES
- 1.Buchmann J, et al. 2007. Ablation of the cholesterol transporter adenosine triphosphate-binding cassette transporter G1 reduces adipose cell size and protects against diet-induced obesity. Endocrinology 148:1561–1573 [DOI] [PubMed] [Google Scholar]
- 2.Burcelin R, del Carmen Munoz M, Guillam MT, Thorens B. 2000. Liver hyperplasia and paradoxical regulation of glycogen metabolism and glucose-sensitive gene expression in GLUT2-null hepatocytes. Further evidence for the existence of a membrane-based glucose release pathway. J. Biol. Chem. 275:10930–10936 [DOI] [PubMed] [Google Scholar]
- 3.Burcelin R, Dolci W, Thorens B. 2000. Glucose sensing by the hepatoportal sensor is GLUT2-dependent: in vivo analysis in GLUT2-null mice. Diabetes 49:1643–1648 [DOI] [PubMed] [Google Scholar]
- 4.Denecke B, et al. 2003. Tissue distribution and activity testing suggest a similar but not identical function of fetuin-B and fetuin-A. Biochem. J. 376:135–145 [DOI] [PMC free article] [PubMed] [Google Scholar]
- 5.Grupe A, et al. 1995. Transgenic knockouts reveal a critical requirement for pancreatic beta cell glucokinase in maintaining glucose homeostasis. Cell 83:69–78 [DOI] [PubMed] [Google Scholar]
- 6.Guillam MT, et al. 1997. Early diabetes and abnormal postnatal pancreatic islet development in mice lacking Glut-2. Nat. Genet. 17:327–330 [DOI] [PubMed] [Google Scholar]
- 7.Hesse D, et al. 2010. Altered GLUT4 trafficking in adipocytes in the absence of the GTPase Arfrp1. Biochem. Biophys. Res. Commun. 394:896–903 [DOI] [PubMed] [Google Scholar]
- 8.Hommel A, et al. 2010. The ARF-like GTPase ARFRP1 is essential for lipid droplet growth and is involved in the regulation of lipolysis. Mol. Cell Biol. 30:1231–1242 [DOI] [PMC free article] [PubMed] [Google Scholar]
- 9.Isken F, et al. 2010. Impairment of fat oxidation under high- vs. low-glycemic index diet occurs before the development of an obese phenotype. Am. J. Physiol. Endocrinol. Metab. 298:E287–295 [DOI] [PubMed] [Google Scholar]
- 10.Iynedjian PB, et al. 1989. Differential expression and regulation of the glucokinase gene in liver and islets of Langerhans. Proc. Natl. Acad. Sci. U. S. A. 86:7838–7842 [DOI] [PMC free article] [PubMed] [Google Scholar]
- 11.Jaschke A, et al. 2012. The GTPase ARFRP1 controls the lipidation of chylomicrons in the Golgi of the intestinal epithelium. Hum. Mol. Genet. 21:3128–3142 [DOI] [PMC free article] [PubMed] [Google Scholar]
- 12.Joost HG, Thorens B. 2001. The extended GLUT-family of sugar/polyol transport facilitators: nomenclature, sequence characteristics, and potential function of its novel members (review). Mol. Membr. Biol. 18:247–256 [DOI] [PubMed] [Google Scholar]
- 13.Jurczak MJ, Danos AM, Rehrmann VR, Brady MJ. 2008. The role of protein translocation in the regulation of glycogen metabolism. J. Cell Biochem. 104:435–443 [DOI] [PubMed] [Google Scholar]
- 14.Kahn RA, et al. 2006. Nomenclature for the human Arf family of GTP-binding proteins: ARF, ARL, and SAR proteins. J. Cell Biol. 172:645–650 [DOI] [PMC free article] [PubMed] [Google Scholar]
- 15.Kainulainen H, Schurmann A, Vilja P, Joost HG. 1993. In-vivo glucose uptake and glucose transporter proteins GLUT1 and GLUT3 in brain tissue from streptozotocin-diabetic rats. Acta Physiol. Scand. 149:221–225 [DOI] [PubMed] [Google Scholar]
- 16.Keller P, Simons K. 1997. Post-Golgi biosynthetic trafficking. J. Cell Sci. 110:3001–3009 [DOI] [PubMed] [Google Scholar]
- 17.Kouadjo KE, Nishida Y, Cadrin-Girard JF, Yoshioka M, St-Amand J. 2007. Housekeeping and tissue-specific genes in mouse tissues. BMC Genomics 8:127 doi:10.1186/1471-2164-8-127 [DOI] [PMC free article] [PubMed] [Google Scholar]
- 18.Livak KJ, Schmittgen TD. 2001. Analysis of relative gene expression data using real-time quantitative PCR and the 2−ΔΔCT method. Methods 25:402–408 [DOI] [PubMed] [Google Scholar]
- 19.Mitro N, et al. 2007. The nuclear receptor LXR is a glucose sensor. Nature 445:219–223 [DOI] [PubMed] [Google Scholar]
- 20.Mueller AG, et al. 2002. Embryonic lethality caused by apoptosis during gastrulation in mice lacking the gene of the ADP-ribosylation factor-related protein 1. Mol. Cell. Biol. 22:1488–1494 [DOI] [PMC free article] [PubMed] [Google Scholar]
- 21.Panic B, Whyte JR, Munro S. 2003. The ARF-like GTPases Arl1p and Arl3p act in a pathway that interacts with vesicle-tethering factors at the Golgi apparatus. Curr. Biol. 13:405–410 [DOI] [PubMed] [Google Scholar]
- 22.Postic C, et al. 1999. Dual roles for glucokinase in glucose homeostasis as determined by liver and pancreatic beta cell-specific gene knock-outs using Cre recombinase. J. Biol. Chem. 274:305–315 [DOI] [PubMed] [Google Scholar]
- 23.Rodgers JT, Puigserver P. 2007. Fasting-dependent glucose and lipid metabolic response through hepatic sirtuin 1. Proc. Natl. Acad. Sci. U. S. A. 104:12861–12866 [DOI] [PMC free article] [PubMed] [Google Scholar]
- 24.Schürmann A, Massmann S, Joost HG. 1995. ARP is a plasma membrane-associated Ras-related GTPase with remote similarity to the family of ADP-ribosylation factors. J. Biol. Chem. 270:30657–30663 [DOI] [PubMed] [Google Scholar]
- 25.Setty SR, Shin ME, Yoshino A, Marks MS, Burd CG. 2003. Golgi recruitment of GRIP domain proteins by Arf-like GTPase 1 is regulated by Arf-like GTPase 3. Curr. Biol. 13:401–404 [DOI] [PubMed] [Google Scholar]
- 26.Sjogren K, et al. 1999. Liver-derived insulin-like growth factor I (IGF-I) is the principal source of IGF-I in blood but is not required for postnatal body growth in mice. Proc. Natl. Acad. Sci. U. S. A. 96:7088–7092 [DOI] [PMC free article] [PubMed] [Google Scholar]
- 27.Sokoloff L, et al. 1977. The [14C]deoxyglucose method for the measurement of local cerebral glucose utilization: theory, procedure, and normal values in the conscious and anesthetized albino rat. J. neurochemistry 28:897–916 [DOI] [PubMed] [Google Scholar]
- 28.Starr T, Sun Y, Wilkins N, Storrie B. 2010. Rab33b and Rab6 are functionally overlapping regulators of Golgi homeostasis and trafficking. Traffic 11:626–636 [DOI] [PubMed] [Google Scholar]
- 29.Thorens B. 1996. Glucose transporters in the regulation of intestinal, renal, and liver glucose fluxes. Am. J. Physiol. 270:G541–553 [DOI] [PubMed] [Google Scholar]
- 30.Thorens B, Gerard N, Deriaz N. 1993. GLUT2 surface expression and intracellular transport via the constitutive pathway in pancreatic beta cells and insulinoma: evidence for a block in trans-Golgi network exit by brefeldin A. J. Cell Biol. 123:1687–1694 [DOI] [PMC free article] [PubMed] [Google Scholar]
- 31.Tropea D, et al. 2009. Partial reversal of Rett Syndrome-like symptoms in MeCP2 mutant mice. Proc. Natl. Acad. Sci. U. S. A. 106:2029–2034 [DOI] [PMC free article] [PubMed] [Google Scholar]
- 32.Wheatcroft SB, Kearney MT. 2009. IGF-dependent and IGF-independent actions of IGF-binding protein-1 and -2: implications for metabolic homeostasis. Trends Endocrinol. Metab. 20:153–162 [DOI] [PubMed] [Google Scholar]
- 33.Yakar S, et al. 1999. Normal growth and development in the absence of hepatic insulin-like growth factor I. Proc. Natl. Acad. Sci. U. S. A. 96:7324–7329 [DOI] [PMC free article] [PubMed] [Google Scholar]
- 34.Yoon JC, et al. 2000. Peroxisome proliferator-activated receptor gamma target gene encoding a novel angiopoietin-related protein associated with adipose differentiation. Mol. Cell. Biol. 20:5343–5349 [DOI] [PMC free article] [PubMed] [Google Scholar]
- 35.Zahn C, et al. 2006. Knockout of Arfrp1 leads to disruption of ARF-like 1 (ARL1) targeting to the trans-Golgi in mouse embryos and HeLa cells. Mol. Membr. Biol. 23:475–485 [DOI] [PubMed] [Google Scholar]
- 36.Zahn C, et al. 2008. ADP-ribosylation factor-like GTPase ARFRP1 is required for trans-Golgi to plasma membrane trafficking of E-cadherin. J. Biol. Chem. 283:27179–27188 [DOI] [PubMed] [Google Scholar]
- 37.Zimmermann EM, et al. 2000. Cell-specific localization of insulin-like growth factor binding protein mRNAs in rat liver. Am. J. Physiol. Gastrointest. Liver Physiol. 278:G447–457 [DOI] [PubMed] [Google Scholar]


