

Abstract
The diarrheal pathogen Campylobacter jejuni and other gastrointestinal bacteria encounter changes in osmolarity in the environment, through exposure to food processing, and upon entering host organisms, where osmotic adaptation can be associated with virulence. In this study, growth profiles, transcriptomics, and phenotypic, mutant, and single-cell analyses were used to explore the effects of hyperosmotic stress exposure on C. jejuni. Increased growth inhibition correlated with increased osmotic concentration, with both ionic and nonionic stressors inhibiting growth at 0.620 total osmol liter−1. C. jejuni adaptation to a range of osmotic stressors and concentrations was accompanied by severe filamentation in subpopulations, with microscopy indicating septum formation and phenotypic diversity between individual cells in a filament. Population heterogeneity was also exemplified by the bifurcation of colony morphology into small and large variants on salt stress plates. Flow cytometry of C. jejuni harboring green fluorescent protein (GFP) fused to the ATP synthase promoter likewise revealed bimodal subpopulations under hyperosmotic stress. We also identified frequent hyperosmotic stress-sensitive variants within the clonal wild-type population propagated on standard laboratory medium. Microarray analysis following hyperosmotic upshift revealed enhanced expression of heat shock genes and genes encoding enzymes for synthesis of potential osmoprotectants and cross-protective induction of oxidative stress genes. The capsule export gene kpsM was also upregulated, and an acapsular mutant was defective for growth under hyperosmotic stress. For C. jejuni, an organism lacking most conventional osmotic response factors, these data suggest an unusual hyperosmotic stress response, including likely “bet-hedging” survival strategies relying on the presence of stress-fit individuals in a heterogeneous population.
INTRODUCTION
Most well-characterized gastrointestinal pathogens are robust and relatively halotolerant, attributes necessary for transmission through the environment, for survival within host organisms, and for endurance under the unfavorable conditions encountered in food processing. In contrast, the helical enteric Gram-negative Campylobacter jejuni is a fastidious pathogen: it requires a rich growth medium, requires microaerobic and elevated-CO2 atmospheres, and is unusually sensitive to environmental and simulated in vivo stresses imposed in the laboratory. Despite this, C. jejuni is the leading cause of bacterial food-borne diarrheal disease in the developed world (64). Infection in humans results in severe watery to bloody diarrhea, fever, and vomiting and can lead to serious medical sequelae such as Guillain-Barré syndrome, a debilitating and sometimes fatal paralysis. C. jejuni is a prevalent human pathogen but is also a commensal in most animal species, particularly in birds. The majority of human infections occur through consumption of undercooked poultry or cross-contamination of other food with raw poultry juice. In the intestine, C. jejuni is faced with numerous stresses, including antimicrobial bile salts, resident flora, human immune defenses, and significant changes in osmolarity (14, 54). C. jejuni also encounters osmotic stress in food products, where preservatives such as sodium chloride (NaCl) and sucrose dehydrate food-borne microorganisms (44). NaCl is one of the most important agents in food preservation, known since ancient times to be a potent microbial inhibitor. More recent studies show that NaCl and osmotic stress affect virulence factor expression in numerous bacterial species, such as Salmonella spp., Escherichia coli, and Helicobacter pylori (19, 33, 37).
Adaptation to changing osmotic environments is essential for homeostasis, ensuring that the bacterial cytoplasm remains hydrated and that solutes necessary for normal biological functions are available. Consequently, the genetic and physiological responses to hyperosmotic shock have been studied extensively in bacteria and higher-level organisms. For C. jejuni, our current understanding of osmotolerance mechanisms is limited, although it has been shown that C. jejuni is more sensitive to NaCl and high osmolarity than most gastrointestinal pathogens (2, 11). Osmolarity or osmotic concentration (in osmol liter−1) is a measure of solute concentration, i.e., moles of solute particles rather than moles of solute (molarity). Other enteric pathogens, such as E. coli, can adapt to and grow in osmolarities of up to 1.7 to 2.0 osmol liter−1 and can even survive for long periods exposed to 30% NaCl (10.2 osmol liter−1) (38). In contrast, C. jejuni is incapable of survival when standard Mueller-Hinton (MH) growth medium (0.31 osmol liter−1 [49]) is supplemented with 2% NaCl (+0.68 osmol liter−1) (total of 0.99 osmol liter−1) (11). The host niche of C. jejuni is the chicken cecum, which has an osmolarity of ∼0.7 osmol liter−1 (29). In comparison, the osmotic concentration in the human intestine approximates that of MH broth at ∼0.3 osmol liter−1 but can vary widely with ingested food (14). A comparison of relevant in vivo and experimental osmotic conditions for C. jejuni is presented in Fig. 1A.
Fig 1.

Growth and survival of C. jejuni 81-176 in broth cultures containing increasing concentrations of NaCl in Mueller-Hinton (MH) medium. (A) Comparison of biologically relevant osmolarities and the conditions used in this experiment. (B and C) Optical density (OD600) readings (B) and CFU ml−1 counts (C) demonstrated that growth and survivability are inhibited at osmolarities exceeding +1.5% NaCl. Initial adaptation under the +1.0% NaCl condition (open triangles) was followed by logarithmic growth and late-stage growth defects; the dashed bracket and box in panel C show an expanded view of the 0- to 12-h time points for +1.0% NaCl versus unsupplemented medium. The MH+0.5% NaCl CFU ml−1 curve is identical to the MH curve but has been offset to enable viewing. The experiment is representative of three biological replicates; error bars for three technical replicates are present but in most cases are too small to see. *, P ≤ 0.05; **, P ≤ 0.01.
Studies of model bacteria have shown that upon exposure to hyperosmotic upshock or stress, physiological changes that are triggered by the rapid flux of cellular water along the osmotic gradient occur (27, 39, 51, 61). As water leaves the bacteria, dehydration of the cytoplasm occurs, and turgor (the hydrostatic pressure exerted against the cell membrane from within) is reduced. Bacteria must sense and reverse or adapt to these changes in order to continue growing. This reaction is known as osmoadaptation and occurs in distinct phases, resulting in immediate and long-term responses. The transient short-term response restores hydration by active accumulation of high concentrations of intracellular ions, notably K+, which contributes to a high internal ionic strength incompatible with growth. In E. coli, rapid K+ influx is counterbalanced with endogenously synthesized glutamate (39), which amasses at a lower rate. Long-term osmoadaptive responses are designed for the maintenance of turgor under sustained adverse conditions and frequently result from the synthesis or import of compatible solutes. These solutes comprise a limited number of structurally diverse, small, neutral, polar, and osmotically active substances that are “compatible” with cellular functions. In most microorganisms, compatible solutes include proline, glycine betaine, and the disaccharide trehalose (8, 51). The capacity to synthesize or uptake compatible solutes is often correlated with hyperosmotic stress tolerance (27).
Several well-annotated Campylobacter genome sequences (45) indicate little in the way of known or predicted osmoadaptive machinery, which perhaps is unsurprising given the apparent sensitivity of C. jejuni to osmotic stress. C. jejuni does not appear to have functioning potassium (K+) transporters, carrying only pseudogenes or truncated open reading frames (ORFs) of the kdp operon, which in E. coli encodes an osmotic stress-induced high-affinity K+ transport system (61). The C. jejuni genome also lacks homologues of the trk genes, which code for low-affinity K+ transporters. C. jejuni possesses an orthologue of ProP, a low-affinity proline/glycine betaine transporter, but does not appear to encode any previously characterized high-affinity transporters for glycine betaine, such as ProU. It does encode the highly specific proline transport system PutP, but in other bacteria this is thought to be important for transport of this metabolite when used as a carbon or nitrogen source. In addition, C. jejuni does not appear to have the capacity for endogenous synthesis of the major compatible solutes, lacking glycine betaine (bet) and trehalose (ots) biosynthetic pathways. Despite these limitations, C. jejuni is a successful zoonotic organism and must therefore rely on other mechanisms to survive hyperosmotic environments.
What methods can C. jejuni, apparently devoid of typical osmoadaptive systems, use to overcome osmotic stress and optimize chances of survival? In this study, our goals were to characterize the hyperosmotic stress response and reveal genes important for hyperosmotic tolerance and adaptation in C. jejuni. During the course of this work, we also noted that the C. jejuni population does not respond to hyperosmotic stress in a uniform manner. This was in agreement with a previous study showing that a small fraction of the total C. jejuni population can withstand extreme stress conditions, such as exposure to NaCl, sodium deoxycholate, and methyl viologen (an oxidative stressor) (43). That study also noted that the number of resistant bacteria increased under the selective pressure of the particular stress. This suggested the existence of heterogenous subpopulations of cells with genetic changes that favored survival. Clonal populations can quickly diverge by simple point mutations or by switching events such as phase variation due to slip-strand mispairing during DNA replication and/or chromosomal inversion in certain genes or promoters (12). For example, C. jejuni contains hypervariable homopolymeric nucleotide tracts in several genes, especially those involved in the biosynthesis or modification of surface structures (3, 45, 64). These genes are called contingency loci because the resulting population heterogeneity protects against future events that cannot be predicted. Work with other bacteria has shown that epigenetic mechanisms can also create stable but easily reversible variation. Epigenetic noise (stochasticity or randomness) is typically a product of the random fluctuations in the synthesis or degradation of mRNA and protein (12, 16, 58). Sometimes this noise can result in coexisting and phenotypically distinct populations of genetically identical cells. This is known as bistability and yields populations with bimodal characteristics (58). Bistability has been most studied in Bacillus subtilis spore formation and competence and is also exemplified in E. coli by persister cells (dormant, nongrowing cells that are unresponsive to antibiotics) (12).
This study represents the first comprehensive report on the physiology of C. jejuni under hyperosmotic stress. Survival profiles and MICs for a number of hyperosmotic stressors are identified, as is the whole-genome transcriptional response to hyperosmotic stress. We also uncovered physiological responses such as induction of population heterogeneity, cell division defects in subpopulations of bacteria, and both cross-protective and detrimental effects of hyperosmotic shock on other key stress responses. Evidence for the importance of both variability within a clonal population and bistable response mechanisms for hyperosmotic stress survival is also provided.
MATERIALS AND METHODS
Bacterial strains and growth conditions.
Studies were performed using the C. jejuni wild-type strain 81-176, originally isolated from an outbreak of campylobacteriosis following consumption of unpasteurized milk (31). A site-insertional KpsM (capsule export protein) mutant (kanamycin [Kn] resistance) was a kind gift from P. Guerry (3); DNA was purified and the mutation reintroduced into wild-type strain 81-176 by natural transformation and selection with kanamycin. A cj0561c mutant was generated based on the procedures of Guo et al. (18). All C. jejuni strains were grown at 38°C on Mueller-Hinton (MH) agar or broth (Oxoid, Cambridge, United Kingdom) supplemented with vancomycin (10 μg ml−1) and trimethoprim (5 μg ml−1) under microaerobic and increased-CO2 conditions (6% O2 and 12% CO2) in a Sanyo tri-gas incubator (solid media) or generated using the Oxoid CampyGen system (shaken broth cultures). Unless otherwise stated, all C. jejuni analyses were conducted under these standard conditions. When necessary, media were supplemented with kanamycin (50 μg/ml) (Sigma, St. Louis, MO). Hyperosmotic media were prepared by supplementation with various concentrations of NaCl, KCl, MgCl2, sucrose, or glucose (Sigma). For osmolarity calculations, the sum of the concentrations of osmotically active solutes in solution was given by the following formula: osmol liter−1 = ΣCini, where C is the molar concentration of the solute and n is the number of particles into which the solute dissociates.
Examination of growth and stress tolerance.
C. jejuni strains were grown in MH broth overnight to mid-log phase and then diluted to an optical density at 600 nm (OD600) of 0.005 in the appropriate prewarmed media. Cultures were incubated under standard C. jejuni growth conditions at 38°C with shaking at 200 rpm. Growth and culturability were assessed at various times postdilution by measuring the OD600 and plating serial 10-fold dilutions for CFU on MH agar. For osmotic sensitivity comparisons between strains, a spot method was used. Strains were standardized to an OD600 of 0.05, and 5 μl of serial 10-fold dilutions was spotted on MH or hyperosmotic media (in most cases MH+0.8% NaCl). MIC90s of selected osmotic stressors were determined using a microtiter broth dilution method (32) in MH broth and an initial inoculum of approximately 106 bacteria ml−1 from mid-log-phase cultures. Polypropylene microtiter plates containing bacterial strains with various compounds were incubated for 48 h, and then dilutions were spotted on MH plates to enumerate CFU or plates were read for OD600. The MIC90 was established as the concentration at which 90% (based on OD600) of bacterial growth was inhibited. For heat shock and oxidative stress tolerance studies, an OD600 equivalent of 0.1 was taken from cultures exposed to MH broth and MH broth+1.0% NaCl for 2 h. The bacteria were washed in phosphate-buffered saline (PBS) and then resuspended in either PBS (Invitrogen, Carlsbad, CA) or PBS+5 mM H2O2 (Sigma) or subjected to a heat stress of 45°C. Tenfold dilutions were plated on standard MH medium and CFU enumerated. Heat shock and oxidative stress studies were carried out in room atmosphere.
Examination of clonal isolates for frequency and heritability of hyperosmotic stress sensitivity and resistance.
To quantify and explore the frequency and phenotypic stability of salt-sensitive bacteria existing within the wild-type population, C. jejuni 81-176 was plated for single colonies on MH agar. Two hundred clonal isolates were selected and tested for salt sensitivity by patching on MH (control/passage) and MH+0.8% NaCl (test condition) agar plates with a glass probe. Plates were incubated for 48 h, and growth for the test condition was categorized either as 1 (sensitive), 2 (wild-type-like), or 3 (enhanced growth). Each patch was rated in this manner three times. For heat map visualizations, the rating for each clone was averaged and heat maps generated by matrix2png (UBC Bioinformatics). Next, 5 progeny of the original population were selected from each category if initially rated unambiguously as 1, 2, or 3. Although growth on MH+0.8% NaCl was used to establish salt sensitivity rankings, all bacteria for further analyses were obtained from the corresponding MH (control/passage) plate, ensuring that any changes occurring were not due to exposure to NaCl stress. The 15 strains were then passed daily for 2 days on MH agar plates, and 200 clones from each were retested in the manner described above. For CFU enumerations of sensitive isolates, overnight cultures (in MH) were standardized to an OD600 of 0.1, and 10-fold dilutions were plated for CFU on MH, MH+0.8% NaCl, and MH+1.0% NaCl agar plates. Capsule immunoblotting was carried out as described in reference 3.
Bright-field and fluorescence microscopy and imaging.
For bright-field microscopy, bacteria from various samples were planted on 1.0% agarose pads and overlaid with a coverslip. Cells were imaged with a Nikon TE 2000-U microscope equipped with an argon-ion laser (EXFO X-Cite), a 100× oil immersion objective, and a Hamamatsu charge-coupled device (CCD) camera controlled by NIS Elements (Nikon, Melville, NY). Bacteria were counted and measured for length using the threshold function of this software. Bacterial colony area was measured with ImageJ (NIH). Fluorescence in green fluorescent protein (GFP)-expressing bacteria was detected using an excitation filter for GFP at 485 nm and emission at 520 nm. For propidium iodide (PI) and Syto-9 staining, cells were prepared as per the instructions of the LIVE/DEAD BacLight bacterial Viability kit (Invitrogen) and fixed by agarose implantation. Vancomycin binding sites were detected with 1 μg/ml Bodipy FL vancomycin (Vanco-FL; Invitrogen). Specific images were obtained with fixed exposure times and fluorescence distributions calculated with ImageJ (NIH). Microscopy data are representative of three or more fields of view from independent experiments.
RNA extraction.
Bacteria from log-phase overnight cultures were diluted to an OD600 of 0.2 in MH and inoculated into an equal volume of MH or MH+2.0% NaCl (final starting OD600 of 0.1 and final NaCl concentration of 1.0%). At the indicated time points, bacteria were removed into a 1/10 volume of 10× stop solution (5% buffer-saturated phenol in 95% ethanol), collected by centrifugation at 10,000 × g for 5 min at room temperature, flash frozen in a dry ice-ethanol bath, and stored at −80°C. Total RNA was extracted at growth curve time points based on methods described previously (16). The RNA concentration was quantified using an ND-1000 spectrophotometer (NanoDrop, Wilmington, DE), and RNA quality was assessed by electrophoresis on 1.0% agarose–Tris-acetate-EDTA (TAE) gels. The absence of genomic DNA within RNA samples was confirmed by PCR.
Construction of the C. jejuni DNA microarray, sample hybridization, and analysis.
Construction of the DNA microarray was performed essentially as previously described (35). In addition, open reading frames specific to strain 81-176 were included on the array using primers from Operon Technologies (Alameda, CA) designed with ArrayDesigner 2.0 (Premier Biosoft, Palo Alto, CA). An indirect comparison of gene expression was performed in which the expression profiles of C. jejuni 81-176 cultured in the presence and absence of 1.0% NaCl were determined separately on different slides (35). Cy3-labeled test cDNA (C. jejuni with or without NaCl) was mixed with Cy5-labeled reference genomic DNA from strain C. jejuni 81-176 and hybridized to the Campylobacter cDNA array. Arrays were scanned using an Axon GenePix 4000B microarray laser scanner (Axon Instruments, Union City, CA). The array experiment was repeated two times (biological replicate) with two technical replicate arrays and two replicate features per array for each of the 5 time points studied. Spot and background intensity data were processed with GenePix 4.0 software, and data normalization was performed to compensate for differences in the template amount or unequal Cy3 or Cy5 dye incorporation as previously described (35). Normalized data were analyzed with GeneSpring 7.3 software (Silicon Genetics, Palo Alto, CA). A parametric statistical t test was used to determine the significance of the centered data at a P value of <0.05, adjusting the individual P value with the Benjamini-Hochberg false-discovery rate multiple-test correction in the GeneSpring analysis package.
RT-qPCR validation of selected microarray data.
To validate the temporal expression of dnaK and groEL, real-time quantitative PCR (RT-qPCR) was performed on the RNA isolated for the transcriptome profile. Total RNA was used to generate cDNA using SSII enzyme (Invitrogen) and cleaned with the QIAquick PCR purification kit (Qiagen). RT-qPCRs were performed with iQ SYBR green (Bio-Rad, Hercules, CA) chemistry as per the manufacturer's instructions. Briefly, RT-qPCR amplification of 7 μl of cDNA (20 ng μl−1) was added to a reaction mix containing 7.5 μl 2× SYBR green master mix, 0.3 μl of a 10 μM mix of forward and reverse primers, and 0.2 μl H2O. Amplification was performed using Opticon 2 thermocycler (Bio-Rad), and the comparative threshold cycle (ΔΔCT) method was used to calculate fold change where samples were normalized to gyrA (48). Reactions were performed in duplicate, and two biological replicates were performed for each sample. Primer sequences are shown in Table S3 in the supplemental material.
Flow cytometry.
Flow cytometry and sorting were conducted on an LSRII flow cytometer (BD, Mississauga, Ontario, Canada) and data analyzed using FlowJo analysis software (Tree Star, Ashland, OR). Sample preparations were as follows. Log-phase cultures of C. jejuni 81-176 harboring pAtpF′-GFP were grown under standard conditions overnight. The plasmid is derived from pMW10 (63) and harbors the atpF′ promoter fused to a stable GFP reporter (pAtpF′-GFP). Mid-log-phase cultures were diluted to an OD600 of 0.005 in MH-Kn or MH-Kn plus 1.0% NaCl and sampled at various time points. Samples were standardized to an OD600 of 0.1 in 1 ml, washed with PBS, and then diluted 10-fold and immediately analyzed by flow cytometry. For fluorescence-activated cell sorting (FACS), 100,000 events were sorted from each gated population (see Fig. 6) into prewarmed MH-Kn. Samples were then centrifuged, washed with MH-Kn, and assessed by plating 10-fold dilutions.
RESULTS
Increasing the osmotic concentration inhibits growth of C. jejuni.
Previous reports have noted that Campylobacter spp. are highly intolerant to osmotic stress compared to other bacterial food-borne pathogens and are incapable of growing in medium preparations containing 2.0% NaCl (+0.68 osmol liter−1) (11). To establish the temporal response of C. jejuni strain 81-176 to various osmolarities and an appropriate hyperosmotic upshock concentration for further experiments, C. jejuni strain 81-176 was grown in MH supplemented with a range of physiologically relevant NaCl concentrations (Fig. 1A), and bacterial culturability was assessed over a 48-h period (Fig. 1B and C). In MH medium supplemented with NaCl at 1.5% (+0.51 osmol liter−1) or higher, logarithmic growth was prevented, and a severe decrease in CFU counts was observed. In contrast, C. jejuni 81-176 grown in MH medium supplemented with 1.0% NaCl (+0.34 osmol liter−1) exhibited a brief initial lag/adaptation phase (0 to 4 h), a period of log-phase growth (4 to 12 h), and finally a decline in late-stage culturability (12 h onwards). Supplementation with 0.5% NaCl (+0.17 osmol liter−1) resulted in growth and survival characteristics similar to those seen in unsupplemented MH medium.
Hyperosmotically stressed C. jejuni exhibits filamentation and population length heterogeneity.
Loss of culturability, aging, and exposure to stresses such as low-nutrient and hypoosmotic conditions are associated with conversion into a viable-but-nonculturable (VBNC) state, often represented by a coccoid morphology in Campylobacter spp. (7, 47, 57). C. jejuni exposed to hyperosmotic conditions was observed by light microscopy to determine if late-stage growth defects correlated with increased coccoid formation. An increase in coccoid formation was not observed under any hyperosmotic condition tested. However, filamentation did occur in a proportion of the bacterial population grown in the presence of 1.0% and 1.5% NaCl (Fig. 2A). Visual inspection (Fig. 2A) and single-cell analyses (Fig. 2B and C) showed that the degree of filamentation increased with both osmotic concentration (Fig. 2B) (12 h is shown as representative) and over time until later growth stages (Fig. 2C) (+1.0% NaCl is shown as representative). In the +2.0% NaCl condition, no filamentation was observed, and the population was nonmotile. In contrast, filaments and normal-length bacteria in the +1.0% and +1.5% NaCl conditions were motile (i.e., alive), although longer filaments swam less efficiently than shorter cells. Filament length was heterogenous (Fig. 2B and C), with some filaments exceeding 25 μm in length (not shown).
Fig 2.

Hyperosmotic stress leads to C. jejuni cell length alteration. (A) Bright-field microscopy of bacteria from NaCl-supplemented cultures sampled over a 48-h period demonstrated that filamentation occurs in a narrow hyperosmotic range. Increased progression to the coccoid form was not observed, and not all cells are filamented. Scale bars, 1 μm. (B) Measurement of filament length from NaCl-supplemented cultures demonstrated that the proportion of filaments increased with osmolarity (the 12-h time point is shown) except under +2.0% NaCl conditions. (C) Filament length and abundance increased with time (the +1.0% NaCl condition is shown). Data tables include number of bacteria analyzed (n), mean length (μ) in μm, and coefficient of variation (cv%; standard deviation to mean ratio). All data are representative of at least 3 independent fields of view.
Growth inhibition and filamentation are general responses to hyperosmotic stress.
To determine if growth defects and filamentation were a specific response to NaCl or a general response to hyperosmotic stress, the effects of other osmotic stressors were tested. Both ionic (KCl and MgCl2) and nonionic (sucrose) stressors were compared to differentiate between hyperosmotic or hyperionic responses. The salts KCl and MgCl2 and the sugar sucrose were added to normal MH medium at concentrations comparable to initial NaCl concentrations, and the osmolarity of the stressor solutions added to the media was calculated (see Materials and Methods). The representative growth curve OD600 readings shown in Fig. 3A indicated that growth was generally inhibited in an osmotic concentration-dependent manner. All osmotic stressors tested also resulted in filamentation (representative examples are shown in Fig. 3B). The MIC90 of each stressor was also determined, as was the minimum inhibitory osmotic concentration (Table 1). For these analyses, sucrose was replaced by glucose due to solubility limitations for MIC90 determination. The minimum inhibitory osmotic concentration was equivalent for all osmotic stressors tested at +0.313 osmol liter−1, or a total 0.620 osmol liter−1 taking into account the basal osmolarity of MH medium. The ratio of MIC90 to minimum inhibitory osmotic concentration for each stressor also correlated with the number of species into which that stressor dissociates. For instance, MgCl2 dissociates into three species, NaCl dissociates into two species, and glucose is a single molecule. Correspondingly, the MIC90 for added glucose was 3 times that of added MgCl2 and 2 times that of added NaCl, with each stressor yielding an equivalent minimum inhibitory osmotic concentration. These observations also held true for C. jejuni strains NCTC 11168 and NCTC 81116, with each strain exhibiting MIC90 and filamentation characteristics identical to those of strain 81-176 (not shown). Based on the growth and filamentation profiles shown in Fig. 1 and 2 and the fact that ionic and nonionic stressors yielded identical MIC90s, MH+1.0% NaCl was used as a representative hyperosmotic stress condition for all further broth-based analyses. For plate-based assays, MH agar plates with 0.8% instead of 1.0% NaCl were used, as general growth characteristics were more equivalent to those in MH+1.0% NaCl broth due to moderate plate desiccation.
Fig 3.
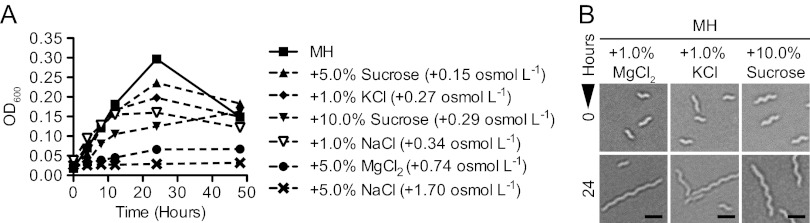
Growth inhibition and filamentation occur under multiple types of hyperosmotic stress. (A) OD600 readings of broth cultures of C. jejuni grown in MH medium supplemented with various concentrations of ionic (NaCl, MgCl2, or KCl) and nonionic (sucrose) osmotic stressors over 48 h showed that growth inhibition generally correlated with osmotic concentration. Error bars are present but in most cases are too small to see. (B) Bright-field microscopy illustrated that filamentation was an effect of both ionic (MgCl2 or KCl) and nonionic (sucrose) osmotic stressors. Scale bars, 1 μm; data from microscopy are representative of at least 3 independent fields of view.
Table 1.
Growth inhibition occurs at the same osmotic concentration in the presence of both ionic and nonionic stressors
| Stressor | No. of speciesa | MIC90 (M) | Minimum inhibitory osmotic concn90 (osmol liter−1) | Total inhibitory osmotic concn90b (osmol liter−1) |
|---|---|---|---|---|
| NaCl | 2 | 0.160 | 0.313 | 0.620 |
| KCl | 2 | 0.160 | 0.313 | 0.620 |
| MgCl2 | 3 | 0.109 | 0.313 | 0.620 |
| Glucose | 1 | 0.308 | 0.313 | 0.620 |
Number of species into which the stressor molecule dissociates in solution.
Total osmolarity calculated from the measurement of MH osmolarity (0.307 osmol liter−1) plus the calculated osmolarity of the added stressor.
Heterogeneity among cells and within filaments in hyperosmotically stressed C. jejuni.
We next wished to explore additional characteristics of the filaments. DNA dyes traditionally used for live/dead enumeration were initially employed with the goal of exploring filament and population viability. Syto-9 (green) stains all bacteria, while propidium iodide (PI) is commonly used to identify dead bacteria because entry indicates membrane disruption indicative of cell death (5). Despite significant efforts to optimize staining procedures, we found that PI is not ideal for microscopic determination of live/dead C. jejuni, as nearly all living (motile) wild-type bacteria grown under standard conditions fluoresced when stained with PI (Fig. 4A). In contrast, under hyperosmotic stress, a number of cells did not stain with PI. Furthermore, distinct regions of many filamented cells excluded PI (Fig. 4A, arrowheads) but were not anucleoid, as Syto-9 stained normally. As bacterial filamentation occurs because of continued growth (elongation) in the absence of complete separation (division), this suggested that septa had formed, as PI entering a part of the filament would otherwise leach into neighboring cells that excluded PI. We further investigated septation in filamentous cells using a fluorescent vancomycin derivative (Vanco-FL) which has been used to highlight putative septa in Helicobacter pylori (4). Vanco-FL binds d-Ala-d-Ala moieties of peptidoglycan and may represent the septa and/or sites of new peptidoglycan synthesis. By microscopy, most (>80%) C. jejuni cells growing in +1.0% NaCl did not fluoresce with Vanco-FL at the concentration used, nor did most cells from conditions without added salt. However, filamentous cells that did fluoresce displayed a highly symmetrical pattern of punctate dots, likely representing individual septa (Fig. 4B, left). Fluorescence distribution analysis of Vanco-FL and PI costaining (Fig. 4B, right) suggested that PI and Vanco-FL did not colocalize. Collectively, these data indicate that individual cells within a hyperosmotically stressed population, as well as within a filament, have the capacity for phenotypic heterogeneity.
Fig 4.

Heterogeneity within hyperosmotically stressed populations and filaments and symmetrical staining with fluorescent vancomycin (Vanco-FL). Bacteria were grown for 12 h in unsupplemented MH broth or MH broth +1.0% NaCl and prepared for microscopy. (A) C. jejuni stained with propidium iodide (PI) (red) and Syto-9 (green) from the LIVE/DEAD BacLight kit. The wild type under standard conditions fluoresced with PI, while some cells under hyperosmotic conditions excluded PI, as did many of the cells within filaments (yellow arrows). (B) Filaments stained with Vanco-FL (white-gray) and PI (red) and analysis by fluorescence distribution. Fluorescence units are arbitrary. Scale bars, 1 μm.
Salt-sensitive clones are identified within the wild-type population.
Previous work in our laboratory identified several targeted and transposon mutants that were defective for growth on hyperosmotic media. Although salt sensitivity was linked to disruption of the targeted gene in a number of instances (6, 55), in other cases salt sensitivity was not linked to the introduced mutation, with wild-type-levels of resistance restored when the mutation was reintroduced into a wild-type genetic background (E. Frirdich, A. Cameron, and E. C. Gaynor, unpublished data). This suggested that salt-sensitive clones occur frequently within the wild-type population. To investigate this, and to establish the frequency with which this occurs, wild-type C. jejuni was streaked on MH medium for single colonies, of which 200 were isolated and patched onto MH (control/passage) or MH+0.8% NaCl (test) plates. Of the 200 clones, 21.6% ± 1.2% displayed either complete or partial growth inhibition (“sensitive”) on hyperosmotic medium based on a visual rating scheme comparing growth between isolates, whereas 13.3% ± 1.8% of the clones displayed heavier growth than the original wild-type population (“enhanced”) (Fig. 5A to C). Phase variation of the capsular polysaccharide (CPS) occurs at a comparable rate (3), and we have found that an acapsular mutant (ΔkpsM) is hypersensitive to osmotic stress (see below). However, CPS immunoblotting showed that 7 randomly selected salt-sensitive clones produced the CPS (not shown). As we also wished to explore the potential for reversibility of these phenotypes, 5 sensitive (F6, C10, E7, G8, and G10), 5 wild-type-like (A14, B8, C19, D13, and G21), and 5 enhanced (E20, F20, H9, B13, and B22) clones were selected from the corresponding MH (control/passage) plate and passed daily on standard MH medium for 2 days. Two hundred progeny from each of these 15 clones (“progeny of progeny”) were assessed for salt sensitivity as described above. Progeny from all 15 clonal populations exhibited heterogeneity in sensitivity and resistance to osmotic stress, with all populations again being composed of sensitive, wild-type-like, or enhanced individuals (Fig. 5D and E). However, sensitive clones yielded an increase in the number of sensitive “progeny of progeny,” up to 79.3% ± 1.5% of the population compared to 21.6% ± 1.2% observed for the starting wild-type population. The 5 sensitive clones (F6, C10, E7, G8, and G10) were also quantitatively assessed for hyperosmotic stress survival in comparison to the wild type on MH, MH+0.8% NaCl, and MH+1.0% NaCl plates. Using CFU determinations, we found that F6, C10, E7, G8, and G10 were 5.8-, 7.4-, 6.4-, 13.8-, and 5.7-fold more sensitive on MH+0.8% NaCl than the wild type, respectively, with 4 of these 5 clones exhibiting no growth on MH+1.0% NaCl (Fig. 5F). Collectively, these data indicate that subpopulations of osmotic stress-sensitive and -enhanced bacteria were found within the population, with sensitive clones yielding higher numbers of sensitive “progeny of progeny” than the starting population. However, all clones (enhanced, wild-type-like, and sensitive) retained the capacity to generate heterogeneous “progeny of progeny.”
Fig 5.

Salt-sensitive isolates within the wild-type population. Two hundred single colonies were isolated from MH plates and patched on MH (control/passage) or MH+0.8% NaCl (test) plates. (A) Patches were assessed by microscopy and graded for growth by three categories; black represents minimal or no growth (“sensitive”), gray indicates characteristic (“WT-like”) growth, and white represents heavy growth (“enhanced”). (B) Percentages of 200 clones tested that were categorized as sensitive, WT-like, or enhanced. Error bars represent the fact that streaks were graded 3 times blind and that some streaks had intermediate phenotypes. (C) Visual heat map representation of the sensitivity profiles of the 200 clones. Intermediate phenotypes are represented by lighter or darker shades of gray, and numbered clones indicate progeny that were then selected from the MH (control/passage) plates, passed 2 times on MH, and then retested to examine the heritability of phenotypes. (D) Percentages of 200 clones of 15 progeny (5 sensitive, 5 WT-like, and 5 enhanced; “progeny of progeny”) falling into the same 3 categories. (E) Visual heat map representation of sensitivity profiles for 200 clones of the 15 progeny (“progeny of progeny”). For sensitive progeny, the majority of clones tested retained a sensitive phenotype, but WT-like or enhanced growth was also observed within those populations. Crossed-out boxes indicate tests where growth was not observed on the MH control plate. (F) CFU enumeration of sensitive clones F6, C10, E7, G8, and G10 in comparison to the wild type. Tenfold dilutions of an OD-standardized culture were plated on MH, MH+0.8%, or MH+1.0% NaCl plates and CFU enumerated; experiments were performed in triplicate. Most of the sensitive clones (F6, E7, G8, and G10) exhibited no growth on MH+1.0% NaCl (bars absent). All strains exhibited statistically significant (P ≤ 0.05) differences compared to the wild type for growth on the two NaCl concentrations and insignificant differences on MH alone. For space purposes, statistics are shown for wild type versus F6 only. *, P ≤ 0.05; **, P ≤ 0.01.
Single-cell analysis reveals bistable heterogeneity.
In addition to the observation that preexisting salt-sensitive clones occur in a wild-type population not previously subjected to salt stress (Fig. 5), we also observed instances of phenotypic heterogeneity (i.e., differential growth and survival) that were induced by exposure of wild-type C. jejuni to hyperosmotic stress. One example of this was the appearance of large and small colony variants when wild-type C. jejuni was plated for single colonies on NaCl-supplemented agar (Fig. 6A, photographs). Colony area measurements likewise illustrate the bimodal distribution of colony size under hyperosmotic stress (Fig. 6A, histograms). Small variants were not observed on standard MH plates and were distinct from the salt-sensitive clones described above, as small variants were not defective for osmotic tolerance and gave rise to both large and small daughter colonies on plates with NaCl at a frequency similar to that for the starting population (not shown). We further explored single-cell variability during hyperosmotic stress by transforming wild-type C. jejuni with a plasmid encoding the ATP synthase promoter fused to a stable green fluorescent protein gene (pAtpF′-GFP) and examining expression in individuals across the entire population. The ATP synthase promoter was initially identified as a strong promoter (34) and is also upregulated under hyperosmotic conditions (see “Temporal transcriptional profile of C. jejuni in response to hyperosmotic stress” below) (Table 2). Since active growth requires ATP production and consumption, we hypothesized that increased expression of ATP synthase would occur in bacteria able to grow in +1.0% NaCl (42). Microscopy and flow cytometry revealed that plasmid-carrying C. jejuni exposed to MH+1.0% NaCl for 12 h bifurcated into GFPlow and GFPhigh subpopulations, with the GFPlow bacteria comprising 16.0% ± 2.3% of the total population (Fig. 6B and C). In comparison, control bacteria grown in MH with no added NaCl (GFP0) exhibited unimodal (typical bell curve) GFP expression. Fluorescence-activated cell sorting (FACS) was used to sort 105 GFP0, GFPlow, and GFPhigh bacteria, which were then plated for CFU on both standard MH and NaCl-supplemented media. As with small-colony variants, individuals from the GFPlow population were not more salt sensitive than the starting population after recovery (not shown); however, over 10-fold-fewer total CFU were recovered for the GFPlow population than for GFPhigh clones on both standard and NaCl-supplemented media (Fig. 6D and data not shown). The GFPhigh population comprised the majority of the total population and was nearly 100% culturable under normal and hyperosmotic conditions (Fig. 6D and data not shown). As with the colony size variants, colonies isolated from either the GFPlow or GFPhigh populations that were grown overnight on standard medium and then subjected to salt stress exhibited the same pattern of bifurcation by FACS as observed for the original population (not shown). The appearance of two distinguishable or bimodal phenotypes in a clonal population has been observed in other bacteria and is commonly referred to as bistability (12, 58).
Fig 6.

Bistability in colony size and expression of GFP from pAtpF′. (A) Heterogeneity in C. jejuni colony size when wild-type bacteria were plated on medium supplemented with 0.8% NaCl and grown for 48 h. Area measurements of colonies from plate images (upper panels) demonstrated a bimodal distribution of colony size on +0.8% NaCl plates (histograms, lower panels). (B) Bacteria harboring the pAtpF′-GFP plasmid were analyzed by flow cytometry. Following 12 h in MH plus 1.0% NaCl, the population bifurcated into GFPlow and GFPhigh populations (lower panel), while bacteria remaining in MH broth did not (upper panel). (C) Bifurcation was confirmed by fluorescence microscopy. Microscopy is representative of 3 independent fields of view. Scale bar, 3 μm. (D) FACS sorting of the GFP0, GFPlow, and GFPhigh populations and plating for CFU revealed that GFPhigh bacteria were as culturable as GFP0 bacteria and that GFPlow bacteria had ∼10× reduced culturability on MH medium (shown) and MH medium plus 0.8% NaCl (not shown). Error bars are derived from 3 independent experiments. **, P ≤ 0.01.
Table 2.
Selected genes upregulated 2-fold or more under hyperosmotic stress
| Functional class and protein | Gene | Locus tag | Fold upregulation at: |
||||
|---|---|---|---|---|---|---|---|
| 15 min | 1.5 h | 3 h | 6 h | 12 h | |||
| Regulation and signal transduction | |||||||
| Campylobacter bile response regulator | cbrR | cj0643 | 2.2 | 2.9 | 2.9 | ||
| Heat-inducible transcription repressor | hrcA | cj0757 | 6.7 | 2.0 | 2.2 | 2.6 | 2.9 |
| Bipartate energy taxis response protein | cetB | cj1189c | 2.2 | 3.5 | 3.3 | 2.1 | |
| Bipartate energy taxis response protein | cetA | cj1190c | 2.0 | 3.6 | 2.4 | 2.1 | |
| Heat shock transcriptional regulator | hspR | cj1230 | 3.1 | ||||
| Putative helix-turn-helix-containing protein | cj1533c | 3.5 | 2.8 | 2.6 | 2.3 | 2.0 | |
| Detoxification and protection | |||||||
| Superoxide dismutase | sodB | cj0169 | 2.0 | 2.5 | 2.4 | ||
| Catalase | katA | cj1385 | 2.2 | 2.2 | |||
| Chaperones, chaperonins, heat shock, proteases | |||||||
| ATP-dependent Clp protease | clpB | cj0509c | 2.3 | ||||
| Heat shock protein | grpE | cj0758 | 9.4 | 2.2 | 2.5 | 2.6 | 4.0 |
| Heat shock protein | dnaK | cj0759 | 12.8 | 2.4 | 2.8 | 2.5 | 6.9 |
| 60-kDa chaperonin | groEL | cj1221 | 6.9 | 3.0 | 5.0 | 2.6 | |
| Putative curved-DNA binding protein | cbpA | cj1229 | 2.7 | ||||
| Amino acid biosynthesis | |||||||
| Glutamate synthase | gltD | cj0009 | 4.8 | ||||
| Putative anthranilate synthase component I | trpE | cj0345 | 2.1 | 3.1 | 13.9 | ||
| N-(5′-Phosphoribosyl)anthranilate isomerase | trpF | cj0347 | 3.4 | 2.9 | 4.4 | 2.9 | 3.5 |
| Tryptophan synthase beta chain | trpB | cj0348 | 3.0 | 3.2 | 5.1 | 3.0 | |
| Tryptophan synthase alpha chain | trpA | cj0349 | 3.1 | 3.1 | 4.6 | 2.0 | 3.1 |
| Glutamine synthetase | glnA | cj0699c | 5.3 | ||||
| Cysteine synthase | cysM | cj0912c | 2.2 | 3.8 | 3.8 | 2.4 | |
| Putative cystathionine beta-lyase | cj1392 | 2.4 | 4.1 | 3.8 | 2.9 | 3.9 | |
| 3-Isopropylmalate dehydratase small subunit | leuD | cj1716c | 2.7 | 4.3 | 3.1 | ||
| 3-Isopropylmalate dehydratase large subunit | leuC | cj1717c | 2.4 | 3.4 | 6.5 | 3.4 | |
| 3-Isopropylmalate dehydrogenase | leuB | cj1718c | 2.4 | 3.8 | 7.3 | 3.5 | |
| 2-Isopropylmalate synthase | leuA | cj1719c | 2.2 | 3.1 | 6.1 | 3.3 | |
| ATP synthesis | |||||||
| ATP synthase Fo sector, subunit B′ | atpF′ | cj0102 | 3.5 | ||||
| ATP synthase Fo sector subunit B | atpF | cj0103 | 4.9 | ||||
| ATP synthase F1 sector delta subunit | atpH | cj0104 | 2.1 | 4.3 | |||
| ATP synthase F1 sector alpha subunit | atpA | cj0105 | 2.2 | 3.7 | |||
| ATP synthase F1 sector gamma subunit | atpG | cj0106 | 2.1 | 3.6 | |||
| ATP synthase F1 sector beta subunit | atpD | cj0107 | 3.4 | ||||
| ATP synthase Fo sector C subunit | atpC | cj0936 | 2.3 | 2.6 | |||
| Transport/binding proteins | |||||||
| Putative MATE family transport protein | cj0560 | 2.2 | 2.0 | 2.1 | |||
| Degenerate K+-transporting ATPase, B subunit | kdpB | cj0677 | 2.1 | ||||
| Aspartate/glutamate binding ABC transporter | peb1B | cj0921c | 2.2 | ||||
| Putative glutamine permease | glnP | cj0940c | 2.4 | ||||
| Surface, polysaccharides, antigens | |||||||
| Putative periplasmic protein | cj0561c | 5.4 | 5.0 | 11.2 | 9.2 | 11.8 | |
| Major antigenic peptide PEB2 | peb2 | cj0778 | 2.1 | 3.0 | 2.9 | 2.1 | |
| 50-kDa outer membrane protein precursor | omp50 | cj1170c | 4.3 | ||||
| Capsule polysaccharide export system | kpsM | cj1448c | 2.1 | 2.0 | 2.5 | 3.2 | |
| Miscellaneous | |||||||
| Protease | pspA | cj0068 | 2.2 | 2.0 | 3.7 | ||
| Peptidyl-tRNA hydrolase | pth | cj0312 | 2.2 | 2.9 | 3.1 | 3.6 | 3.8 |
| Putative endoribonuclease L-PSP | cj1388 | 2.2 | 2.9 | 3.0 | 3.2 | 2.7 | |
Temporal transcriptional profile of C. jejuni in response to hyperosmotic stress.
In addition to the single-cell analyses described above, we also established the whole-genome transcriptional response of the overall population to hyperosmotic stress over a 12-h time course corresponding to initial adaptation and postadaptation log-phase growth (see the +1.0% NaCl condition in Fig. 1C). Log-phase bacteria inoculated into either MH or MH+1.0% NaCl were harvested after 15 min, 1.5 h, 3 h, 6 h, and 12 h for RNA isolation and microarray analyses. Two biological replicates were assessed, each with consistent expression profiles; the data shown represent the fold expression difference for genes in hyperosmotically shifted bacteria relative to those remaining in MH broth. Tables 2 (genes upregulated in MH+1.0% NaCl) and 3 (genes downregulated in MH+1.0% NaCl) highlight genes that were the most highly dysregulated or genes associated with osmotic transcriptional responses in other bacteria. Tables S1 and S2 in the supplemental material give complete lists of all genes with expression changes greater than 2-fold at one or more time points. In general, there were three major expression profiles: (i) genes with early and transient expression changes, (ii) genes with early and long-lasting changes, and (iii) genes with greater expression changes at later time points.
Table 3.
Selected genes downregulated 2-fold or more under hyperosmotic stress
| Functional class and protein | Gene | Locus tag | Fold downregulation at: |
||||
|---|---|---|---|---|---|---|---|
| 15 min | 1.5 h | 3 h | 6 h | 12 h | |||
| Surface, polysaccharides, antigens | |||||||
| Major antigenic peptide PEB cell binding factor | peb4 | cj0596 | 2.1 | 2.0 | 2.4 | 6.2 | |
| 50-kDa outer membrane protein precursor | omp50 | cj1170c | 2.6 | 2.9 | |||
| Transport/binding proteins | |||||||
| l-Lactate permease | lctP | cj0076c | 2.0 | 15.8 | |||
| Degenerate K+-transporting ATPase, A subunit | kdpA | cj0676 | 2.0 | ||||
| Degenerate K+-transporting ATPase, B subunit | kdpB | cj0677 | 2.2 | ||||
| Bifunctional adhesin/ABC transporter aspartate/glutamate binding protein | peb1A | cj0921c | 4.0 | ||||
| Putative MFS transport protein | cjaB | cj0981c | 2.0 | ||||
| Putative amino acid transporter periplasmic solute-binding protein | cjaA | cj0982c | 2.3 | 3.2 | 3.7 | 2.8 | 3.9 |
| Putative sodium/proline symporter | putP | cj1502c | 2.5 | 4.6 | 8.7 | ||
| Amino acid transporter (serine dehydratase) | sdaC | cj1625c | 4.9 | 3.0 | 2.5 | 5.9 | |
| Chaperones, chaperonins, heat shock, proteases | |||||||
| ATP-dependent protease peptidase subunit | hslV | cj0663c | 3.0 | ||||
| Serine protease | htrA | cj1228c | 3.6 | ||||
| Electron transport and TCA cycle | |||||||
| Molybdopterin-containing oxidoreductase | cj0264c | 3.3 | 7.5 | 6.2 | 12.8 | ||
| Putative cytochrome c-type heme binding periplasmic protein | cj0265c | 4.1 | 2.6 | 6.9 | 8.4 | 10.2 | |
| Putative cytochrome c551 peroxidase | cj0358 | 3.1 | 3.1 | 2.3 | |||
| Putative malate:quinone oxidoreductase | mqo | cj0393c | 3.3 | 4.0 | 2.9 | ||
| Putative oxidoreductase subunit | cj0414 | 4.4 | 9.1 | ||||
| Putative oxidoreductase subunit | cj0415 | 4.7 | 9.4 | ||||
| Isocitrate dehydrogenase | icd | cj0531 | 3.0 | 2.8 | 6.5 | ||
| Malate dehydrogenase | mdh | cj0532 | 2.1 | 2.2 | 2.2 | 5.8 | |
| Succinyl coenzyme A synthetase beta chain | sucC | cj0533 | 2.3 | 10.3 | |||
| Succinyl coenzyme A synthetase alpha chain | sucD | cj0534 | 7.5 | ||||
| 2-Oxoglutarate acceptor oxidoreductase subunit | oorD | cj0535 | 2.2 | 6.8 | |||
| 2-Oxoglutarate acceptor oxidoreductase subunit | oorA | cj0536 | 2.1 | 2.5 | 7.7 | ||
| 2-Oxoglutarate acceptor oxidoreductase subunit | oorB | cj0537 | 2.4 | 2.8 | 8.5 | ||
| 2-Oxoglutarate acceptor oxidoreductase subunit | oorC | cj0538 | 2.4 | 6.7 | |||
| Bifunctional aconitate hydratase 2,2-methylisocitrate dehydratase | acnB | cj0835c | 2.1 | 3.0 | 4.9 | ||
| Malate oxidoreductase | cj1287c | 2.2 | 2.0 | 2.5 | 2.3 | ||
| NADH dehydrogenase I chain N | nuoN | cj1566c | 2.4 | 3.0 | 4.4 | ||
| NADH dehydrogenase I chain M | nuoM | cj1567c | 2.3 | 3.2 | 4.3 | ||
| NADH dehydrogenase subunit L | nuoL | cj1568c | 2.3 | 2.8 | 4.6 | ||
| NADH dehydrogenase I chain K | nuoK | cj1569c | 2.1 | 2.7 | 4.0 | ||
| NADH dehydrogenase subunit J | nuoJ | cj1570c | 2.5 | 3.4 | |||
| NADH dehydrogenase subunit I | nuoI | cj1571c | 2.5 | 3.2 | 4.5 | ||
| NADH dehydrogenase subunit G | nuoG | cj1573c | 2.3 | 3.0 | 4.3 | ||
| Citrate synthase | gltA | cj1682c | 2.7 | 2.8 | 4.0 | 4.9 | |
| Other metabolism | |||||||
| Putative phosphate acetyltransferase | pta | cj0688 | 3.0 | 6.9 | |||
| Acetyl coenzyme A synthetase | acs | cj1537c | 6.3 | ||||
| l-Serine dehydratase | sdaA | cj1624c | 4.1 | 3.8 | 3.2 | 6.8 | |
| Amino acid biosynthesis | |||||||
| Glutamine synthetase | glnA | cj0699c | 2.5 | 2.2 | |||
| Aspartate aminotransferase | aspB | cj0762c | 2.1 | 2.8 | 4.1 | 6.2 | |
| Isopropylmalate isomerase small subunit | leuD | cj1716c | 3.0 | ||||
| Isopropylmalate isomerase large subunit | leuC | cj1717c | 3.6 | ||||
| 3-Isopropylmalate dehydrogenase | leuB | cj1718c | 4.9 | ||||
| 2-Isopropylmalate synthase | leuA | cj1719c | 4.4 | ||||
The early and transient hyperosmotic stress transcriptional profile included many genes with similar behavior in other bacteria. For example, general downregulation of ribosomal protein genes (rpl and rps) was observed at 15 min postexposure, coinciding with a temporary growth arrest, while the same genes later returned to steady-state or greater expression levels with the resumption of growth. Genes with a potential role in osmoadaptation were also differentially expressed. These included gltD and glnA, encoding proteins for glutamate and glutamine synthesis, which were both highly upregulated at 15 min postexposure but not at later time points, and kdpB, encoding the ATPase subunit of the major potassium transporter. Additionally, rapid upregulation of heat shock protein genes occurred in salt-stressed C. jejuni, including groEL, dnaK, grpE, and clpB. The degree of upregulation dropped sharply as growth resumed but remained consistently higher than in unstressed bacteria.
Genes with early and long-lasting expression changes included several upregulated amino acid biosynthesis enzyme genes, including trpABFE (tryptophan biosynthesis), cysM (cysteine biosynthesis), and leuABCD (leucine biosynthesis). In keeping with other bacteria, C. jejuni appeared to modestly upregulate oxidative stress genes such as those for catalase (katA) and superoxide dismutase (sodB) at all time points. We also observed striking upregulation of cj0561c at all time points. This gene was previously identified as being controlled by the negative regulator CmeR and is also upregulated by bile salts and in the intestinal tract; however, a cj0561c mutant does not have increased sensitivity to bile (18, 54). Cj0561c is annotated as a putative periplasmic protein, although bioinformatic analysis suggests that it has a porin-like architecture. We constructed a targeted deletion of cj0561c but found that the mutant was not defective for growth or survival under hyperosmotic conditions (not shown). Several known and putative regulatory elements were also shown to have early and long-lasting expression changes. These included upregulated bipartite energy taxis response system genes cetAB and the gene for a putative helix-turn-helix domain containing protein, Cj1533c. Also upregulated continuously was hrcA, encoding a negative regulator of the grpE, dnaK, and groEL heat shock proteins (21).
Genes with notable expression changes in response to NaCl at later time points include those involved in many metabolic and energy production pathways. For instance, there was downregulation of many genes encoding tricarboxylic acid (TCA) cycle proteins (gltA, acnB, icd, mdh, mqo, and suc) and genes for electron transport and other important metabolic functions (nuo, oor, and acs). This was somewhat paradoxical given that this downregulation was accompanied by upregulation of genes encoding the primary ATP synthase. The atpF′ gene is the first gene in the synthase operon, which was upregulated beginning at 6 h after NaCl exposure. Also of note was upregulation of kpsM, encoding the CPS export system inner membrane protein; however, there were no significant changes in any other genes of the capsular polysaccharide locus. Other upregulated genes included pspA, encoding a probable protease, and pth, encoding the peptidyl-tRNA hydrolase which is responsible for recycling excess peptidyl-tRNA, an essential requirement for continued protein synthesis (9). In this category were also two transcriptional regulator genes, cbrR and hspR. The CbrR (Campylobacter bile resistance) response regulator is crucial for tolerance to sodium deoxycholate and chicken colonization (46), while HspR is a negative regulator of the heat shock response (1). Downregulated genes included sdaA and sdaC, encoding the serine transporter and hydratase, lctP, encoding lactate permease, and putP, encoding a putative sodium/proline transporter. Expression trends of dnaK, groEL, katA, and kpsM were confirmed by RT-qPCR (see Fig. S1A in the supplemental material).
Cross-regulation of oxidative and temperature adaptation and a role for the capsule in C. jejuni hyperosmotic stress tolerance.
Finally, we investigated whether the above gene expression changes from exposure to hyperosmotic stress might enhance or diminish the ability of C. jejuni to survive other biological stresses and/or lead to the identification of new genes important for osmotic tolerance. It is known that exposure to one type of stress can condition bacteria against other stresses; for instance, hyperosmotic stress has been shown to increase the thermotolerance and oxidative stress resistance of other food-borne pathogens (13, 17, 19, 56). As the C. jejuni hyperosmotic transcriptome showed upregulation of oxidative stress genes (katA and sodB) and the majority of the heat shock genes (groEL, dnaK, grpE, clpB, hrcA, and hspR), we explored whether exposure to hyperosmotic stress would cross-protect C. jejuni against oxidative or thermal stress. Logarithmic-phase bacteria were exposed to hyperosmotic stress (1.0% NaCl in MH) for 2 h, washed, and then subjected to treatment with 5 mM H2O2 or heated to 45°C, after which survival was assessed by plating for CFU. Bacteria exposed to hyperosmotic stress were modestly, but significantly, protected against damage by oxidative stress (Fig. 7A), with 2.6-fold more bacteria surviving a 40-min exposure to 5 mM H2O2. In contrast, hyperosmotically stressed bacteria exposed to 45°C heat stress for 20, 40, or 80 min showed 13.9-, 135.2-, and 8.5-fold losses, respectively, in culturability compared to C. jejuni not pretreated with +1.0% NaCl (Fig. 7B). The transcriptome also revealed that kpsM, encoding the CPS export system inner membrane protein, was upregulated under hyperosmotic stress. A targeted kpsM mutant (ΔkpsM; acapsular) exhibited a 100-fold growth defect on solid hyperosmotic medium (Fig. 7C), with kpsM, kpsS, kpsC, and kpsE transposon mutants (each of which is also acapsular) exhibiting identical defects (not shown). This identified the CPS or the capsule export apparatus as an important factor for C. jejuni hyperosmotic stress survival. A broth-based profile of the ΔkpsM mutant versus the wild type is included in Fig. S1B in the supplemental material.
Fig 7.

Hyperosmotic exposure cross-induces protective and detrimental effects on oxidative and heat shock stress responses, respectively, and the capsular polysaccharide protects against salt stress. (A and B) Bacteria were incubated in 1.0% NaCl for 2 h and then exposed to 5 mM H2O2 over 40 min (A) or 45°C conditions over 120 min (B). Cross-protection against oxidative stress but decreased tolerance to thermal stress occurred following hyperosmotic shock. Error bars are from three biological replicates. (C) Serial 10-fold dilutions of OD-standardized wild-type and ΔkpsM bacteria were spotted on MH agar with or without 0.8% NaCl. The ΔkpsM mutant exhibited increased sensitivity to hyperosmotic conditions. *, P ≤ 0.05; **, P ≤ 0.01; ***, P ≤ 0.001.
DISCUSSION
The ability to adapt to a range of osmolarities is critical to the survival of bacteria under varied conditions and in various niches. In this study, we carried out the first comprehensive analysis of the C. jejuni response to hyperosmotic stress. Standard MH growth medium (0.307 osmol liter−1) was used as a baseline, with growth tested in osmolarities up to 0.99 osmol liter−1 (+2.0% NaCl). Culturability similar to that in unsupplemented medium was observed at up to 0.48 osmol liter−1 (+0.5% NaCl). At 0.64 osmol liter−1 (+1.0% NaCl), a distinct pattern emerged in which C. jejuni underwent an adaptive lag followed by normal logarithmic growth and then late-stage culturability defects. Filamentation also increased during late logarithmic growth in +1.0% NaCl, peaking at 12 and 24 h as CFU declined. At 0.82 osmol liter−1 (+1.5% NaCl), growth was significantly impaired, with complete loss of motility and growth arrest at or above 0.99 osmol liter−1 (+2.0% NaCl), which we hypothesize also accounts for the lack of filamentation under this condition. Examination of multiple ionic and nonionic stressors established that the minimum inhibitory osmotic concentration was identical for all compounds (0.620 total osmol liter−1), as were phenotypic outcomes such as filamentation. Based on these similarities and the growth profile data, we selected MH+1.0% NaCl broth or MH+0.8% NaCl plates as representative conditions to explore the nature of hyperosmolarity-induced filaments, investigate global gene expression changes, assess cross-regulation with other stress responses, test the effects of loss of specific gene products on surviving hyperosmotic stress, and uncover aspects of population heterogeneity that were revealed or induced by hyperosmotic stress conditions.
C. jejuni formed long, helical filaments under hyperosmotic stress. This “defective” cell division is commonly observed for numerous bacterial species under stress conditions (10, 37), for instance, during hyperosmotic stress for the C. jejuni-related epsilonproteobacterium H. pylori and the deltaproteobacterium Desulfovibrio vulgaris (15, 42). Other biological stresses such as heat and oxidative shock, certain antibiotics, DNA damage, exposure to grazing by single-celled eukaryotes, and mutation or alteration of the stoichiometry of cell division components also give rise to filamentous morphologies (25). The molecular mechanisms that inhibited complete C. jejuni cell separation remain unclear, although we speculate that there may be involvement of the heat shock chaperones, which have roles in ensuring proper division (22, 36, 40). Filamentous bacteria have traditionally been viewed as abnormal, sick members of the population (25, 50, 60), but more recent evidence indicates an importance in bacterial survival and pathogenesis (27). For example, filamentous uropathogenic E. coli cells can evade phagocytosis by neutrophils due to their large size (24), and the helical filamentous forms of Caulobacter crescentus have increased resistance to heat, oxidative stress, and changes in pH (62). In our study, increased filamentation correlated with decreased CFU counts. Since filaments are composed of numerous daughter cells but likely give rise to only one macroscopic colony on a petri plate, filaments may affect the accuracy of viable counts in our analyses and in food safety assessments. Furthermore, our observations indicated that the C. jejuni filaments were motile and therefore likely as viable as nonfilamented bacteria.
The temporal transcriptional response to added 1.0% NaCl revealed a number of interesting gene expression profiles. Striking changes occurred in the acute phase of adaptation, with upregulation of genes for the endogenous synthesis of the potential osmoprotectants glutamate and glutamine (gltD and glnA) and genes encoding chaperones and regulators in various heat shock operons (hrcA, grpE, dnaK, and groEL). The cytoplasmic glutamate pool increases in most microorganisms after exposure to high-osmolarity medium to counter charge imbalances imposed by K+ accumulation (8), and increased transcription of genes encoding enzymes involved in glutamate/glutamine production suggests the conservation of this role in C. jejuni. It is possible that osmotic adaptation in C. jejuni may also be due to increased expression of the heat shock proteins, as C. jejuni preferentially uses glutamate as a carbon source (20), and while high gltD and glnA expression was transient, the heat shock proteins were expressed at high levels continuously. Despite evidence of increased thermotolerance in other enteric pathogens such as E. coli and Salmonella spp. following osmotic challenge and upregulation of heat shock proteins, we observed decreased survival for C. jejuni under 45°C heat shock following exposure to hyperosmotic conditions. Upregulation of heat shock genes may account for this decreased ability to respond to heat upshock, as increased heat sensitivity was also observed for a C. jejuni mutant with a mutation in the heat shock gene repressor hspR (1). Expression of heat shock genes is not a typical response to osmotic stress in E. coli (17) but has been observed for H. pylori (15, 53) and Lactococcus lactis (28), suggesting that heat shock proteins are deployed by a wide variety of bacteria to counter hyperosmotic stress-induced protein misfolding and other damage (1, 21, 30, 43, 53).
The C. jejuni hyperosmotic stress transcriptome shares key expression changes with the transcriptome of C. jejuni in a rabbit ileal loop (intraintestinal) model (54). This includes upregulation of heat shock and oxidative stress genes and downregulation of the NADH dehydrogenase gene nuo and several TCA cycle genes. Both conditions also resulted in upregulation of transcripts for the CbrR bile response regulator and the KpsM capsule export protein. This suggests that the hyperosmotic stress response may play an important role in vivo. When we compared our expression results to hyperosmotic transcriptional profiling studies of E. coli (17) and Pseudomonas aeruginosa (2), very few similarities were observed, reinforcing our observation that the long-term C. jejuni osmotic response is atypical. To the best of our knowledge, the only similarity between these studies was upregulation of antioxidative catalase genes (katE in E. coli and P. aeruginosa and katA in C. jejuni). In contrast, C. jejuni shares several expression changes with the more closely related D. vulgaris (42). Like C. jejuni, D. vulgaris salt stress microarray profiling and proteomics showed upregulation of oxidative stress pathways, the ATP synthase, and the tryptophan biosynthesis operon (trp). However, despite this commonality, and like E. coli and P. aeruginosa, D. vulgaris possesses proline and glycine betaine transporters/synthesis machinery (absent from C. jejuni) and K+ uptake and signaling systems, and it mounts a more typical response to hyperosmotic challenge. In E. coli and most bacteria, a two-component signal transduction system and high-affinity K+ transporter are encoded by the osmoresponsive kdp operon (43, 51, 61). Members of the kdp operon are truncated or missing in C. jejuni, and only kdpB (ATPase catalytic subunit) appears to encode a functional protein. We noted that kdpB was transiently upregulated following osmotic upshock. The kdpB gene also contains a hypervariable sequence, so expression of this gene may phase off/on (45). It is possible that kdpB interacts with other translocation channels, but further study is required to ascertain if kdpB participates in C. jejuni osmotolerance.
We also observed upregulation of kpsM under hyperosmotic stress and demonstrated that the acapsular ΔkpsM mutant was sensitive to hyperosmotic stress. The capsular polysaccharide of strain 81-176 is phase variable and important for serum resistance, invasion of epithelial cells, and virulence in a ferret diarrheal disease model (3, 26). Other bacteria, including E. coli and Vibrio cholerae, actively increase or utilize modified capsular polysaccharides to tolerate osmotic changes, protecting the bacterium from additional stresses such as desiccation and antibiotics (52, 59). We have now established a role for the C. jejuni capsule in resisting hyperosmotic stress and hypothesize that this may in part contribute to colonization defects in capsule-minus mutants.
An unexpected outcome of this study was the identification of significant intercellular heterogeneity within an apparently isogenic population. The genetic factors or processes that govern heterogeneity remain to be determined. Nonetheless, as shown by three different single-cell analyses, variation in osmotic sensitivity in the population was apparently unimodal under standard conditions (Fig. 5B and C; Fig. 6A and B [top]) but became notably bistable/bimodal after either selection of single colonies on standard MH agar (Fig. 5D and E) or growth in salt stress conditions as indicated by colony morphology and pAtpF′-GFP expression (Fig. 6A and B [bottom]) (this will be discussed further below). Surprisingly, variation between cells constituting single filaments was also observed. At present it is difficult to determine if heterogeneous “variants” within filaments are biologically important, but it is of note that similar observations were reported for filaments of Lactobacillus plantarum under acid stress (23). PI entry or extrusion from filaments could be associated with membrane alterations, increased efflux pump activity, or even DNA supercoiling. As with other types of population heterogeneity, it can be envisaged that filaments with heterogeneous member cells may be better prepared for diverse new challenges than a completely homogeneous filament. For example, one cell in the filament with the necessary fitness characteristics could quickly take advantage of a suddenly available nutrient and survive or out-compete other bacteria. Other cells of the filament may in turn be better suited to readapt to nonstressed conditions. Collectively, those heterogeneous single cells could allow survival of the filament under numerous different circumstances.
We also observed that clonal isolates from a wild-type C. jejuni population propagated under standard growth conditions exhibited salt sensitivity (Fig. 5). Because 79% of the progeny from sensitive clones retained sensitivity, compared to 22% of the progeny from the original population, populations derived from sensitive clones were quantitatively more sensitive to hyperosmotic stress and mimicked a “stable” phenotype. However, in all instances sensitive isolates also exhibited the ability to regenerate progeny with original wild-type sensitivity levels. Thus, there was also heterogeneity within these “sensitive” populations, including stress-fit progeny better suited for growth under hyperosmotic and potentially other stress conditions. Given that the kpsM mutant was salt sensitive and the relative rate with which these sensitive isolates occurred, we initially suspected the involvement of capsule phase variation (3); however, sensitive isolates retained their capsule. We hypothesize that additive point mutations and/or phase variation of contingency loci likely contribute to this phenomenon. Why C. jejuni would generate sensitive (defective) subpopulations is unclear, but these heterogeneous clones may have increased fitness at lower osmolarities or attributes important for other times in the C. jejuni life cycle. It is also of note that our sensitivity experiments were carried out following continuous growth on laboratory media, whereas in nature, frequent nutrient limitation and simultaneous action of other stresses are more typical. C. jejuni variation will almost certainly be more abundant or useful under such circumstances. Even within the laboratory, it is important to recognize that heterogeneity between single colonies may result in pleiotropic effects that can influence the outcome of experiments. Observations of heterogeneity are also a reminder that transcriptomic gene expression profiles, while highly useful, can only provide information on the average behavior of bacteria in a population.
We also observed bistable heterogeneity in the colony size of wild-type C. jejuni plated on MH plates+0.8% NaCl (Fig. 6A). Cells differentially expressing GFP from the atpF′ promoter following growth in MH broth+1.0% NaCl likewise exhibited bistable survival characteristics (Fig. 6B). Bistability is a biological phenomenon that typically arises randomly from expression fluctuations in a master regulatory gene (12, 58). This suggests that osmotic stress may influence the expression of a C. jejuni regulator controlling a metabolic process(es), as both colony size and ATP synthase expression suggest a correlation with growth rate. The more phenotypically stable salt-sensitive clones described above may also contribute to the bistability observed for colony size and ATP synthase expression. A model for this is E. coli hip (high incidence of persister) mutants, which exhibit an increased abundance of cells in the persister state (dormant cells that can survive exposure to antibiotics and other stresses) versus actively growing cells (12, 41). We envision that “hip-like” mutations in C. jejuni may increase the abundance of certain subpopulations. For example, a “salt-sensitive” mutation could increase the abundance of the nonculturable GFPlow subpopulation, which would be perceived as sensitivity on hyperosmotic media. However, there are also likely to be mutations arising in true osmotolerance genes. Overall, the most plausible explanation for multiple mechanisms of population heterogeneity is that it is a defensive “bet-hedging” strategy, i.e., a cautious investment in diverse phenotypes that weighs the loss of growth efficiency under a certain condition against the chance of lethality if conditions change abruptly (58). Ongoing and future work is aimed at uncovering genes and molecular mechanisms driving these potentially complex layers of heterogeneity within a clonal C. jejuni population.
Finally, it is of note that the human intestine has been reported to have a lower osmolarity (0.27 to 0.29 osmol liter−1 [14]) than the chicken cecum (0.70 osmol liter−1 [29]), which in turn has a lower osmolarity than the chicken duodenum (0.90 osmol liter−1 [29]). As Fig. 1A illustrates, these conditions span the osmolarities assessed in our study, with MH medium more closely approximating human intestinal conditions and the +1.0% NaCl condition somewhat approximating the chicken cecum. While numerous other factors influencing C. jejuni growth, survival, and behavior are obviously present in vivo than in vitro (i.e., other bacteria, metabolites, mucus, host cells, additional stressors, potential buffers and as-yet-unidentified compatible solutes, osmolarity changes during digestion and water reabsorption, etc.), this study may at least partially reflect differential conditions C. jejuni encounters as it traverses in vivo niches. Future work characterizing additional genes dysregulated under hyperosmotic stress and exploring molecular strategies modulating population heterogeneity should lend insight into the fundamental processes that allow C. jejuni to survive stress conditions and prevail as a major food-borne pathogen.
Supplementary Material
ACKNOWLEDGMENTS
We gratefully acknowledge the technical assistance of all members of the Gaynor laboratory throughout the course of this work. 81-176 capsule antiserum was a kind gift from Dave Hendrixson.
A.C. is supported by a CGS-M traineeship from the Canadian Institutes of Health Research (CIHR), and E.F. is supported by postdoctoral fellowships from the CIHR and the Michael Smith Foundation for Health Research (MSFHR). E.C.G. is supported by a Canada Research Chair award and a Burroughs Wellcome Fund Career Development Award in the Biomedical Sciences. C.T.P is funded by USDA Agricultural Research Service CRIS project 5325-42000-047. This work was funded by CIHR grant MOP-68981 to E.C.G. and by the Burroughs Wellcome Fund.
Footnotes
Published ahead of print 7 September 2012
Supplemental material for this article may be found at http://jb.asm.org/.
REFERENCES
- 1. Andersen MT, et al. 2005. Diverse roles for HspR in Campylobacter jejuni revealed by the proteome, transcriptome and phenotypic characterization of an hspR mutant. Microbiology 151:905–915 [DOI] [PubMed] [Google Scholar]
- 2. Aspedon A, Palmer K, Whiteley M. 2006. Microarray analysis of the osmotic stress response in Pseudomonas aeruginosa. J. Bacteriol. 188:2721–2725 [DOI] [PMC free article] [PubMed] [Google Scholar]
- 3. Bacon DJ, et al. 2001. A phase-variable capsule is involved in virulence of Campylobacter jejuni 81-176. Mol. Microbiol. 40:769–777 [DOI] [PubMed] [Google Scholar]
- 4. Bonis M, Ecobichon C, Guadagnini S, Prevost MC, Boneca IG. 2010. A M23B family metallopeptidase of Helicobacter pylori required for cell shape, pole formation and virulence. Mol. Microbiol. 78:809–819 [DOI] [PubMed] [Google Scholar]
- 5. Boulos L, Prevost M, Barbeau B, Coallier J, Desjardins R. 1999. LIVE/DEAD BacLight: application of a new rapid staining method for direct enumeration of viable and total bacteria in drinking water. J. Microbiol. Methods 37:77–86 [DOI] [PubMed] [Google Scholar]
- 6. Candon HL, Allan BJ, Fraley CD, Gaynor EC. 2007. Polyphosphate kinase 1 is a pathogenesis determinant in Campylobacter jejuni. J. Bacteriol. 189:8099–8108 [DOI] [PMC free article] [PubMed] [Google Scholar]
- 7. Cools I, et al. 2003. Survival of Campylobacter jejuni strains of different origin in drinking water. J. Appl. Microbiol. 94:886–892 [DOI] [PubMed] [Google Scholar]
- 8. Csonka LN. 1989. Physiological and genetic responses of bacteria to osmotic stress. Microbiol. Rev. 53:121–147 [DOI] [PMC free article] [PubMed] [Google Scholar]
- 9. Das G, Varshney U. 2006. Peptidyl-tRNA hydrolase and its critical role in protein biosynthesis. Microbiology 152:2191–2195 [DOI] [PubMed] [Google Scholar]
- 10. Deuerling E, Mogk A, Richter C, Purucker M, Schumann W. 1997. The ftsH gene of Bacillus subtilis is involved in major cellular processes such as sporulation, stress adaptation and secretion. Mol. Microbiol. 23:921–933 [DOI] [PubMed] [Google Scholar]
- 11. Doyle MP, Roman DJ. 1982. Response of Campylobacter jejuni to sodium chloride. Appl. Environ. Microbiol. 43:561–565 [DOI] [PMC free article] [PubMed] [Google Scholar]
- 12. Dubnau D, Losick R. 2006. Bistability in bacteria. Mol. Microbiol. 61:564–572 [DOI] [PubMed] [Google Scholar]
- 13. Fletcher SA, Csonka LN. 1998. Characterization of the induction of increased thermotolerance by high osmolarity in Salmonella. Food Microbiol. 15:307–317 [Google Scholar]
- 14. Fordtran JS, Locklear TW. 1966. Ionic constituents and osmolality of gastric and small-intestinal fluids after eating. Am. J. Dig. Dis. 11:503–511 [DOI] [PubMed] [Google Scholar]
- 15. Gancz H, Jones KR, Merrell DS. 2008. Sodium chloride affects Helicobacter pylori growth and gene expression. J. Bacteriol. 190:4100–4105 [DOI] [PMC free article] [PubMed] [Google Scholar]
- 16. Graumann PL. 2006. Different genetic programmes within identical bacteria under identical conditions: the phenomenon of bistability greatly modifies our view on bacterial populations. Mol. Microbiol. 61:560–563 [DOI] [PubMed] [Google Scholar]
- 17. Gunasekera TS, Csonka LN, Paliy O. 2008. Genome-wide transcriptional responses of Escherichia coli K-12 to continuous osmotic and heat stresses. J. Bacteriol. 190:3712–3720 [DOI] [PMC free article] [PubMed] [Google Scholar]
- 18. Guo BQ, et al. 2008. CmeR functions as a pleiotropic regulator and is required for optimal colonization of Campylobacter jejuni in vivo. J. Bacteriol. 190:1879–1890 [DOI] [PMC free article] [PubMed] [Google Scholar]
- 19. Henggearonis R, Lange R, Henneberg N, Fischer D. 1993. Osmotic regulation of RpoS-dependent genes in Escherichia coli. J. Bacteriol. 175:259–265 [DOI] [PMC free article] [PubMed] [Google Scholar]
- 20. Hofreuter D, Novik V, Galan JE. 2008. Metabolic diversity in Campylobacter jejuni enhances specific tissue colonization. Cell Host Microbe 4:425–433 [DOI] [PubMed] [Google Scholar]
- 21. Holmes CW, Penn CW, Lund PA. 2010. The hrcA and hspR regulons of Campylobacter jejuni. Microbiology 156:158–166 [DOI] [PubMed] [Google Scholar]
- 22. Horwich AL, Low KB, Fenton WA, Hirshfield IN, Furtak K. 1993. Folding in vivo of bacterial cytoplasmic proteins—role of GroEL. Cell 74:909–917 [DOI] [PubMed] [Google Scholar]
- 23. Ingham CJ, Beerthuyzen M, Vlieg JV. 2008. Population heterogeneity of Lactobacillus plantarum WCFS1 microcolonies in response to and recovery from acid stress. Appl. Environ. Microbiol. 74:7750–7758 [DOI] [PMC free article] [PubMed] [Google Scholar]
- 24. Justice SS, et al. 2004. Differentiation and developmental pathways of uropathogenic Escherichia coli in urinary tract pathogenesis. Proc. Natl. Acad. Sci. U. S. A. 101:1333–1338 [DOI] [PMC free article] [PubMed] [Google Scholar]
- 25. Justice SS, Hunstad DA, Cegelski L, Hultgren SJ. 2008. Morphological plasticity as a bacterial survival strategy. Nat. Rev. Microbiol. 6:162–168 [DOI] [PubMed] [Google Scholar]
- 26. Karlyshev AV, McCrossan MV, Wren BW. 2001. Demonstration of polysaccharide capsule in Campylobacter jejuni using electron microscopy. Infect. Immun. 69:5921–5924 [DOI] [PMC free article] [PubMed] [Google Scholar]
- 27. Kempf B, Bremer E. 1998. Uptake and synthesis of compatible solutes as microbial stress responses to high-osmolality environments. Arch. Microbiol. 170:319–330 [DOI] [PubMed] [Google Scholar]
- 28. Kilstrup M, Jacobsen S, Hammer K, Vogensen FK. 1997. Induction of heat shock proteins DnaK, GroEL, and GroES by salt stress in Lactococcus lactis. Appl. Environ. Microbiol. 63:1826–1837 [DOI] [PMC free article] [PubMed] [Google Scholar]
- 29. Klasing KC, Adler KL, Remus JC, Calvert CC. 2002. Dietary betaine increases intraepithelial lymphocytes in the duodenum of coccidia-infected chicks and increases functional properties of phagocytes. J. Nutr. 132:2274–2282 [DOI] [PubMed] [Google Scholar]
- 30. Konkel ME, Kim BJ, Klena JD, Young CR, Ziprin R. 1998. Characterization of the thermal stress response of Campylobacter jejuni. Infect. Immun. 66:3666–3672 [DOI] [PMC free article] [PubMed] [Google Scholar]
- 31. Korlath JA, Osterholm MT, Judy LA, Forfang JC, Robinson RA. 1985. A point-source outbreak of campylobacteriosis associated with consumption of raw milk. J. Infect. Dis. 152:592–596 [DOI] [PubMed] [Google Scholar]
- 32. Lin J, Michel LO, Zhang QJ. 2002. CmeABC functions as a multidrug efflux system in Campylobacter jejuni. Antimicrob. Agents Chemother. 46:2124–2131 [DOI] [PMC free article] [PubMed] [Google Scholar]
- 33. Loh JT, Torres VJ, Cover TL. 2007. Regulation of Helicobacter pylori cagA expression in response to salt. Cancer Res. 67:4709–4715 [DOI] [PubMed] [Google Scholar]
- 34. MacKichan JK, et al. 2004. The Campylobacter jejuni dccRS two-component system is required for optimal in vivo colonization but is dispensable for in vitro growth. Mol. Microbiol. 54:1269–1286 [DOI] [PubMed] [Google Scholar]
- 35. Malik-Kale P, et al. 2007. Characterization of genetically matched isolates of Campylobacter jejuni reveals that mutations in genes involved in flagellar biosynthesis alter the organism's virulence potential. Appl. Environ. Microbiol. 73:3123–3136 [DOI] [PMC free article] [PubMed] [Google Scholar]
- 36. Masters M, et al. 2009. Protein folding in Escherichia coli: the chaperonin GroE and its substrates. Res. Microbiol. 160:267–277 [DOI] [PubMed] [Google Scholar]
- 37. Mattick KL, et al. 2000. Survival and filamentation of Salmonella enterica serovar Enteritidis PT4 and Salmonella enterica serovar Typhimurium DT104 at low water activity. Appl. Environ. Microbiol. 66:1274–1279 [DOI] [PMC free article] [PubMed] [Google Scholar]
- 38. Mclaggan D, Logan TM, Lynn DG, Epstein W. 1990. Involvement of gamma-glutamyl peptides in osmoadaptation of Escherichia coli. J. Bacteriol. 172:3631–3636 [DOI] [PMC free article] [PubMed] [Google Scholar]
- 39. Mclaggan D, Naprstek J, Buurman ET, Epstein W. 1994. Interdependence of K+ and glutamate accumulation during osmotic adaptation of Escherichia coli. J. Biol. Chem. 269:1911–1917 [PubMed] [Google Scholar]
- 40. McLennan N, Masters M. 1998. GroE is vital for cell-wall synthesis. Nature 392:139–139 [DOI] [PubMed] [Google Scholar]
- 41. Moyed HS, Bertrand KP. 1983. HipA, a newly recognized gene of Escherichia coli K-12 that affects frequency of persistence after inhibition of murein synthesis. J. Bacteriol. 155:768–775 [DOI] [PMC free article] [PubMed] [Google Scholar]
- 42. Mukhopadhyay A, et al. 2006. Salt stress in Desulfovibrio vulgaris Hildenborough: an integrated genomics a pproach. J. Bacteriol. 188:4068–4078 [DOI] [PMC free article] [PubMed] [Google Scholar]
- 43. Park S. 2005. Campylobacter jejuni stress responses during survival in the food chain and colonisation, p 311–330 In Ketley JM, Konkel ME. (ed), Campylobacter jejuni: molecular and cellular biology. Horizon Scientific Press, New York, NY [Google Scholar]
- 44. Park SF. 2002. The physiology of Campylobacter species and its relevance to their role as foodborne pathogens. Int. J. Food Microbiol. 74:177–188 [DOI] [PubMed] [Google Scholar]
- 45. Parkhill J, et al. 2000. The genome sequence of the food-borne pathogen Campylobacter jejuni reveals hypervariable sequences. Nature 403:665–668 [DOI] [PubMed] [Google Scholar]
- 46. Raphael BH, et al. 2005. The Campylobacter jejuni response regulator, CbrR, modulates sodium deoxycholate resistance and chicken colonization. J. Bacteriol. 187:3662–3670 [DOI] [PMC free article] [PubMed] [Google Scholar]
- 47. Reezal A, McNeil B, Anderson JG. 1998. Effect of low-osmolality nutrient media on growth and culturability of Campylobacter species. Appl. Environ. Microbiol. 64:4643–4649 [DOI] [PMC free article] [PubMed] [Google Scholar]
- 48. Ritz M, Garenaux A, Berge M, Federighi M. 2009. Determination of rpoA as the most suitable internal control to study stress response in C. jejuni by RT-qPCR and application to oxidative stress. J. Microbiol. Methods 76:196–200 [DOI] [PubMed] [Google Scholar]
- 49. Rodriguez MB, Moyses LHC, Costa SOP. 1990. Effect of osmolarity on aminoglycoside susceptibility in gram-negative bacteria. Lett. Appl. Microbiol. 11:77–80 [Google Scholar]
- 50. Schoemaker JM, Gayda RC, Markovitz A. 1984. Regulation of cell division in Escherichia coli: SOS induction and cellular location of the SulA protein, a key to Lon-associated filamentation and death. J. Bacteriol. 158:551–561 [DOI] [PMC free article] [PubMed] [Google Scholar]
- 51. Sleator RD, Hill C. 2002. Bacterial osmoadaptation: the role of osmolytes in bacterial stress and virulence. FEMS Microbiol. Rev. 26:49–71 [DOI] [PubMed] [Google Scholar]
- 52. Sledjeski DD, Gottesman S. 1996. Osmotic shock induction of capsule synthesis in Escherichia coli K-12. J. Bacteriol. 178:1204–1206 [DOI] [PMC free article] [PubMed] [Google Scholar]
- 53. Spohn G, Scarlato V. 1999. The autoregulatory HspR repressor protein governs chaperone gene transcription in Helicobacter pylori. Mol. Microbiol. 34:663–674 [DOI] [PubMed] [Google Scholar]
- 54. Stintzi A, et al. 2005. Use of genome-wide expression profiling and mutagenesis to study the intestinal lifestyle of Campylobacter jejuni. Infect. Immun. 73:1797–1810 [DOI] [PMC free article] [PubMed] [Google Scholar]
- 55. Svensson SL, et al. 2009. The CprS sensor kinase of the zoonotic pathogen Campylobacter jejuni influences biofilm formation and is required for optimal chick colonization. Mol. Microbiol. 71:253–272 [DOI] [PMC free article] [PubMed] [Google Scholar]
- 56. Tesone S, Hughes A, Hurst A. 1981. Salt extends the upper temperature limit for growth of food-poisoning bacteria. Can. J. Microbiol. 27:970–972 [DOI] [PubMed] [Google Scholar]
- 57. Tholozan JL, Cappelier JM, Tissier JP, Delattre G, Federighi M. 1999. Physiological characterization of viable-but-nonculturable Campylobacter jejuni cells. Appl. Environ. Microbiol. 65:1110–1116 [DOI] [PMC free article] [PubMed] [Google Scholar]
- 58. Veening JW, Smits WK, Kuipers OP. 2008. Bistability, epigenetics, and bet-hedging in bacteria. Annu. Rev. Microbiol. 62:193–210 [DOI] [PubMed] [Google Scholar]
- 59. Wai SN, Mizunoe Y, Takade A, Kawabata S, Yoshida S. 1998. Vibrio cholerae O1 strain TSI-4 produces the exopolysaccharide materials that determine colony morphology, stress resistance, and biofilm formation. Appl. Environ. Microbiol. 64:3648–3655 [DOI] [PMC free article] [PubMed] [Google Scholar]
- 60. Walker JR, Kovarik A, Allen JS, Gustafson RA. 1975. Regulation of bacterial cell division: temperature-sensitive mutants of Escherichia coli that are defective in septum formation. J. Bacteriol. 123:693–703 [DOI] [PMC free article] [PubMed] [Google Scholar]
- 61. Wood JM. 1999. Osmosensing by bacteria: signals and membrane-based sensors. Microbiol. Mol. Biol. R. 63:230–267 [DOI] [PMC free article] [PubMed] [Google Scholar]
- 62. Wortinger MA, Quardokus EM, Brun YV. 1998. Morphological adaptation and inhibition of cell division during stationary phase in Caulobacter crescentus. Mol. Microbiol. 29:963–973 [DOI] [PubMed] [Google Scholar]
- 63. Wosten MMSM, Boeve M, Koot MGA, van Nuenen AC, van der Zeijst BAM. 1998. Identification of Campylobacter jejuni promoter sequences. J. Bacteriol. 180:594–599 [DOI] [PMC free article] [PubMed] [Google Scholar]
- 64. Young KT, Davis LM, DiRita VJ. 2007. Campylobacter jejuni: molecular biology and pathogenesis. Nat. Rev. Microbiol. 5:665–679 [DOI] [PubMed] [Google Scholar]
Associated Data
This section collects any data citations, data availability statements, or supplementary materials included in this article.