Abstract
We present results of molecular dynamics simulations of a model DPPC-water monolayer using charge equilibration (CHEQ) force fields which explicitly account for electronic polarization in a classical treatment of intermolecular interactions. The surface pressure, determined as the difference between the monolayer and pure water surface tensions at 323 K, is predicted to be 22.92 ± 1.29 dyne/cm, just slightly below the broad range of experimental values reported for this system. The surface tension for the DPPC-water monolayer is predicted to be 42.35 ± 1.16 dyne/cm, in close agreement with the experimentally determined value of 40.9 dyne/cm. This surface tension is also consistent with the value obtained from DPPC monolayer simulations using state-of-the-art nonpolarizable force fields. The current results of simulations predict a monolayer-water potential difference relative to the pure water-air interface of 0.64 ± 0.02 Volts, an improved prediction compared to the fixed-charge CHARMM27 force field, yet still overestimating the experimental range of 0.3 to 0.45 Volts. Since the charge equilibration model is a purely charge-based model for polarization, the current results suggest that explicitly-modeled polarization effects can offer improvements in describing interfacial electrostatics in such systems.
I. INTRODUCTION
Membranes and membrane-bound proteins are a vital part of biological systems. Cellular lipid bilayer membranes, a complex milieu of biomacromolecular components, are fundamentally composed of a wide variety of amphiphilic molecules consisting of polar and hydrophobic regions. Cellular membranes have many important physiological roles apart from simply being a permeability barrier between the “inside” and “outside” of cells. Bilayer membranes are involved with cell-signaling mechanisms, supply complex environments to support a wide variety of proteins, and are capable of mechanical deformation in order to accommodate a variety of chemical functionalities within the special region between the cytosol and extra-cellular surroundings.1,2 Recent studies have explored structural properties of membranes as well as electrostatic properties such as the dielectric variation within a bilayer,3 the interfacial potential,4 and the interactions of polar or charged amino acid side chains with hydrocarbon tails.5 Experimental studies have also probed these properties in recent years. For example, structural properties of bilayers have been determined by x-ray and neutron scattering6,7 and nuclear magnetic resonance (NMR) spectroscopy,8 while the water penetration into the bilayer interior has been investigated via electron spin spectroscopy9,10 and x-ray scattering techniques.11 However, even current state-of-the-art experimental measurements are not always able to provide the type of detailed atomic level resolution that would provide significant insights into the mechanisms of membrane systems. To this end, computational methods such as molecular dynamics and Monte Carlo simulations have been employed to study properties and processes in such systems at the atomic level.1,5,12–23
Molecular dynamics simulations require information about the atomic interactions within and between molecular species. Quantum mechanical calculations would give the most accurate results; unfortunately, such computations are very time-consuming for all but the smallest systems. Because of this limitation, classical “force fields” have been developed which consist of potential energy functions chosen to model inter-species and intra-species interactions. In addition to models in which all atoms are modeled explicitly (i.e. all-atom models), there has been significant effort towards “coarse-grained” models24,25 in which entire small molecules or functional groups are represented as a single unit. Development and applications of such models continues today.26–31 Implicit solvent and lipid models,32–35 which represent solvent or lipid as a continuum, are also a viable alternative to all-atom models for simulating large biomolecular systems. However, all-atom simulations remain the standard to which such coarse-grained and implicit models are compared; thus, the need for more accurate atomistic models is clear.
Despite the importance of lipidic systems (i.e., lipid bilayers, monolayers, vesicles, etc.) to a variety of physiological functions, polarizable force fields for molecular simulations of such systems are still in the testing and development stage. Among the numerous approaches currently being pursued, the charge equilibration (CHEQ) approach has been applied to molecular simulations of phosphatidylcholine (PC) based lipid bilayers,36,37 as well as to the exploration of ion permeation energetics in the simple gramicidin A channel.38 The CHARMM Drude oscillator model and the AMBER point-polarizable polarizable DOPC force field are the only other polarizable models to have been extensively applied for molecular simulations of lipid bilayer systems.1,39–41 A recent study using Drude oscillator models of the dipalmitoylphosphatidylcholine (DPPC) monolayer explored the surface dipole potential of the water-lipid monolayer system.39 The authors demonstrated the improvement in the prediction of the relative interfacial potential, ΔV = Vmonolayer–water – Vwater–air, over fixed-charge nonpolarizable force field representation. The authors suggest that, compared to the bilayer dipole potential, the monolayer potential is a less ambiguous measurement for comparing force field predictions to experiment. We note that measurements of the bilayer dipole potential, values of which can be found in the literature for a wide spectrum of lipids using a variety of techniques including ion conductance,42–44 cryo-EM,4 and AFM,45 are based on a number of approximations and are not a direct measure of the individual contributions to interfacial electrostatic properties arising from the presence of a lipid assembly. Ion conductance measurements, for instance, measure the permeability of a membrane to two structurally similar, oppositely charged hydrophobic ions tetraphenylborate (TPB−) and tetraphenylarsonium (TPA+) or tetraphenylphosphonium (TPP+). The conductance measurements operate on the assumption that these ions, having the same interaction energies with hydrating water molecules, will have identical free energies of transfer from water to any other medium and that a value for the membrane dipole potential can be calculated by extension. The validity of this assumption had been challenged using quantum mechanical calculations which found variations in the hydration energies of TPB−, TPA+, and TPP+.46 Though quantum mechanical calculations with various treatments of solvent effects do show differences between the hydration properties of both ions, it is difficult to assess the magnitude of the difference with purely quantum methods which may or may not account for solvation effects. Schurhammer and coworkers have also explored the variation in hydration free energies for the TPB−/TPA+ system using molecular dynamics simulations and free energy perturbation calculations.47 The authors find that TPB− is more favorably hydrated than TPA+, and that the difference in hydration free energy between the two are strongly dependent on the specific charge distribution; the range of differences in hydration energies is from 4.3 kcal/mol to 25 kcal/mol. Moreover, recent studies investigating the effects of charge asymmetry on hydration free energies of model asymmetric polar molecules by Mobley et al.48 demonstrate significant differences in hydration free energies of oppositely polarized molecules, with these differences approaching the order of 10 kcal/mol. The notion of asymmetric hydration of small spherical ions as well as larger hydrophobic ions has been pursued extensively in the literature, though there still appears to be no consensus on the decisive relevance of the tetraphenylarsonium tetraphenylborate (TATB) assumption to the absolute bilayer dipole potential.49–54
In this article, we explore several properties of a model monolayer-water interface of DPPC based on molecular dynamics simulations using a recent CHEQ force field for DPPC (and saturated PC lipids in general)36,37 and the TIP4P-FQ polarizable force field for water.55 In Section II A, we discuss the models and current implementation. Section IIB discusses the simulation protocols. Our results are presented in section III and include density profiles, deuterium order parameters, dielectric constant profiles, the dipole moment profile of water, surface tension and surface pressure calculations, and relative interfacial dipole potentials. We discuss several aspects of monolayer properties in comparison to previous lipid simulations as well as with experimental measurements.
II. THEORETICAL AND COMPUTATIONAL METHODS
A. Charge Equilibration Method
The present simulations explicitly treat non-additive electrostatic effects using fully polarizable, charge equilibration (CHEQ) force fields for the entire lipid-solvent system. In the following, we discuss the details of this formalism. Although applied here as a classical potential,56 the CHEQ formalism derives rigorously from the density functional theory of atoms in molecules57 based on Sanderson’s idea of electronegativity equalization.58,59 Polarization is affected via the migration of charge density (condensed to a partial charge in the classical sense) among atomic species within a given molecule. The electronic density adjusts within the molecule so as to equalize the electrochemical potential (or equivalently, the electronegativity) at each point in the molecule. The direction and ease of flow are determined by physical properties of individual atoms as will be discussed. The reader is referred to the literature for more details.55–57,60–67
The electrostatic energy of a system of M molecules containing N atoms per molecule is:
| (1) |
where χ denotes the atomic electronegativities and η denotes the atomic hardnesses. The former quantity gives rise to a directionality of electron flow, while the latter represents a resistance, or hardness, to electron flow to or from the atom. The second term in Equation 1 represents the local charge transfer interaction generally restricted to within a molecule (no intermolecular charge transfer) or some appropriate charge normalization unit. The third term is a standard Coulomb interaction between sites not involved in dihedral, angle, and bonded interactions with each other (the primed notation indicates a summation only over such sites). The last term is a Lagrange multiplier based constraint on total charge on a given normalization unit; this constraint helps to restrict charge equilibration (and hence charge redistribution) over chemically relevant and distinct units.68 We note that although the electronegativity and hardness follow exactly from the definitions of the electron affinity and ionization potential, they are considered here as empirical parameters to be determined as described below. Homogeneous hardness values (for each atom type) are parameterized as discussed in Patel and Brooks.64 Heterogeneous elements (interaction elements between different atom types) are derived from the individual atom type values based on the combining rule:63
| (2) |
where Rij is the separation between atoms (or more generally sites) i and j. This local screened Coulomb potential has the correct limiting behavior as 1/r for separations greater than about 2.5 Å. This interaction is computed for 1–2, 1–3, and 1–4 sites (sites included in bonds, angles, and dihedrals). Sites in a molecule separated by 5 or more sites interact via a Coulomb interaction; in the case of interacting molecules, the interaction between sites on different molecules is again of the Coulomb form.
The charge equilibration model is indeed a polarizable model as the molecular polarizability, α, can be derived as follows:
| (3) |
where denotes the molecular hardness matrix, and and R̄γ are the β and γ Cartesian components of the atomic position vector, respectively. A more detailed derivation can be found elsewhere.68 The hardness matrix can be augmented to enforce charge constraints within a molecule68 for explicit calculations of the polarizability. In addition, the CHEQ model, being an all-atom representation with partial charges assigned to all atomic species, contains all higher-order electrostatic multipole moments, in contrast to point dipole polarizable models69–71 and Drude oscillator models.72–74 As such, the CHEQ model incorporates higher-order electrostatic interactions explicitly.
The charge degrees of freedom are propagated via an extended Lagrangian formulation that imposes a molecular charge neutrality constraint, thus strictly enforcing electronegativity equalization at each dynamics step. The system Lagrangian is
| (4) |
where the first two terms represent the nuclear and charge kinetic energies, respectively, while the third term is the total potential energy, and the fourth term is the molecular charge neutrality constraint with λi the Lagrange multiplier for each molecule, i. The fictitious charge dynamics, analogous to the fictitious wavefunction dynamics in Car-Parrinello (CP) type methods,75 are determined with a fictitious charge “mass” (adiabaticity parameter in CP dynamics). The units for this mass are . The charges are propagated based on forces arising from the difference between the average electronegativity of the molecule and the instantaneous electronegativity at an atomic site.
We comment here that the polarizable TIP4P-FQ water model55 is used to model solvent-solvent and solvent-solute interactions. The TIP4P-FQ water model is a 4-site model, based on the original TIP4P water model of Jorgensen et al.76 The charges reside on the hydrogen atoms and a virtual site situated along the perpendicular bisector of the HOH angle 0.15 Å from the oxygen atom. The model has been characterized in previous studies, and the reader is referred to the relevant literature for further details.55,77
B. Simulation Protocol
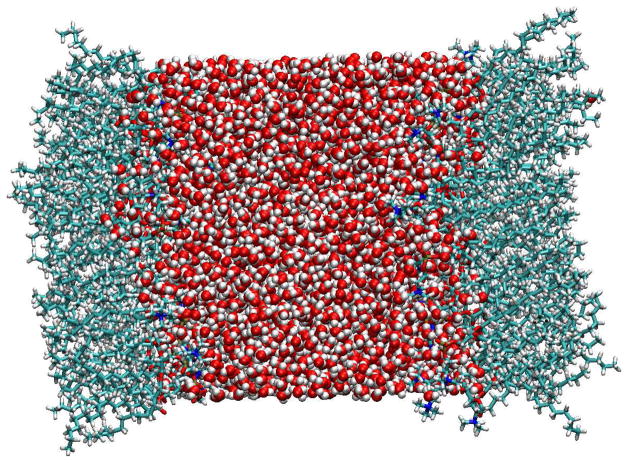
Simulations were carried out utilizing CHEQ formalism in the constant volume and temperature (NV T) ensemble under 3D periodic boundary conditions using the CHARMM package.78 The DPPC monolayer-water system contained two leaflets of 36 DPPC molecules and a central layer of 2895 TIP4P-FQ water molecules for a total of 20940 atoms. Recent studies have suggested relatively little finite size effects for simulations of 36 or more lipids per leaflet.79,80 A representative snapshot of the system is shown in Figure 1. A system size of 48.075 Å × 48.075 Å × 150.00 Å is based on a surface area per lipid of 64.2 Å2 from data fit to experimental measurements.81 The extended z box dimension results in a separation of the two DPPC monolayers by a vacuum region approximately 60 Å wide. Dynamics were propagated using a Leapfrog Verlet integrator82 with a time step of 0.5 fs. The temperature of the system was held at 323 K using the Nosé-Hoover method82,83 with a thermal piston mass of 3000 kcal/mol·ps2; thus, our simulations are performed above the experimental gel-phase transition temperature for pure DPPC membranes (314 K).84 Long-range electrostatic interactions were accounted for by Particle mesh Ewald (PME) summation85,86 with a 48 Å × 48 Å × 100 Å Fast Fourier transform (FFT) grid, 4th order interpolation, and screening parameter κ = 0.320. Several replicate simulations of varying lengths were run for a total simulation time of ≈140 ns. Constant surface area ensembles have been shown to be equivalent to other ensembles provided that well equilibrated systems are used as starting configurations.79 We believe that there are no artificial effects due to the chosen ensemble based on the equilibrated states we achieve after long-time simulations.
Figure 1.
Coordinate snapshot of the monolayer-water system, generated using Visual Molecular Dynamics,119 with the z-axis normal to the surface of the monolayers. Oxygens are shown in red, hydrogens in white, carbons in light blue, nitrogens in dark blue, and phosphorus in yellow.
III. RESULTS AND DISCUSSION
A. Atomic and Electron Density Profiles
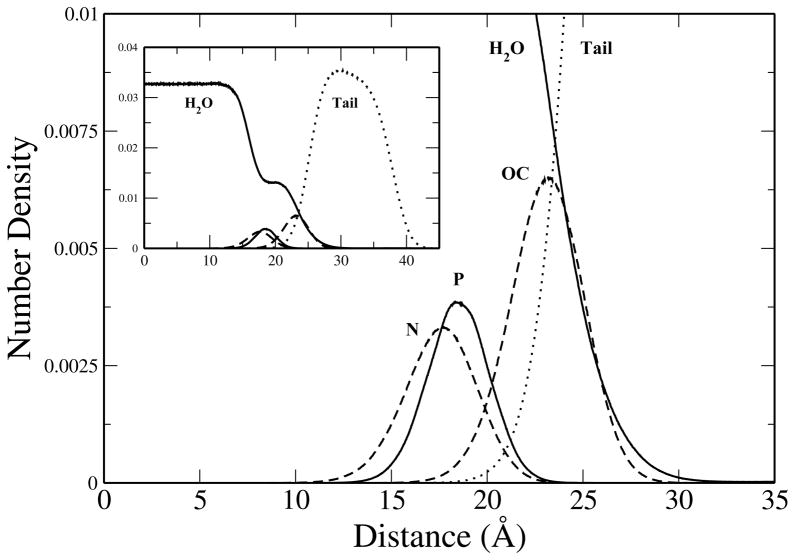
To characterize the equilibrium structure of the monolayer system we have calculated the number density profiles for various species as a function of distance from the center of the water layer along the monolayer normal (z-axis). Figure 2 shows the number densities for the oxygen atoms of water and several components of the lipid (head group nitrogen and phosphorus atoms, ester carbonyl oxygens atoms, and tail group carbons). The monolayer system shows a stable structure comparable with previous studies performed using the CHEQ model on DPPC and DMPC bilayers36,37 as well as with phosphatidylcholine lipid studies utilizing other models.87–89 A feature of interest is the extent of water penetration into the monolayer. As water begins to encounter the polar head groups of the lipid, the density decreases in magnitude compared to that of the bulk and remains fairly constant throughout the lipid head groups. For nonpolarizable models the ester carbonyl region is often seen as a barrier past which very little water, if any, will permeate. The treatment of polarizability via the CHEQ force field allows for water to penetrate further into the low dielectric environment of the lipid. This result has been discussed previously in relation to potential mean force calculations of water permeation across a lipid bilayer.36,37 The CHEQ alkanes force field, which had been extended for use with the hydrocarbon tail groups of lipids, results in free energies of hydration that are too favorable when compared to experimental energies. A recent study found that altering the specific Lennard-Jones interactions between the alkane carbon and water oxygen atoms reduced the hydration free energies of alkanes to values in better agreement with experiment.90 Ongoing efforts in our lab investigate the effects of the revised alkanes force field on hydrated lipid membrane systems with respect to water permeation energetics.91 For the current study, we used the original CHEQ lipid force field. Based on our previous study of DMPC bilayers using revised CHEQ models, we do not anticipate significant differences in the monolayer structure. However, we would expect a reduced permeation of water into the lipid tail region.
Figure 2.
Heavy atom number density profiles for selected components (water oxygens, aliphatic lipid tail group carbons, lipid ester oxygens, lipid head group nitrogen and phosphorus) as a function of distance along the monolayer normal.
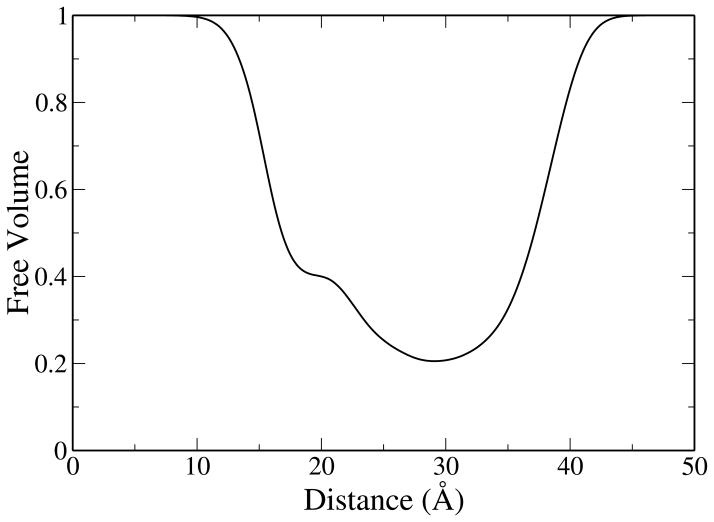
We also note that water density exhibits a plateau region in the neighborhood of the phosphate and ester groups. To investigate this feature we calculated the free volume profile as a function of distance along the monolayer normal. The free volume profile serves to quantify the space available to water molecules as they encounter the atoms of the lipid monolayer. This was calculated, as described by Marrink et al.,92 by mapping the simulation system onto a 3D grid. All grid points falling within the van der Waals radii of lipid atoms are considered occupied volume while the remaining grid points are considered free volume. The fraction of free volume in the system is simply the ratio of unoccupied grid points to the total number of grid points and can be expressed as a function of distance by dividing the system into intervals (Δz) along the z-axis. Due to the high computational cost of the analysis, only the last 5 ns of each replicate simulation trajectory were considered at a grid spacing of 400 × 400 × 1200, resulting in an interval size of approximately 0.125 Å along the z-axis. The results of the analysis are shown in Figure 3, and show a region of fairly constant free volume in the area of the water density plateau. The stability of water molecules in this region is also predicted by independent potential of mean force calculations that show a plateau in the region of these polar lipid groups (data not shown).
Figure 3.
Free volume profile as a function of distance along the monolayer normal.
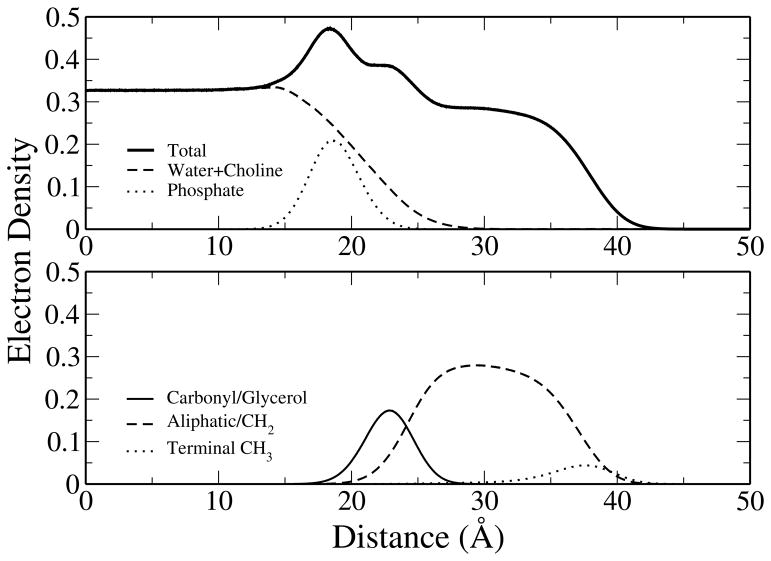
Electron density profiles were calculated by summation of the component densities, scaling each constituent atom type by the appropriate number of electrons, and are shown in Figure 4. These profiles are similar to results previously obtained for DPPC bilayers37 in both shape and magnitude to profiles fit to experimental data,81 though some differences are evident. Most notably, the CHEQ model overestimates the monolayer phosphate component with respect to the experimental bilayer profile while the carbonyl/glycerol (CG) component is underestimated. Thus, the peak density around 19 Å is slightly higher than that of the experimentally fit data. We emphasize that the comparison with the bilayer properties provided here is simply for reference; we do not suggest that monolayer and bilayer structural properties are necessarily identical under these conditions. Throughout the remainder of the discussion, we will draw attention to similarities and differences between our results on monolayers and past experimental and simulation results on monolayers (if available) or bilayers. This is done in the spirit of previous studies of monolayer systems.93–96
Figure 4.
Total and component electron density profiles. Components were grouped for comparison with the fitting models of Kucerka et al.81
B. Lipid Orientation and Ordering
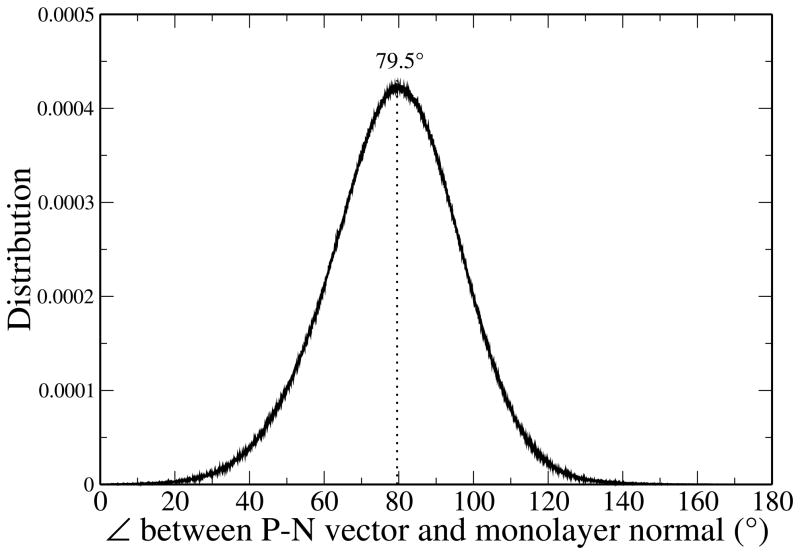
The orientation of the lipid monolayer head groups can be characterized by calculating the angle between the dipole vector connecting the phosphorus and nitrogen atoms, , and the monolayer normal. Due to the geometry of the monolayer system, care must be taken in defining the orientation of with respect to the appropriate reference axis. For lipids of the left leaflet (see Figure 1 for reference), where z < 0, the angle of interest is between the and the positive z-axis. For right leaflet lipids, where z > 0, the angle is between and the negative z-axis. The distribution is shown in Figure 5.
Figure 5.
Distribution of the angle between the P-N dipole vector and the monolayer normal.
The CHEQ model predicts the average head group to be oriented about 79.5° with respect to the monolayer normal, nearly parallel to the plane of the monolayer surface. This is comparable with previous results for the head group orientation of DPPC bilayers in which angles of 80–90° with respect to the bilayer normal are observed,37,87,97,98 as well as with studies of DPPC monolayers at the water-air interface.93–96 Recent arguments indicate that the orientation of the dipole has direct implications regarding hydration of the water-lipid interface such that a straightening of the head group orientation (angles decreasing from 90° towards 0° with respect to the membrane normal) allows more water to penetrate into the membrane-water interface.23
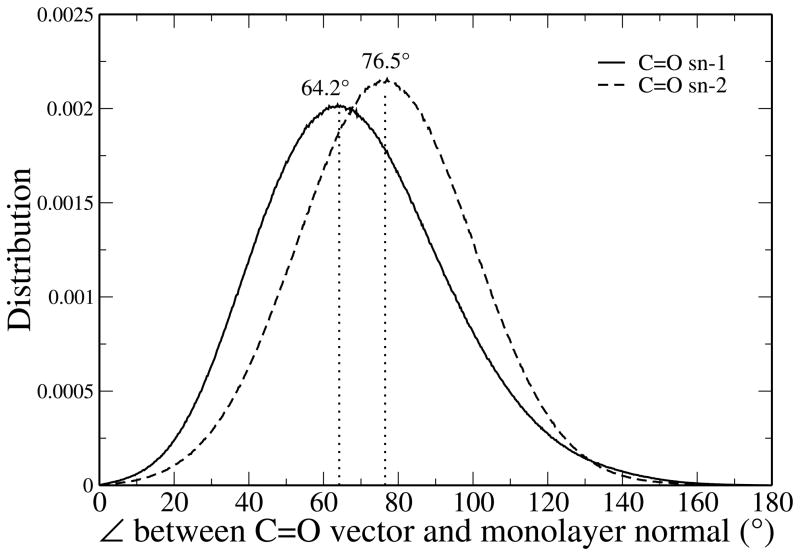
We conduct a similar analysis, with analogous geometric considerations, for the orientation of the carbonyl group of the lipid by calculating the angle between the vector formed by the C=O bonds and the monolayer normal, with results shown in Figure 6. The sn-1 carbonyl groups assume an average orientation of 64.2° relative to the monolayer normal while the sn-2 carbonyl groups orient around an angle of 76.5° relative to the monolayer normal. The CHEQ model’s prediction for the sn-1 carbonyl are comparable to an FT-IR study regarding the orientation of carbonyl groups in DPPC multilayers, which reported average orientation angles of 62 ± 2° and 66 ± 2° for the sn-1 and sn-2 carbonyls, respectively.99 Though the current model predicts a slightly higher angle for the sn-2 chain, the model follows the trend in relative values in sn-1 and sn-2 carbonyl groups observed for multilayers. We reiterate that this is no suggestion that these properties for monolayers and multilayers should be similar, but just an observation of the current analysis.
Figure 6.
Distribution of the angles between sn-1 and sn-2 carbonyl vectors and the monolayer normal.
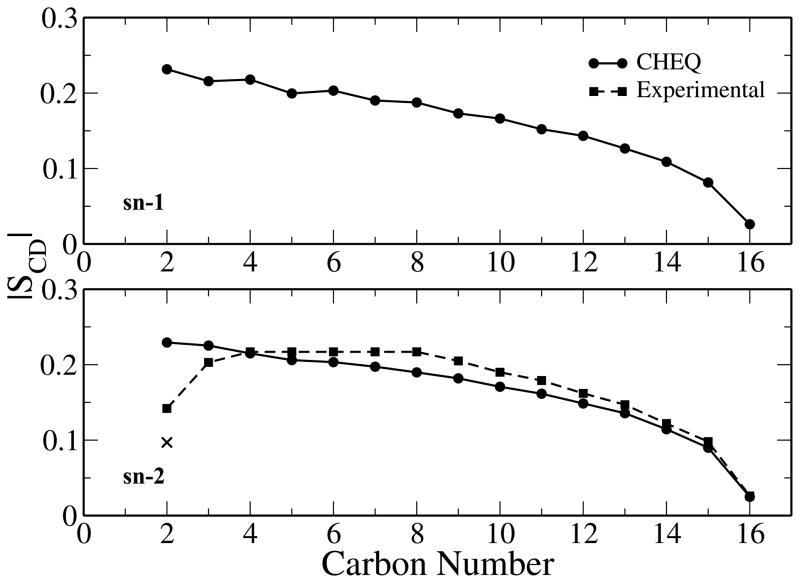
The structural order of the lipid tail groups can be evaluated by calculation of the deuterium order parameter, SCD as a function of carbon position along the aliphatic tail. SCD is directly related to the Szz component of the NMR quadrupolar splitting tensor and provides a measure of the order/disorder of alkyl chains in simulated lipid systems.23 We calculate SCD as
| (5) |
where θ is the angle between a C-H bond vector and the monolayer normal and
| (6) |
is the second Legendre polynomial. The calculation of the deuterium order parameters yields values between the extremes of −0.5 ( aligned with the water-monolayer interface) and 1 ( aligned with the z axis). Results for the calculation of the order parameters for both the sn-1 and sn-2 chains are shown in Figure 7 as well as the experimentally determined order parameters for the sn-2 chain of a DPPC bilayer.66 The C2 carbon has stereoscopically different hydrogens (2R and 2S) between which the CHEQ model is unable to distinguish. Although the CHEQ model does well in predicting the experimental trend of decreasing order further along the hydrocarbon chain,8,66,100,101 it overestimates the order of the carbon chain approaching the ester region (C2-C4) and tends to underestimate the order along the chain (C5-C25). These results are comparable to those found for DPPC bilayers using CHEQ force field.37
Figure 7.
Magnitude of the deuterium order parameters for sn-1 and sn-2 tail groups as a function of position along the hydrocarbon chain. The experimental order parameters for the sn-2 tail group are shown for comparison.66 The stereoscopically different carbons at carbon number 2 are shown with the 2S value denoted as an x.
C. Dielectric Permittivity and Water Dipole Moment Variation
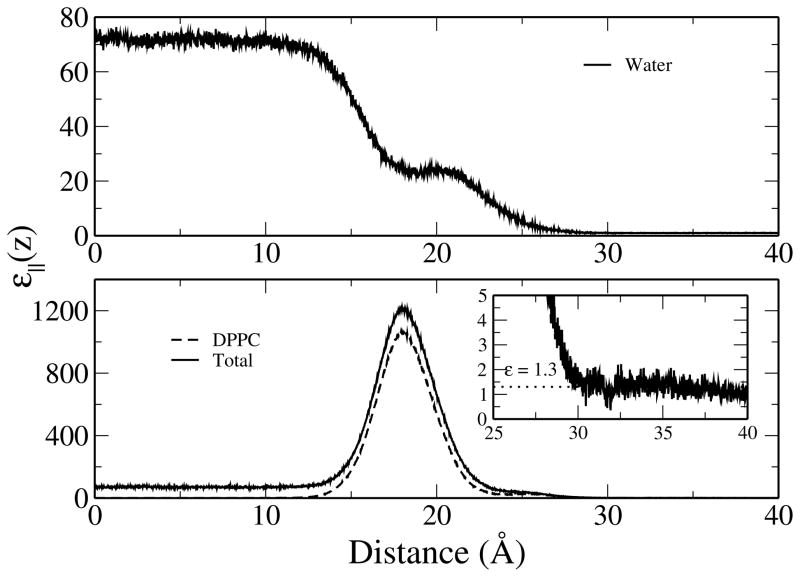
We consider the z-dependent dielectric permittivity profiles for components parallel to the monolayer surface using the approach developed by Stern and Feller.3 We compute the dielectric profiles for conductive (tin-foil) boundaries using equations 71 and 26 in Reference 3:
| (7) |
| (8) |
where P||(z) is the local polarization density, M|| is the total dipole moment parallel to the monolayer surface (xy-plane), and a||(z) represents an explicit polarization contribution. With the CHEQ model a||(z) is self-consistently included in the first term of Equation 8. P||(z) is calculated using a bond-charge approach similar to that of Stern and Feller3 in which the charge on an atom is determined from as set of bond-charge increments. A more complete derivation can be found in Reference 36.
Figure 8 shows the z-dependent parallel component of the dielectric constant as a function of distance from the center of the water layer along the monolayer normal. The dielectric constant of bulk TIP4P-FQ water (near the center of the water layer) is 71.9 ± 1.2, very close to the experimental dielectric constant for pure water at ~ 1 atm and 320 K (70.93).102 Upon entering the monolayer, the dielectric of water decreases monotonically until reaching a shoulder near the polar head groups of the lipid, similar to what is observed for the number density (Figure 2) and free volume (Figure 3) profiles, and further attenuates towards its gas-phase value upon entering the ester and aliphatic tail region. The head group region of the monolayer exhibits large dielectric values (up to around 1050) whereas in the hydrocarbon tail region the average value is about 1.3. The large dielectric found in the head groups has been attributed to the large dipole magnitudes (19 – 25 Debye) in this region.3 These results are comparable with studies performed on DPPC and DMPC bilayers using the CHEQ formalism.36,37 We note that the exact values for these properties are not directly experimentally accessible, and as such, predicted values are expected to demonstrate a significant spread in values.
Figure 8.
Profiles of the parallel component of the dielectric permittivity as a function of distance along the monolayer normal. Profiles are given for water (top), DPPC, and the total system (bottom). The lipid tail region is shown in greater detail due to scale (inset) with an average value of 1.3, shown as a dotted line, calculated from z = 30 to 40.
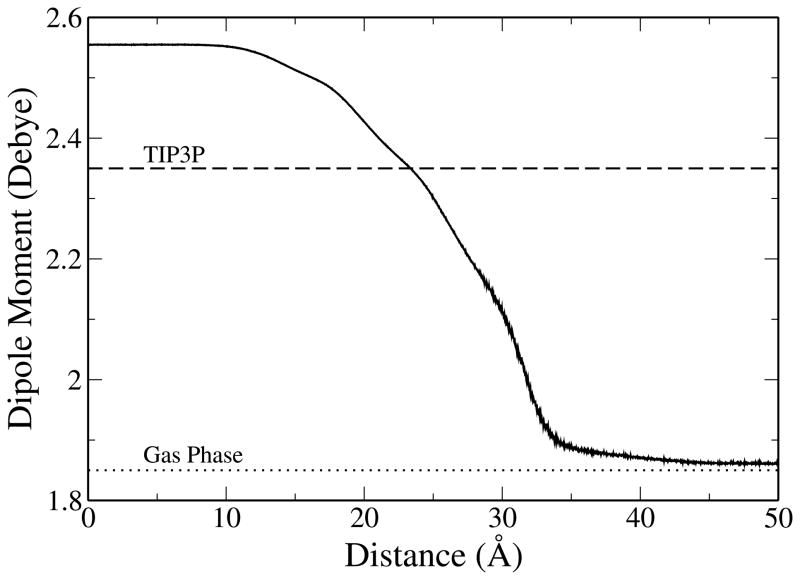
A characteristic of polarizable force fields is that they allow for charges to respond to variations in the local electrostatic environment. It follows that the average molecular dipole moment of water varies from the bulk phase into the lipid monolayer. Figure 9 shows the molecular dipole moment distributions found by averaging the dipole moment of water found in slabs 0.05 Å along the monolayer normal. In the center of the water layer the dipole moment reaches a value of 2.55 D, within the range of 2.5 to 3.0 D given by empirical and ab initio estimates of dipole moment of water in the condensed-phase.103–106 The bulk value is slightly lower than the frequently-cited value for TIP4P-FQ of 2.62 D, which is expected since the current simulations are performed at 323 K as opposed to 298 K for the literature work.104,107–110 Water’s dipole moment monotonically decreases as it moves through the lipid and, upon entering the aliphatic tail region, the dipole moment approaches the gas-phase value of 1.85 D.102 Unlike the Drude oscillator based SWM4-NDP, the TIP4P-FQ water model accommodates a larger variability in dipole moment. A study by Harder et al.39 using Drude polarizable models predicts that the average molecular dipole moment for water is reduced about 0.55 D within the lipid monolayer relative to bulk water. This is slightly lower than the difference of 0.7 D for TIP4P-FQ water (bulk water dipole moment of 2.55 D).
Figure 9.
Average molecular dipole moment profile of water as a function of distance along the monolayer normal, from the center of the water layer (bulk phase) through the lipid monolayer and into the vacuum region (gas phase). Dashed line denotes the constant dipole moment of the TIP3P water model while the dotted line denotes the experimental dipole moment of water in the gas phase.
D. Surface Tension and Pressure
The total surface tension of the lipid monolayer-water system is related to the anisotropy of the pressure tensor within an interfacial region by the relationship:
| (9) |
where Lz is the length of the simulation cell, Pzz is the component of the pressure tensor normal to the monolayer surface, and Pxx and Pyy are the components tangential to the surface. Accounting for the two interfaces in the present simulation, we can define surface tension for a single monolayer at the interface as
| (10) |
The pressure tensor was monitored continuously for multiple replicate monolayer systems until surface tensions were considered to be sufficiently stable. The resulting average for the surface tension of the DPPC monolayer systems is 42.35 ± 1.16 dyne/cm, consistent with the experimental value of 40.9 dyne/cm111 and with the value of 43.9 ± 0.8 obtained using state-of-art nonpolarizable force field simulations.112 To calculate the surface pressure of the monolayer system we follow a method analogous to that of Mohammad-Aghaie et al.:94
| (11) |
where γw is the surface tension of pure TIP4P-FQ water at 323 K. The value for γw was calculated as the average from three replicate molecular dynamics simulations of systems of 1024 TIP4P-FQ water molecules at the water-air interface simulated using CHARMM package78 for a total of 9 ns. We obtain an average surface tension of 65.27 ± 0.57 dyne/cm, underestimating the experimental value for the surface tension of pure water at 323 K of 67.94 dyne/cm.102 From the values reported for γm and γw, we find a surface pressure of 22.92 ± 1.29 dyne/cm. This value is slightly lower than those reported from captive bubble experiments performed by Crane et al.113 in which expansion isobars for phospholipid monolayers at varying temperatures and area per lipid values are reported (see Figure 3A in Reference 113) and yield a surface pressure range of 25–30 dyne/cm for a DPPC monolayer at 323 K with an area per lipid of 64.2 Å2; the measurements by Crane and co-workers are considered to be among the more reliable in terms of minimization of experimental artifacts such as leakage, pH, impurities, compression rate, and ionic strength.79,94,114 There appears to be a wide dispersion of experimental surface pressure values based on protocol and conditions.79 This makes an absolute comparison to experiment difficult, but we see that our predicted values are of comparable order of magnitude with available experimental data.
E. Monolayer Dipole Potential
Within the interior of a lipid membrane exists a positive potential which has ramifications on the penetration and permeability of ionic hydrophobes into and through the membrane. This potential is referred to as the membrane dipole potential and may also have implications regarding the association of proteins with a membrane surface as well as the penetration, structure, and function of transmembrane proteins. To determine the nature of the membrane dipole potential we compare the surface potential of the monolayer-water interface (Vmonolayer–water) with that of a water-air interface (Vwater–air). The surface potential of a system can be calculated through double integration of charge density as a function of distance from the center of the water layer along the monolayer normal:115
| (12) |
Here, ε0 is the permittivity of vacuum and ρ(z) is the charge density achieved by segmenting the system into slices of width dz and summing the charges within each slice. This effectively solves the Poisson Equation assuming in-plane isotropy at a particular depth into the monolayer. For both of the interfacial systems the vacuum regions are referenced to a potential of 0 V and integration in Equation 12 is taken from the vacuum region (∞) to a point at the center of the bulk water layer. To characterize the total membrane surface potential the charge densities of individual molecular species were twice integrated to yield constituent contributions to the electrostatic potential. Independently the surface potentials of these systems do not provide experimentally meaningful quantities but comparing the difference between the two,
| (13) |
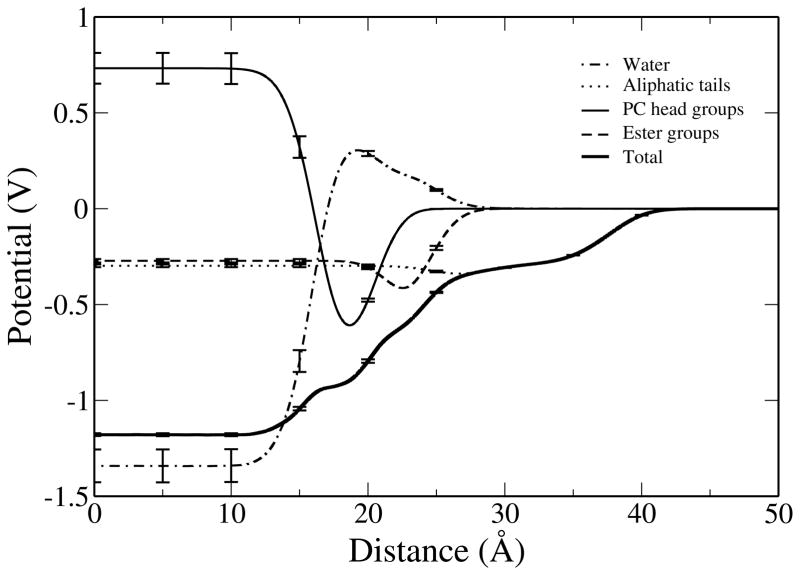
yields the shift in the surface potential upon addition of a lipid monolayer onto the water-air interface. The monolayer dipole potential calculated in this way is an explicit property of the system and should provide insight into the electrostatic properties of lipid membranes. The results of this analysis for the total and constituent contributions to the surface potential of the monolayer system are shown in Figure 10. To calculate the surface potential of the water-air interface three replicate interface systems of 1024 waters using the TIP4P-FQ potential were simulated, starting from pre-equilibrated structures, in the NV T ensemble with a cell size of 24 Å × 24 Å × 100 Å at 323 K implemented through the CHARMM package78 for a total simulation time of 14 ns. Surface potential calculations performed on the replicate water-air interface systems yield an average Vwater–air = 0.54 ± 0.01 V.
Figure 10.
Interfacial potential profiles of the total system and of selected components as a function of distance along the monolayer normal. The potential in the vacuum region is referenced to a value of 0 V.
The values of the total and component potentials shown in Figure 10, as well as those for the water-air interface, are given in Table I. For comparison, Table I also includes surface potential values reported by Harder et al. (utilizing a fully polarizable Drude oscillator model)39 as well as their results using the nonpolarizable CHARMM27 force field and the TIP3P water model. To investigate the effects of the variation of the water model on the potential calculation, the partial charges of the TIP4P-FQ water model used with the CHEQ force field were substituted with the those of the nonpolarizable TIP3P water model in both the monolayer-water and water-air systems. The results of this analysis are also included in Table I.
Table I.
Component and total interfacial potential values (in Volts) of monolayer-water and water-air systems, including results reported for nonpolarizable (CHARMM27), polarizable Drude oscillator, and polarizable CHEQ force field. Results obtained using the CHEQ force field with TIP3P charge substitution are also shown.
Experimentally determined surface potential changes for PC lipids at the argon-water interface range from 0.30 to 0.45 V.116 A graphical representation of the experimental range is presented in the Supporting Information. In Figure 10 it is shown that, using the CHEQ model, the resulting monolayer dipole is 0.64 ± 0.02 V, offering an improvement to the value of 0.8 V reported for the nonpolarizable CHARMM27 force field39 though still overestimating this property relative to experiment. It is encouraging that the addition of explicit electronic polarization within a partial atomic charge formalism moves the prediction of monolayer potential closer to experiment relative to the fixed-charge force field. When the partial charges of TIP4P-FQ water are substituted with those of TIP3P, the membrane potential decreases to a value of 0.35 ± 0.02 V, matching the value reported for the Drude oscillator model and in close agreement with the experimental range. The change in the value of the dipole potential difference resulting from the artificial modification of water model charges at most suggests that the nature of the charge distributions and polarizability of the water model may be a first-order perturbation to consider when refining the combination of lipid and solvent force fields for molecular simulations of these types of biological systems (as will be discussed below). We define the dipolar contribution to the potential as
| (14) |
where the dipole moment density μz(z) is defined as
| (15) |
and in which the indices m and i refer to a molecule and an atomic site within that molecule, respectively. The coordinate zim is taken to be an arbitrary, molecule-specific center, chosen to be the oxygen atom in the case of water. Similarly, the quadrupolar contribution to the potential is defined as
| (16) |
where the reference value is taken to be 0 and the quadrupole moment density (Qzz(z)) can be expressed as
| (17) |
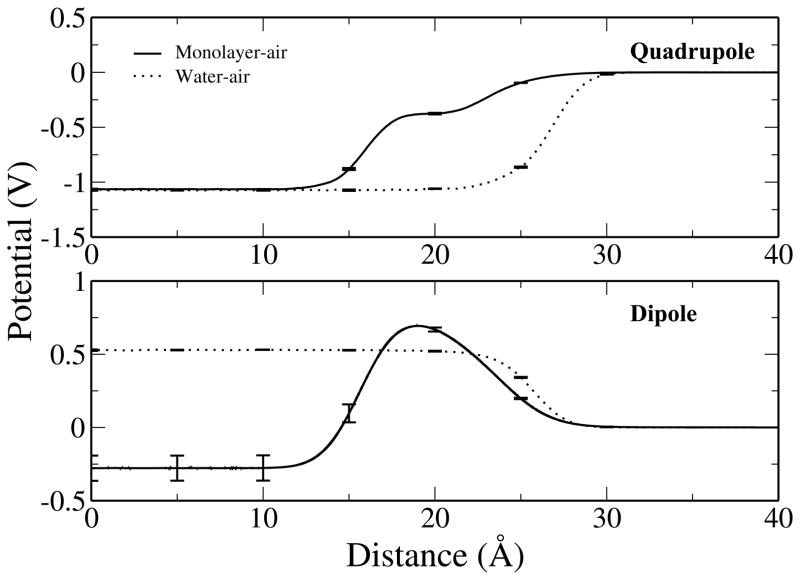
Figure 11 presents the decomposed water potentials and shows that the quadrupolar contribution changes little upon addition of the lipid onto water-air interface and does not contribute substantially to the overall potential shift. This is a direct consequence of the density dependence of the quadrupole potential.117 The contribution from the water molecular quadrupole moment will essentially vanish when considering the monolayer dipole potential difference which is measured experimentally. Thus, the nature of the quadrupole moment of the force field model is not as critical in assessing the monolayer dipole potential difference. This makes the monolayer dipole potential difference a more robust metric of the quality of the force field in the context of measuring the interfacial electrostatics in such systems. However, for pure bilayer systems, the contribution from the quadrupole term cannot be ignored, and may give rise to the spread in force field based values of the dipole potential. The dipolar contribution, however, changes sign and magnitude upon spreading of the lipid, leading to a net positive contribution of ≈ 0.8 V to the surface potential shift.
Figure 11.
Comparison of the quadrupole (top) and dipole (bottom) contributions to the interfacial potential of water as a function of distance along the interface normal for both the monolayer-water and water-air systems.
We conclude this section by commenting on the possible implications of the differences in the nature of the polarizable water model used in conjunction with the polarizable lipid membrane model. Harder et al.39 use the Drude water model, and comparing the water density and water dipole moment profiles of the Drude model versus the TIP4P-FQ water model used in this study, we observe some differences. Furthermore, the average orientation of the two water models is different, and since the water contribution to the surface dipole potential is directly related to average water orientation, one can inquire about the effects of this difference on the overall monolayer potential and the resulting difference in the ΔV values computed as in this study. We address these questions qualitatively next. The Drude water model has a lower polarizability than the TIP4P-FQ model used in this study (0.978 Å3 versus 1.12 Å3).55,118 Furthermore, in the Drude bilayer system, the magnitude of variation of the average water molecular dipole moment along the monolayer normal is less than for the TIP4P-FQ. In order to consider the effects of the influence of the dipole moment variation on the dipole potential the average dipole moment of water is fit to an error function of the form:
| (18) |
where the variation in dipole moment is from a + b (bulk water) to a − b (low density), c is the inflection point, and d represents the characteristic width of the transition. Based on our data, these parameters are: amonolayer–water = 2.21; bmonolayer–water = 0.35; cmonolayer–water = 26.679; dmonolayer–water = 9.27369 for the lipid membrane systems and awater–air = 2.21; bwater–air = 0.35; cwater–air = 29.0967; dwater–air = 4.589 for the water-air interfacial systems. The magnitude of the dipole moment variation from bulk water to low density water is the same in both systems and only the position and rate of change differs. We can modulate the magnitude of the dipole moment variation in each system by an empirical adjustment of the a and b parameters (assuming constant c and d):
| (19) |
Thus, we can effectively consider the impact of changing the dipole magnitude on the dipole potential by the application of a scaling function
| (20) |
to the dipole density (defined in Equation 15). The scaled dipole moment density, , can then be integrated as in Equation 14 to give the respective water dipole contribution. In Table II, we consider several variations (1.86 – 2.26 D to 1.86 – 2.86 D) and their influence on the water dipolar contribution to the potential difference. The magnitude of the dipole moment variation has limited influence on the dipole potential. That is, changing the CHEQ variation from 1.86 – 2.56 D to 1.86 – 2.26 D would only reduce ΔV by 0.105 V; increasing the variation to 1.86 – 2.86 increases ΔV by 0.12 V. In order to make a more direct comparison to results based on fully polarizable Drude models,39 we also consider dipole variation from 2.05 – 2.45 D at the monolayer-water interface and 1.95 – 2.45 D at the water-air interface. From this, we see a 0.051 V reduction in ΔV, in closer agreement with the experimental range.
Table II.
Parameters from altering dipole moment variation and influence on ΔV. Potentials in Volts, dipole moments in Debye. Drude scaling from 2.05–2.45 (monolayer-water) and 1.95–2.45 (water-air) as in Harder et al.39
| Set | a′ | b′ | μbulk | μgas |
|
|
ΔV | ||
|---|---|---|---|---|---|---|---|---|---|
| 1 | 2.06 | 0.20 | 2.26 | 1.86 | 0.229 | −0.474 | 0.703 | ||
| 2 | 2.11 | 0.25 | 2.36 | 1.86 | 0.246 | −0.492 | 0.738 | ||
| 3 | 2.16 | 0.30 | 2.46 | 1.86 | 0.263 | −0.510 | 0.772 | ||
| 4 (CHEQ) | 2.21 | 0.35 | 2.56 | 1.86 | 0.279 | −0.528 | 0.807 | ||
| 5 | 2.26 | 0.40 | 2.66 | 1.86 | 0.296 | −0.546 | 0.842 | ||
| 6 | 2.31 | 0.45 | 2.76 | 1.86 | 0.313 | −0.564 | 0.877 | ||
| 7 | 2.36 | 0.50 | 2.86 | 1.86 | 0.345 | −0.582 | 0.927 | ||
| 8 (Drude) | 2.25/2.20 | 0.2/0.25 | 2.45/2.45 | 2.05/1.95 | 0.246 | −0.511 | 0.756 | ||
| 9 (Drude (nomin)) | 2.25/2.20 | 0.2/0.25 | 2.45/2.45 | 2.05/1.95 | 0.933 | −0.511 | 1.444 |
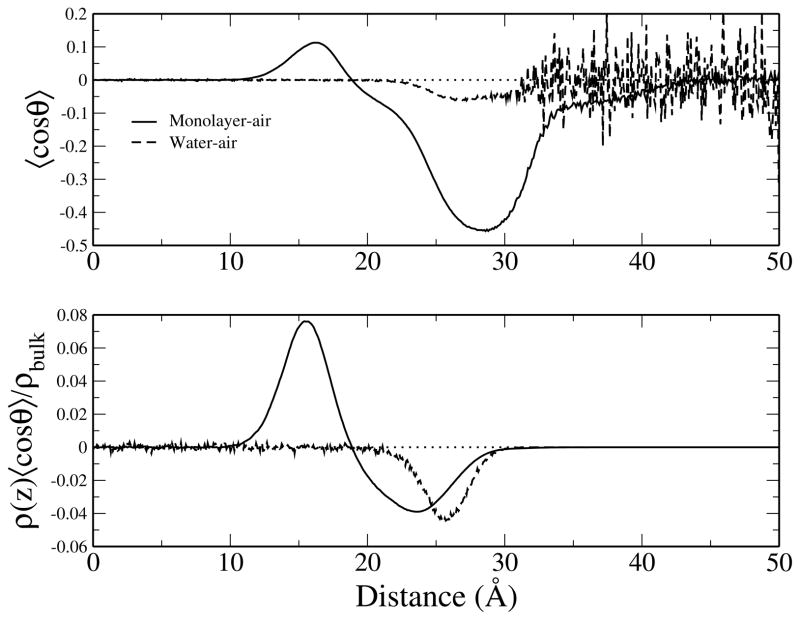
The water contribution to the dipole potential is not only affected by the magnitude of water dipole moment, but it is also influenced by the preferential orientation of water at the interface. We measure the orientation of water as 〈cos θ〉, where θ is the angle formed between the permanent dipole vector of water and the z-axis; results are shown in Figure 12 (top). Values of 〈cos θ〉 = ±1 indicate the average water dipole is perfectly aligned with the ±z-axis (normal to the interface), whereas 〈cos θ〉 = 0 denotes orientations that do not contribute to the dipole potential (isotropic orientations and alignment parallel to the interface). Approaching the monolayer from bulk water, water molecules preferentially align in the positive z direction. Beyond z < 19 Å (approximately the peak position of the lipid head group phosphorus density) the orientation of water is reversed with a strong alignment in the negative z direction. Although water density is strongly aligned in the negative z-direction throughout 20 Å < z < 40 Å, there are fewer water molecules in this portion than in the region approaching the head groups from bulk water. We can consider how water orientation contributes to the surface potential by scaling the orientation by the density of water, ρ(z)/ρbulk. Scaled orientation profiles (Figure 12 (bottom)) demonstrate reduced magnitudes in the peak and minimum in the monolayer-water profile. The minimum in the monolayer-water profile is a feature not seen in the similar study using Drude polarizable models. We can remove the influence of this minimum from this profile by an effective scaling (we use a sharply decreasing error function from 1 to 0 to keep the peak in the orientation profile, while scaling the minimum to zero). When we remove the effect of the orientational minimum from the dipole density profile, the resulting water dipole contribution is 0.933 V at the lipid-air interface (considering the Drude dipole scaling), ≈ 0.7 V higher than the original. We comment that the water contribution to the dipole potential is a complex combination of water atomic partial charge variation across the interface and water orientation. In our simplistic analysis, the water orientation appears to be the significant contributor to the dipole potential, with the details of the charge distribution contributing second order effects. Of course, the response of the lipid electrostatics has not been considered in this analysis, and this must be considered for a proper accounting of all simultaneous effects.
Figure 12.
Orientation of water at the monolayer-water and water-air interfaces. The average orientation of water (top) and the average orientation scaled by the z-dependent density relative to bulk density of water (bottom). Dotted horizontal line denoting 〈cos θ〉 = 0 is included as a visual guide.
IV. CONCLUSIONS
We have presented results of the predictions of several properties of a DPPC-water monolayer using novel CHEQ force fields in conjunction with molecular dynamics simulations. The current study further explores the application of non-additive electrostatic models for representing the interaction between atomic species in lipidic systems. To date, this is the second study to consider the monolayer-water properties of DPPC using fully polarizable water and lipid force fields. The CHEQ force fields used here explicitly treat electronic polarization in a classical treatment of intermolecular interactions. Structural properties of the lipid monolayer are comparable with experiment and earlier simulation studies of lipid membrane systems of equivalent size. For the polarizable force field, we note enhanced penetration of water molecules into the lipid monolayer, in agreement with the behavior observed for polarizable water in DMPC and DPPC bilayers. We find that the water dipole moment monotonically decreases from a bulk value of 2.55 D (at 323 K) to the gas-phase value in the aliphatic tail region of the monolayer.
The surface pressure, determined as the difference between the monolayer and pure water surface tensions at 323 K, is predicted to be 22.92 ± 1.29 dyne/cm, just slightly below the broad range of experimental values reported for this system. The surface tension for the DPPC-water monolayer is predicted to be 42.35 ± 1.16 dyne/cm. This value agrees with experimental results111 as well as with DPPC monolayer simulations using state-of-the-art nonpolarizable force fields.112 The current results of simulations predict a monolayer-water potential difference relative to the pure water-air interface of 0.64 ± 0.02 V, an improved prediction compared to the fixed-charge CHARMM27 force field, and overestimating the experimental range of 0.30 to 0.45 V. Since the CHEQ model is a charge-based model for polarization, the current results suggest that explicitly-modeled polarization effects can offer improvements in describing interfacial electrostatics in such systems. Further development of CHARMM charge equilibration force field is ongoing and continues to correct the existing deficiencies in the spirit of force field development.2
Supplementary Material
Acknowledgments
The authors acknowledge support from the National Institutes of Health (COBRE:5P20RR017716-07) at the University of Delaware, Department of Chemistry and Biochemistry. B.A.B. acknowledges additional support from a University of Delaware Graduate Fellows award. The authors are also appreciative of computational resources provided by the National Institutes of Health (COBRE:P20-RR015588) in the Chemical Engineering Department at the University of Delaware.
References
- 1.Dorairaj S, Allen TW. PNAS. 2007;104:4943–4948. doi: 10.1073/pnas.0610470104. [DOI] [PMC free article] [PubMed] [Google Scholar]
- 2.Pastor RW, Jr, ADM J Phys Chem Lett. 2011;2:1526–1532. doi: 10.1021/jz200167q. [DOI] [PMC free article] [PubMed] [Google Scholar]
- 3.Stern H, Feller SE. J Chem Phys. 2003;118:3401–3412. [Google Scholar]
- 4.Wang L, Bose PS, Sigworth FJ. PNAS. 2006;103:18528–18533. doi: 10.1073/pnas.0608714103. [DOI] [PMC free article] [PubMed] [Google Scholar]
- 5.MacCallum JL, Bennett WFD, Tieleman DP. Biophys J. 2008;94:3393–3404. doi: 10.1529/biophysj.107.112805. [DOI] [PMC free article] [PubMed] [Google Scholar]
- 6.Kučerka N, Liu Y, Chu N, Petrache HI, Tristram-Nagle S, Nagle JF. Biophys J. 2005;88:2626–2637. doi: 10.1529/biophysj.104.056606. [DOI] [PMC free article] [PubMed] [Google Scholar]
- 7.Kučerka N, Nagle JF, Sachs JN, Feller SE, Pencer J, Jackson A, Katsaras J. Biophys J. 2008;95:2356–2367. doi: 10.1529/biophysj.108.132662. [DOI] [PMC free article] [PubMed] [Google Scholar]
- 8.Petrache HI, Dodd SW, Brown MF. Biophys J. 2000;79:3172–3192. doi: 10.1016/S0006-3495(00)76551-9. [DOI] [PMC free article] [PubMed] [Google Scholar]
- 9.Marsh D. Eur Biophys J. 2002;31:559–562. doi: 10.1007/s00249-002-0245-z. [DOI] [PubMed] [Google Scholar]
- 10.Erilov DA, Bartucci R, Guzzi R, Shubin AA, Maryasov AG, Marsh D, Dzuba SA, Sportelli L. J Phys Chem B. 2005;109:12003–12013. doi: 10.1021/jp050886z. [DOI] [PubMed] [Google Scholar]
- 11.Mathai JC, Tristram-Nagle S, Nagle JF, Zeidel ML. J Gen Physiol. 2008;131:69–76. doi: 10.1085/jgp.200709848. [DOI] [PMC free article] [PubMed] [Google Scholar]
- 12.Roux B, Allen T, Berneche S, Im W. Q Rev Biophys. 2004;37:15–103. doi: 10.1017/s0033583504003968. [DOI] [PubMed] [Google Scholar]
- 13.Allen TW, Bastug T, Kuyucak S, Chung SH. Biophys J. 2003;84:2159–2168. doi: 10.1016/S0006-3495(03)75022-X. [DOI] [PMC free article] [PubMed] [Google Scholar]
- 14.Berneche S, Roux B. Biophys J. 2002;82:772–780. doi: 10.1016/S0006-3495(02)75439-8. [DOI] [PMC free article] [PubMed] [Google Scholar]
- 15.Allen TW, Andersen OS, Roux B. PNAS. 2004;101:117–122. doi: 10.1073/pnas.2635314100. [DOI] [PMC free article] [PubMed] [Google Scholar]
- 16.Aliste MP, Tieleman DP. BMC Biochem. 2005;6:30. doi: 10.1186/1471-2091-6-30. [DOI] [PMC free article] [PubMed] [Google Scholar]
- 17.Tieleman DP, MacCallum JL, Ash WL, Kandt C, Xu Z, Monticelli LM. J Phys Condens Matter. 2006;18:S1221–S1234. doi: 10.1088/0953-8984/18/28/S07. [DOI] [PubMed] [Google Scholar]
- 18.Xu Z, Luo HH, Tieleman DP. J Comput Chem. 2007;28:689–697. doi: 10.1002/jcc.20560. [DOI] [PubMed] [Google Scholar]
- 19.Feller SE. Curr Opin Colloid Interface Sci. 2000;5:217–223. [Google Scholar]
- 20.MacCallum JL, Tieleman DP. J Am Chem Soc. 2006;128:125–130. doi: 10.1021/ja0535099. [DOI] [PubMed] [Google Scholar]
- 21.Pandit SA, Bostick D, Berkowitz ML. Biophys J. 2004;86:1345–1356. doi: 10.1016/S0006-3495(04)74206-X. [DOI] [PMC free article] [PubMed] [Google Scholar]
- 22.Berkowitz ML, Bostick DL, Pandit SA. Chem Rev. 2006;106:1527–1539. doi: 10.1021/cr0403638. [DOI] [PubMed] [Google Scholar]
- 23.Siu SWI, Vacha R, Jungwirth P, Bockmann RA. J Chem Phys. 2008;128:125103. doi: 10.1063/1.2897760. [DOI] [PubMed] [Google Scholar]
- 24.Holcomb CD, Clancy P, Thompson SM, Zollweg JA. Fluid Phase Equilib. 1992;75:185–196. [Google Scholar]
- 25.Schuler LD, Daura X, van Gunsteren WF. J Comput Chem. 1996;22:1205–1218. [Google Scholar]
- 26.Marrink SJ, de Vries AH, Mark AE. J Phys Chem B. 2004;108:750–760. [Google Scholar]
- 27.Marrink SJ, Risselada S, Yefimov S, Tieleman DP, de Vries AH. J Phys Chem B. 2007;111:7812–7824. doi: 10.1021/jp071097f. [DOI] [PubMed] [Google Scholar]
- 28.Monticelli L, Kandasamy S, Periole X, Larson R, Tieleman DP, Marrink SJ. J Chem Theory Comput. 2008;4:819–834. doi: 10.1021/ct700324x. [DOI] [PubMed] [Google Scholar]
- 29.Srinivas G, Klein ML. Nanotechnology. 2007;18:205703. [Google Scholar]
- 30.Ensing B, Nielsen SO, Moore PB, Klein ML. J Chem Theory Comput. 2007;3:1100–1105. doi: 10.1021/ct600323n. [DOI] [PubMed] [Google Scholar]
- 31.Lopez CF, Nielsen SO, Srinivas G, DeGrado WF, Klein ML. J Chem Theory Comput. 2006;2:649–655. doi: 10.1021/ct050298p. [DOI] [PMC free article] [PubMed] [Google Scholar]
- 32.Im W, Feig M, Brooks CLI. Biophys J. 2003;85:2900–2918. doi: 10.1016/S0006-3495(03)74712-2. [DOI] [PMC free article] [PubMed] [Google Scholar]
- 33.Tanizaki S, Feig M. J Phys Chem B. 2006;110:548–556. doi: 10.1021/jp054694f. [DOI] [PubMed] [Google Scholar]
- 34.Tanizaki S, Feig M. J Chem Phys. 2005;122:124706. doi: 10.1063/1.1865992. [DOI] [PubMed] [Google Scholar]
- 35.Lazaridis T. Proteins Struct Funct Genet. 2003;52:176–192. doi: 10.1002/prot.10410. [DOI] [PubMed] [Google Scholar]
- 36.Davis JE, Rahaman O, Patel S. Biophys J. 2009;96:385–402. doi: 10.1016/j.bpj.2008.09.048. [DOI] [PMC free article] [PubMed] [Google Scholar]
- 37.Davis JE, Patel S. J Phys Chem B. 2009;113:9183–9196. doi: 10.1021/jp901088g. [DOI] [PMC free article] [PubMed] [Google Scholar]
- 38.Patel S, Davis JE, Bauer BA. J Am Chem Soc. 2009;131:13890–13891. doi: 10.1021/ja902903m. [DOI] [PMC free article] [PubMed] [Google Scholar]
- 39.Harder E, MacKerell JAD, Roux B. J Am Chem Soc. 2009;131:2760–2761. doi: 10.1021/ja806825g. [DOI] [PMC free article] [PubMed] [Google Scholar]
- 40.Allen TW, Anderson OS, Roux B. Biophys J. 2006;90:3447–3468. doi: 10.1529/biophysj.105.077073. [DOI] [PMC free article] [PubMed] [Google Scholar]
- 41.Vacha R, Jurkiewicz P, Petrov M, Berkowitz ML, Bockmann R, Barucha-Kraszewska J, Hof M, Jungwirth P. J Phys Chem B. 2010;114:9504–9509. doi: 10.1021/jp102389k. [DOI] [PubMed] [Google Scholar]
- 42.Brockman H. Chem Phys Lipids. 1994;73:57–79. doi: 10.1016/0009-3084(94)90174-0. [DOI] [PubMed] [Google Scholar]
- 43.Clarke RJ. Adv Colloid Interface Sci. 2001;89:263–281. doi: 10.1016/s0001-8686(00)00061-0. [DOI] [PubMed] [Google Scholar]
- 44.Gawrisch K, Ruston D, Zimmerberg J, Parsegian VA, Rand RP, Fuller N. Biophys J. 1992;61:1213–1223. doi: 10.1016/S0006-3495(92)81931-8. [DOI] [PMC free article] [PubMed] [Google Scholar]
- 45.Yang Y, Mayer KM, Wickremasinghe NS, Hafner JH. Biophys J. 2008;95:5193–5199. doi: 10.1529/biophysj.108.136507. [DOI] [PMC free article] [PubMed] [Google Scholar]
- 46.Schamberger J, Clarke RJ. Biophys J. 2002;82:3081–3088. doi: 10.1016/S0006-3495(02)75649-X. [DOI] [PMC free article] [PubMed] [Google Scholar]
- 47.Schurhammer R, Engler E, Wipff G. J Phys Chem B. 2001;105:10700–10708. [Google Scholar]
- 48.Mobley DL, Barber AE, Fennell CJ, Dill K. J Phys Chem B. 2008;112:2405–2414. doi: 10.1021/jp709958f. [DOI] [PMC free article] [PubMed] [Google Scholar]
- 49.Shao Y, Stewart AA, Girault HH. J Chem Soc, Faraday Trans. 1991;87:2593–2597. [Google Scholar]
- 50.Schurhammer R, Wipff G. J Phys Chem A. 2000;104:11159–11168. [Google Scholar]
- 51.Luzhkov V, Warshel A. J Comp Chem. 1992;13:199–213. [Google Scholar]
- 52.Roux B, Yu HA, Karplus M. J Phys Chem. 1990;94:4684–4688. [Google Scholar]
- 53.Hummer G, Pratt LR, Garcia AE. J Phys Chem. 1996;100:1206–1215. [Google Scholar]
- 54.Lynden-Bell RM, Rasaiah JC. J Chem Phys. 1997;107:1981–1991. [Google Scholar]
- 55.Rick SW, Stuart SJ, Berne BJ. J Chem Phys. 1994;101:6141–6156. [Google Scholar]
- 56.Rappe A, Goddard IWA. J Phys Chem. 1991;95:3358–3363. [Google Scholar]
- 57.Parr RG, Yang W. Density-Functional Theory of Atoms and Molecules. Oxford University Press; Oxford: 1989. [Google Scholar]
- 58.Sanderson RT. Chemical Bonds and Bond Energy. 2. Academic; New York: 1976. [Google Scholar]
- 59.Sanderson RT. Science. 1951;114:670–672. doi: 10.1126/science.114.2973.670. [DOI] [PubMed] [Google Scholar]
- 60.Rick SW, Berne BJ. J Am Chem Soc. 1996;118:672–679. [Google Scholar]
- 61.Mortier WJ, Genechten KV, Gasteiger J. J Am Chem Soc. 1985;107:829–835. [Google Scholar]
- 62.Mortier WJ, Ghosh SK, Shankar S. J Am Chem Soc. 1986;108:4315–4320. [Google Scholar]
- 63.Nalewajski RF, Korchowiec J, Zhou Z. Int J Quantum Chem: Quantum Chemistry Symposium 22. 1988;22:349–366. [Google Scholar]
- 64.Patel S, Brooks I, Charles L. J Comp Chem. 2004;25:1–15. doi: 10.1002/jcc.10355. [DOI] [PubMed] [Google Scholar]
- 65.Rick SW, Stuart SJ. Potentials and Algorithms for Incorporating Polarizability in Computer Simulations. In: Lipkowitz KB, Boyd DB, editors. Reviews in Computational Chemistry. John Wiley and Sons, Inc; 2002. p. 89. [Google Scholar]
- 66.Douliez JP, Leonard A, Duforc EJ. Biophys J. 1995;68:1727–1739. doi: 10.1016/S0006-3495(95)80350-4. [DOI] [PMC free article] [PubMed] [Google Scholar]
- 67.Chelli R, Procacci P. J Chem Phys. 2002;117:9175–9189. [Google Scholar]
- 68.Warren GL, Davis JE, Patel S. J Chem Phys. 2008;128:144110. doi: 10.1063/1.2872603. [DOI] [PMC free article] [PubMed] [Google Scholar]
- 69.Jiao D, King C, Grossfield A, Darden T, Ren P. J Phys Chem B. 2006;110:18553–18559. doi: 10.1021/jp062230r. [DOI] [PubMed] [Google Scholar]
- 70.Rasmussen TD, Ren P, Ponder JW, Jensen F. Int J Quant Chem. 2006;107:1390–1395. [Google Scholar]
- 71.Schnieders MJ, Baker NA, Ren P, Ponder JW. J Chem Phys. 2007;126:124114. doi: 10.1063/1.2714528. [DOI] [PMC free article] [PubMed] [Google Scholar]
- 72.Vorobyov IV, Anisimov VM, MacKerell JAD. J Phys Chem B. 2005;109:18988–18999. doi: 10.1021/jp053182y. [DOI] [PubMed] [Google Scholar]
- 73.Harder E, Anisimov VM, Vorobyov IV, Lopes PEM, Noskov SYAD, MacKerell J, Roux B. J Chem Theory Comput. 2006;2:1587–1597. doi: 10.1021/ct600180x. [DOI] [PubMed] [Google Scholar]
- 74.Lopes PEM, Lamoureux G, Roux BAD, MacKerell J. J Phys Chem B. 2007;111:2873–2885. doi: 10.1021/jp0663614. [DOI] [PMC free article] [PubMed] [Google Scholar]
- 75.Car R, Parrinello M. Phys Rev Lett. 1985;55:2471–2474. doi: 10.1103/PhysRevLett.55.2471. [DOI] [PubMed] [Google Scholar]
- 76.Jorgensen WL, Chandrasekhar J, Madura JD, Impey RW, Klein ML. J Chem Phys. 1983;79:926–935. [Google Scholar]
- 77.Rick SW, Stuart SJ, Bader JS, Berne BJ. J Mol Liq. 1995;65/66:31–40. [Google Scholar]
- 78.Brooks BR, Bruccoleri RE, Olafson BD, States DJ, Swaminathan S, Karplus M. J Comput Chem. 1983;4:187–217. [Google Scholar]
- 79.Duncan SL, Larson R. Biophys J. 2008;94:2965–2986. doi: 10.1529/biophysj.107.114215. [DOI] [PMC free article] [PubMed] [Google Scholar]
- 80.Castro-Roman F, Benz RW, White SH, Tobias DJ. J Phys Chem B. 2006;110:24157–24164. doi: 10.1021/jp064746g. [DOI] [PubMed] [Google Scholar]
- 81.Kučerka N, Tristram-Nagle S, Nagle JF. Biophys J. 2006;90:L83–L85. doi: 10.1529/biophysj.106.086017. [DOI] [PMC free article] [PubMed] [Google Scholar]
- 82.Allen MP, Tildesley DJ. Computer Simulation of Liquids. Clarendon Press; Oxford: 1987. [Google Scholar]
- 83.Nosé S. Mol Phys. 1984;52:255–268. [Google Scholar]
- 84.Sperotto MM, Mouritsen OG. Biophys J. 1991;59:251–270. doi: 10.1016/S0006-3495(91)82219-6. [DOI] [PMC free article] [PubMed] [Google Scholar]
- 85.Darden T, York D, Pederson L. J Chem Phys. 1993;98:10089–10092. [Google Scholar]
- 86.Essmann U, Darden T, Lee H, Perera L, Berkowitz ML, Pederson L. J Chem Phys. 1995;103:8577–8593. [Google Scholar]
- 87.Pandit SA, Bostick D, Berkowitz ML. Biophys J. 2003;84:3743–3750. doi: 10.1016/S0006-3495(03)75102-9. [DOI] [PMC free article] [PubMed] [Google Scholar]
- 88.Lopez CF, Nielsen SO, Klein ML, Moore PB. J Phys Chem B. 2004;108:6603–6610. [Google Scholar]
- 89.Moore PB, Lopez CF, Klein ML. Biophys J. 2001;81:2484–2494. doi: 10.1016/S0006-3495(01)75894-8. [DOI] [PMC free article] [PubMed] [Google Scholar]
- 90.Davis JE, Patel S. Chem Phys Lett. 2010;484:173–176. doi: 10.1016/j.cplett.2009.09.061. [DOI] [PMC free article] [PubMed] [Google Scholar]
- 91.Bauer BA, Lucas TR, Meninger DJ, Patel S. Chem Phys Lett. 2011;508:289–294. doi: 10.1016/j.cplett.2011.04.052. [DOI] [PMC free article] [PubMed] [Google Scholar]
- 92.Marrink SJ, Sok RM, Berendsen HJC. J Chem Phys. 1996;104:9090–9099. [Google Scholar]
- 93.Dominguez H, Smondyrev AM, Berkowitz ML. J Phys Chem B. 1999;103:9582–9588. [Google Scholar]
- 94.Mohammad-Aghaie D, Mace E, Sennoga CA, Seddon JM, Bresme F. J Phys Chem B. 2010;114:1325–1335. doi: 10.1021/jp9061303. [DOI] [PubMed] [Google Scholar]
- 95.Mohwald H. Annu Rev Phys Chem. 1990;41:441–476. doi: 10.1146/annurev.pc.41.100190.002301. [DOI] [PubMed] [Google Scholar]
- 96.Ma G, Allen HC. Langmuir. 2006;22:5341–5349. doi: 10.1021/la0535227. [DOI] [PubMed] [Google Scholar]
- 97.Tu K, Klein ML, Tobias DJ. Biophys J. 1998;75:2147–2156. doi: 10.1016/S0006-3495(98)77657-X. [DOI] [PMC free article] [PubMed] [Google Scholar]
- 98.Pandit SA, Bostick D, Berkowitz ML. Biophys J. 2003;85:3120–3131. doi: 10.1016/S0006-3495(03)74730-4. [DOI] [PMC free article] [PubMed] [Google Scholar]
- 99.Hübner W, Mantsch HH. Biophys J. 1991;59:1261–1272. doi: 10.1016/S0006-3495(91)82341-4. [DOI] [PMC free article] [PubMed] [Google Scholar]
- 100.Trouard TP, Nevzorov AA, Alam TM, Job C, Zajicek J, Brown MF. J Chem Phys. 1999;110:8802–8818. [Google Scholar]
- 101.Otten D, Brown MF, Beyer K. J Phys Chem B. 2000;104:12119–12129. [Google Scholar]
- 102.Lide DP, editor. CRC Handbook of Chemistry and Physics. 88. CRC Press; 2007. [Google Scholar]
- 103.Badyal YS, Saboung ML, Price DL, Shastri SD, Haeffner DR, Soper AK. J Chem Phys. 2000;112:9206. [Google Scholar]
- 104.Silvestrelli PL, Parrinello M. Phys Rev Lett. 1999;82:5415–5415. doi: 10.1103/PhysRevLett.77.3149. [DOI] [PubMed] [Google Scholar]
- 105.Kuo IFW, Mundy CJ, Eggimann BL, McGrath MJ, Siepmann JI, Chen B, Vieceli J, Tobias DJ. J Phys Chem B. 2006;110:3738–3746. doi: 10.1021/jp056330t. [DOI] [PubMed] [Google Scholar]
- 106.Sprik M. J Chem Phys. 1991;95:6762–6769. [Google Scholar]
- 107.Carnie SL, Patey GN. Mol Phys. 1982;47:1129–1151. [Google Scholar]
- 108.Chen B, Xing J, Siepmann JI. J Phys Chem B. 2000;104:2391–2401. [Google Scholar]
- 109.Silvestrelli PL, Parrinello M. J Chem Phys. 1999;111:3572–3580. [Google Scholar]
- 110.Watanabe K, Klein ML. Chem Phys. 1989;131:157–167. [Google Scholar]
- 111.Somerharju PJ, Virtanen JA, Eklund KK, Vainio P, Kinnunen PKJ. Biochemistry. 1985;24:2773–2781. doi: 10.1021/bi00332a027. [DOI] [PubMed] [Google Scholar]
- 112.Klauda JB, Venable RM, Freites JA, O’Connor JW, Tobais DJ, Mondragon-Ramirez C, Vorobyov I, MacKerell J, AD, Pastor RW. J Phys Chem B. 2010;114:7830–7843. doi: 10.1021/jp101759q. [DOI] [PMC free article] [PubMed] [Google Scholar]
- 113.Crane JM, Putz G, Hall SB. Biophys J. 1999;77:3134–3143. doi: 10.1016/S0006-3495(99)77143-2. [DOI] [PMC free article] [PubMed] [Google Scholar]
- 114.Baoukina S, Monticelli L, Marrink SJ, Tieleman DP. Langmuir. 2007;23:12617–12623. doi: 10.1021/la702286h. [DOI] [PubMed] [Google Scholar]
- 115.Harder E, Roux B. J Chem Phys. 2008;129:234706. doi: 10.1063/1.3027513. [DOI] [PMC free article] [PubMed] [Google Scholar]
- 116.Smaby JM, Brockman HL. Biophys J. 1990;58:195–204. doi: 10.1016/S0006-3495(90)82365-1. [DOI] [PMC free article] [PubMed] [Google Scholar]
- 117.Vorobyov I, Allen TW. J Chem Phys. 2010;132:185101. [Google Scholar]
- 118.Lamoureux G, Harder E, Vorobyov IV, Roux B, MacKerell AD., Jr Chem Phys Lett. 2006;418:245–249. [Google Scholar]
- 119.Humphrey W, Dalke A, Schulten K. J Molec Graphics. 1996;14:33–28. doi: 10.1016/0263-7855(96)00018-5. [DOI] [PubMed] [Google Scholar]
Associated Data
This section collects any data citations, data availability statements, or supplementary materials included in this article.


