

Abstract
Clinical manifestations of movement disorders, such as Parkinson’s disease (PD) and dystonia, arise from neurophysiological changes within the cortico-striato-pallidothalamocortical (CSPTC) and cerebello-thalamo-cortical (CbTC) circuits. Neuroimaging techniques that probe connectivity within these circuits can be used to understand how these disorders develop as well as identify potential targets for medical and surgical therapies. Indeed, network analysis of 18F-fluorodeoxyglucose (FDG) positron emission tomography (PET) has identified abnormal metabolic networks associated with the cardinal motor symptoms of PD, such as akinesia and tremor, as well as PD-related cognitive dysfunction. More recent task-based and resting state functional magnetic resonance imaging studies have reproduced several of the altered connectivity patterns identified in these abnormal PD-related networks. A similar network analysis approach in dystonia revealed abnormal disease related metabolic patterns in both manifesting and non-manifesting carriers of dystonia mutations. Other multimodal imaging approaches using magnetic resonance diffusion tensor imaging in patients with primary genetic dystonia suggest abnormal connectivity within the CbTC circuits mediate the clinical manifestations of this inherited neurodevelopmental disorder. Ongoing developments in functional imaging and future studies in early patients are likely to enhance our understanding of these movement disorders and guide novel targets for future therapies.
Keywords: Parkinson’s disease, Dystonia, Functional imaging, Brain networks, Connectivity, Motor, Cognition
Introduction
The basal ganglia-thalamocortical circuits were first proposed by Alexander et al. in 1986 (Fig. 1) as part of a ‘parallel circuit’ hypothesis identifying discrete pathways subserving skeletomotor, oculomotor, associative, and limbic functions (Alexander et al., 1986). Over the past two decades these cortico-striato-pallidothalamocortical (CSPTC) loops have undergone further refinement. In particular, it is now accepted that the motor loops are comprised of several subcircuits spanning the different precentral cortical fields (see e.g., Bergman et al., 1998; Middleton and Strick, 2000; Turner et al., 1998). Experimental investigations in animal models and neuropathological correlative studies in humans have further shown that alterations in the motor associated CSPTC loops offer an anatomical explanation for the common movement disorders (DeLong and Wichmann, 2007; e.g., Vitek and Giroux, 2000). In recent years, functional brain imaging techniques have provided further insights into the organization and activity of CSPTC circuitry in health and disease. Indeed, the ability to probe the integrity of the different circuits and examine the discrete changes in functional connectivity associated with specific disease manifestations has broadened knowledge of the pathophysiology of the movement disorders. Moreover, network modeling tools have opened new pathways for the development of quantitative biomarkers of disease progression and the response to therapy. In this review, we will focus on recent advances in the characterization and use of large-scale rest-state networks in the study of Parkinson’s disease (PD) and dystonia, two of the most common movement disorders.
Fig. 1.

Basal ganglia-thalamocortical circuits as proposed by Alexander et al. in 1986. Abbreviations: ACA, anterior cingulate area; APA, arcuate premotor area; CAUD, caudate nucleus (b) body (h) head; DLC, dorsolateral prefrontal cortex; EC, entorhinal cortex; FEF, frontal eye fields; GPi, internal segment of globus pallidus; HC, hippocampal cortex; ITG, inferior temporal gyrus; LOF, lateral orbitofrontal cortex; MC; motor cortex; MDpl, medialis dorsalis pars paralamellaris; MDmc, medialis dorsalis pars magnocellularis; MDpc, medialis dorsalis pars parvocellularisl PPC, posterior parietal cortex; PUT, putamen; SC, somatosensory cortex; SMA, supplementary motor area; SNr, substantia nigra pars reticulata; STG, superior temporal gyrus; VAmc, ventralis anterior pars magnocellularis; VApc, ventralis anterior pars parvocellularis; VLm, ventralis lateralis pars medialis; VLo, ventralis lateralis pars oralis; VP, ventral pallidum; VS, ventral striatum; cl-, caudolateral; cdm-, cudal dorsomedial; dl-, dorsolateral; l-, lateral; ldm-, lateral dorsomedial; m-, medial; mdm-, medial dorsomedial; pm, posteromedial; rd-, rostrodorsal; rl-, rostrolateral; rm-, rostromedial; vm-, ventromedial; vl-, ventrolateral. Modified from Alexander et al. (1986).
Parkinson’s disease
Network correlates of motor signs and symptoms in Parkinson’s disease
For decades rest-state functional imaging studies of cerebral blood flow and glucose metabolism have been performed to localize and quantify regional abnormalities associated with neurodegenerative disease. Regional approaches such as group comparisons based upon prespecified volumes-of-interest (VOIs) or data-driven mass univariate methods have proven helpful in delineating characteristic local abnormalities in certain of these disorders (see e.g., Eckert et al., 2005). However, given renewed interest in the quantification of regional glucose utilization as an index of local synaptic activity (Attwell and Iadecola, 2002; Heeger and Ress, 2002; Vaishnavi et al., 2010), rest-state metabolic imaging techniques such as 18F-fluoro-deoxyglucose (FDG) positron emission tomography (PET) have been found to be of value in the identification of specific spatial covariance patterns associated with brain disease (see e.g., Alexander and Moeller, 1994; Eidelberg, 2009; Habeck and Stern, 2010). This network mapping technique is based on the Scaled Subprofile Model (SSM), a double centered principal components analysis (PCA) of data that incorporates eigenvalue-based multivariate methods to identify significant spatial covariance patterns in combined samples of patient and control scans (Spetsieris and Eidelberg, 2011). The algorithm itself is used to isolate linearly independent (orthogonal) sources of variability in the data. Principal component patterns that discriminate between the two groups (i.e. patient and control) are referred to as being “disease-related” (see Spetsieris and Eidelberg, 2011 for the criteria used for pattern selection). Moreover, once a disease-related pattern has been identified, quantitative measures of pattern expression in individual subjects (i.e., scalars, or “subject scores”) can be computed on an individual scan basis. Over the past two decades this approach to network analysis has been applied extensively to resting state imaging data from patients with a variety of brain disorders and has revealed characteristic metabolic topographies in Parkinson’s disease (Eidelberg, 2009; Ma et al., 2007), atypical parkinsonian syndromes (Eckert et al., 2008), Huntington’s disease (Eidelberg and Surmeier, 2011; Feigin et al., 2007b), primary torsion dystonia (Asanuma et al., 2005; Carbon and Eidelberg, 2009; Trost et al., 2002), Tourette syndrome (Pourfar et al., 2011), and Alzheimer’s disease (Habeck and Stern, 2010; Habeck et al., 2008).
PD is the second most common neurodegenerative disorder in the aging population and is characterized by progressive motor features, such as bradykinesia, rigidity, and resting tremor, as well as non-motor features, such as executive cognitive decline, anxiety, and depression. Neuronal degeneration within the nigrostriatal pathway leads to the primary PD motor symptoms; however, the pathologic findings at autopsy are more extensive and widely distributed throughout the brainstem, basal ganglia, and frontal and parietal cortexes. Functional imaging is used to probe these whole brain changes in vivo and it has long been appreciated that PD patients exhibit altered subcortical and cortical metabolic activity, often at the earliest clinical stages of the disease (Eidelberg et al., 1994, 1995b; Huang et al., 2007b; Tang et al., 2010). Further application of network analysis has identified several distinct PD-related spatial covariance patterns relating to the major clinical manifestations of the illness (Eidelberg, 2009; Poston and Eidelberg, 2009). For each pattern prospectively computed individual subject scores are found to be elevated in PD patients relative to healthy control subjects (Ma et al., 2007), however the various metabolic networks exhibit specific relationships with the underlying clinical symptomatology. For instance, the PD-related spatial covariance pattern (PDRP) has been consistently associated with the major akinetic-rigid motor signs of the disease. This pattern is characterized by increases in pallido-thalamic and pontine metabolic activity and relative reductions in premotor cortex, supplementary motor area (SMA), and in parietal association regions (Fig. 2). Indeed, PDRP expression has been shown consistently to correlate with United Parkinson’s disease Rating Scale (UPDRS) ratings for akinesia and rigidity rather than tremor (Asanuma et al., 2006; Eidelberg et al., 1994, 1995a; Feigin et al., 2002; Lozza et al., 2004) and has been used as an objective descriptor of motoric progression in individual patients (Huang et al., 2007b; Tang et al., 2010). The specific relationship between PDRP expression and the akinetic-rigid manifestations of the disease suggests that this abnormal metabolic topography develops as a consequence of nigrostriatal dopaminergic attrition and the ensuing functional abnormalities in the motor CSPTC loop and related neural pathways. Indeed, a homologous metabolic covariance pattern has recently been reported in an experimental primate model in which akinesia and rigidity were induced through the systemic administration of 1-methyl-4-phenyl-1,2,3,6-tetrahydropyridine (MPTP) (Ma et al., 2010, 2011; Peng et al., 2010). That said, it is important to note that pairwise correlations between progressive deterioration in clinical motor ratings, decline in putamen dopamine transporter (DAT) binding (a measure of presynaptic nigrostriatal dopaminergic tone), and longitudinal increases in PDRP expression are of modest size (R2~30–40%) and therefore cannot be regarded as interchangeable (Eckert et al., 2007; Huang et al., 2007b). Moreover, the finding of elevated PDRP expression in the asymptomatic cerebral hemispheres of early stage patients with unilateral symptoms (hemi-PD) (Tang et al., 2010) and the significant correlation between this measure and individual differences in intraoperatively recorded subthalamic nucleus (STN) firing rates, independent of motor disability (Lin et al., 2008), indicates that this network represents more than an imaging proxy of clinical parkinsonism.
Fig. 2.
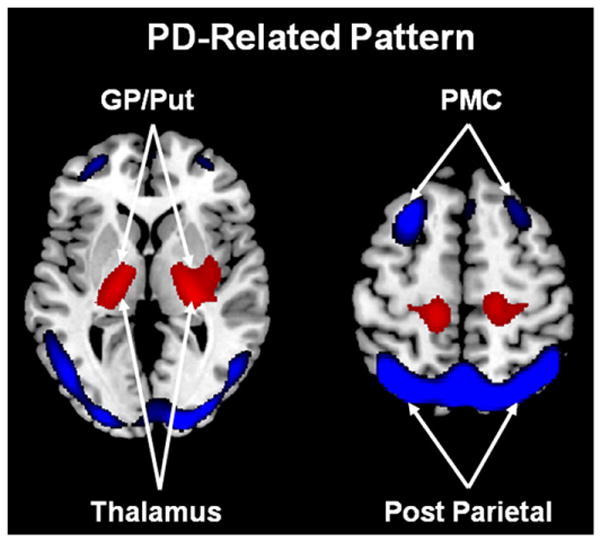
Abnormal metabolic motor networks in Parkinson’s disease. The PD-related motor pattern (PDRP) identified by spatial covariance analysis of FDG PET scans from 33 PD patients and 33 age-matched normal volunteer subjects. This pattern is characterized by relative hypermetabolism (red) in the globus pallidus/putamen (GP/Put), thalamus, pons, cerebellum, and sensorimotor cortex, associated with metabolic decreases (blue) in the lateral premotor cortex (PMC) and parieto-occipital association regions (Ma et al., 2007). Representative slices of the covariance map were overlaid on a standard MRI brain template.
From Eidelberg (2009) Fig. 1A.
Spatial covariance analysis of metabolic imaging data from PD patients has also provided insights into the abnormal networks that mediate the other clinical manifestations of the disorder. For instance, parkinsonian tremor has recently been found to be associated with a discrete spatial covariance pattern, independent of the PDRP topography (Antonini et al., 1998; Mure et al., 2011). The PD tremor-related metabolic pattern (PDTP) was identified using a novel within-subject supervised PCA algorithm (termed Ordinal Trends Canonical Variates Analysis, or OrT/CVA) in which pairs of metabolic scans from each subject were assessed for the presence of pattern exhibiting a monotonic (ordinal) trend across experimental conditions (Habeck et al., 2005; Moeller and Habeck, 2006). In this study, a PDTP network was identified by applying this approach to FDG PET scans acquired on and off ventrointermedial (Vim) thalamic deep brain stimulation (DBS) for severe parkinsonian tremor. The pattern itself was characterized by increased metabolic activity in the cerebellum and dorsal pons, the primary motor cortex, and to a lesser degree in the caudate and putamen (Fig. 3). Indeed, PDTP scores were found to correlate with tremor severity, but not with concurrent clinical ratings for akinesia and rigidity (Mure et al., 2011). Interestingly, Vim DBS, which primarily treats tremor rather than akinesia or rigidity, was associated with treatment-mediated reductions in PDTP scores but did not alter PDRP expression. Overall, these data suggest that while the akinetic-rigid manifestations of PD are likely associated with dysfunction of the CSPTC motor circuits, tremor generation in PD is more intimately linked to discrete functional changes in cerebello-thalamo-cortical (CbTC) pathways (Timmermann et al., 2003; Volkmann et al., 1996).
Fig. 3.
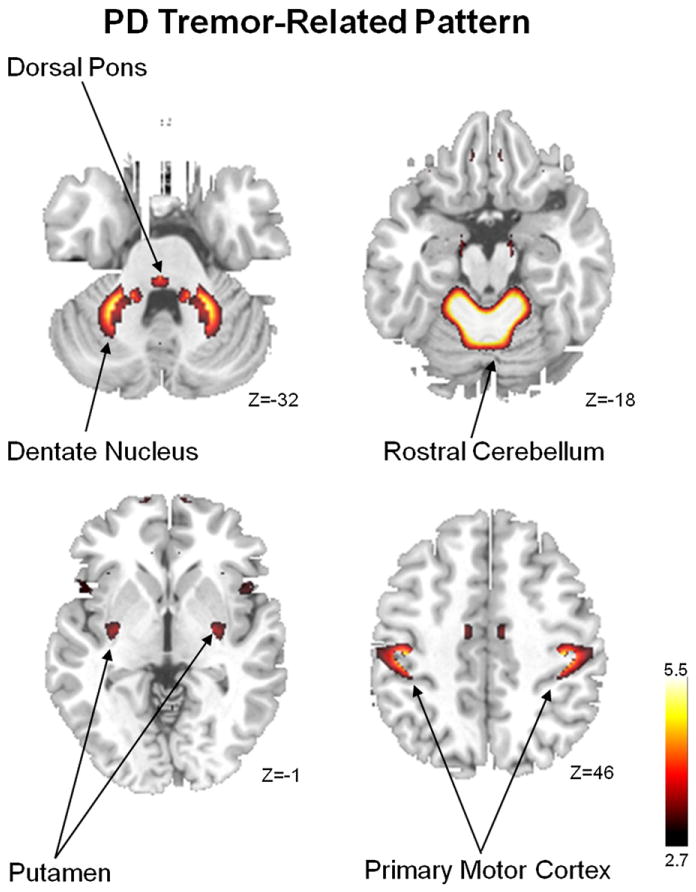
Abnormal metabolic motor network in Parkinson’s disease. The PD-related tremor pattern (PDTP) identified by supervised principal components analysis (PCA) (Habeck and Stern, 2010) of FDG PET scans from nine tremor-predominant PD patients scanned at baseline and during high-frequency deep brain stimulation (DBS) of the ventral-intermediate (Vim) thalamic nucleus. This pattern is characterized by relative hypermetabolism of sensorimotor cortex (SMC), cerebellum, pons, and putamen (Mure et al., 2011). Representative slices of the covariance map were overlaid on a standard MRI brain template.
From Mure et al. (2011) Fig. 1A.
Altered connectivity within motor circuits
Functional MRI (fMRI) studies investigating brain activation in PD patients during self-initiated movements have found evidence of reduced neural responses in the rostral SMA (pre-SMA), along with concomitant increases in the lateral premotor cortex and parietal cortex (Sabatini et al., 2000; Wu and Hallett, 2005; Wu et al., 2010). Indeed, off-medication reductions in activation responses in the SMA complex have been noted to improve with levodopa administration (Buhmann et al., 2003; Haslinger et al., 2001) as well as STN stimulation (Grafton et al., 2006). More recently, fMRI has been used to investigate the alterations in effective connectivity between the SMA and other CSPTC nodes in PD patients. Wu et al. found that early PD patients studied off-medication exhibited increased effective connectivity between the pre-SMA, the primary motor and premotor regions, and the cerebellum, as well as diminished connectivity between the putamen, and cortical motor regions (including SMA) and the cerebellum (Wu et al., 2011b). Interestingly, these patients had similar task performance to the matched control group, suggesting that the increases in connectivity that were observed were compensatory in nature.
In contrast to task-based fMRI studies, resting state fMRI (rs-fMRI) has been used to examine connectivity between spatially independent brain regions while subjects are at rest (Biswal et al., 1995; Helmich et al., 2010). Using this technique, functionally related groups of cortical and subcortical regions can be studied as plausible networks corresponding to critical brain functions (Fox and Raichle, 2007; Greicius et al., 2004; Seeley et al., 2007). The details of rs-fMRI are discussed elsewhere (Fox and Greicius, 2010). These networks are derived at the single subject level and contrast with the previously described disease-related metabolic brain networks that are derived from combined patient and control group data, which are then prospectively applied to scans from individual subjects. While this technique has been more broadly used in neuropsychiatric disorders, several studies have applied the method to study functional connectivity of the basal ganglia in PD patients. Using a multiple regression approach, Helmich et al. used rs-fMRI to study striatal connectivity in mild to moderate PD patients scanned off-medications (Helmich et al., 2010). Using three striatal seed regions, they demonstrated connectivity differences between PD patients and controls in the posterior putamen with reduced coupling between this region and the inferior parietal cortex. By contrast, coupling between the anterior putamen, the pre-SMA, and the anterior cingulate cortex as well as coupling between the caudate nucleus and the dorsal prefrontal cortex did not differ for PD patients and controls. They concluded that segregated networks within the putamen might account for the abnormal sensorimotor integration seen in PD patients. In other functional connectivity studies, the striatum was divided into six different seed regions associated with distinct motor, cognitive, and reward CSPTC networks (Di Martino et al., 2008; Kwak et al., 2010). Off-medications, PD patients exhibited abnormal increases in functional connectivity in the sensorimotor circuit linking the dorsal caudal putamen, inferior temporal gyrus, anterior cingulate cortex, and the superior frontal gyrus. Interestingly, these changes were found to decrease or normalize when the patients were studied on dopaminergic medication. However, in contrast to the earlier studies (Helmich et al., 2010; Wu et al., 2011a), no striatal regions with reduced connectivity were evident in the off-medication state.
Using a network model based on graph theory, rather than a seed-based analysis, Wu et al. found that the pattern of functional connectivity in PD patients off-medication was altered compared to controls with decreased connectivity in the SMA, left DLPFC, and left putamen, and increased connectivity in the left cerebellum, left M1, and left parietal cortex, and that these abnormalities were normalized after levodopa administration (Wu et al., 2009b). They additionally found that UPDRS motor ratings were negatively correlated with functional connectivity in the SMA, bilateral putamen, left thalamus, and bilateral DLPFC, and positively correlated with functional connectivity in bilateral M1, bilateral cerebellum, bilateral PMA, and left parietal cortex. Of note, several recent studies have focused on the hyperdirect CSPTC pathway (cortex-STN-GPi/substantia nigra pars reticulata–thalamus–cortex) by placing seed regions in the STN, a region known to exhibit increased power in the beta (13–35 Hz) frequency during local field potential recordings in PD patients undergoing STN DBS (Brown et al., 2001; Cassidy et al., 2002; Priori et al., 2004). It has been hypothesized that increased oscillatory activity between the STN, other basal ganglia, and cortical regions is pathologically associated with PD motor symptoms (Bronte-Stewart et al., 2009). In this vein, Baudrexel et al. found increased functional connectivity between the STN and cortical motor regions in rs-fMRI scans from PD patients with and without resting tremor (Baudrexel et al., 2011). Interestingly, only atremulous PD patients exhibited significant connectivity increases in circuits linking the STN and SMA suggesting that abnormalities in this hyperdirect pathway are specifically related to bradykinesia and rigidity rather than tremor.
As previously discussed, the pathophysiology underlying PD tremor is likely distinct from bradykinesia and rigidity, (Fukuda et al., 2004; Timmermann et al., 2003) and involves dysfunction of the CbTC pathways. However, the exact role of the cerebellum, basal ganglia, and thalamus in tremor production and modulation is still relatively unknown. To address these questions, Helmich and colleagues used rs-fMRI with concurrent electromyographic recordings to measure tremor-related activity in the basal ganglia and CbTC circuits in PD patients with and without tremor (Helmich et al., 2011). In PD patients with tremor they found that activity within the cerebellar pathways co-fluctuated with tremor amplitude (Fig. 4), while the putamen and globus pallidus interna (GPi) exhibited increased functional connectivity with the motor cortex. While they found activity in the motor cortex correlated with tremor amplitude, activity in the GPi and putamen was found to correlate with the onset of tremor episodes. Based on these findings, the authors suggest that transient increases in coupling between the dopamine-deplete basal ganglia and motor cortex trigger tremor-related oscillations within the CbTC circuit. Moreover, in accord with the metabolic network studies described above (Mure et al., 2011), the functional circuits subserving parkinsonian bradykinesia and tremor are likely to intersect at the level of the primary motor cortex (Fig. 5).
Fig. 4.
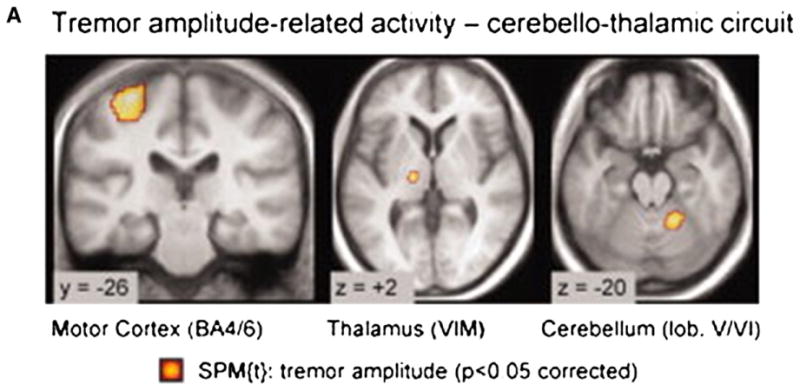
Tremor-related cerebral activity in tremor-dominant Parkinson disease (PD). Cerebral regions where activity cofluctuated with left sided tremor amplitude (Statistical Parametric Mapping [SPM] t-contrast on the electromyographic (EMG) amplitude regressor in 19 tremor-dominant patients). Activity was localized to the motor cortex (MC), ventral intermediate nucleus of the thalamus, and cerebellum. They found motor cortex activity correlated with tremor amplitude. Conversely, GPi activity correlated with changes in tremor amplitude.
From Helmich et al. (2011) Fig. 1A, p272.
Fig. 5.
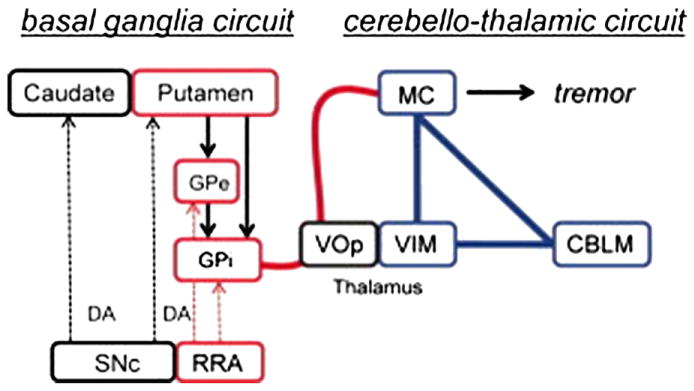
A model of cerebral mechanisms underlying Parkinson disease (PD) resting tremor proposed by Helmich et al. (2011). The authors propose that PD resting tremor emerges from the ventral intermediate nucleus of the thalamus (VIM)–motor cortex (MC)–cerebellum (CBLM) circuit (shown in blue), when triggered by transient pathological signals from the basal ganglia motor loop (shown in red). In tremor-dominant PD, the basal ganglia (globus pallidus internus [GPi], globus pallidus externus [GPe], and putamen) have increased connectivity with the VIM–MC–CBLM circuit through the MC (thick red line), and the basal ganglia are activated at critical time points in the tremor cycle. VOp = thalamic ventralis oralis posterior nucleus. DA = dopamine; SNc = substantia nigra pas compacta.
From Helmich et al. (2011) Fig. 4.
While minor discrepancies between rs-fMRI studies could be accounted for by difference in field strength and analysis technique, these initial investigations provide proof-of-principle that this technique is a powerful tool to probe altered connectivity of CSPTC and related circuits in PD patients. Further, the regional patterns of altered connectivity are strikingly similar to those described in the rest-state using metabolic imaging and spatial covariance analysis (Asanuma et al., 2006; Lin et al., 2008; Ma et al., 2007). Indeed, PDRP-like network topographies have recently been identified using advanced rs-fMRI methods (Skidmore et al., 2011; Wu et al., 2009a), although future multi-modal imaging studies with concurrent rs-fMRI and FDG PET are necessary to determine the meaning of the overlapping functional changes identified with the two approaches. Overall, the findings confirm that PD patients exhibit abnormal functional connectivity in motor-associated basal ganglia-cortical networks, which can be modulated by effective antiparkinsonian interventions such as dopamine replacement and STN stimulation (Asanuma et al., 2006). Further studies exploring the clinical correlations of abnormal functional connectivity in PD patients could impact the development of new therapies based upon network modulation (e.g., Feigin et al., 2007a; Lewitt et al., 2011).
Network correlates of cognitive dysfunction in Parkinson’s disease
In addition to motor symptoms, cognitive dysfunction eventually occurs in the majority of PD patients, leading to increased disability and risk of mortality (Hely et al., 2008; Levy et al., 2002). The underlying pathological substrate for these abnormalities remains controversial (Caballol et al., 2007; Emre, 2003). Metabolic imaging with spatial covariance analysis has provided valuable insights into the network-related functional changes associated with some of the cognitive manifestations of PD. Huang et al. utilized a regression approach in conjunction with PCA to identify a topographically unique metabolic pattern related to executive functioning in non-demented PD patients (Huang et al., 2007a). This PD-related cognitive pattern (PDCP) is characterized by metabolic reductions involving the pre-SMA, prefrontal cortex, precuneus, and parietal association regions, with covarying increases in the cerebellar vermis and dentate nuclei (Fig. 6). In non-demented PD patients, PDCP expression has been shown to correlate with subject performance on tests of executive function including the California Verbal Learning Test, Trails Making Test B, and the Stroop Color Test (Eidelberg, 2009; Huang et al., 2007a). In keeping with the fact that PD cognitive dysfunction occurs later than motor manifestations, the rate of PDCP progression was found to be slower than for the PDRP, with abnormal levels of network activity discerned only 4–6 years following clinical diagnosis (Huang et al., 2007b; Tang et al., 2010). Indeed, a cross-sectional analysis of network values from over 100 subjects revealed a significant correlation between PDCP elevations and cognitive dysfunction in PD patients ranging from those with intact performance to those with actual dementia (Eidelberg, 2009; Huang et al., 2008; Poston et al., 2009).
Fig. 6.
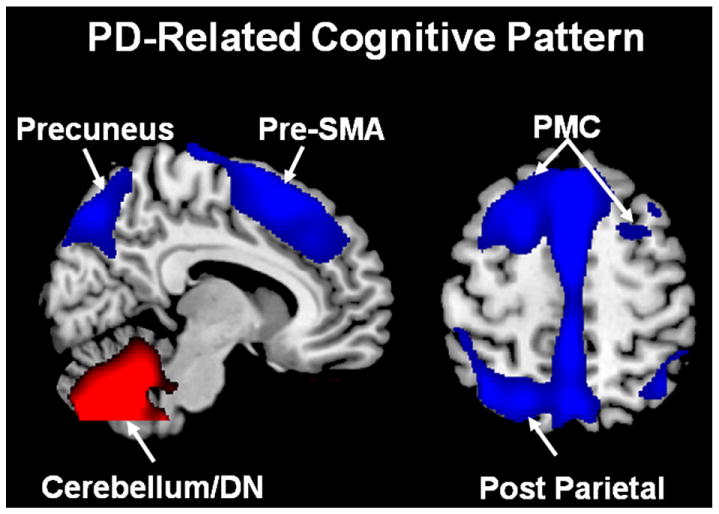
Abnormal metabolic cognitive network in Parkinson’s disease. The PD-related cognitive pattern (PDCP) identified by spatial covariance analysis of FDG PET scans from 15 non-demented PD patients with mild-to-moderate motor symptoms. This pattern is characterized by relative hypometabolism (blue) in the rostral supplementary motor area (pre-SMA), precuneus, premotor cortex (PMC), posterior parietal and prefrontal regions, associated with metabolic increases (red) in the cerebellar/dentate nucleus (DN) (Huang et al., 2007a). Representative slices of the covariance map were overlaid on a standard MRI brain template.
From Eidelberg (2009) Fig. 2A.
Network analysis of metabolic imaging data has also provided unique information concerning the relationship between cognitive performance in PD patients and striatal dopamine loss. Clinical studies have shown that dopamine treatment reliably improves the cardinal motor symptoms in PD, but cognitive symptoms are generally not improved. However, more detailed testing has revealed that dopamine treatment may lead to cognitive enhancement or deterioration depending on the cognitive demand imposed by the task, as well as intrinsic subject factors such as baseline performance capacity, dopaminergic tone, and catechol-O-methyltransferase (COMT) polymorphisms (Argyelan et al., 2008; Carbon et al., 2004b; Cools, 2006; Lewis et al., 2005).
In accordance with clinical findings, Huang et al. found that, unlike the PDRP and PDTP networks, mean PDCP expression was not consistently altered by treatment of motor symptoms with either levodopa or STN stimulation (Huang et al., 2007a). Nonetheless, Mattis et al. subsequently found that levodopa-mediated changes in verbal learning in PD patients correlated with concurrent modulation of PDCP (and not PDRP) network activity, a finding not seen in the cognitive response to placebo treatment (Mattis et al., 2011). Of note, the cognitive response to levodopa in individual PD patients was predicted by the level of PDCP expression present at baseline. Thus, while the cortical–subcortical pathways underlying cognitive dysfunction are independent of those mediating the cardinal motor features of PD (Eidelberg, 2009; Huang et al., 2007a) certain cognitive networks may indeed be modulated by dopamine. In this regard, in a recent report of 20 PD patients studied with both FDG PET (PDRP/PDCP quantification) and FPCIT PET (caudate/putamen DAT binding), PDCP scores were found to correlate significantly with dopaminergic input to the caudate nucleus, and not the putamen (Tang et al., 2011). In aggregate, these findings suggest that rest-state network assessments can provide robust, objective outcome measures for evaluating novel interventions directed at the cognitive manifestations of PD and related disorders.
Several investigators have also used task-based functional imaging to study cortical–subcortical network connectivity associated with cognitive performance in PD. Event-related fMRI with tasks of executive function, such as the Montreal Card Sorting Task, is one method of investigating abnormal activation patterns in PD cognitive dysfunction. Using this approach, van Eimeren et al. identified deactivation regions associated with task performance in non-demented PD patients and found that medial prefrontal cortex deactivated similarly in controls and in patients (van Eimeren et al., 2009). By contrast, PD patients exhibited reduced deactivation of the posterior cingulate and precuneus, regions associated with reduced deactivation responses in patients with Alzheimer’s disease (Greicius et al., 2004). Argyelan et al. used 15O-labeled water and PET to measure cerebral blood flow while patients performed a motor sequence learning task on and off levodopa infusion (Argyelan et al., 2008). They showed that learning-related deactivation in the medial prefrontal cortex was modulated by dopaminergic medication, perhaps through the anterior cingulate cortex. Moreover, at the individual subject level, this functional effect was influenced by baseline performance as well as the COMT val158met polymorphism (Hoogland et al., 2010). More extensive connectivity studies, particularly combined resting state and task-based functional mapping, are needed to determine whether reduced deactivation of posterior cingulate cortex and related brain networks are in fact responsible for cognitive dysfunction in PD patients.
Preclinical network changes
Clinico-pathologic studies have shown that neuronal death in PD begins years prior to symptom onset so that by the time patients present with motor symptoms, less than 50% of the neurons in the substantia nigra are functional (Bernheimer et al., 1973). To explain for the time delay between pathologic onset and clinical symptoms, many investigators have postulated that neuronal decline in the substantia nigra is accompanied by compensatory changes in connectivity within the CSPTC circuits (Palmer et al., 2010). Compensatory changes leading to altered connectivity can occur at the synaptic level or at the systems level, and can include increased recruitment of existing neuronal connections, increased spatial extent of activation, recruitment of novel neuronal populations, and altered connectivity patterns (Appel-Cresswell et al., 2010). To investigate changes in connectivity associated with PD symptom onset Tang et al. assessed the longitudinal changes in rest-state abnormal metabolic patterns in early hemi-parkinsonian patients, focusing on the “pre-symptomatic” hemisphere, i.e., that situated ipsilaterally to the initially involved body side (Tang et al., 2010). They found that at the network level, PDRP and PDCP expression increased symmetrically in both the symptomatic and pre-symptomatic hemispheres over 6 years. While PDRP scores were elevated initially on both sides, significant increases in PDCP expression were not evident on either side until 4–6 years after diagnosis. At the regional level, putamen metabolism contralateral to the initially affected body side was elevated at all three time points, possibly as a functional response to nigrostriatal dopamine depletion beyond a specific threshold (Bezard et al., 2003). By contrast, in the initially pre-symptomatic hemisphere, putamen metabolic activity increased steadily over time, reaching abnormal levels only at 4 years, correlating with the onset of Parkinsonism on the initially asymptomatic side. This study suggests that the early development of disease-related network activity likely coincides with the progressive disruption of normal brain connectivity, likely beginning several years before symptom onset (Moeller and Eidelberg, 1997; Tang et al., 2008).
Dystonia
Rest-state networks in primary dystonia
Primary dystonia is a hyperkinetic movement disorder that typically begins in late childhood or adolescence and is traditionally attributed to basal ganglia dysfunction (Bressman, 2004). No specific pathological lesions of these structures have been consistently demonstrated in post-mortem studies (Standaert, 2011). The two most common and best studied genetic forms of primary dystonia are DYT1 and DYT6, which are inherited as autosomal dominant traits with incomplete penetrance (Risch et al., 2007; Saunders-Pullman et al., 2007). Thus imaging studies of manifesting and non-manifesting gene carriers have offered the possibility of identifying alterations in circuit connectivity associated with both genotype and penetrance (Carbon et al., 2004c; Niethammer et al., 2011). Spatial covariance mapping of rest-state metabolic imaging data revealed a characteristic functional topography in sporadic primary dystonia patients, which was subsequently validated in genetic and sporadic forms of the disorder (Eidelberg et al., 1995b, 1998; Hutchinson et al., 2000; Trost et al., 2002). This torsion dystonia-related pattern (TDRP) is characterized by relative increases in the metabolic activity of the posterior putamen, globus pallidus, cerebellum, and the SMA. Both manifesting and non-manifesting carriers of dystonia mutations, as well as individuals with sporadic focal dystonia, have been found to exhibit elevations in the expression of this pattern. Interestingly, another spatial covariance pattern has been identified in association with clinical symptoms of the disorder (Carbon and Eidelberg, 2009). This symptom-related pattern is characterized by metabolic increases in the pre-SMA and parietal association cortex as well as covarying decreases in the cerebellum, brainstem and ventral thalamus. Indeed, subject scores for this pattern were found to distinguish manifesting from non-manifesting carriers of the DYT1 or DYT6 mutations. The discrepancy between the genotypic and manifestation-related topographies suggested that discrete changes in pathway connectivity mediate clinical penetrance in carriers of genetic mutations for this disorder.
Altered connectivity: relationship to clinical penetrance in hereditary dystonia
Patients with both DYT1 and DYT6 typically develop symptoms during late childhood and early adolescence, suggesting a neurodevelopmental etiology, possibly involving sensorimotor pathways (Barnea-Goraly et al., 2005; Gogtay et al., 2004; Paus, 2005). Magnetic resonance diffusion tensor imaging (DTI) studies have shown reduced fractional anisotropy (FA) in white matter regions subjacent to the sensorimotor cortex and in the dorsal pons (Carbon et al., 2004a, 2004c, 2008; Delmaire et al., 2009). Argyelan et al. used higher field DTI with probabilistic tractography to contrast CbTC pathway integrity in manifesting and non-manifesting dystonia mutation carriers (Argyelan et al., 2009). They found reduced connectivity (tract integrity) in cerebellar projections to the ventral thalamus in both manifesting and non-manifesting carriers. Moreover, they found that non-manifesting carriers were distinguished by a second area of reduced tract integrity, occurring distally along the thalamo-cortical segment of the CbTC pathway. These findings suggested a compelling two lesion model for the manifestation of clinical dystonia in mutation carriers. Specifically, the clinical manifestations are predicted to develop when the distal segment of the CbTC pathway is relatively intact (normal connectivity), thereby allowing abnormal cerebellar outflow signals access to the sensorimotor cortex. By contrast, in non-manifesting carriers, reduced connectivity in the distal segment blocks entrance of the aberrant ascending signals to the sensorimotor cortex, thus preventing the development of clinical manifestations. Interestingly, a Monte Carlo simulation based upon this probabilistic model predicted a clinical penetrance rate of approximately 32% (Argyelan et al., 2009), which accorded well with the results of epidemiologic studies (Risch et al., 2007). Perhaps more compelling is evidence from genetic models of dystonia, which are molecularly identical to the scenario observed in human gene carriers (Goodchild et al., 2005). Consistent with the non-penetrant status of the animals, high-field DTI of DYT1 knock-in, but non-manifesting mice revealed reductions in CbTC tract numbers involving both the proximal and distal segments of the pathway (Ulug et al., 2011). In addition, metabolic activity in the sensorimotor cortex of the knock-in mice correlated closely with individual measures of CbTC pathway integrity. In aggregate, the imaging findings suggest a possible mechanism by which abnormal CbTC connectivity mediates the clinical manifestations of primary dystonia. Strategies to modulate activity in the relatively intact distal segment of the CbTC tract in dystonia patients may provide the basis for new therapies for this disorder.
Conclusions
Imaging techniques such as FDG PET and fMRI have indeed proven to be powerful tools for investigating abnormal CSPCT and CbTC circuits in movement disorders. Understanding altered connectivity associated with specific symptoms can help guide therapeutic strategies, such as deep brain stimulation, in both PD and dystonia. Future studies will include application of these techniques to early patients and healthy individuals at risk to assess the role of FDG PET and fMRI as biomarkers for diagnosis and disease progression in movement disorders.
Acknowledgments
This work was supported by the National Institutes of Health [NINDS P50 NS 071675 to D.E.]. The authors wish to thank Ms. Toni Fitzpatrick for her valuable assistance with copyediting.
Abbreviations
- CSPTC
Cortico-striato-pallidothalamocortical
- VOIs
volumes-of-interest
- FDG
18F-fluorodeoxyglucose
- PET
positron emission tomography
- PCA
principal components analysis
- SMA
supplementary motor area
- UPDRS
United Parkinson’s disease Rating Scale
- PDRP
Parkinson’s disease-related spatial covariance pattern
- PDTP
PD tremor-related metabolic pattern
- OrT/CVA
Ordinal Trends Canonical Variates Analysis
- Vim
ventrointermedial
- DBS
deep brain stimulation
- CbTC
cerebello-thalamo-cortical pathways
- fMRI
Functional MRI
- rs-fMRI
resting state fMRI
- STN
subthalamic nucleus
- GPi
globus pallidus interna
- PDCP
PD-related cognitive pattern
- DTI
diffusion tensor imaging
- FA
fractional anisotropy
References
- Alexander GE, Moeller JR. Application of the scaled subprofile model to functional imaging in neuropsychiatric disorders: a principal component approach to modeling brain function in disease. Hum Brain Mapp. 1994;2:1–16. [Google Scholar]
- Alexander GE, DeLong MR, Strick PL. Parallel organization of functionally segregated circuits linking basal ganglia and cortex. Annu Rev Neurosci. 1986;9:357–381. doi: 10.1146/annurev.ne.09.030186.002041. [DOI] [PubMed] [Google Scholar]
- Antonini A, Moeller JR, Nakamura T, Spetsieris P, Dhawan V, Eidelberg D. The metabolic anatomy of tremor in Parkinson’s disease. Neurology. 1998;51:803–810. doi: 10.1212/wnl.51.3.803. [DOI] [PubMed] [Google Scholar]
- Appel-Cresswell S, de la Fuente-Fernandez R, Galley S, McKeown MJ. Imaging of compensatory mechanisms in Parkinson’s disease. Curr Opin Neurol. 2010;23:407–412. doi: 10.1097/WCO.0b013e32833b6019. [DOI] [PubMed] [Google Scholar]
- Argyelan M, Carbon M, Ghilardi MF, Feigin A, Mattis P, Tang C, Dhawan V, Eidelberg D. Dopaminergic suppression of brain deactivation responses during sequence learning. J Neurosci. 2008;28:10687–10695. doi: 10.1523/JNEUROSCI.2933-08.2008. [DOI] [PMC free article] [PubMed] [Google Scholar]
- Argyelan M, Carbon M, Niethammer M, Ulug AM, Voss HU, Bressman SB, Dhawan V, Eidelberg D. Cerebellothalamocortical connectivity regulates penetrance in dystonia. J Neurosci. 2009;29:9740–9747. doi: 10.1523/JNEUROSCI.2300-09.2009. [DOI] [PMC free article] [PubMed] [Google Scholar]
- Asanuma K, Ma Y, Huang C, Carbon-Correll M, Edwards C, Raymond D, Bressman SB, Moeller JR, Eidelberg D. The metabolic pathology of doparesponsive dystonia. Ann Neurol. 2005;57:596–600. doi: 10.1002/ana.20442. [DOI] [PubMed] [Google Scholar]
- Asanuma K, Tang C, Ma Y, Dhawan V, Mattis P, Edwards C, Kaplitt MG, Feigin A, Eidelberg D. Network modulation in the treatment of Parkinson’s disease. Brain. 2006;129:2667–2678. doi: 10.1093/brain/awl162. [DOI] [PMC free article] [PubMed] [Google Scholar]
- Attwell D, Iadecola C. The neural basis of functional brain imaging signals. Trends Neurosci. 2002;25:621–625. doi: 10.1016/s0166-2236(02)02264-6. [DOI] [PubMed] [Google Scholar]
- Barnea-Goraly N, Menon V, Eckert M, Tamm L, Bammer R, Karchemskiy A, Dant CC, Reiss AL. White matter development during childhood and adolescence: a cross-sectional diffusion tensor imaging study. Cereb Cortex. 2005;15:1848–1854. doi: 10.1093/cercor/bhi062. [DOI] [PubMed] [Google Scholar]
- Baudrexel S, Witte T, Seifried C, von Wegner F, Beissner F, Klein JC, Steinmetz H, Deichmann R, Roeper J, Hilker R. Resting state fMRI reveals increased sub-thalamic nucleus-motor cortex connectivity in Parkinson’s disease. Neuroimage. 2011;55:1728–1738. doi: 10.1016/j.neuroimage.2011.01.017. [DOI] [PubMed] [Google Scholar]
- Bergman H, Feingold A, Nini A, Raz A, Slovin H, Abeles M, Vaadia E. Physiological aspects of information processing in the basal ganglia of normal and parkinsonian primates. Trends Neurosci. 1998;21:32–38. doi: 10.1016/s0166-2236(97)01151-x. [DOI] [PubMed] [Google Scholar]
- Bernheimer H, Birkmayer W, Hornykiewicz O, Jellinger K, Seitelberger F. Brain dopamine and the syndromes of Parkinson and Huntington. Clinical, morphological and neurochemical correlations. J Neurol Sci. 1973;20:415–455. doi: 10.1016/0022-510x(73)90175-5. [DOI] [PubMed] [Google Scholar]
- Bezard E, Gross CE, Brotchie JM. Presymptomatic compensation in Parkinson’s disease is not dopamine-mediated. Trends Neurosci. 2003;26:215–221. doi: 10.1016/S0166-2236(03)00038-9. [DOI] [PubMed] [Google Scholar]
- Biswal B, Yetkin FZ, Haughton VM, Hyde JS. Functional connectivity in the motor cortex of resting human brain using echo-planar MRI. Magn Reson Med. 1995;34:537–541. doi: 10.1002/mrm.1910340409. [DOI] [PubMed] [Google Scholar]
- Bressman SB. Dystonia genotypes, phenotypes, and classification. Adv Neurol. 2004;94:101–107. [PubMed] [Google Scholar]
- Bronte-Stewart H, Barberini C, Koop MM, Hill BC, Henderson JM, Wingeier B. The STN beta-band profile in Parkinson’s disease is stationary and shows prolonged attenuation after deep brain stimulation. Exp Neurol. 2009;215:20–28. doi: 10.1016/j.expneurol.2008.09.008. [DOI] [PubMed] [Google Scholar]
- Brown P, Marsden J, Defebvre L, Cassim F, Mazzone P, Oliviero A, Altibrandi MG, Di Lazzaro V, Limousin-Dowsey P, Fraix V, Odin P, Pollak P. Intermuscular coherence in Parkinson’s disease: relationship to bradykinesia. Neuroreport. 2001;12:2577–2581. doi: 10.1097/00001756-200108080-00057. [DOI] [PubMed] [Google Scholar]
- Buhmann C, Glauche V, Sturenburg HJ, Oechsner M, Weiller C, Buchel C. Pharmacologically modulated fMRI—cortical responsiveness to levodopa in drug-naive hemiparkinsonian patients. Brain. 2003;126:451–461. doi: 10.1093/brain/awg033. [DOI] [PubMed] [Google Scholar]
- Caballol N, Martí MJ, Tolosa E. Cognitive dysfunction and dementia in Parkinson disease. Mov Disord. 2007;22:S358–S366. doi: 10.1002/mds.21677. [DOI] [PubMed] [Google Scholar]
- Carbon M, Eidelberg D. Abnormal structure–function relationships in hereditary dystonia. Neuroscience. 2009;164:220–229. doi: 10.1016/j.neuroscience.2008.12.041. [DOI] [PMC free article] [PubMed] [Google Scholar]
- Carbon M, Kingsley PB, Su S, Smith GS, Spetsieris P, Bressman S, Eidelberg D. Microstructural white matter changes in carriers of the DYT1 gene mutation. Ann Neurol. 2004a;56:283–286. doi: 10.1002/ana.20177. [DOI] [PubMed] [Google Scholar]
- Carbon M, Ma Y, Barnes A, Dhawan V, Chaly T, Ghilardi MF, Eidelberg D. Caudate nucleus: influence of dopaminergic input on sequence learning and brain activation in Parkinsonism. Neuroimage. 2004b;21:1497–1507. doi: 10.1016/j.neuroimage.2003.12.014. [DOI] [PubMed] [Google Scholar]
- Carbon M, Su S, Dhawan V, Raymond D, Bressman S, Eidelberg D. Regional metabolism in primary torsion dystonia: effects of penetrance and genotype. Neurology. 2004c;62:1384–1390. doi: 10.1212/01.wnl.0000120541.97467.fe. [DOI] [PubMed] [Google Scholar]
- Carbon M, Kingsley PB, Tang C, Bressman S, Eidelberg D. Microstructural white matter changes in primary torsion dystonia. Mov Disord. 2008;23:234–239. doi: 10.1002/mds.21806. [DOI] [PMC free article] [PubMed] [Google Scholar]
- Cassidy M, Mazzone P, Oliviero A, Insola A, Tonali P, Di Lazzaro V, Brown P. Movement-related changes in synchronization in the human basal ganglia. Brain. 2002;125:1235–1246. doi: 10.1093/brain/awf135. [DOI] [PubMed] [Google Scholar]
- Cools R. Dopaminergic modulation of cognitive function-implications for L-DOPA treatment in Parkinson’s disease. Neurosci Biobehav Rev. 2006;30:1–23. doi: 10.1016/j.neubiorev.2005.03.024. [DOI] [PubMed] [Google Scholar]
- Delmaire C, Vidailhet M, Wassermann D, Descoteaux M, Valabregue R, Bourdain F, Lenglet C, Sangla S, Terrier A, Deriche R, Lehericy S. Diffusion abnormalities in the primary sensorimotor pathways in writer’s cramp. Arch Neurol. 2009;66:502–508. doi: 10.1001/archneurol.2009.8. [DOI] [PubMed] [Google Scholar]
- DeLong MR, Wichmann T. Circuits and circuit disorders of the basal ganglia. Arch Neurol. 2007;64:20–24. doi: 10.1001/archneur.64.1.20. [DOI] [PubMed] [Google Scholar]
- Di Martino A, Scheres A, Margulies DS, Kelly AM, Uddin LQ, Shehzad Z, Biswal B, Walters JR, Castellanos FX, Milham MP. Functional connectivity of human striatum: a resting state FMRI study. Cereb Cortex. 2008;18:2735–2747. doi: 10.1093/cercor/bhn041. [DOI] [PubMed] [Google Scholar]
- Eckert T, Barnes A, Dhawan V, Frucht S, Gordon MF, Feigin AS, Eidelberg D. FDG PET in the differential diagnosis of parkinsonian disorders. Neuroimage. 2005;26:912–921. doi: 10.1016/j.neuroimage.2005.03.012. [DOI] [PubMed] [Google Scholar]
- Eckert T, Tang C, Eidelberg D. Assessment of the progression of Parkinson’s disease: a metabolic network approach. Lancet Neurol. 2007;6:926–932. doi: 10.1016/S1474-4422(07)70245-4. [DOI] [PMC free article] [PubMed] [Google Scholar]
- Eckert T, Tang C, Ma Y, Brown N, Lin T, Frucht S, Feigin A, Eidelberg D. Abnormal metabolic networks in atypical parkinsonism. Mov Disord. 2008;23:727–733. doi: 10.1002/mds.21933. [DOI] [PubMed] [Google Scholar]
- Eidelberg D. Metabolic brain networks in neurodegenerative disorders: a functional imaging approach. Trends Neurosci. 2009;32:548–557. doi: 10.1016/j.tins.2009.06.003. [DOI] [PMC free article] [PubMed] [Google Scholar]
- Eidelberg D, Surmeier DJ. Brain networks in Huntington disease. J Clin Invest. 2011;121:484–492. doi: 10.1172/JCI45646. [DOI] [PMC free article] [PubMed] [Google Scholar]
- Eidelberg D, Moeller JR, Dhawan V, Spetsieris P, Takikawa S, Ishikawa T, Chaly T, Robeson W, Margouleff D, Przedborski S, et al. The metabolic topography of parkinsonism. J Cereb Blood Flow Metab. 1994;14:783–801. doi: 10.1038/jcbfm.1994.99. [DOI] [PubMed] [Google Scholar]
- Eidelberg D, Moeller JR, Ishikawa T, Dhawan V, Spetsieris P, Chaly T, Robeson W, Dahl JR, Margouleff D. Assessment of disease severity in parkinsonism with fluorine-18-fluorodeoxyglucose and PET. J Nucl Med. 1995a;36:378–383. [PubMed] [Google Scholar]
- Eidelberg D, Moeller JR, Ishikawa T, Dhawan V, Spetsieris P, Przedborski S, Fahn S. The metabolic topography of idiopathic torsion dystonia. Brain. 1995b;118 (Pt. 6):1473–1484. doi: 10.1093/brain/118.6.1473. [DOI] [PubMed] [Google Scholar]
- Eidelberg D, Moeller JR, Antonini A, Kazumata K, Nakamura T, Dhawan V, Spetsieris P, deLeon D, Bressman SB, Fahn S. Functional brain networks in DYT1 dystonia. Ann Neurol. 1998;44:303–312. doi: 10.1002/ana.410440304. [DOI] [PubMed] [Google Scholar]
- Emre M. What causes mental dysfunction in Parkinson’s disease? Mov Disord. 2003;18:63–71. doi: 10.1002/mds.10565. [DOI] [PubMed] [Google Scholar]
- Feigin A, Antonini A, Fukuda M, De Notaris R, Benti R, Pezzoli G, Mentis MJ, Moeller JR, Eidelberg D. Tc-99m ethylene cysteinate dimer SPECT in the differential diagnosis of parkinsonism. Mov Disord. 2002;17:1265–1270. doi: 10.1002/mds.10270. [DOI] [PubMed] [Google Scholar]
- Feigin A, Kaplitt MG, Tang C, Lin T, Mattis P, Dhawan V, During MJ, Eidelberg D. Modulation of metabolic brain networks after subthalamic gene therapy for Parkinson’s disease. Proc Natl Acad Sci U S A. 2007a;104:19559–19564. doi: 10.1073/pnas.0706006104. [DOI] [PMC free article] [PubMed] [Google Scholar]
- Feigin A, Tang C, Ma Y, Mattis P, Zgaljardic D, Guttman M, Paulsen JS, Dhawan V, Eidelberg D. Thalamic metabolism and symptom onset in preclinical Huntington’s disease. Brain. 2007b;130:2858–2867. doi: 10.1093/brain/awm217. [DOI] [PMC free article] [PubMed] [Google Scholar]
- Fox MD, Greicius M. Clinical applications of resting state functional connectivity. Front Syst Neurosci. 2010;4:19. doi: 10.3389/fnsys.2010.00019. [DOI] [PMC free article] [PubMed] [Google Scholar]
- Fox MD, Raichle ME. Spontaneous fluctuations in brain activity observed with functional magnetic resonance imaging. Nat Rev Neurosci. 2007;8:700–711. doi: 10.1038/nrn2201. [DOI] [PubMed] [Google Scholar]
- Fukuda M, Barnes A, Simon ES, Holmes A, Dhawan V, Giladi N, Fodstad H, Ma Y, Eidelberg D. Thalamic stimulation for parkinsonian tremor: correlation between regional cerebral blood flow and physiological tremor characteristics. Neuroimage. 2004;21:608–615. doi: 10.1016/j.neuroimage.2003.09.068. [DOI] [PubMed] [Google Scholar]
- Gogtay N, Giedd JN, Lusk L, Hayashi KM, Greenstein D, Vaituzis AC, Nugent TF, III, Herman DH, Clasen LS, Toga AW, Rapoport JL, Thompson PM. Dynamic mapping of human cortical development during childhood through early adulthood. Proc Natl Acad Sci U S A. 2004;101:8174–8179. doi: 10.1073/pnas.0402680101. [DOI] [PMC free article] [PubMed] [Google Scholar]
- Goodchild RE, Kim CE, Dauer WT. Loss of the dystonia-associated protein torsinA selectively disrupts the neuronal nuclear envelope. Neuron. 2005;48:923–932. doi: 10.1016/j.neuron.2005.11.010. [DOI] [PubMed] [Google Scholar]
- Grafton ST, Turner RS, Desmurget M, Bakay R, Delong M, Vitek J, Crutcher M. Normalizing motor-related brain activity: subthalamic nucleus stimulation in Parkinson disease. Neurology. 2006;66:1192–1199. doi: 10.1212/01.wnl.0000214237.58321.c3. [DOI] [PubMed] [Google Scholar]
- Greicius MD, Srivastava G, Reiss AL, Menon V. Default-mode network activity distinguishes Alzheimer’s disease from healthy aging: evidence from functional MRI. Proc Natl Acad Sci U S A. 2004;101:4637–4642. doi: 10.1073/pnas.0308627101. [DOI] [PMC free article] [PubMed] [Google Scholar]
- Habeck C, Stern Y. Multivariate data analysis for neuroimaging data: overview and application to Alzheimer’s disease. Cell Biochem Biophys. 2010;58:53–67. doi: 10.1007/s12013-010-9093-0. [DOI] [PMC free article] [PubMed] [Google Scholar]
- Habeck C, Krakauer JW, Ghez C, Sackheim HA, Stern Y, Eidelberg D, Moeller JR. A new approach to spatial covariance modeling of functional brain imaging data: ordinal trend analysis. Neural Comput. 2005;17:1602–1645. doi: 10.1162/0899766053723023. [DOI] [PubMed] [Google Scholar]
- Habeck C, Foster NL, Perneczky R, Kurz A, Alexopoulos P, Koeppe RA, Drzezga A, Stern Y. Multivariate and univariate neuroimaging biomarkers of Alzheimer’s disease. Neuroimage. 2008;40:1503–1515. doi: 10.1016/j.neuroimage.2008.01.056. [DOI] [PMC free article] [PubMed] [Google Scholar]
- Haslinger B, Erhard P, Kampfe N, Boecker H, Rummeny E, Schwaiger M, Conrad B, Ceballos-Baumann AO. Event-related functional magnetic resonance imaging in Parkinson’s disease before and after levodopa. Brain. 2001;124:558–570. doi: 10.1093/brain/124.3.558. [DOI] [PubMed] [Google Scholar]
- Heeger DJ, Ress D. What does fMRI tell us about neuronal activity? Nat Rev Neurosci. 2002;3:142–151. doi: 10.1038/nrn730. [DOI] [PubMed] [Google Scholar]
- Helmich RC, Derikx LC, Bakker M, Scheeringa R, Bloem BR, Toni I. Spatial remapping of cortico-striatal connectivity in Parkinson’s disease. Cereb Cortex. 2010;20:1175–1186. doi: 10.1093/cercor/bhp178. [DOI] [PubMed] [Google Scholar]
- Helmich RC, Janssen MJR, Oyen WJG, Bloem BR, Toni I. Pallidal dysfunction drives a cerebellothalamic circuit into Parkinson tremor. Ann Neurol. 2011;69:269–281. doi: 10.1002/ana.22361. [DOI] [PubMed] [Google Scholar]
- Hely MA, Reid WGJ, Adena MA, Halliday GM, Morris JGL. The Sydney multicenter study of Parkinson’s disease: the inevitability of dementia at 20 years. Mov Disord. 2008;23:837–844. doi: 10.1002/mds.21956. [DOI] [PubMed] [Google Scholar]
- Hoogland J, de Bie RMA, Williams-Gray CH, Muslimović D, Schmand B, Post B. Catechol-O-methyltransferase val158met and cognitive function in Parkinson’s disease. Mov Disord. 2010;25:2550–2554. doi: 10.1002/mds.23319. [DOI] [PubMed] [Google Scholar]
- Huang C, Mattis P, Tang C, Perrine K, Carbon M, Eidelberg D. Metabolic brain networks associated with cognitive function in Parkinson’s disease. Neuro-image. 2007a;34:714–723. doi: 10.1016/j.neuroimage.2006.09.003. [DOI] [PMC free article] [PubMed] [Google Scholar]
- Huang C, Tang C, Feigin A, Lesser M, Ma Y, Pourfar M, Dhawan V, Eidelberg D. Changes in network activity with the progression of Parkinson’s disease. Brain. 2007b;130:1834–1846. doi: 10.1093/brain/awm086. [DOI] [PMC free article] [PubMed] [Google Scholar]
- Huang C, Mattis P, Perrine K, Brown N, Dhawan V, Eidelberg D. Metabolic abnormalities associated with mild cognitive impairment in Parkinson disease. Neurology. 2008;70:1470–1477. doi: 10.1212/01.wnl.0000304050.05332.9c. [DOI] [PMC free article] [PubMed] [Google Scholar]
- Hutchinson M, Nakamura T, Moeller JR, Antonini A, Belakhlef A, Dhawan V, Eidelberg D. The metabolic topography of essential blepharospasm: a focal dystonia with general implications. Neurology. 2000;55:673–677. doi: 10.1212/wnl.55.5.673. [DOI] [PubMed] [Google Scholar]
- Kwak Y, Peltier S, Bohnen NI, Muller ML, Dayalu P, Seidler RD. Altered resting state cortico-striatal connectivity in mild to moderate stage Parkinson’s disease. Front Syst Neurosci. 2010;4:143. doi: 10.3389/fnsys.2010.00143. [DOI] [PMC free article] [PubMed] [Google Scholar]
- Levy G, Tang MX, Louis ED, Cote LJ, Alfaro B, Mejia H, Stern Y, Marder K. The association of incident dementia with mortality in PD. Neurology. 2002;59:1708–1713. doi: 10.1212/01.wnl.0000036610.36834.e0. [DOI] [PubMed] [Google Scholar]
- Lewis SJ, Slabosz A, Robbins TW, Barker RA, Owen AM. Dopaminergic basis for deficits in working memory but not attentional set-shifting in Parkinson’s disease. Neuropsychologia. 2005;43:823–832. doi: 10.1016/j.neuropsychologia.2004.10.001. [DOI] [PubMed] [Google Scholar]
- Lewitt PA, Rezai AR, Leehey MA, Ojemann SG, Flaherty AW, Eskandar EN, Kostyk SK, Thomas K, Sarkar A, Siddiqui MS, Tatter SB, Schwalb JM, Poston KL, Henderson JM, Kurlan RM, Richard IH, Van Meter L, Sapan CV, During MJ, Kaplitt MG, Feigin A. AAV2-GAD gene therapy for advanced Parkinson’s disease: a double-blind, sham-surgery controlled, randomised trial. Lancet Neurol. 2011;10:309–319. doi: 10.1016/S1474-4422(11)70039-4. [DOI] [PubMed] [Google Scholar]
- Lin TP, Carbon M, Tang C, Mogilner AY, Sterio D, Beric A, Dhawan V, Eidelberg D. Metabolic correlates of subthalamic nucleus activity in Parkinson’s disease. Brain. 2008;131:1373–1380. doi: 10.1093/brain/awn031. [DOI] [PubMed] [Google Scholar]
- Lozza C, Baron JC, Eidelberg D, Mentis MJ, Carbon M, Marie RM. Executive processes in Parkinson’s disease: FDG-PET and network analysis. Hum Brain Mapp. 2004;22:236–245. doi: 10.1002/hbm.20033. [DOI] [PMC free article] [PubMed] [Google Scholar]
- Ma Y, Tang C, Spetsieris PG, Dhawan V, Eidelberg D. Abnormal metabolic network activity in Parkinson’s disease: test–retest reproducibility. J Cereb Blood Flow Metab. 2007;27:597–605. doi: 10.1038/sj.jcbfm.9600358. [DOI] [PMC free article] [PubMed] [Google Scholar]
- Ma Y, Johnston T, Peng S, Zuo C, Koprich J, Fox S, Guan Y, Eidelberg D, Brotchie JM. Society for Neuroscience, Program No 749.9/G46. San Diego, CA: 2010. Quantification of the abnormal brain networks of regional glucose metabolism in parkinsonian macaques: a pilot study with FDG PET. [Google Scholar]
- Ma Y, Peng S, Spetsieris P, Sossi V, Eidelberg D, Doudet DJ. Abnormal metabolic brain networks in a non-human primate model of parkinsonism. J Cereb, Blood Flow Metab. 2011 doi: 10.1038/jcbfm.2011.166. (Nov. 30, Electronic publication ahead of print) [DOI] [PMC free article] [PubMed] [Google Scholar]
- Mattis P, Tang CC, Ma Y, Dhawan V, Eidelberg D. Network correlates of the cognitive response to levodopa in Parkinson disease. Neurology. 2011;77:858–865. doi: 10.1212/WNL.0b013e31822c6224. [DOI] [PMC free article] [PubMed] [Google Scholar]
- Middleton FA, Strick PL. Basal ganglia and cerebellar loops: motor and cognitive circuits. Brain Res Brain Res Rev. 2000;31:236–250. doi: 10.1016/s0165-0173(99)00040-5. [DOI] [PubMed] [Google Scholar]
- Moeller JR, Eidelberg D. Divergent expression of regional metabolic topographies in Parkinson’s disease and normal ageing. Brain. 1997;120:2197–2206. doi: 10.1093/brain/120.12.2197. [DOI] [PubMed] [Google Scholar]
- Moeller JR, Habeck CG. Reciprocal benefits of mass-univariate and bilinear modeling in brain mapping: applications to event-related functional MRI, H215O- and FDG-PET. Int J Biomed Imaging. 2006;2006:1–13. doi: 10.1155/IJBI/2006/79862. [DOI] [PMC free article] [PubMed] [Google Scholar]
- Mure H, Hirano S, Tang CC, Isaias IU, Antonini A, Ma Y, Dhawan V, Eidelberg D. Parkinson’s disease tremor-related metabolic network: characterization, progression, and treatment effects. Neuroimage. 2011;54:1244–1253. doi: 10.1016/j.neuroimage.2010.09.028. [DOI] [PMC free article] [PubMed] [Google Scholar]
- Niethammer M, Carbon M, Argyelan M, Eidelberg D. Hereditary dystonia as a neurodevelopmental circuit disorder: evidence from neuroimaging. Neurobiol Dis. 2011;42:202–209. doi: 10.1016/j.nbd.2010.10.010. [DOI] [PMC free article] [PubMed] [Google Scholar]
- Palmer SJ, Li J, Wang ZJ, McKeown MJ. Joint amplitude and connectivity compensatory mechanisms in Parkinson’s disease. Neuroscience. 2010;166:1110–1118. doi: 10.1016/j.neuroscience.2010.01.012. [DOI] [PubMed] [Google Scholar]
- Paus T. Mapping brain maturation and cognitive development during adolescence. Trends Cogn Sci. 2005;9:60–68. doi: 10.1016/j.tics.2004.12.008. [DOI] [PubMed] [Google Scholar]
- Peng S, Ma Y, Flores J, Doudet D, Eidelberg D. Abnormal topography of cerebral glucose metabolism in parkinsonian macaques. J Nucl Med. 2010;51:1753. [Google Scholar]
- Poston KL, Eidelberg D. Network biomarkers for the diagnosis and treatment of movement disorders. Neurobiol Dis. 2009;35:141–147. doi: 10.1016/j.nbd.2008.09.026. [DOI] [PubMed] [Google Scholar]
- Poston KL, Mattis P, Tang C, Bussa M, Eidelberg D. Metabolic abnormalities associated with progressive cognitive dysfunction in Parkinson’s disease. Neurology. 2009;72:A114. [Google Scholar]
- Pourfar M, Feigin A, Tang CC, Carbon-Correll M, Bussa M, Budman C, Dhawan V, Eidelberg D. Abnormal metabolic brain networks in Tourette syndrome. Neurology. 2011;76:944–952. doi: 10.1212/WNL.0b013e3182104106. [DOI] [PMC free article] [PubMed] [Google Scholar]
- Priori A, Foffani G, Pesenti A, Tamma F, Bianchi AM, Pellegrini M, Locatelli M, Moxon KA, Villani RM. Rhythm-specific pharmacological modulation of subthalamic activity in Parkinson’s disease. Exp Neurol. 2004;189:369–379. doi: 10.1016/j.expneurol.2004.06.001. [DOI] [PubMed] [Google Scholar]
- Risch NJ, Bressman SB, Senthil G, Ozelius LJ. Intragenic Cis and Trans modification of genetic susceptibility in DYT1 torsion dystonia. Am J Hum Genet. 2007;80:1188–1193. doi: 10.1086/518427. [DOI] [PMC free article] [PubMed] [Google Scholar]
- Sabatini U, Boulanouar K, Fabre N, Martin F, Carel C, Colonnese C, Bozzao L, Berry I, Montastruc JL, Chollet F, Rascol O. Cortical motor reorganization in akinetic patients with Parkinson’s disease: a functional MRI study. Brain. 2000;123 (Pt. 2):394–403. doi: 10.1093/brain/123.2.394. [DOI] [PubMed] [Google Scholar]
- Saunders-Pullman R, Raymond D, Senthil G, Kramer P, Ohmann E, Deligtisch A, Shanker V, Greene P, Tabamo R, Huang N, Tagliati M, Kavanagh P, Soto-Valencia J, de Aguiar PC, Risch N, Ozelius L, Bressman S. Narrowing the DYT6 dystonia region and evidence for locus heterogeneity in the Amish–Mennonites. Am J Med Genet A. 2007;143A:2098–2105. doi: 10.1002/ajmg.a.31887. [DOI] [PubMed] [Google Scholar]
- Seeley WW, Menon V, Schatzberg AF, Keller J, Glover GH, Kenna H, Reiss AL, Greicius MD. Dissociable intrinsic connectivity networks for salience processing and executive control. J Neurosci. 2007;27:2349–2356. doi: 10.1523/JNEUROSCI.5587-06.2007. [DOI] [PMC free article] [PubMed] [Google Scholar]
- Skidmore FM, Spetsieres P, Yang M, Gold M, Heilman KM, Collingwood J, White KD, von Deneen KD, He G, Liu YJ, Eidelberg D. Diagnosis of Parkinson’s disease using resting state fMRI. Mov Disord. 2011:LB22. [Google Scholar]
- Spetsieris PG, Eidelberg D. Scaled subprofile modeling of resting state imaging data in Parkinson’s disease: methodological issues. Neuroimage. 2011;54:2899–2914. doi: 10.1016/j.neuroimage.2010.10.025. [DOI] [PMC free article] [PubMed] [Google Scholar]
- Standaert DG. Update on the pathology of dystonia. Neurobiol Dis. 2011;42:148–151. doi: 10.1016/j.nbd.2011.01.012. [DOI] [PMC free article] [PubMed] [Google Scholar]
- Tang C, Eckert T, Dhawan V, Eidelberg D. Parkinson’s disease: evidence for a short metabolic preclinical period. Neurology. 2008;70:A436. [Google Scholar]
- Tang CC, Poston KL, Dhawan V, Eidelberg D. Abnormalities in metabolic network activity precede the onset of motor symptoms in Parkinson’s disease. J Neurosci. 2010;30:1049–1056. doi: 10.1523/JNEUROSCI.4188-09.2010. [DOI] [PMC free article] [PubMed] [Google Scholar]
- Tang CC, Niethammer M, Gerber NJ, Mattis P, Ma Y, Eidelberg D. Expression of a cognitive metabolic network in Parkinson’s disease correlates with dopaminergic function in the caudate nucleus. Neurology. 2011;76:A489–A490. [Google Scholar]
- Timmermann L, Gross J, Dirks M, Volkmann J, Freund HJ, Schnitzler A. The cerebral oscillatory network of parkinsonian resting tremor. Brain. 2003;126:199–212. doi: 10.1093/brain/awg022. [DOI] [PubMed] [Google Scholar]
- Trost M, Carbon M, Edwards C, Ma Y, Raymond D, Mentis MJ, Moeller JR, Bressman SB, Eidelberg D. Primary dystonia: is abnormal functional brain architecture linked to genotype? Ann Neurol. 2002;52:853–856. doi: 10.1002/ana.10418. [DOI] [PubMed] [Google Scholar]
- Turner RS, Grafton ST, Votaw JR, Delong MR, Hoffman JM. Motor subcircuits mediating the control of movement velocity: a PET study. J Neurophysiol. 1998;80:2162–2176. doi: 10.1152/jn.1998.80.4.2162. [DOI] [PubMed] [Google Scholar]
- Ulug AM, Vo A, Argyelan M, Tanabe L, Schiffer WK, Dewey S, Dauer WT, Eidelberg D. Cerebellothalamocortical pathway abnormalities in torsinA DYT1 knock-in mice. Proc Natl Acad Sci. 2011;108:6638–6643. doi: 10.1073/pnas.1016445108. [DOI] [PMC free article] [PubMed] [Google Scholar]
- Vaishnavi SN, Vlassenko AG, Rundle MM, Snyder AZ, Mintun MA, Raichle ME. Regional aerobic glycolysis in the human brain. Proc Natl Acad Sci U S A. 2010;107:17757–17762. doi: 10.1073/pnas.1010459107. [DOI] [PMC free article] [PubMed] [Google Scholar]
- van Eimeren T, Monchi O, Ballanger B, Strafella AP. Dysfunction of the default mode network in Parkinson disease: a functional magnetic resonance imaging study. Arch Neurol. 2009;66:877–883. doi: 10.1001/archneurol.2009.97. [DOI] [PMC free article] [PubMed] [Google Scholar]
- Vitek JL, Giroux M. Physiology of hypokinetic and hyperkinetic movement disorders: model for dyskinesia. Ann Neurol. 2000;47:S131–S140. [PubMed] [Google Scholar]
- Volkmann J, Joliot M, Mogilner A, Ioannides AA, Lado F, Fazzini E, Ribary U, Llinas R. Central motor loop oscillations in parkinsonian resting tremor revealed by magnetoencephalography. Neurology. 1996;46:1359–1370. doi: 10.1212/wnl.46.5.1359. [DOI] [PubMed] [Google Scholar]
- Wu T, Hallett M. A functional MRI study of automatic movements in patients with Parkinson’s disease. Brain. 2005;128:2250–2259. doi: 10.1093/brain/awh569. [DOI] [PubMed] [Google Scholar]
- Wu T, Long X, Zang Y, Wang L, Hallett M, Li K, Chan P. Regional homogeneity changes in patients with Parkinson’s disease. Hum Brain Mapp. 2009a;30:1502–1510. doi: 10.1002/hbm.20622. [DOI] [PMC free article] [PubMed] [Google Scholar]
- Wu T, Wang L, Chen Y, Zhao C, Li K, Chan P. Changes of functional connectivity of the motor network in the resting state in Parkinson’s disease. Neurosci Lett. 2009b;460:6–10. doi: 10.1016/j.neulet.2009.05.046. [DOI] [PubMed] [Google Scholar]
- Wu T, Wang L, Hallett M, Li K, Chan P. Neural correlates of bimanual anti-phase and in-phase movements in Parkinson’s disease. Brain. 2010;133:2394–2409. doi: 10.1093/brain/awq151. [DOI] [PMC free article] [PubMed] [Google Scholar]
- Wu T, Long X, Wang L, Hallett M, Zang Y, Li K, Chan P. Functional connectivity of cortical motor areas in the resting state in Parkinson’s disease. Hum Brain Mapp. 2011a;32:1443–1457. doi: 10.1002/hbm.21118. [DOI] [PMC free article] [PubMed] [Google Scholar]
- Wu T, Wang L, Hallett M, Chen Y, Li K, Chan P. Effective connectivity of brain networks during self-initiated movement in Parkinson’s disease. Neuroimage. 2011b;55:204–215. doi: 10.1016/j.neuroimage.2010.11.074. [DOI] [PubMed] [Google Scholar]