

Abstract
Study Objectives:
Vigilance is affected by induced and spontaneous skin temperature fluctuations. Whereas sleep deprivation strongly affects vigilance, no previous study examined in detail its effect on human skin temperature fluctuations and their association with vigilance.
Design:
In a repeated-measures constant routine design, skin temperatures were assessed continuously from 14 locations while performance was assessed using a reaction time task, including eyes-open video monitoring, performed five times a day for 2 days, after a normal sleep or sleep deprivation night.
Setting:
Participants were seated in a dimly lit, temperature-controlled laboratory.
Patients or Participants:
Eight healthy young adults (five males, age 22.0 ± 1.8 yr (mean ± standard deviation)).
Intervention:
One night of sleep deprivation.
Measurements and Results:
Mixed-effect regression models were used to evaluate the effect of sleep deprivation on skin temperature gradients of the upper (ear-mastoid), middle (hand-arm), and lower (foot-leg) body, and on the association between fluctuations in performance and in temperature gradients. Sleep deprivation induced a marked dissociation of thermoregulatory skin temperature gradients, indicative of attenuated heat loss from the hands co-occurring with enhanced heat loss from the feet. Sleep deprivation moreover attenuated the association between fluctuations in performance and temperature gradients; the association was best preserved for the upper body gradient.
Conclusions:
Sleep deprivation disrupts coordination of fluctuations in thermoregulatory skin temperature gradients. The dissociation of middle and lower body temperature gradients may therefore be evaluated as a marker for sleep debt, and the upper body gradient as a possible aid in vigilance assessment when sleep debt is unknown. Importantly, our findings suggest that sleep deprivation affects the coordination between skin blood flow fluctuations and the baroreceptor-mediated cardiovascular regulation that prevents venous pooling of blood in the lower limbs when there is the orthostatic challenge of an upright posture.
Citation:
Romeijn N; Verweij IM; Koeleman A; Mooij A; Steimke R; Vikkala J; van der Werg Y; Van Someren EJW. Cold hands, warm feet: sleep deprivation disrupts thermoregulation and its association with vigilance. SLEEP 2012;35(12):1673-1683.
Keywords: Skin temperature, sleep deprivation, thermoregulation, vigilance
INTRODUCTION
It has long been known that sleep and thermoregulation are closely related. This association has traditionally been studied mostly for the association of sleep or alertness with core body temperature.1,2 During the past decade, several studies have suggested this association to be at least in part secondary to an association of sleep and alertness with heat loss, the major determinant of core body temperature.3,4 A primary determinant of heat loss is skin blood flow. Increased perfusion warms the skin, facilitating convection of heat from the core of the body to the environment. In support of a contribution of skin temperature to the regulation of sleep and alertness, several studies have shown that sleep and sustained attention, also referred to as vigilance, are affected by both spontaneous fluctuations and induced changes in skin temperature.3,5–8 Measurable fluctuations in skin temperature occur at multiple timescales. Very weak fluctuations with a periodicity starting at approximately 0.5 min can be measured in laboratory settings, and fluctuations in the range of several min and hr, as well as a clear 24-hr rhythm are more prominent, with changes of up to several degrees.9–11 It has been suggested that vigilance is most strongly associated especially with the temperature gradient between distal skin areas relative to more proximal skin areas,3,4 although some studies failed to find an advantage of the gradient over mere proximal or distal skin temperatures.8,12
Whereas vigilance is also the cognitive domain that is most sensitive to sleep deprivation (SD),13 it is not known how SD affects the different skin temperature gradients that can be measured over the human body while maintaining an upright posture as is normally done when trying to keep awake after SD. One study investigated the effect of SD on an integrated whole body distal-to-proximal skin temperature gradient in individuals maintaining a semisupine position, finding no effect of sleep deprivation on the thermoregulatory system.14 These findings, unfortunately, cannot easily be generalized to everyday life situations. Sleep-deprived people who try to stay awake normally experience the orthostatic challenge of being in an upright position, which results in baroreceptor unloading and the ensuing baroreceptor reflex that regulates blood flow to prevent venous pooling of blood in the lower limbs. In real-life situations, thermoregulatory skin blood flow thus has to compete with this baroreceptor reflex blood flow regulation.15 It thus remains to be investigated how SD affects the profile of skin temperature if one maintains the upright posture, as is most common for operational control, for tasks such as driving a car. Neither is it known whether the previously reported association of skin temperature with vigilance is preserved after SD.
These questions are of considerable interest to improve our understanding of thermoregulatory response after sleep deprivation. Subjectively, many of us have experienced `feeling cold' after SD. Indeed, one of the hallmarks of prolonged SD in rats is a progressive decline in core body temperature in spite of increased food intake and energy expenditure.16 Also, sleep-deprived humans are more vulnerable to heat loss both at cold and comfortable temperatures.17–20
These questions are furthermore not only of academic interest, but also of crucial importance from an applied point of view if—as has been proposed—information on skin temperature fluctuations is to be used in systems that aim to monitor and possibly warn or intervene with an increasing risk of a drop in vigilance level. Such systems should work equally well under conditions of normal sleep as well as after SD. We therefore set out to obtain a detailed view on the effect of SD on the profile of human skin temperature gradients over the body, as well as on their association with sustained attention.
METHODS
All procedures complied with the Declaration of Helsinki and medical ethical approval was obtained from the medical ethical committee of the VU University Medical Center.
Participants
Eight healthy volunteers (20-26 yr of age; mean ± standard deviation: 22 ± 1.8 yr, 5 males, 3 females) completed the study; an additional person was excluded because of uncertainty on compliance to sleep deprivation (see next paragraphs). According to a brief questionnaire, participants were in good health and had no presence or history of neurologic or psychiatric disease or of drug abuse. None of the participants had sleep-related problems, as indicated by any of the following questionnaires: The Athens Insomnia Scale (AIS),21 the Pittsburgh Sleep Quality Index (PSQI),22 the Dutch version of the Sleep Diagnosis Questionnaire,23 and the Epworth Sleepiness Scale (ESS).24 All participants were right-handed and had a body mass index between 18.7 and 24.9 (mean ± standard deviation: 22.0 ± 1.8).
Experimental Procedure
The experimental procedure is detailed schematically in Figure 1. It consisted of a modified constant routine protocol over 2 days during which temperatures were measured continuously and vigilance was measured five times at 90-min intervals using an adaptation of the Psychomotor Vigilance Task (PVT)25 called the Brief Stimulus Reaction Task (BSRT),8 which will be described in more detail later. The 2 days were separated by 4.3 ± 1.6 days in between (mean ± standard error). Females participated in the follicular phase (between days 4 and 12) of their menstrual cycle, both days in the same follicular phase.
Figure 1.

Overview of the experimental protocol. Eight participants were measured in a modified constant routine protocol over 2 experimental days. Counterbalanced across individuals, participants underwent a night of normal sleep (NS) or total sleep deprivation (SD) on the night prior to each experimental day. Vigilance was measured five times per day (block 1-5) at regular intervals using the Brief Stimulus Reaction Task (BSRT).8 Each of the five daily blocks was identical, and consisted of the following procedures: restroom break, isocaloric meal and drink (300 kcal per block), and rest period comprised the first half hr of each block, after which a computerized task battery was started. In each block participants performed the BSRT sustained attention task. Output measures were reaction speed and lapses, defined as lack of responses, including responses slower than the 10th percentile calculated on the well rested day.
One wk prior to the first experimental day, participants visited the laboratory for an introductory session to explain the procedure and to practice the BSRT. Participants were asked to keep a regular sleep/wake pattern for the wk prior to the first laboratory day, logged both objectively with actigraphy (Actiwatch, Cambridge Neuro-Technology, Cambridge, UK) as well as subjective report using a sleep diary.
On the evening prior to each of the 2 experimental days, participants were visited at home. Between 17:00 and 21:00 temperature sensors were fitted. On one occasion, participants were allowed a normal night of sleep at home, which will be referred to as the normal sleep (NS) condition. On the other occasion, referred to as the SD condition, participants had to remain awake all night. The order of conditions was counterbalanced over participants. In both conditions, exercise, alcohol, caffeine, nicotine, and other stimulant consumption were not allowed from 20:00 onward, as was eating from 04:00 onward. Compliance was verified by interview the next morning. Successful completion of total SD was verified using actigraphy; actigraphic sleep estimates were obtained using the Sleep Analysis software of Cambridge Neuro-Technology (Cambridge, UK). Actigraphy is highly sensitive to the detection of naps, overestimating rather than underestimating sleep.26 We excluded one participant in whom actigraphy suggested the possibility of having slept, as indicated by inactivity for 10 min or more,27 leaving the eight participants who completed the study as detailed previously.
The following morning participants reported to the laboratory at 08:30. To ensure safety while commuting from home to the laboratory after SD, they used public transport for all traveling. To exclude confounders relating to traveling, such as environmental temperature, physical activity, and posture history, participants were asked to stay seated for 90 min after arrival at the laboratory. At 10:00, the first of five assessment blocks was started. During the entire day, participants were seated in a comfortable chair in a dimly-lit room (< 15 lux measured in the eye gaze direction).
The procedure followed in each of the 10 blocks (five on each day) was as follows: In the first 10 min, e.g., from 10:00 to 10:10, participants were allowed to use the restroom. To keep the history of postural changes and physical movement identical across blocks, participants were obligated to get out of their chair and walk 5 m to the restroom, regardless of their need to use the facilities at that time. In the next 10 min, e.g., from 10:10 to 10:20, a snack of 230 kcal was served together with 70 kcal worth of low-caloric iced tea (decaffeinated lemon iced tea mix, Lipton, Englewood Cliffs, NJ, USA), resulting in a total energy intake of 300 kcal per block. Both the snack and the tea were offered at room temperature. The following 10 min (e.g., from 10:20 to 10:30) allowed for reading literature of personal choice.
After the end of the reading period, e.g., at 10:30, an audio cue signaled the start of assessments. After 5 min of alpha attenuation task, sustained attention was measured, e.g., 10:35 for 20 min continuously using a 120-stimulus BSRT. During task completion, video monitoring (iView Red, SensoMotoric Instruments (SMI), Teltow, Germany) was used to continuously track eye gaze direction and whether eyes were open at the time a stimulus was given.
Temperature Assessment
Material
Temperatures were continuously measured from 14 locations on the skin (see following paragraph), completed by one core temperature measurement recorded rectally. Where skin areas were sufficiently large, multiple iButtons (type DS1922L, MAXIM-IC, Sunnyvale, CA, USA) were affixed. The use of multiple sensors to assess a single skin area may improve its robustness by accounting for spatial heterogeneity.28 iButtons were set to acquire temperature samples at 30-sec intervals with a resolution of 0.0625°C. The method has previously been validated and described in detail.29 For skin surfaces that were too small to measure comfortably with iButtons (see following paragraph), as well as for rectal temperature measurement, thermistors (P-8432, ICBT, Tokyo, Japan) connected to a HOBO u12-06 data logger (Onset Computer Corporation, Cape Cod, Massachusetts, USA) were used and sampled at 30-sec intervals with a resolution of 0.03°C.
Measurement and Calculation of Skin Temperature Averages and Gradients
The gradient between the skin temperatures of an extremity and a more proximal area of a limb provides a reliable estimate of thermoregulatory autonomic nervous system activity if the more distal area is richer in arteriovenous anastomoses (AVAs) than a nearby more proximal area.30 AVAs are capillary beds that, when opened, induce a strong increase in heat exchange between the skin and environment and therefore play a crucial role in temperature regulation. They are abundant in the skin of the ears, hands, and feet.31 A gradient could thus be calculated for each of these three distal areas with a corresponding nearby skin area where AVAs are absent or less abundant, such as the head, arm, and leg. Gradients have also been calculated between the average temperature of multiple different extremities (hands and feet) and multiple more proximal limb areas or even the trunk.4 This averaging procedure presumes a strong covariation between different distal areas and between different proximal areas. The validity of this assumption, however, remains to be demonstrated under normal well-rested circumstances, let alone when individuals are sleep deprived. We therefore calculated three separate gradients, for the upper, middle, and lower part of the body, as described next. The first, upper body, distal to proximal gradient (DPGup) was calculated between sensors attached to the AVA-rich earlobe and the nearby mastoid skin area. The second, middle body, distal to proximal gradient (DPGmid) was calculated between the AVA-rich hand (average of four sensors, attached to the ventral side of the tip of the middle finger, the dorsal and ventral side of the base of the middle finger and the palmar side of the hand) and the arm (average of two sensors, dorsally attached to the upper arm at the level of the apex of the deltoid muscle and to the lower arm at the level of the wrist). The third, lower body, distal to proximal gradient (DPGlow) was calculated between the AVA-rich foot (average of two sensors, attached to the plantar side at the level of the instep and to the dorsal side of the big toe) and the leg (average of two sensors, attached to the upper leg at the medial side of the calf and to the lower leg at the midlevel of the calf). Although not the focus of interest of the current study, we also assessed core temperature using a rectal sensor as well as trunk skin temperature using two sensors attached to the infraclavicular area on the chest and above the navel.
Vigilance Assessment
Vigilance was assessed using an adaptation of the Psychomotor Vigilance Task (PVT),25 the BSRT, which has been described in more detail in a previous study.8 In brief, participants were required to press the spacebar of a keyboard with their dominant hand as quickly as possible as soon as they saw a briefly displayed (25 ms) `minus sign (-)' stimulus presented between a fixation `plus sign (+)' at interstimulus intervals varying quasirandomly between 4-14 s. After each stimulus, participants were given a fixed interval of 1,000 ms to respond, after which the next interstimulus interval commenced. Each BSRT assessment consisted of 120 stimuli, thus lasting 20 min. Due to the short duration of each stimulus, as well as its low contrast and image change, the task is highly reliant on top-down attentional processes, such as the PVT. We specifically chose to use the BSRT because it yields longer reaction times and more lapses, as has been demonstrated before.8 Lapses were defined as omissions and reaction times (RTs) exceeding the 90th percentile of the distribution32 of all recorded RTs on the day after NS.
To obtain a normal distribution for the recorded responses, the inverse of RTs was taken, denoted as `speed' (s−1). Given the importance of discriminating lapses that occur with eyes open, eyes closed, or looking away from the target area at the screen,33 video monitoring (IView Red, SensoMotoric Instruments (SMI), Teltow, Germany) was used to continuously track eye gaze direction and whether eyes were open and gaze was directed to the target area at the time a stimulus was given. The eye video was sampled at a rate of 25 frames per sec. Based on pupil diameter and circumference, an automated algorithm scored each frame as either eyes open or closed, after which the data was downsampled to 30-sec intervals.
Data Analysis
All analyses were restricted to the behavioral responses, and corresponding last measured temperature readouts, belonging only to those stimuli that were presented during video monitoring-confirmed eyes open and proper gaze angle. This resulted in a variable number of missing values for those reaction times (or lapses) and corresponding last measured temperature readouts. On average, 14 ± 4% (mean ± standard error) of the data points for a participant were discarded because they were recorded during eyes closed or during diverted, inattentive gaze. To appropriately account for the variable number of missing values, mixed effect regression models were used for all analysis (MLwiN, Centre for Multilevel Modeling, University of Bristol, Bristol, UK). This approach also accounts for the four-level hierarchical dependency of data points, i.e., temperature and performance values are nested within five blocks, which are in turn nested within 2 days, again nested within eight participants.28,29 Regression coefficients (e.g., the effect of temperature on performance or the effect of sleep deprivation on temperature or performance) were considered significant if the z-distributed ratio of its estimate over its standard error exceeded a value of 1.96, corresponding to a two-sided P < 0.05.34,35
Effect of SD on Temperature Gradients and Performance
MLwiN was used to obtain missing cases-weighted average temperature gradients and reaction speed, as well as their standard errors, both for the NS condition and for the SD condition. The effect of SD on temperature gradients and reaction speed was tested by including SD as a dummy in linear regression analyses. The same approach, but now with logistic regression, was used to estimate effect of SD on the probability of lapses.
Effect of SD on the Association Between Temperature Gradients and Performance
Linear and nonlinear regression analyses were likewise used to obtain missing cases-weighted average predictive effects of fluctuations in temperature gradients on fluctuations in reaction speed and the probability of lapses. These effect estimates integrate the temperature and vigilance fluctuations that normally occur continuously,8,29 both within and between blocks. Estimates were obtained for the NS condition separately, for the SD condition separately, and for the integral dataset. These three analyses provide the predictive value of skin temperature gradients to estimate vigilance in situations of respectively NS, SD, and an unknown sleep history. Regression analyses on the integral dataset were moreover used to formally test whether the predictive effect of temperature gradients on performance changed significantly with SD.
RESULTS
Actigraphic Verification of SD Compliance
Actigraphic recordings were inspected closely to verify compliance with the SD protocol. To do so, three cumulative distributions of immobility bout durations were obtained for each participant: (1) the period between lights out and final awakening during the night preceding the NS condition; (2) the corresponding nocturnal period during the SD condition; and (3) a corresponding 12-hr earlier daytime period on the day prior to the NS condition. For each period, the cumulative distributions of immobility bout duration were averaged over participants and plotted (Figure 2). Due to inclusion criteria (one participant was excluded from analyses), no immobility bout lasting more than 10 min occurred during the SD night, whereas during the NS night, 75% of all immobility time occurred in bouts that lasted longer than 10 min. The profile of immobility bout durations during the SD night closely resembles the profile seen during a normal wake day, whereas only limited (7%) immobility time occurs in bouts lasting longer than 10 min. The immobility profiles indicate good compliance with the SD protocol in all included participant.
Figure 2.
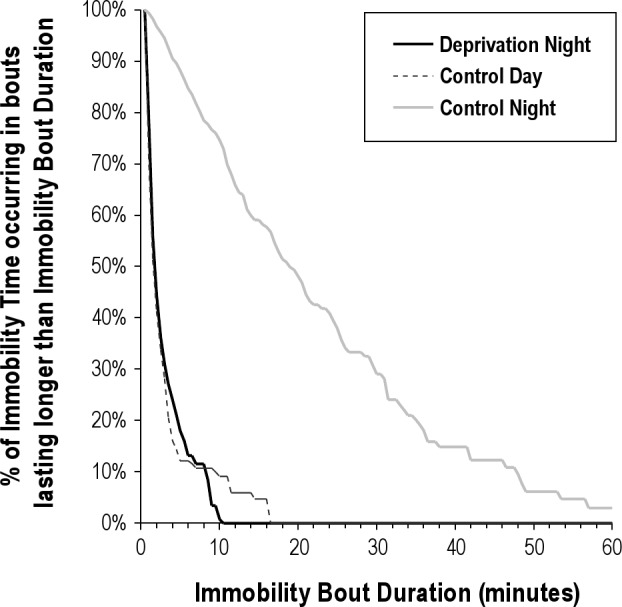
Actigraphic verification of sleep deprivation. Cumulative distribution of immobility bout duration during the sleep deprivation night (solid black line), during a normal wake day (dotted black line), and during a night of normal sleep (gray line). The horizontal axis shows the range of immobility bout durations observed (max 99.5 min, axis stopped at 60 min). The vertical axis shows the average percentage of immobility time occurring in bouts that last longer than the corresponding Immobility Bout Duration denoted at the horizontal axis. Due to inclusion criteria, no immobility bout lasting more than 10 min occurred during the sleep deprivation night, whereas during a normal night, 75% of all immobility time occurs in bouts lasted longer than 10 min. The profile of immobility bout durations during the sleep deprivation night closely resembles the profile seen during a normal wake day, where only limited (7%) of the immobility time occurs in bouts lasting longer than 10 min.
Effect of SD on Temperature Gradients and Performance
Table 1 summarizes the effects of SD on skin temperature gradients. SD did not significantly alter DPGup, which was −3.91 ± 0.17°C after a normal night's sleep and −4.09 ± 0.33 °C after SD (P = 0.51). Figure 3 shows the effects of SD on DPGmid and DPG–low. SD lowered DPGmid from −0.86 ± 0.76°C after a normal night's sleep to −1.59 ± 0.79°C after SD (P = 0.03). In marked contrast, SD increased DPGlow from −4.29 ± 0.96°C after a normal night's sleep to −3.41 ± 1.15°C after SD (P = 0.04).
Table 1.
The effect of sleep deprivation on temperature gradientsa
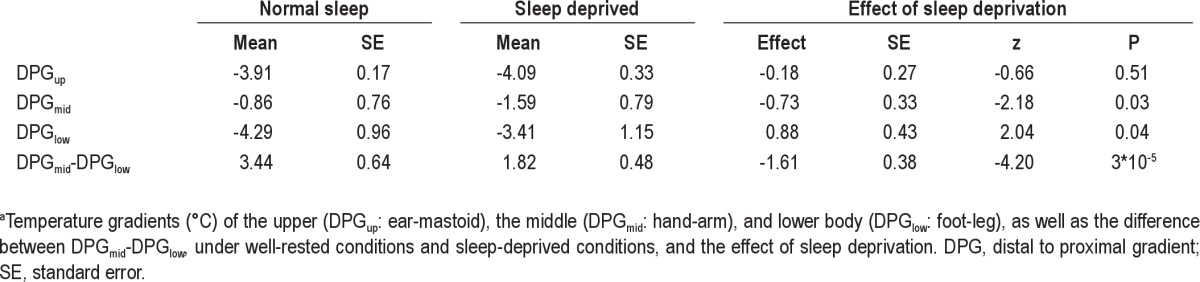
Figure 3.
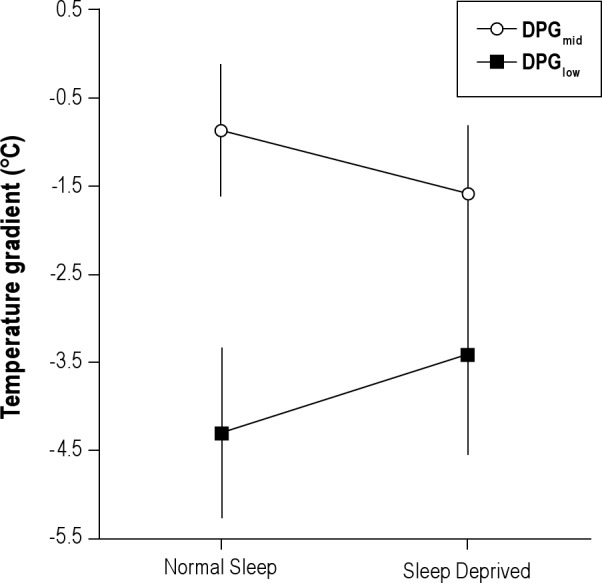
Effect of sleep deprivation on local temperature gradients. Mean ± standard error of the mean of the distal to proximal gradients measured at the hand versus the arm (DPGmid) and the foot versus the leg (DPGlow) after a night of normal sleep and sleep deprivation. The decrease of DPGmid after sleep deprivation and the increase of DPGlow were both significant.
To determine whether DPGmid and DPGlow fluctuated in synchrony, linear regression analyses were used to estimate how changes DPGmid were associated with changes in DPGlow after NS and after SD. After NS, increases in DPGmid coincided with increases in DPGlow (β = 0.29 ± 0.04, P = 9*10−13), as to be expected for effective thermoregulation. After SD, however, increases in DPGmid coincided with decreases in DPGlow (β = −0.23 ± 0.03, P = 5*10−15), indicating that fluctuations occurred in antiphase. The effect of SD on the predictive value of DPGlow for DPGmid was highly significant (β = −0.47 ± 0.05, z = −8.74, P = 0).
Concerning performance, SD significantly (P = 9*10−6) decreased reaction speed, which was 2.40 ± 0.10 s−1 after a normal night's sleep and 2.29 ± 0.12 s−1 after SD.
SD significantly (P = 3*10−15) increased the number of lapses, which had a probability of 0.21 (95% confidence interval (CI): 0.16-0.27 after NS and 0.49 (95% CI: 0.39-0.59) after SD.
Effect of SD on the Association Between Fluctuations in Temperature Gradients and Performance Speed
As shown in Figure 4 and Tables 2 and 3, fluctuations in DPGup predicted fluctuations in performance speed. Figure 4 provides an integrated example of the fluctuations in skin temperature and reaction speed that occur on the time scales of hr to sec, as well as their association. Speed dropped by 0.147 ± 0.027 S−1 per °C increase in DPGup (P = 5*10−8) after a normal night's sleep and by 0.093 ± 0.024 S−1 per °C increase in DPGup (P = 0.0001) after SD. DPGup fluctuations thus predicted performance speed fluctuations only nonsignificantly (P = 0.08) less well after SD. Ignoring information on sleep history, an increase in DPGup still strongly predicted a drop in performance speed by 0.104 ± 0.017 S−1 per °C (P = 9*10−10). Note that we use the word `prediction' in its statistical connotation throughout the manuscript, indicating an effect of a regressor on the outcome measure of interest, without inferring mechanistic causality.
Figure 4.

Examples of associated upper distal to proximal gradients (DPGup) and reaction speed fluctuations. Top panel: mean ± standard error of DPGup (black line) and reaction speed (gray line) fluctuations for the five assessment blocks after normal sleep (NS, left side) and after sleep deprivation (SD, right side) in a single particpant. Note that all plots use an inverse scale, from maximal to minimal, for the DPGup axis, to better visualize its association with reaction speed. Also, in all plots, closed markers indicate data obtained after NS, open markers indicate data points obtained after SD. The inset scatterplot shows the association between the block averages, with regression lines for data obtained after NS (black line), after SD (broken line), as well as the overall regression line for the combination of these data (gray line). Bottom panels: Examples of the association between DPGup (black line) and reaction speed (gray markers and line) fluctuations within a block, taken from different participants. For graphing purposes only, but not applied in any analysis, a 2.5-min smoothing window is applied to generate the curves. The inset scatterplots show the association between the individual reaction speed and temperature gradient data points. Use of markers, scales, and lines as in the top panel.
Table 2.
Temperature gradients as predictors of reaction speed under well-rested conditions and sleep-deprived conditionsa
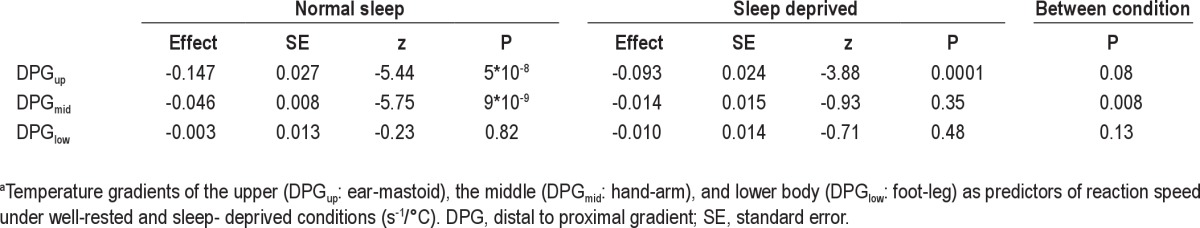
Table 3.
Temperature gradients as predictors of reaction speed if sleep history is unknowna
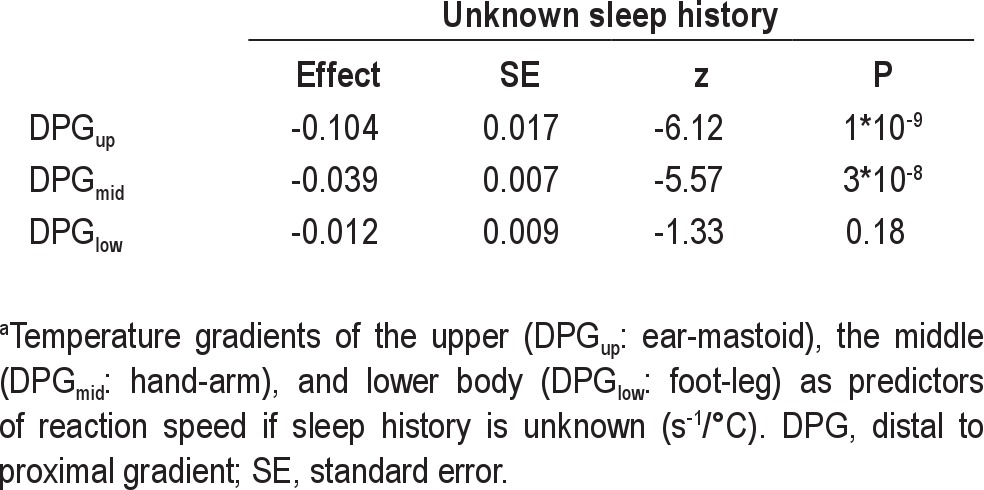
Fluctuations in DPGmid predicted fluctuations in performance speed only after a normal night's sleep. Speed dropped by 0.046 ± 0.008 S−1 per °C increase in DPGmid (P = 9*10−9) after a normal night's sleep and by a nonsignificant 0.014 ± 0.015 S−1 per °C increase in DPGmid (P = 0.35) after SD. DPGmid fluctuations thus predicted performance speed significantly worse after SD (P = 0.008). Ignoring information on sleep history, an increase in DPGmid still strongly predicted a drop in performance speed by 0.039 ± 0.007 S−1 per °C (P = 3*10−8).
Fluctuations in DPGlow did not significantly predict fluctuations in performance speed, neither after a normal night's sleep (P = 0.82), nor after SD (P = 0.48).
Effect of SD on the Association Between Fluctuations in Temperature Gradients and Lapses
As can be seen in Tables 4 and 5, fluctuations in DPGup predicted fluctuations in lapse probability. The odds ratio was 1.55 (95% CI: 1.07-2.25) per °C increase in DPGup (P = 0.02) after a normal night's sleep and 2.16 (95% CI: 1.59-2.93) per °C increase in DPGup (P = 7*10−7) after SD. The enhancement of predictive value after SD was not significant (P = 0.30). Ignoring information on sleep history, an increase in DPGup still strongly predicted a rise in risk probability with an odds ratio of 1.84 (95% CI: 1.47-2.31) per °C (P = 1*10−7).
Table 4.
Temperature gradients as predictors of lapse probability under well-rested conditions and sleep-deprived conditionsa
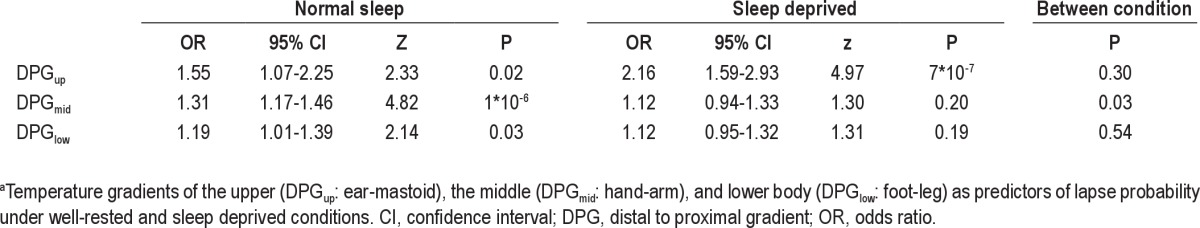
Table 5.
Temperature gradients as predictors of lapse probability if sleep history is unknowna
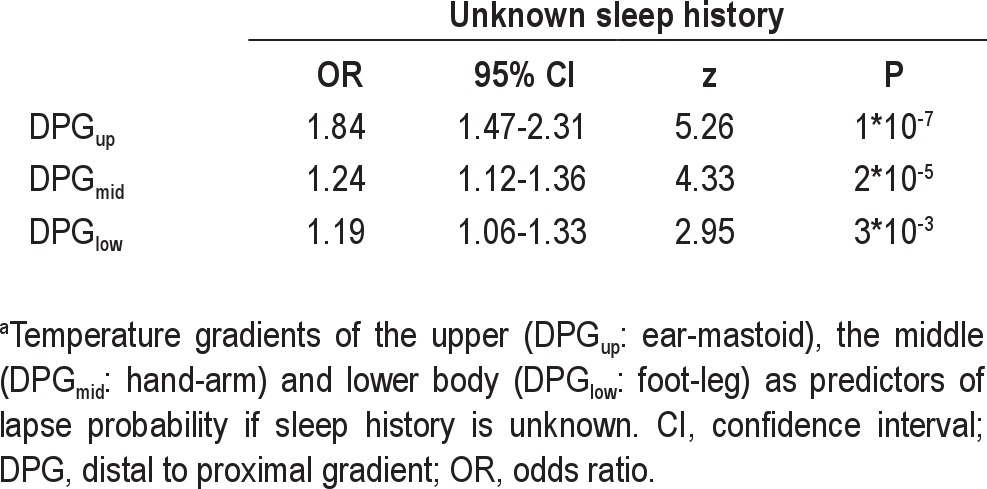
Fluctuations in DPGmid predicted fluctuations in lapse probability only after a normal night's sleep. The odds ratio was 1.31 (95% CI: 1.17-1.46) per °C increase in DPGmid (P = 1*10−6) after a normal night's sleep and a nonsignificant 1.12 (95% CI: 0.94-1.33) per °C increase in DPGmid (P = 0.20) after SD. DPGmid fluctuations predicted lapse probability significantly worse after SD (P = 0.03). Ignoring information on sleep history, an increase in DPGmid still strongly predicted a rise in lapse probability with an odds ratio of 1.24 (95% CI: 1.12-1.36) per °C (P = 2*10−5).
Fluctuations in DPGlow significantly predicted fluctuations in lapse probability only after a normal night's sleep. The odds ratio was 1.19 (95% CI: 1.01-1.39) per °C increase in DPGlow (P = 0.03) after a normal night's sleep and a nonsignificant 1.12 (95% CI: 0.95-1.32) per °C increase in DPGlow (P = 0.19) after SD. The attenuation of the predictive value of DPGlow due to SD was not significant (P = 0.54). Ignoring information on sleep history, an increase in DPGlow predicted a rise in lapse probability with an odds ratio of 1.19 (95% CI: 1.06-1.33) per °C (P = 3*10−3).
Post Hoc Analyses
A number of ancillary post hoc analyses were performed to improve the interpretability of the findings as well as to distill methodologic recommendations for further fundamental and applied research.
As a first ancillary analysis, we further investigated the surprising opposed effect of SD on the three different DPGs we measured. Although DPGup did not change significantly, DPGmid decreased and DPGlow increased. We therefore investigated whether this discrepancy between DPGs might be an even better thermoregulatory marker to discriminate someone's sleep history than any of the DPGs per se. To do so, the difference between DPGmid and DPGlow was calculated. Indeed, SD affected this difference more than it affected any other change in the temperature profile (1.61 ± 0.38 °C, P = 3*10−5).
In summary, activation of heat loss from the feet in the presence of activation of heat preservation from the hands may thus be a most characteristic skin temperature profile signature of being sleep deprived.
Another set of ancillary analyses was performed to rule out the possibility that systematic parallel effects of time of day on temperature gradients and performance might be present and could have introduced spurious associations. Linear and nonlinear time-of-day effects were evaluated by adding time and time2 (i.e., second order) in the regression models. Of the three gradients, only DPGlow changed with time of day, as indicated by a significant linear term (P = 2*10−3) and a nonsignificant second-order term (P = 0.07). However, because neither lapses nor speed showed significant time-of-day effects (0.15 < P < 0.40), the systematic changes of DPGlow over the time of day were unlikely to have induced spurious associations due to parallel time-of-day changes of temperature and performance. Formal testing of the robustness of the predictive value of temperature for performance by inclusion of the linear and second-order terms representing time of day in the regression equations confirmed absence of any spurious associations: addition of time hardly changed the predictive effect sizes and their significance.
Finally, for completeness, we evaluated the effects of SD on core body temperature as well as the association of fluctuations of performance with those in core body temperature. Core body temperature did not differ between the NS (37.38 ± 0.08) and SD (37.37 ± 0.10 °C) conditions (P = 0.92). There was no main effect of core temperature on performance speed (0.03 ± 0.08 S−1 per °C, P = 0.68), neither a core temperature by sleep condition interaction effect (-0.03 ± 0.09 S−1 per °C, P = 0.74). There was no main effect of core temperature on lapse probability (odds ratio 1.22 per °C, 95% CI: 0.54-2.77, P = 0.64, neither a core temperature by sleep condition interaction effect (odds ratio 3.71 per °C, 95% CI: 0.56-24.54, P = 0.17). Of note, whereas these findings rule out the possibility that our skin temperature findings were secondary to core body temperature associations with vigilance they should not be interpreted as a evidence against such association, because the current protocol was tuned to the detection of faster fluctuations that do not normally occur at rest in core body temperature.
DISCUSSION
In this study we set out to uncover how SD affects the different skin temperature gradients that can be measured over the human body, as well as their association with sustained attention, under conditions of the upright seated posture that we normally maintain trying to keep awake after SD.
Our first main finding was that SD induces a dissociation between skin temperature gradients. SD induces an overall enhanced heat loss activation as measured from the foot-to-leg gradient, while it attenuates heat loss activation as measured from the hand-to-arm gradient. The larger negative hand-to-arm gradient suggests an augmented sympathetic tone resulting in vasoconstriction of the hand, whereas the less negative foot-to-leg gradient indicates an attenuated sympathetic tone, resulting in a release from vasoconstriction of the feet.
Most amazingly, this dissociation was even present for the fluctuations occurring within a day. Although the changes in distal-to-proximal temperature gradients that reflect fluctuations in thermoregulatory heat loss normally occur in synchrony,36 SD caused them to fluctuate in antiphase. SD thus disrupts coordinated sympathetic control of skin blood flow of the hands and feet. Activation of heat loss from the feet in the presence of activation of heat preservation from the hands may thus be a most characteristic skin temperature profile signature of being sleep deprived.
The current findings differ from earlier reports of the effect of SD on either foot temperature37 or on the average temperature of hands and feet.11 The essential difference of the current study is that participants were measured in a constant upright seated position to allow for extrapolation to everyday life situations, whereas sleep-deprived people try to stay awake and maintain optimal operational control by keeping an upright rather than the supine posture individuals had to maintain in previous studies.11,37 The marked discrepancy between the previous work on thermoregulation in a supine position and our current findings in an upright seated position actually help to pinpoint, as a likely candidate for the critical underlying mechanism involved, the competition between thermoregulation and the regulation of blood pressure. If people change from a supine to an upright position, an orthostatic challenge is induced and vasoconstriction of the lower part of the body is required to maintain blood flow in the upper part of the body within acceptable limits. This is accomplished by an increase in sympathetic tone. In sleep-deprived people in an upright position, but not in a supine position, the necessity of this increase has to compete with the tendency for a decrease in sympathetic tone innervating the vascular bed that has been reported after SD.38,39 Our findings suggest that insufficient vasoconstriction may cause some venous pooling in the legs and the associated increase in DPG, and thereby some insufficiency in the perfusion of upper parts of the body including the arms, in turn resulting in a relative decrease in DPG. The proposed mechanism would also account for the intriguing finding of anticorrelated fluctuations in the hand-to-arm and foot-to-leg gradients. Our findings indicate that it is important to consider body posture and if possible manipulate them in fundamental studies on thermoregulation and vigilance after sleep deprivation. For practical generalizability to everyday life situations, a sitting position seems more appropriate.
Our second main finding is that sleep history affects the predictive value of skin temperature gradients to estimate vigilance. The gradient measured between ear and mastoid, however, remained most robustly valuable for this purpose, significantly predicting reaction speed and lapse probability irrespective of whether individuals experienced NS, were sleep deprived, or in case sleep history is unknown. The use of video monitoring allowed us to strictly detect lapses that occurred while participants actually looked at the target area while discarding no responses in association with eye closure or looking away from the target area.33 In spite of this strict criterion, on average 86 ± 4% (mean ± standard error) of the data points for a participant were valid. Given the large number of data points (2 days × 5 blocks × 120 = 1,200 stimuli for each participant), the loss of 14% of the data hardly affected the statistical power of the current study, whereas the procedure enhances the interpretability of the results. Accordingly, lapses reported here indicate a failure of the brain to timely process the stimuli, not lapses resulting from being distracted, blinking, or closing the eyes, which are inevitable in a tediously monotonous task that is fully dependent on top-down attention for 20 min.
Some limitations of the current study need to be addressed. First, overnight SD was implemented at home, unsupervised. Ideally, SD should be supervised continuously and include polysomnography. Only such a protocol would allow quantification of actual amount of time spent asleep, including microsleeps. However, our use of actigraphy, with a sensitive sleep detection threshold, makes it very likely that the participants spent the night fully awake; the one participant in whom actigraphy suggested a period of more than 10 min of continued inactivity was excluded.27 The profile of immobility bout durations during the SD night closely resembled the profile seen during a normal wake day, whereas it is known that actigraphy is highly sensitive to the detection of naps and overestimates rather than underestimates sleep.26 Close examination of the actigraphic recordings suggested that all participants refrained from exercise, as requested. Our study cannot however fully ascertain abstinence of caffeine and other stimulants and had to trust on subjective confirmation.
The statistical power of the protocol also should be discussed. As demonstrated by the findings, our protocol was extremely well powered to statistically detect even very subtle within-subject associations and effects because of the availability of a maximum of 9,600 pairs of data points (2 days × five blocks × 120 stimuli × eight participants). It should be considered that our protocol may have missed small effects of SD on skin temperature and its association with performance that are less general to all people, but could occur in some. Larger studies including considerably more than eight participants would be required if one would also be interested in the effects and associations that are less generalizable to all.
Possible limitations of the adapted constant routine protocol also should be discussed. Theoretically, skin temperature might respond to the scheduled intake of food and drinks as well as the brief physical activity and postural change associated with restroom visits. As is habitual for constant routine protocols, food and fluids were given in small amounts with equal and low caloric values.40,41 Previous studies on the effect of meals on skin temperature usually evaluated the effect of meals containing at least five times the calories of our combined food and fluid intake. Even then they frequently failed to find systematic effects on skin temperature,42–44 rendering systematic effects of the low calorie intake in our study unlikely. For the scheduled visits to the restroom, which was part of the laboratory space with equal environmental light and temperature, participants got up, walked 5 m, sat down again for 10 min, got up, walked back to the research chair, and sat down again. This procedure thus twice required approximately 5 sec of being upright and walking. The associated short lasting postural changes are unlikely to affect skin temperature during the later vigilance assessment: whereas changes between supine and upright postures affect skin temperature considerably,40,45 the mean skin temperatures of the two upright postures of sitting and standing are equal.45 The associated physical activity of twice approximately 5 sec is equally unlikely to affect skin temperature during the later vigilance assessment; first, the activity required is marginal both in duration and intensity and second, the effect of physical activity on skin temperature shows an inverted u profile, slowly increasing to peak after a lag of approximately 10 min, to subsequently decline again.29 No effect can be expected at the onset of the vigilance task, which is 35 min after moving to the restroom and 25 min after moving back to the laboratory room. In summary, systematic effects of calorie intake and changes in posture and activity are unlikely. Although other procedures, such as the use of blood lines, catheters, and bed pans, may be applied, they may induce stress and affect skin temperature accordingly. Future studies may consider random sampling in the natural environment using a combination of ambulatory physiologic and environmental monitoring and mobile computer-based experience sampling and performance assessment.
To our knowledge, this is the first time the gradient between ear and mastoid was used in a study on the association between thermoregulation and vigilance. Further research on applicability of this novel finding seems warranted. Given the recent advances in micro-electronics it should not be too difficult to incorporate sensors to measure ear and mastoid temperatures in devices such as hearing aids and wireless headsets, and evaluate whether they may aid in vigilance assessment, for example during car driving.
In conclusion, the current study showed that SD disturbs coordinated thermoregulatory responses between the lower and middle part of the body. The specific thermoregulatory profile of sleep-deprived people is marked by a relative increase in heat loss from the lower limbs, a relative decrease of heat loss from the upper limbs, and anticorrelated fluctuations between these two. Future studies should further evaluate how SD affects competitive needs for thermoregulation and blood pressure regulation. The findings moreover warrant further research on the possibility that the gradient between ear and mastoid temperature may be of value to aid vigilance estimates under both well-rested and sleep-deprived conditions.
DISCLOSURE STATEMENT
This was not an industry supported study. The authors have indicated no financial conflicts of interest.
ACKNOWLEDGMENTS
The authors thank Paul Groot, Academic Medical Center of the University of Amsterdam, for his help with adaptation of the psychomotor vigilance task. This research was Funded by the Technology Foundation STW, Utrecht, Perspective NeuroSIPE Project 10738, and by the Netherlands Organization of Scientific Research, The Hague, VICI Innovation Grant 453-07-001.
REFERENCES
- 1.Everson CA, Gilliland MA, Kushida CA, et al. Sleep deprivation in the rat: IX. Recovery. Sleep. 1989;12:60–7. [PubMed] [Google Scholar]
- 2.Wright KP, Jr, Hull JT, Czeisler CA. Relationship between alertness, performance, and body temperature in humans. Am J Physiol. 2002;283:R1370–7. doi: 10.1152/ajpregu.00205.2002. [DOI] [PubMed] [Google Scholar]
- 3.Kräauchi K, Cajochen C, Werth E, Wirz-Justice A. Warm feet promote the rapid onset of sleep. Nature. 1999;401:36–7. doi: 10.1038/43366. [DOI] [PubMed] [Google Scholar]
- 4.Kräuchi K, Cajochen C, Werth E, Wirz-Justice A. Functional link between distal vasodilation and sleep-onset latency? Am J Physiol. 2000;278:R741–8. doi: 10.1152/ajpregu.2000.278.3.R741. [DOI] [PubMed] [Google Scholar]
- 5.Fronczek R, Raymann R, Romeijn N, et al. Manipulation of core body and skin temperature improves vigilance and maintenance of wakefulness in narcolepsy. Sleep. 2008;31:233–40. doi: 10.1093/sleep/31.2.233. [DOI] [PMC free article] [PubMed] [Google Scholar]
- 6.Raymann RJEM, Swaab DF, Van Someren EJW. Cutaneous warming promotes sleep onset. Am J Physiol. 2005;288:R1589–97. doi: 10.1152/ajpregu.00492.2004. [DOI] [PubMed] [Google Scholar]
- 7.Raymann RJEM, Van Someren EJW. Time-on-task impairment of psychomotor vigilance is affected by mild skin warming and changes with aging and insomnia. Sleep. 2007;30:96–103. doi: 10.1093/sleep/30.1.96. [DOI] [PubMed] [Google Scholar]
- 8.Romeijn N, Van Someren EJW. Correlated fluctuations of daytime skin temperature and vigilance. J Biol Rhythms. 2011;26:68–77. doi: 10.1177/0748730410391894. [DOI] [PubMed] [Google Scholar]
- 9.Podtaev S, Morozov M, Frick P. Wavelet-based correlations of skin temperature and blood flow oscillations. Cardiovasc Eng. 2008;8:185–9. doi: 10.1007/s10558-008-9055-y. [DOI] [PubMed] [Google Scholar]
- 10.Van Someren EJW. Mechanisms and functions of coupling between sleep and temperature rhythms. Prog Brain Res. 2006;153:309–24. doi: 10.1016/S0079-6123(06)53018-3. [DOI] [PubMed] [Google Scholar]
- 11.Kräuchi K, Wirz-Justice A. Circadian rhythm of heat production, heart rate, and skin and core temperature under unmasking conditions in men. Am J Physiol. 1994;267:R819–29. doi: 10.1152/ajpregu.1994.267.3.R819. [DOI] [PubMed] [Google Scholar]
- 12.Fronczek R, Overeem S, Lammers GJ, Van Dijk JG, Van Someren EJW. Altered skin temperature regulation in narcolepsy relates to sleep propensity. Sleep. 2006;29:1444–9. doi: 10.1093/sleep/29.11.1444. [DOI] [PubMed] [Google Scholar]
- 13.Lim J, Dinges DF. A meta-analysis of the impact of short-term sleep deprivation on cognitive variables. Psychol Bull. 2010;136:375–89. doi: 10.1037/a0018883. [DOI] [PMC free article] [PubMed] [Google Scholar]
- 14.Kräuchi K, Knoblauch V, Wirz-Justice A, Cajochen C. Challenging the sleep homeostat does not influence the thermoregulatory system in men: evidence from a nap vs. sleep deprivation study. Am J Physiol. 2006;290:R1052–61. doi: 10.1152/ajpregu.00381.2005. [DOI] [PubMed] [Google Scholar]
- 15.Brothers RM, Wingo JE, Hubing KA, Crandall CG. Methodological assessment of skin and limb blood flows in the human forearm during thermal and baroreceptor provocations. J Appl Physiol. 2010;109:895–900. doi: 10.1152/japplphysiol.00319.2010. [DOI] [PMC free article] [PubMed] [Google Scholar]
- 16.Rechtschaffen A, Bergmann BM, Everson CA, Kushida CA, Gilliland MA. Sleep deprivation in the rat: X. Integration and discussion of the findings. 1989. Sleep. 2002;25:68–87. [PubMed] [Google Scholar]
- 17.Landis CA, Savage MV, Lentz MJ, Brengelmann GL. Sleep deprivation alters body temperature dynamics to mild cooling and heating not sweating threshold in women. Sleep. 1998;21:101–8. doi: 10.1093/sleep/21.1.101. [DOI] [PubMed] [Google Scholar]
- 18.Opstad PK, Bahr R. Reduced set-point temperature in young men after prolonged strenuous exercise combined with sleep and energy deficiency. Arctic Med Res. 1991;50:122–6. [PubMed] [Google Scholar]
- 19.Young AJ, Castellani JW, O'Brien C, et al. Exertional fatigue, sleep loss, and negative energy balance increase susceptibility to hypothermia. J Appl Physiol. 1998;85:1210–7. doi: 10.1152/jappl.1998.85.4.1210. [DOI] [PubMed] [Google Scholar]
- 20.Savourey G, Bittel J. Cold thermoregulatory changes induced by sleep deprivation in men. Eur J Appl Physiol. 1994;69:216–20. doi: 10.1007/BF01094791. [DOI] [PubMed] [Google Scholar]
- 21.Soldatos CR, Dikeos DG, Paparrigopoulos TJ. Athens Insomnia Scale: validation of an instrument based on ICD-10 criteria. J Psychosom Res. 2000;48:555–60. doi: 10.1016/s0022-3999(00)00095-7. [DOI] [PubMed] [Google Scholar]
- 22.Buysse DJ, Reynolds CFD, Monk TH, Berman SR, Kupfer DJ. The Pittsburgh Sleep Quality Index: a new instrument for psychiatric practice and research. Psychiatry Res. 1989;28:193–213. doi: 10.1016/0165-1781(89)90047-4. [DOI] [PubMed] [Google Scholar]
- 23.Douglass AB, Bornstein R, Nino-Murcia G, et al. The Sleep Disorders Questionnaire. I: Creation and multivariate structure of SDQ. Sleep. 1994;17:160–7. doi: 10.1093/sleep/17.2.160. [DOI] [PubMed] [Google Scholar]
- 24.Johns MW. A new method for measuring daytime sleepiness: the Epworth Sleepiness Scale. Sleep. 1991;14:540–5. doi: 10.1093/sleep/14.6.540. [DOI] [PubMed] [Google Scholar]
- 25.Dinges DF, Powell JW. Microcomputer analyses of performance on a portable, simple visual RT task during sustained operations. Behav Res Methods Instr Comput. 1985;17:652–5. [Google Scholar]
- 26.Kanady JC, Drummond SP, Mednick SC. Actigraphic assessment of a polysomnographic-recorded nap: a validation study. J Sleep Res. 2011;20:214–22. doi: 10.1111/j.1365-2869.2010.00858.x. [DOI] [PubMed] [Google Scholar]
- 27.Lötjönen J, Korhonen I, Hirvonen K, Eskelinen S, Myllymaki M, Partinen M. Automatic sleep-wake and nap analysis with a new wrist worn online activity monitoring device vivago WristCare. Sleep. 2003;26:86–90. [PubMed] [Google Scholar]
- 28.Wardell K, Braverman IM, Silverman DG, Nilsson GE. Spatial heterogeneity in normal skin perfusion recorded with laser-Doppler imaging and flowmetry. Microvasc Res. 1994;48:26–38. doi: 10.1006/mvre.1994.1036. [DOI] [PubMed] [Google Scholar]
- 29.van Marken Lichtenbelt WD, Daanen HAM, Wouters L, et al. Evaluation of wireless determination of skin temperature using iButtons. Physiol Behav. 2006;88:489–97. doi: 10.1016/j.physbeh.2006.04.026. [DOI] [PubMed] [Google Scholar]
- 30.Rubinstein EH, Sessler DI. Skin-surface temperature gradients correlate with fingertip blood flow in humans. Anesthesiology. 1990;73:541–5. [PubMed] [Google Scholar]
- 31.Blankfield RP. The thermoregulatory-vascular remodeling hypothesis: an explanation for essential hypertension. Med Hypotheses. 2006;66:1174–8. doi: 10.1016/j.mehy.2005.12.014. [DOI] [PubMed] [Google Scholar]
- 32.Santhi N, Horowitz TS, Duffy JF, Czeisler CA. Acute sleep deprivation and circadian misalignment associated with transition onto the first night of work impairs visual selective attention. PLoS One. 2007;2:10. doi: 10.1371/journal.pone.0001233. [DOI] [PMC free article] [PubMed] [Google Scholar]
- 33.Anderson C, Wales AWJ, Horne JA. PVT lapses differ according to eyes open, closed, or looking away. Sleep. 2010;33:197–204. doi: 10.1093/sleep/33.2.197. [DOI] [PMC free article] [PubMed] [Google Scholar]
- 34.Petkova E, Teresi J. Some statistical issues in the analyses of data from longitudinal studies of elderly chronic care populations. Psychosom Med. 2002;64:531–47. doi: 10.1097/00006842-200205000-00018. [DOI] [PubMed] [Google Scholar]
- 35.Twisk JWR. Applied longitudinal data analysis for epidemiology. Cambridge: Cambridge University Press, ; 2003. [Google Scholar]
- 36.Stoner HB, Barker P, Riding GS, Hazlehurst DE, Taylor L, Marcuson RW. Relationships between skin temperature and perfusion in the arm and leg. Clin Physiol. 1991;11:27–40. doi: 10.1111/j.1475-097x.1991.tb00651.x. [DOI] [PubMed] [Google Scholar]
- 37.Holmes AL, Burgess HJ, Dawson D. Effects of sleep pressure on endogenous cardiac autonomic activity and body temperature. J Appl Physiol. 2002;92:2578–84. doi: 10.1152/japplphysiol.01106.2001. [DOI] [PubMed] [Google Scholar]
- 38.Kato M, Phillips BG, Sigurdsson G, Narkiewicz K, Pesek CA, Somers VK. Effects of sleep deprivation on neural circulatory control. Hypertension. 2000;35:1173–5. doi: 10.1161/01.hyp.35.5.1173. [DOI] [PubMed] [Google Scholar]
- 39.Ogawa Y, Kanbayashi T, Saito Y, et al. Total sleep deprivation elevates blood pressure through arterial Baroreflex resetting: a study with microneurographic technique. Sleep. 2003;26:986–9. doi: 10.1093/sleep/26.8.986. [DOI] [PubMed] [Google Scholar]
- 40.Kräuchi K, Cajochen C, Wirz-Justice A. A relationship between heat loss and sleepiness: effects of postural change and melatonin administration. J Appl Physiol. 1997;83:134–9. doi: 10.1152/jappl.1997.83.1.134. [DOI] [PubMed] [Google Scholar]
- 41.Kräuchi K, Pache M, Von Arb M, Flammer J, Wirz Justice A. Infrared thermometry of finger and face skin temperatures after melatonin administration. Chronobiol Int. 2002;19:993–4. [Google Scholar]
- 42.Harada N, Iwamoto M, Laskar MS, et al. Effects of room temperature, seasonal condition and food intake on finger skin temperature during cold exposure test for diagnosing hand-arm vibration syndrome. Ind Health. 1998;36:166–70. doi: 10.2486/indhealth.36.166. [DOI] [PubMed] [Google Scholar]
- 43.Westerterp-Plantenga MS, Wouters L, ten Hoor F. Deceleration in cumulative food intake curves, changes in body temperature and diet-induced thermogenesis. Physiol Behav. 1990;48:831–6. doi: 10.1016/0031-9384(90)90235-v. [DOI] [PubMed] [Google Scholar]
- 44.Shlygin GK, Vasilevskaia LS, Popova Iu P, Fedortsova LP, Demin AV. [Thermal skin reaction to food intake and its changes in certain forms of obesity] Klinicheskaia Meditsina. 1999;77:25–9. [PubMed] [Google Scholar]
- 45.Tikuisis P, Ducharme MB. The effect of postural changes on body temperatures and heat balance. Eur J Appl Physiol. 1996;72:451–9. doi: 10.1007/BF00242275. [DOI] [PubMed] [Google Scholar]