

Abstract
Senescence is genetically controlled and activated in mature tissues during aging. However, immature plant tissues also display senescence-like symptoms when continuously exposed to adverse energy-depleting conditions. We used detached dark-held immature inflorescences of Arabidopsis (Arabidopsis thaliana) to understand the metabolic reprogramming occurring in immature tissues transitioning from rapid growth to precocious senescence. Macroscopic growth of the detached inflorescences rapidly ceased upon placement in water in the dark at 21°C. Inflorescences were completely degreened by 120 h of dark incubation and by 24 h had already lost 24% of their chlorophyll and 34% of their protein content. Comparative transcriptome profiling at 24 h revealed that inflorescence response at 24 h had a large carbon-deprivation component. Genes that positively regulate developmental senescence (ARABIDOPSIS NAC DOMAIN CONTAINING PROTEIN92) and shade-avoidance syndrome (PHYTOCHROME INTERACTING FACTOR4 [PIF4] and PIF5) were up-regulated within 24 h. Mutations in these genes delayed degreening of the inflorescences. Their up-regulation was suppressed in dark-held inflorescences by glucose treatment, which promoted macroscopic growth and development and inhibited degreening of the inflorescences. Detached inflorescences held in the dark for 4 d were still able to reinitiate development to produce siliques upon being brought out to the light, indicating that the transcriptional reprogramming at 24 h was adaptive and reversible. Our results suggest that the response of detached immature tissues to dark storage involves interactions between carbohydrate status sensing and light deprivation signaling and that the dark-adaptive response of the tissues appears to utilize some of the same key regulators as developmental senescence.
Senescence is a genetically controlled program usually activated to degrade macromolecules and mobilize nutrients in an orderly manner from dying parts of the plant to growing parts (Lim et al., 2007). Although evolutionarily selected for and important for plant fitness, precocious activation of senescence can compromise the yield of crop plants and impact the quality of harvested produce (Nam, 1997; Buchanan-Wollaston et al., 2003).
Many studies on senescence have focused on leaves and have shown that developmental leaf senescence is associated with distinctive structural and biochemical changes that reflect the transition in mature tissues from anabolic to catabolic metabolism. Chloroplasts disassemble early and well before degreening is seen. The nucleus and mitochondria remain intact until the final stages of senescence to provide instructions and energy, respectively, for completion of the program (Lim et al., 2007). Leaf senescence is accompanied by a change in a number of physiological, biochemical, and molecular markers. These include a decline in chlorophyll, protein, fatty acid, and RNA content, a decrease in photochemical efficiency, and increases in membrane ion leakage and certain senescence-associated genes (SAGs; Lim et al., 2007).
Past studies have also indicated that senescence can be precociously activated in detached leaf tissues by darkness. This led researchers to try to model natural leaf senescence in the dark-detached system (Thimann, 1980). However, its relevance for natural senescence was questioned when it was found that the senescence program induced in dark-held leaves was not identical to what occurs during natural leaf senescence (Becker and Apel, 1993; Weaver et al., 1998). It is now clear from transcriptome profiling that the senescence program occurring in developmentally senescing leaves is different from that in detached dark-held leaves (Buchanan-Wollaston et al., 2005; van der Graaff et al., 2006). For example, only 53% of the 827 senescence-induced genes identified by Buchanan-Wollaston et al. (2005) were up-regulated by 3-fold or more in leaves of whole plants held in the dark, and only 22% of the developmental senescence-enhanced mRNA transcripts identified by van der Graaff et al. (2006) were similarly increased by 3-fold or more in detached leaves held in the dark or in individual leaves induced to senesce by shading.
Despite the significant transcriptome differences in the development- and dark-induced senescence programs, genetic loci have been found that regulate the timing of senescence in both programs (Oh et al., 1997). For example, knockout of the F-box gene ORESARA9 (ORE9; Woo et al., 2001), overexpression of C-REPEAT/DRE BINDING FACTOR2 (CBF2) (Sharabi-Schwager et al., 2010), and a gain in function of ORESARA12-1/ARABIDOPSIS HISTIDINE KINASE3 (AHK3; Kim et al., 2006) all affect the timing of both senescence programs. In addition, some of the key regulators are themselves SAGs. For example, the transcription factors Arabidopsis NAC DOMAIN CONTAINING PROTEIN29/NAC-LIKE ACTIVATED BY AP3/PI (ANAC029/AtNAP; Guo and Gan, 2006) and ANAC092/ORE1/AtNAC2 (Kim et al., 2009) are both up-regulated during development- and dark-induced senescence and positively regulate the timing of both senescence programs. These findings illustrate that significant cross talk exists between both senescence programs and that research in dark-detached systems can provide insights into the biology behind both senescence programs.
Detachment and dark storage also causes premature senescence of complex immature floral structures that would normally be rapidly growing and strong sinks for nutrient influx (Eason et al., 2005; Gapper et al., 2005). This dramatic cessation of growth and transition to senescence has been studied in a number of harvested vegetables, such as asparagus (Asparagus officinalis) and broccoli (Brassica oleracea), because of their commercial relevance (McKenzie et al., 2004; Chen et al., 2008). It is now known, for example, that broccoli florets, despite their structural complexity, undergo many of the same physiological and biochemical changes seen in developmentally senescing leaves, such as loss of chlorophyll, protein, and fatty acids (Page et al., 2001), and that sugar deprivation may be one of the major stresses in florets of dark-stored harvested broccoli heads, as the florets lose approximately 50% of their Suc within 6 h of the head being detached (Downs et al., 1997). Degreening of the floral head also appears to be influenced by interorgan signaling in the complex floret tissue, as the timing was delayed when the stamens were physically removed (Tian et al., 1995).
We are interested in understanding the metabolic reprogramming that occurs in immature floret tissues when their normal development is suddenly arrested by harvest and dark storage. We chose Arabidopsis (Arabidopsis thaliana) as our model because of the advantages it has over the commercially relevant crop species. These include its small physical size, the small size of its genome, the availability of large mutant collections for gene function screening, and the large number of bioinformatic tools developed for it.
In this paper, we show that detached dark-held immature inflorescences of Arabidopsis are a valuable research tool for understanding the metabolic program associated with complex young growing structures as they developmentally arrest and transition to senescence. We show that despite their apparent complexity, the detached inflorescences show many similarities in their transcriptomic response at 24 h to that of attached leaves of whole plants held in the dark. We show that this response is adaptive and driven by the interaction of both carbon-deprivation and light-deprivation signals.
RESULTS
Darkness Causes Developmental Arrest and Degreening of Detached Immature Inflorescences
The detached immature inflorescences of Arabidopsis ecotype Landsberg erecta continued to develop like their attached counterparts if the inflorescences were held in a 16-h photoperiod (100 µmol m−2 s−1) at 21°C (Fig. 1A). However, when the detached inflorescences were held in the dark, their growth ceased (no pedicel or stem elongation or floret opening) and the inflorescences degreened over a 5-d period (Fig. 1B). The timing of inflorescence degreening was not affected by plant age for the majority of the life of the plant. However, inflorescences from old plants (stage 6.5, when 50% of flowers to be produced have opened; Boyes et al., 2001) were yellower preharvest and degreened earlier when detached and held in the dark. Hence, there was a large developmental window from which inflorescences could be harvested and show similar timing of degreening. For consistency, however, we preferentially chose to work on detached dark-held inflorescences excised from the primary bolts of plants at stage 6.0.
Figure 1.

Arabidopsis inflorescences developmentally arrest and show symptoms of senescence when detached and held in the dark. Ecotype Landsberg erecta inflorescences were harvested from plants grown in a 16-h photoperiod and placed with their cut ends in water at 21°C. A, Detached inflorescences held in a 16-h photoperiod. B, Detached inflorescences held in darkness. C, Senescence parameters were measured for dark-held inflorescences. Chlorophyll (µg mg−1 fresh weight) and protein (µg mg-1 fresh weight) contents were expressed as percentages of their initial measurements. D0, Day 0. Error bars indicate the se of three to six biological replicates.
Degreening Is Associated with Changes in Three Hallmarks of Senescence
Inflorescence degreening was associated with changes in chlorophyll content, protein content, and ion leakage (Fig. 1C). The chlorophyll content of the inflorescences declined by approximately 20% within 1 d of the inflorescences being placed in the dark and continued to fall steadily so that by day 5, chlorophyll levels were approximately 5% of the initial values. Likewise, the soluble protein content of the inflorescences was lower after 1 d of dark incubation and continued to decline to be approximately 30% of the original protein content by day 5. By contrast, membrane permeability of the inflorescences, as judged by relative electrolyte leakage, increased over the 5 d examined.
Timing of Degreening Is Altered by Hormonal Treatments and Regulated by Genes That Control Developmental Senescence
Treatment of the detached dark-held inflorescences with the cytokinin 6-benzylaminopurine significantly delayed their degreening, whereas treatment with abscisic acid (ABA) significantly accelerated the process (Fig. 2; Supplemental Fig. S1). Dark-induced inflorescence degreening was also delayed in four ethyl methanesulfonate-generated Arabidopsis lines (ore1, ore3, ore9, and ore12-1; Fig. 3) which have defects in ANAC092, ETHYLENE INSENSITIVE2 (EIN2), MORE AXILLARY BRANCHES2 (MAX2) and AHK3, respectively. These lines also show delayed developmental senescence (Woo et al., 2001; Kim et al., 2009). The percentage chlorophyll retained in all four mutants at day 5 was not significantly different from that in the control at day 3, indicating that mutations in each of the genes delayed degreening by 2 d.
Figure 2.
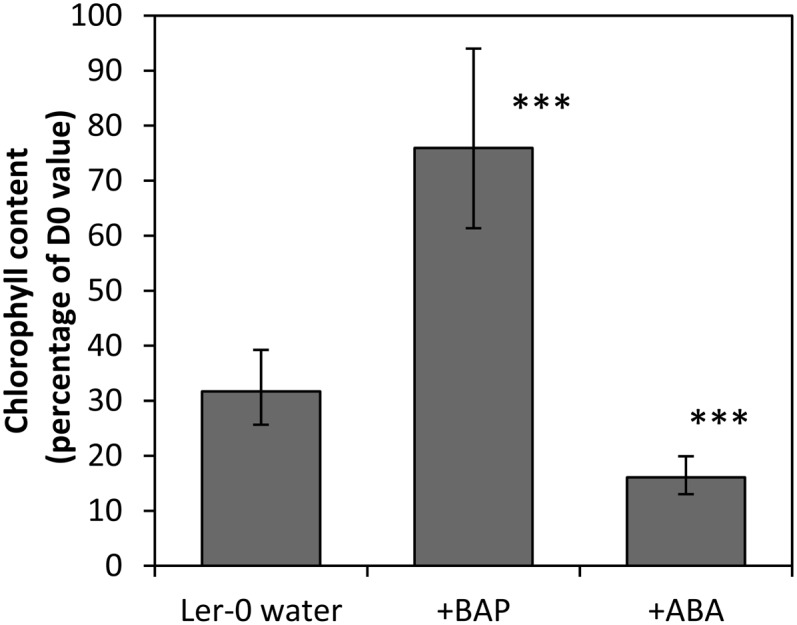
The timing of inflorescence degreening is altered by hormone application. Landsberg erecta (Ler-0) inflorescences were detached and placed in the dark for 3 d with their cut ends in water or in solutions containing 100 μm 6-benzylaminopurine (BAP) or 100 μm ABA. Mean chlorophyll levels (as a percentage of day 0 [D0]) are shown for five replicates at day 3. Error bars are 95% confidence intervals for the mean. ***Treatments were significantly different from the Landsberg erecta untreated control (P < 0.001).
Figure 3.

Inflorescence degreening is controlled by genes that regulate the timing of developmental leaf senescence. Detached inflorescences were held in the dark for 0, 3, and 5 d, and chlorophyll content was determined and expressed as a percentage of initial content at day 0 (D0). CS859988 (ANAC092 T-DNA insertion line). Mean chlorophyll levels (as a percentage of day 0) are shown for four to seven inflorescences for six lines at days 3 and 5 (D3 and D5). Error bars are 95% confidence intervals for the mean. All lines on both days 3 and 5 were significantly different from the ecotype Columbia (Col-0) line (P < 0.001), except for CS859988 on day 3, which was significantly different at P = 0.01.
mRNA Abundance of 6.8% of the Inflorescence Transcriptome Is Changed by 3-Fold or More at 24 h of Dark Incubation
Microarray profiling revealed the molecular changes occurring in the detached immature inflorescences held in the dark for 24 h. The time point of 24 h was chosen to provide insight into the transcriptional reprogramming occurring when physiological symptoms of senescence were starting to manifest and to minimize circadian effects on transcript abundance. For simplicity, the terms induction/repression, or up/down-regulation, are used for comparing changes in the mRNA abundance measured by the microarray from 0 to 24 h, although it is acknowledged that mRNA abundance can be altered by regulatory mechanisms other than changes in gene promoter activity.
Of the 22,810 normalized genes (Supplemental Table S1) represented in the averaged microarray data, approximately 11%, or 2,096 genes, showed a significant (P ≤ 0.05) 1.8-fold or more change in the inflorescences at 24 h (Supplemental Table S2). However, in line with other senescence-related microarray studies (Buchanan-Wollaston et al., 2005; van der Graaff et al., 2006), we used a conservative 3-fold change in transcript abundance as the cutoff to further reduce the number of false positives/negatives identified in the array. The mRNA abundance of 1,499 genes (6.8% of the transcriptome) changed 3-fold or more in the inflorescences in response to the 24-h dark treatment. Of the 1,499 genes, 51% (758) showed increased mRNA abundance (Supplemental Table S3) and 49% (741) showed decreased mRNA abundance (Supplemental Table S4).
Organ-Specific Transcriptome Response Is Identified in the Dark-Detached Inflorescences
Heat-map comparison of the 758 up-regulated and 741 down-regulated gene sets using Genevestigator V3 (Hruz et al., 2008; https://www.genevestigator.com) revealed that a pollen-specific gene set could be separated from the larger, more complex transcriptome response at 24 h (Fig. 4). This was despite macroscopic growth of the inflorescences having ceased (Fig. 1B). Their association with normal stamen/pollen development was strengthened by finding that methyl jasmonate was necessary for stamen/pollen development and that 12-oxo-phytodienoic acid (OPDA; a precursor of jasmonic acid) up-regulated these genes and restored fertility in the opda reductase3 (opr3) mutant (Stintzi and Browse, 2000; Mandaokar et al., 2006; Fig. 4).
Figure 4.

Inflorescence transcriptome changes are similar to those in Arabidopsis leaves developmentally senescing or given treatments that alter their carbohydrate status. Meta-analysis was performed in Genevestigator V3 on the sets of 758 up-regulated and 741-down-regulated inflorescence genes. Treatments that responded most similarly with the gene sets are shown. Individual genes are represented by colored vertical lines. Blue lines indicate increased transcript abundance and were obtained for pollen and the leaf developmental series using the Anatomy Tool. Red and green lines indicate increased and decreased transcript abundance, respectively, and were obtained using the Stimulus Tool. For full details of treatments and tissues used, see “Materials and Methods.” MeJa Late and OPDA Late indicate responses in stamens of opr3 mutants after treatment with either 0.03% methyl jasmonate or 0.03% OPDA for 22 h. Low CO2 indicates the response in leaves of whole rosettes illuminated at the end of the night for 4 h at 50 µL L−1 [CO2] compared with ambient 350 µL L−1 [CO2]. Glucose 4 h indicates the response in seedlings grown in liquid medium containing 0.5% Glc for 7 d, then in medium lacking Glc for 24 h, then in medium containing 3% Glc for 4 h. EX indicates the response in leaves of whole rosettes held after their 14-h dark cycle for extended periods in the dark.
Inflorescence Transcriptome Changes Are Similar to Those Occurring in Leaves Senescing Developmentally or Exposed to an Extended Night
Transcript abundance changes in the gene sets were most similar to those in attached leaves of whole plants held in a 24- to 48-h extended night and in leaves developmentally senescing (Fig. 4). According to the data set of Breeze et al. (2011), their up- and down-regulation in leaves occurs early in leaf development, well before leaf chlorophyll content is lost (Supplemental Fig. S2; Supplemental Tables S5 and S6). The regulation of the inflorescence gene sets was also similar to that in attached light-held leaves prevented from carbon fixing because of incubation in low CO2 and was opposite to that in leaves of light-held Glc-starved seedlings fed 3% Glc for 4 h. These two treatments (i.e. the 4-h low-CO2 treatment and the Glc-addition treatment) were used in this study as a measure of tissue carbohydrate status response.
The data behind the heat maps of Figure 4 revealed the numerical connections between the inflorescence responses and the above treatments. The 205 up-regulated pollen/stamen-associated genes were filtered out prior to analysis (Table I; Supplemental Table S7). The remaining 553 up-regulated and 741 down-regulated transcript abundance changes were mostly similar (69% and 63%, respectively) to those occurring in leaves of whole plants exposed to an extended night. The down-regulated gene set had more transcript abundance changes in common with developmental leaf senescence (57%) than did the up-regulated gene set (37%), which had more transcript abundance changes in common with the carbohydrate-affecting treatments Glc addition (57% versus 28%) and low CO2 (59% versus 38%). The inflorescences showed few transcript changes in common with rosette leaves illuminated at the end of the night in low CO2 (Table I; Supplemental Table S9).
Table I. Inflorescence transcriptome changes are similar to those in developing stamen/pollen, in developmentally senescing leaves, and in tissues whose carbohydrate status is altered.
The 758 up-regulated and 741 down-regulated genes were compared with data sets from hundreds of transcriptome studies using Genevestigator V3. The data sets whose transcript profiles most closely matched the changes in the detached dark-held inflorescences are shown. The pollen set was derived from gene transcripts whose accumulation in pollen was 2-fold or more greater than in mature leaf tissue and that showed less than 2-fold change in response to carbohydrate- or senescence-related signaling. Ext, Leaves of whole rosettes held for extended periods (as indicated) in the dark; Sen, developmentally senescing leaves; Glc, seedlings grown in liquid medium containing 0.5% Glc for 7 d, then in medium lacking Glc for 24 h, and then in medium containing 3% Glc for 4 h; CO2, intact rosette leaves illuminated at the end of night for 4 h at 50 µL L−1 versus 350 µL L−1 [CO2]; Light, intact rosette leaves held at 50 µL L−1 [CO2] in light versus 50 µL L−1 [CO2] in dark for 4 h at the end of the night. The percentage of inflorescence genes showing similarity in transcript accumulation with each specified data set is given in parentheses. Percentages for the up-regulated genes were calculated from the set of 553 non-pollen-associated genes, except for the pollen-associated genes (calculated from 758 genes).
| Regulation | Pollen | Ext Early (2 and 4 h) | Ext Mid (6 and 8 h) | Ext Late (24 and 48 h) | Sen | Glc | CO2 | Light |
|---|---|---|---|---|---|---|---|---|
| Up-regulated | 205 (27) | 191 (35) | 305 (55) | 380 (69) | 205 (37) | 313 (57) | 329 (59) | 31(6) |
| Down-regulated | 78 (11) | 327 (44) | 464 (63) | 422 (57) | 206 (28) | 282 (38) | 54(7) |
Specific Biological Processes Are Affected in the Dark-Detached Inflorescences
MapMan (http://mapman.gabipd.org/) and DAVID (http://david.abcc.ncifcrf.gov/) provided complementary statistical views into the enrichment of pathways, gene function, and organelle associations based on Gene Ontology and other functional annotation data. The detached dark-held inflorescences showed significant up-regulation of transcription factors, ethylene and ABA response, and amino acid-, lipid-, and ubiquitin-mediated protein degradation pathways and significant down-regulation of starch synthesis, glycolysis, amino acid synthesis, nucleotide metabolism, cytosolic ribosomal proteins, protein folding, photosynthesis (light reactions, Calvin cycle), chlorophyll synthesis, and histone synthesis (Tables II–IV; Supplemental Tables S10–S12). These categories were very similar to those identified in leaves of plants given an extended night (Usadel et al., 2008).
Table II. Assignment of the inflorescence transcriptome changes to functional categories using MapMan.
The 1,294 genes that changed 3-fold or more and that did not include the stamen/pollen-associated gene set were characterized. Functional categories showing a significant change (P ≤ 0.05) after correction for multiple testing by the Benjamini-Hochberg (BH) method are shown. Percentage indicates the number of up- or down-regulated genes expressed as a percentage of the total number of genes in each BIN. The complete list of genes for each category can be found in Supplemental Table S10.
| BIN | Functional Category | Percentage | BH-Adjusted P Value |
|---|---|---|---|
| Up-regulated gene functions | |||
| 27 | RNA | 66 | 4.21E-3 |
| 27.3 | RNA regulation of transcription | 77 | 4.21E-3 |
| 29.5 | Protein degradation | 73 | 1.76E-3 |
| 29.5.11 | Protein degradation, ubiquitin | 96 | 2.58E-8 |
| 29.5.11.4 | Protein degradation, ubiquitin E3 | 96 | 9.71E-8 |
| 29.5.11.4.2 | Protein degradation, ubiquitin E3 RING | 93 | 9.67E-4 |
| 29.5.11.4.3.2 | Protein degradation, ubiquitin E3 SCF F-box | 100 | 1.36E-2 |
| Down-regulated gene functions | |||
| 1 | Photosynthesis | 93 | 1.38E-2 |
| 28.1.3 | DNA synthesis, chromatin structure histone | 100 | 7.78E-3 |
Table IV. Assignment of transcripts whose abundance decreased 3-fold or more to functional categories using DAVID.
The 741 gene transcripts that declined in abundance 3-fold or more were characterized. Selected significantly enriched functional clusters are shown together with the term(s) most representative of each cluster. Only those term(s) showing a significant change (P ≤ 0.05) after correction for multiple testing by the Benjamini-Hochberg (BH) method are shown. Category, gene count, fold enrichment (FE), and BH values are for the term in the cluster indicated by the asterisk. For genes in each cluster, see Supplemental Table S12. %C is the percentage of transcripts in the term representative of the cluster that were affected by at least one of the treatments affecting tissue carbohydrate status.
| CES | Category | Term | FE | Gene Count | BH | %C |
|---|---|---|---|---|---|---|
| 21.95 | GOTERM_CC_FAT | Chloroplast | 1.9 | 248 | 9.9E-26 | 37 |
| 7.27 | GOTERM_BP_FAT | Protein folding*, chaperone | 3.5 | 30 | 3.5E-6 | 63 |
| 7.02 | GOTERM_CC_FAT | Ribosomal protein | 3.9 | 38 | 4.0E-10 | 71 |
| 6.83 | SP_PIR_KEYWORDS | Amino acid biosynthesis | 4.1 | 17a | 2.3E-3 | 53 |
| 5.56 | GOTERM_CC_FAT | Cell wall | 2.2 | 56 | 7.2E-7 | 57 |
| 4.99 | GOTERM_CC_FAT | Thylakoid | 2.4 | 50 | 1.8E-7 | 20 |
| 5.01 | SP_PIR_KEYWORDS | Nucleosome core*, histone core, DNA packaging | 11 | 14 | 9.7E-9 | 79 |
| 4.06 | GOTERM_BP_FAT | Starch biosynthetic process | 11 | 6 | 5.3E-3 | 33 |
| 3.62 | GOTERM_BP_FAT | Carbohydrate catabolic process, glycolysis* | 4.9 | 13 | 5E-4 | 46 |
| 3.25 | GOTERM_BP_FAT | Microtubule | 5.1 | 13 | 1.8E-4 | 31 |
| 2.83 | GOTERM_BP_FAT | Glucan catabolic process | 6.8 | 9 | 1.4E-3 | 44 |
| 2.46 | GOTERM_BP_FAT | Fatty acid metabolic process | 2.6 | 19 | 8.7E-3 | 53 |
| 2.43 | INTERPRO | Glycoside hydrolase*, subgroup, catalytic core | 3.5 | 17 | 9.0E-3 | 35 |
| 2.40 | GOTERM_MF_FAT | Transaminase activity | 5.0 | 9 | 4.8E-2 | 56 |
| 2.33 | SP_PIR_KEYWORDS | Chlorophyll biosynthesis | 8.2 | 6 | 2.2E-2 | 0 |
| 1.91 | GOTERM_MF_FAT | Flavoprotein*, FAD binding | 3.2 | 10 | 2.7E-2 | 40 |
| 1.87 | SP_PIR_KEYWORDS | Cell wall biogenesis/degradation | 2.3 | 17 | 2.6E-2 | 41 |
| 1.83 | GOTERM_CC_FAT | Mitochondrial matrix | 3.3 | 10 | 1.5E-2 | 80 |
| 1.80 | SP_PIR_KEYWORDS | Isomerase | 3.9 | 19 | 4.9E-5 | 19 |
| 1.78 | GOTERM_BP_FAT | DNA replication | 3.8 | 16 | 6.2E-4 | 81 |
Eleven genes identified by DAVID and a further six identified by MapMan were included.
The most enriched annotation cluster (cluster enrichment score of 21.95) identified by DAVID analysis was associated with chloroplast function and was found in the down-regulated gene set (Table IV; Supplemental Table S12). The term “chloroplast” contained 248 genes, which was by far the greatest number of genes found for any up- or down-regulated term (Table IV). Of the 248 genes, the protein products of 147 were able to be assigned to a particular chloroplast compartment using the comprehensive chloroplast proteome database AT_CHLORO (http://www.grenoble.prabi.fr/at_chloro/). Their locations and functions are shown in Supplemental Figure S3 and Supplemental Table S12.
Many Inflorescence Genes Up-Regulated in Common with Developmental Senescence Are Tissue Carbohydrate Status Responsive
Seventy-four percent (410 of 553) of the up-regulated genes and 43% (320 of 741) of the down-regulated genes were affected by at least one of the carbohydrate-altering treatments (Fig. 5; Supplemental Tables S7 and S8). The higher proportion of genes associated with carbohydrate response in the up-regulated gene set was reflected in the higher proportion of the carbohydrate-responsive genes being responsible for the enrichment of the biological themes seen in Table III. In contrast, the proportion of carbohydrate-responsive genes responsible for enrichment of the categories in the down-regulated gene set was less and more variable (Table IV).
Figure 5.

Transcript abundance of the majority of the senescence up-regulated genes is affected by tissue carbohydrate status. A, Treatments that affect the transcript abundance of the up-regulated gene set. B, Treatments that affect the transcript abundance of the down-regulated gene set. A 2-fold cutoff was used for transcript abundance response for the senescence, extended night, and carbohydrate-responding treatments. Full details of the treatments are presented in “Materials and Methods.” CO2UGLC, Transcript changes in common with leaves of rosettes illuminated at the end of the night for 4 h at 50 µL L−1 [CO2] combined with transcript changes that changed oppositely in response to the addition of 3% Glc for 4 h to Glc-starved seedlings; EXT, transcript changes in leaves of whole plants exposed to a combined 24- and 48-h extended night; INF, inflorescence; SEN, transcript changes in developmentally senescent leaf.
Table III. Assignment of transcripts whose abundance increased 3-fold or more to functional categories using DAVID.
The 553 non-pollen-associated gene transcripts that increased in abundance 3-fold or more were characterized. Cluster enrichment scores (CES) for selected significantly enriched functional clusters are shown together with the term(s) most representative of each cluster. Only significantly enriched clusters that contained terms showing a significant change (P ≤ 0.05) after correction for multiple testing by the Benjamini-Hochberg (BH) method are shown, and only significantly changed terms in the cluster are shown. Category, gene count, fold enrichment (FE), and BH values are for the term indicated by the asterisk. The list of genes associated with the most represented terms is shown in Supplemental Table S11. %C is the percentage of transcripts affected by at least one treatment that affects tissue carbohydrate status.
| CES | Category | Term | FE | Gene Count | BH | %C |
|---|---|---|---|---|---|---|
| 4.35 | GOTERM_BP_FAT | Transcription factor activity | 1.9 | 68 | 6.7E-5 | 69 |
| 4.18 | GOTERM_BP_FAT | Response to abiotic stimulus*, response to salt stress, response to osmotic stress, response to ABA stimulus | 1.8 | 46 | 1.8E-2 | 78 |
| 4.16 | GOTERM_BP_FAT | Response to hormone stimulus | 2.3 | 46 | 8.1E-5 | 78 |
| 2.02 | GOTERM_BP_FAT | Response to ethylene stimulus | 3.4 | 19 | 2.2E-3 | 84 |
| 2.01 | SMART | RING | 2.0 | 24 | 4.3E-2 | 79 |
| 1.75 | GOTERM_BP_FAT | Cellular amino acid catabolic process | 7.3 | 7 | 2.4E-2 | 100 |
Many of the senescence-responsive genes in the up-regulated gene set were commonly regulated by at least one of the carbohydrate-altering treatments (72%; [122 + 25] of 205; Fig. 5A). By contrast, the majority of the senescence down-regulated genes had more in common with the transcript changes in leaves of plants given the 24- to 48-h extended night (80%; [190 + 149] of 422) than they did with the carbohydrate-altering treatments (44%; [149 + 35] of 422; Fig. 5B). Again, this was reflected in the enrichment of the biological themes, where, for instance, of the 177 chloroplast-associated genes regulated in common with developmental senescence (Supplemental Table S12), 92% (162 of 177) were similarly down-regulated in leaves of plants given a 24- to 48-h extended night, whereas only 30% (53 of 177) were commonly regulated by the carbohydrate-affecting treatments (Supplemental Table S12).
Quantitative Real-Time-PCR Confirms a Meta-Analysis View of the Effect of Tissue Carbohydrate Status on SAG Expression
To provide confidence that the carbohydrate-mediated regulation suggested by the meta-analysis was true for the detached dark-held inflorescences, we performed quantitative real-time (qRT)-PCR on genes of the detached inflorescences held in water in light for 24 h, in dark for 24 h, or in dark for 24 h in water supplemented with 3% Glc. Prior to qRT-PCR, we tested the efficacy of Glc uptake by the inflorescences. Holding detached inflorescences in the dark for 24 h significantly reduced their Glc content by 45% (P < 0.05; Fig. 6). Treatment of the inflorescences with 3% Glc for 24 h prevented this decline and actually elevated their Glc content approximately 3-fold compared with that at harvest. When inflorescences were held in continuous light for 24 h, they also showed higher content of Glc (approximately 2.2-fold), presumably because the freshly detached inflorescences had been detached for analysis 11 h into their 16-h light cycle. The Glc content of the light-held and dark + Glc-held inflorescences at 24 h was not significantly different (P = 0.63).
Figure 6.

Treatment of detached dark-held inflorescences (D) with 3% Glc (G) prevents the loss of Glc content at 24 h. *0- and 24-h dark significantly different at P < 0.05; ns24-h dark + Glc not significantly different from 24-h light (L). Data are means ± se of five pooled Landsberg erecta inflorescences of three biological replicates. FW, Fresh weight.
The effect of darkness, Glc supplementation, and light treatments on transcript accumulation of 13 dark-induced genes in the detached inflorescences was determined. The genes included ANAC029, ANAC092, RECEPTOR-LIKE PROTEIN KINASE1 (RPK1), and G-BOX BINDING FACTOR1 (GBF1), which drive developmental leaf senescence; GLUTAMATE DEHYDROGENASE2 (GDH2), which promotes the survival of whole plants under carbon-limiting conditions; HOMOLOG OF YEAST AUTOPHAGY18G (ATG18g) and ATG8E, which are involved in autophagy; and PHYTOCHROME INTERACTING FACTOR4 (PIF4) and PIF5, which mediate light-deprivation signaling. In addition, the Glc responsiveness of 15 down-regulated genes associated with the Calvin cycle, photorespiration, or jasmonate response was tested, since the meta-analysis had suggested that 66% of the down-regulated genes were unresponsive to changes in tissue carbohydrate status.
Overall, there was good agreement between the meta-analysis and qRT-PCR (Table V; Supplemental Table S13). Apart from SAG12, which we could not get reliable fold data for because its transcript abundance in the freshly harvested inflorescence was too low, the increase in transcript abundance of all other dark-induced genes was suppressed by the Glc treatment. Interestingly, the accumulation of PIF4 and PIF5, which the meta-analysis had not shown to be Glc responsive, was also suppressed by the Glc treatment. This presumably is because the Glc-addition treatment used in the meta-analysis was performed on light-held leaves, and signals in light-held tissues have a stronger regulatory effect on PIF transcript accumulation than tissue carbohydrate status.
Table V. Validation of the Glc-deprivation response of the detached dark-held inflorescences.
Detached Landsberg erecta inflorescences were held in water in the dark for 24 h, in water supplemented with 3% Glc in the dark for 24 h, or in water in the light for 24 h. P value indicates moderated Student's t test results for significance of the microarray change; MA indicates fold change in transcript abundance in microarray. *24 h Dark and 24 h Dark + Glc are significantly different (based on lsd test); +24 h Dark + Glc and 24 h Light are significantly different (based on lsd test). Data are means of pooled five to six inflorescences from three independent biological experiments. Measurements were normalized to ACTIN2. The results from the individual qRT-PCR experiments and how the transcript abundance of each gene changes in aging leaves are presented in Supplemental Table S13.
| Name | Arabidopsis Genome Initiative No. | P Value | MA | 24 h Dark | 24 h Dark + Glc | 24 h Light |
|---|---|---|---|---|---|---|
| Reference | ||||||
| ACT2/actin2 | At3g18780 | 0.40 | 1.34 | 1.00 | 1.00 | 1.00 |
| SKP1/E3 ubiquitin ligase | At1g75950 | 0.79 | 1.14 | 1.66 | 1.15 | 1.12 |
| UBQ14/ubiquitin | At4g02890 | 0.58 | 0.82 | 1.45 | 1.16 | 0.84 |
| Up-regulated | ||||||
| ANAC029/ATNAP/transcription factor | At1g69490 | 0.06 | 90.46 | 45.93 | 15.29* | 9.43 |
| ANAC092/ORE1/transcription factor | At5g39610 | 0.03 | 29.62 | 27.90 | 13.76* | 5.01 |
| ERF/RAP2.3/ethylene response transcription factor | At3g16770 | 0.03 | 7.59 | 26.99 | 11.42* | 5.10 |
| GBF1/G-box-binding transcription factor | At4g36730 | 0.03 | 10.82 | 10.14 | 4.34* | 1.55+ |
| RPK1/Leu-rich receptor-like kinase | At1g69270 | 0.04 | 4.93 | 4.81 | 2.70* | 1.77 |
| SEN4/xyloglucan endotransglucosylase | At4g30270 | 0.08 | 19.20 | 10.70 | 5.09* | 4.90 |
| SAG12/Cys protease | At5g45890 | 0.75 | 0.91 | 5.56 | 24.56 | 54.55 |
| ATG18G/autophagy18G | At1g03380 | 0.04 | 4.52 | 5.15 | 3.76 | 1.40 |
| ATG8E/autophagy 8E | At2g45170 | 0.04 | 17.92 | 14.77 | 5.66* | 3.33 |
| ATG13/autophagy 13 | At3g49590 | 0.03 | 5.62 | 8.11 | 4.07 | 2.36 |
| GDH2, Glu dehydrogenase | At5g07440 | 0.03 | 8.51 | 7.01 | 2.56* | 1.37 |
| PIF5/PIL6/phytochrome-interacting factor 5 | At3g59060 | 0.03 | 8.61 | 5.93 | 2.86* | 1.79 |
| PIF4/phytochrome-interacting factor 4 | At2g43010 | 0.03 | 3.31 | 6.69 | 2.85 | 1.38 |
| Down-regulated | ||||||
| NDF4/subunit of the chloroplast NAD(P)H dehydrogenase complex | At3g16250 | 0.03 | 0.06 | 0.05 | 0.13 | 0.72+ |
| CPN60B/chaperonin 60B | At1g55490 | 0.03 | 0.21 | 0.24 | 0.37 | 0.42 |
| CPN60A/chaperonin 60A | At2g28000 | 0.03 | 0.16 | 0.29 | 0.40* | 0.33 |
| GAPB/glyceraldehyde-3-phosphate dehydrogenase B subunit | At1g42970 | 0.03 | 0.12 | 0.16 | 0.20 | 0.97+ |
| GAPA-2/glyceraldehyde-3-phosphate dehydrogenase A subunit 2 | At1g12900 | 0.03 | 0.38 | 0.26 | 0.28 | 0.54 |
| Phosphoglycerate kinase | At1g56190 | 0.03 | 0.19 | 0.28 | 0.36 | 0.78+ |
| SBPASE/sedoheptulose-bisphosphatase | At3g55800 | 0.03 | 0.16 | 0.15 | 0.20 | 1.05+ |
| Transketolase | At3g60750 | 0.03 | 0.29 | 0.38 | 0.42 | 0.91+ |
| ATFBA5/Fru-bisP aldolase 5 | At4g26530 | 0.03 | 0.04 | 0.11 | 0.13 | 2.88+ |
| ATFBA2/Fru-bisP aldolase 2 | At4g38970 | 0.03 | 0.21 | 0.24 | 0.22 | 0.80+ |
| GLDP1/Gly decarboxylase | At4g33010 | 0.03 | 0.11 | 0.14 | 0.13 | 1.67+ |
| SHM1/Ser hydroxymethyltransferase 1 | At4g37930 | 0.03 | 0.21 | 0.27 | 0.22 | 1.85+ |
| FD-GOGAT/Glu synthase | At5g04140 | 0.03 | 0.24 | 0.32 | 0.29 | 1.55+ |
| DCT/dicarboxylate transport 2.1 | At5g64290 | 0.04 | 0.30 | 0.52 | 0.48 | 0.64+ |
| ATCLH1/CORI1/chlorophyllase | At1g19670 | 0.04 | 0.11 | 0.19 | 0.31 | 0.71+ |
Of the 14 down-regulated genes tested, transcript abundance of 13 was not significantly altered by the Glc treatment, which was again consistent with the results from the meta-analysis.
The light treatment of the detached inflorescences provided a greater suppression of transcript accumulation for all the up-regulated genes than did the Glc treatment. For some genes, such as RPK1, GBF1, PIF4, and PIF5, their transcript abundance was now less than 2-fold higher than that detected in the freshly harvested inflorescences. However, the transcript abundance of others, such as ANAC029 and -92, was still 5-fold higher in the light-held inflorescences at 24 h. The light treatment prevented the decline in 13 of the 14 down-regulated genes.
KIN10 Regulates Genes That Change in Transcript Abundance at 24 h of Dark Incubation
KIN10, an Arabidopsis Snf1-Related Kinase (SnRK), helps plants survive adverse energy-depleting conditions resulting from dark incubation/sugar deprivation by mediating transcriptional reprogramming in the cells (Baena-González et al., 2007). Of the 281 genes considered to be reliably coactivated by KIN10, induced by sugar starvation, and antagonized by increased sugar availability, 124 (44%) were up-regulated 3-fold or more in the inflorescences (Supplemental Table S14). Of the 322 genes reliably cosuppressed by KIN10, 71 (22%) were present in the set of 741 down-regulated genes (Supplemental Table S14).
Glc Treatment Inhibits the Dark-Induced Developmental Arrest and Delays Degreening
The macroscopic developmental arrest of the dark-held inflorescences was inhibited when they were held in 3% Glc (Fig. 7) and even more so in 6% Glc (data not shown). Treatment with 3% Glc or 3% Suc also delayed the degreening of the central, but not the outermost, floret whorls of the inflorescences (Fig. 8; Supplemental Fig. S4). Lower concentrations of Glc (0.27%; 15 mm) or Suc (0.27%; 7.9 mm) did not affect the timing of degreening (Supplemental Fig. S4). In contrast to its effect in the dark, Glc treatment of inflorescences held in the light accelerated their degreening and led to reddening of their cotyledons and siliques (Fig. 9).
Figure 7.

Glc treatment promotes inflorescence development in the dark. Detached Landsberg erecta inflorescences were held in the dark at 21°C for 5 d in water with or without 3% Glc. Two biological replicates are shown. [See online article for color version of this figure.]
Figure 8.

Treatment of detached dark-held inflorescences with Glc delays degreening. Inflorescences were held in the dark for 4 d. Data are means of four inflorescences. Significance was determined for comparison with values in Landsberg erecta (Ler-0) water. Error bars are 95% confidence intervals for the mean. ***P < 0.001.
Figure 9.

Glc treatment in light causes precocious senescence. Inflorescences were held in a 16-h photoperiod for 4 d. [See online article for color version of this figure.]
The developmentally arrested inflorescences could tolerate 4 d of darkness and still reinitiate development (i.e. floret opening, self-pollination, fertilization, and silique development upon re-exposure to light; Supplemental Fig. S5). However, by 5 d of dark incubation, this ability was lost. ANAC092 expression was partly responsible for the inability of the dark-held inflorescences to reinitiate development, as ANAC092 loss-of-function mutants were still able to reinitiate macroscopic development after 5 d of dark stress (Fig. 10; Supplemental Fig. S6).
Figure 10.

ANAC092 activity limits the ability of detached inflorescences to cope with dark stress. Ecotype Columbia (Col-0) and anac092 (ore1) inflorescences were held in darkness for 4 or 5 d (D4 and D5) and transferred to continuous light. The photograph was taken on day 10. For the full replicated figure, see Supplemental Figure S6. [See online article for color version of this figure.]
Degreening Is Controlled by Transcription Factors Involved in Light-Deprivation Signaling
Detached dark-held inflorescences of plants defective in PIF expression showed delayed degreening, and the delay was greatest in the quadruple PIF mutant compared with the triple or double PIF mutants (Fig. 11; Supplemental Fig. S7).
Figure 11.

Loss of PIF function delays degreening of detached dark-held inflorescences. Inflorescences were held in the dark for 3 d. Data are means of five to six inflorescences. Significance was determined for comparison with values in ecotype Columbia (Col-0). Error bars are 95% confidence intervals for the mean. *P < 0.05, ***P < 0.001. For a visual representation of the delay, see Supplemental Figure S7. D0, Day 0.
DISCUSSION
We have developed a detached dark-held immature Arabidopsis inflorescence system to model physiological and molecular responses occurring in immature tissues as they transition to senescence. Unlike leaves, which require careful developmental staging, the immature inflorescences were easily staged and could be continually collected from plants over many days for analysis. Inflorescences taken from anywhere on the plant reproducibly senesced in the dark over a 5-d period at 21°C to 22°C as judged by three hallmarks of senescence: chlorophyll loss, protein loss, and electrolyte leakage. Senescence of the inflorescences was accelerated by exposure to ABA and delayed by treatment with the cytokinin 6-benzylaminopurine, confirming that hormonal regulation of detached inflorescence senescence shares similarities with that documented for leaves (Schippers et al., 2007). We used microarray profiling to identify the metabolic reprogramming at 24 h and found that it had a large carbon-deprivation component and most closely resembled the program in attached developmentally arresting leaves, which is centered on adapting to heterotrophic growth (Weaver and Amasino, 2001; Usadel et al., 2008). We also identified up-regulated genes within the transcriptome response at 24 h associated with developmental senescence and light-deprivation signaling. These genes were found to accelerate the timing of inflorescence degreening and were themselves regulated by the carbohydrate status of the inflorescence tissue. This highlights the importance of tissue carbohydrate status in controlling both light deprivation- and senescence-related transcript responses of dark-held tissue.
Carbon Deprivation Is Responsible for the Dark-Mediated Arrest of Macroscopic Growth of the Inflorescences
Detached immature inflorescences continued in development to produce siliques when held in the light (Fig. 1A; Supplemental Fig. S5). This suggested that the photosynthetic machinery of the pedicels and sepals was capable of supplying sufficient photosynthate to support floret opening and silique development and that the import of leaf-derived carbohydrate and growth substances was unnecessary. Seeds were also produced in the siliques, but their viability was not tested. When the inflorescences were held in the dark, their macroscopic growth ceased. This developmental arrest was likely caused by carbon starvation, as carbohydrate stores become rapidly depleted in tissues held for extended periods in the dark, because starch made during the day is tuned to match the expected metabolic requirements for the oncoming dark period (Smith and Stitt, 2007; Usadel et al., 2008). The inflorescences used in this study were harvested 11 h into a 16-h day period and so would likely not have accumulated enough photosynthate in their sepals to support the metabolism for their oncoming 8-h dark period, let alone the additional 16-h extended dark period.
Transcriptome Response at 24 h Is Carbon Deprivation Driven and Centered on Cellular Preservation
Meta-analysis indicated that a large component of the inflorescence transcriptome response at 24 h was driven by carbon deprivation, and the majority of these transcript abundance changes were similar to what was seen in leaves of whole plants given a 24- to 48-h extended night (Fig. 5). This was further reflected in the enriched functional categories of the inflorescences at 24 h being very similar to those in leaves of plants given an extended 24- to 48-h night (Usadel et al., 2008). The categories included induction of processes that mobilize carbon from alternative sources and repression of biosynthetic pathways, protein synthesis, and cellular growth programs. The alterations in these processes at 24 h are likely to be adaptive, because inflorescences could be held in the dark for as long as 4 d and still regreen and initiate development to produce siliques if reexposed to light. This is also consistent with the findings of Weaver and Amasino (2001), who showed that leaves of whole plants held in the dark for 48 h and subsequently reexposed to light had delayed senescence compared with leaves of plants that did not experience the extended dark period. Similarly, Parlitz et al. (2011) showed that leaves shaded for up to 48 h (but not longer) regreened when reilluminated. The down-regulated transcriptome changes of the inflorescences also highlighted the decline in chloroplast function as one of the major adaptive metabolic responses to the dark stress (Table IV). This supports the view that chloroplasts, which house approximately 70% of the cell’s protein (Lim et al., 2007), are an important early and reversible source of energy for tissue experiencing heterotrophic conditions (van Doorn, 2005).
Metabolic reprogramming to help plants survive adverse energy-depleting conditions has been attributed to the activity of SnRK1 (Baena-González et al., 2007; Halford and Hey, 2009; Smeekens et al., 2010; Coello et al., 2011). Overexpression of the catalytic subunit of SnRK1 (AKIN10) in long-day-held Arabidopsis plants causes a delay in flowering and subsequent whole plant senescence, which has been proposed to be analogous to life span extension by caloric restriction in animals (Baena-González et al., 2007). This is consistent with the view that SnRK1 helps plants cope with carbohydrate deprivation by promoting catabolic activities and inhibiting ATP-consuming anabolic activities. It does this by directly modulating enzyme activities and by affecting global transcriptional reprogramming. More than 40% of the genes shown by Baena-González et al. (2007) to be reliably induced by SnRK1 activity and to respond to changes in added or endogenous sugars were up-regulated in the detached dark-held inflorescences (Supplemental Table S14), indicating that SnRK1 activity might also have a prominent role in the initial transcriptional reprogramming in the inflorescences. Consistent with their constitutive expression in plant tissues (https://www.genevestigator.com), we found that SnRK1 (AKIN10 catalytic subunit) transcript abundance in the inflorescences was unchanged in response to the dark incubation. However, transcripts of AKINβ1 (At5g21170), which encodes one of the putative regulatory subunits of the SnRK1 proteins, was one of the more highly up-regulated transcripts in the inflorescences (31.5-fold). The role of AKINβ1 in dark (energy deprivation) responses rather than senescence was supported by the finding that its transcript abundance was carbohydrate status responsive but not developmental senescence responsive (Supplemental Table S7). The role of AKINβ1 is still unclear, although it has been suggested that it may target SnRK1 to different substrates (Halford and Hey, 2009).
Positive Regulators of Senescence Are Up-Regulated in the Inflorescences at 24 h
The up-regulated gene set of the detached dark-held inflorescences contained SAGs such as ANAC029, ANAC092, and RPK1, which promote the progression of developmental leaf senescence (Guo and Gan, 2006; Balazadeh et al., 2010; Lee et al., 2011). ANAC092 expression also promotes inflorescence senescence, because plants defective in this transcription factor showed delayed degreening (Fig. 3). In leaves, these three genes appear to control senescence timing at least in part through modulating tissue response to ABA (Kim et al., 2009, 2011; Lee et al., 2011; Zhang and Gan, 2012). This hormone also accelerated degreening of the detached inflorescences (Fig. 2), and the ABA response was significantly enriched for in the inflorescences (Table III), indicating that the hormone may have a natural role in the degreening of the detached dark-held inflorescences. ore3, ore9, and ore12 plants defective in EIN2, MAX2, and AHK3, respectively, also showed delayed inflorescence senescence (Fig. 3). These genes have been shown to delay the timing of development- and dark-induced leaf senescence (Oh et al., 1997; Woo et al., 2001; Kim et al., 2006), which illustrates the regulatory similarities between inflorescence degreening and both artificially and developmentally induced leaf senescence programs.
Carbon Deprivation Affects Both Light Signaling and Senescence Signaling Responses
The strong influence of tissue carbohydrate status on the transcriptional reprogramming in the inflorescences prompted us to determine whether the expression of the senescence-up-regulated genes was controlled by tissue carbohydrate status. The meta-analysis suggested that many of the senescence-responsive genes in the up-regulated gene set were suppressed by Glc treatment and/or induced by carbon deprivation (Fig. 5A). This included the SAGs ANAC029, ANAC092, and RPK1. We were able to confirm that their increased transcript abundance was dependent in part on the dark-mediated decline in tissue Glc content (Table V). The exact role of these senescence regulators in the inflorescence at 24 h is unclear, although their presence does not indicate a commitment of the tissue to senescence at this time point, as the inflorescences reinitiate development if reexposed to light (Supplemental Fig. S5). However, the expression of ANAC092 does eventually drive the tissue to senesce and does eventually limit the time in the dark that the inflorescences are able tolerate and still be able to reinitiate growth upon reexposure to light (Fig. 10). This would suggest that ANAC092 does not function to help the inflorescences tolerate dark-induced stress; rather, it functions as it does in developmental leaf senescence, to drive the complete dismantling of the tissue and remobilization of its constituents at a rate that apparently is faster than is necessary for heterotrophic survival of the dark-held inflorescences.
Although we found little evidence from the transcriptome profiling for light signaling responses, transcript abundance of PIF4 and -5 did significantly increase in the dark-held inflorescences at 24 h (Table V). We also subsequently found that mutants defective in PIF expression showed delayed inflorescence degreening (Fig. 11), suggesting that PIF activity was responsible in part for the chlorophyll loss. PIF4 and -5 are basic helix-loop-helix transcription factors that are stabilized in tissue by shade and function in the shade-avoidance syndrome by negatively regulating the active form of phytochrome B (Lorrain et al., 2008; Hornitschek et al., 2009; Leivar and Quail, 2011). In the dark, they function redundantly with PIF1 and -3 to repress photomorphogenesis and promote skotomorphogenesis of etiolated seedlings (Leivar and Quail, 2011). Moreover, dark-grown quadruple PIF mutant seedlings, which are defective in PIF1, -3, -4, and -5 expression, show a constitutive photomorphogenesis-like phenotype (Leivar et al., 2008; Leivar and Quail, 2011). We found that Glc suppressed the dark-induced transcript accumulation of PIF4 and -5 in the Arabidopsis inflorescences (Table V), which suggests that tissue carbohydrate reduction in addition to light-deprivation signaling regulates PIF transcript accumulation and chlorophyll loss.
Developmental Arrest Is Inhibited and Degreening Is Delayed by 3% Glc Treatment
Because the transcriptome response had suggested that Glc deprivation was a major driver of the metabolic reprogramming occurring in the inflorescences, we tested whether resupplying Glc would affect the growth and degreening of the inflorescences. Supplying 3% Glc to the dark-held inflorescences caused them to develop as they would in the light. This suggested that physiologically relevant levels of Glc were taken up by the inflorescences, enabling growth-based programs including silique development to proceed normally. The ability of carbohydrate supply to reinitiate pod development suggests that the system may be useful for advancing the understanding of other aspects of plant development, such as pod abortion, a process that has been linked to carbohydrate flux in other species (Liu et al., 2004).
The Glc treatment delayed degreening of the central immature florets of the inflorescences, which is consistent with the delayed degreening seen for detached dark-held oat (Avena sativa) leaves floated on 100 to 300 mm Glc (Thimann et al., 1977). The Glc treatment did not delay degreening of the sepals in the outer florets of the inflorescences, presumably because the sepal constituents were dismantled to provide essential elements/metabolites to the developing siliques. Senescence caused by remobilization of nitrogen from source tissue to developing sink tissues such as seeds is well documented (Gan and Amasino, 1997). We also found that Glc treatment accelerated sepal yellowing of the inflorescences held in the light and promoted anthocyanin accumulation, both of which have been documented for Glc-treated light-held leaves of Arabidopsis (Wingler et al., 2006).
Glc application did not completely prevent degreening, and this was consistent with it not being able to completely abolish the up-regulation of genes such as ANAC092, ANAC029, SENESCENCE4 (SEN4), and RELATED TO AP2.3 (RAP2.3) despite the inflorescence Glc content of the Glc-treated dark-held inflorescences being as high as that of the light-held inflorescences. For these genes, developmental cues may be important, because the 24-h light treatment also did not fully suppress the increase in their transcript abundance (Table V) and their transcripts have been shown to accumulate early in the development of leaves (Breeze et al., 2011; Supplemental Table S13). The light treatment, however, was always better than Glc at suppressing the dark-induced increase in transcript abundance for the genes tested (Table V). As mentioned above, this was not because the light-held tissue contained more carbohydrate (Fig. 6). Moreover, Thimann et al. (1977) showed that light does not delay chlorophyll loss through affecting sugar formation. The meta-analysis also suggested that the majority of the down-regulated genes associated with chloroplast function were not affected by tissue carbohydrate status (Supplemental Table S12). We subsequently confirmed this unresponsiveness on a subset of these genes (Table V). The decline in transcript abundance of many of these genes, however, was abolished in the detached inflorescences by light, indicating again a large light-deprivation, but carbon status-unrelated, component to the reduction in chloroplast function.
Model of Inflorescence Response to Darkness
The detached immature inflorescences can be thought of as an autonomous developmental unit, which, if provided with sufficient water and light, can carry out its function of growth and development largely independent of the rest of the plant. In that respect, it differs from detached leaves, which cannot regreen after being held in the dark for 2 d (Weaver and Amasino, 2001), probably because the leaves are unable to import cytokinins like their attached counterparts (van Doorn, 2005).
We have outlined the response of immature tissues to dark-detached stress in a simple model (Fig. 12). Upon transfer of the usually rapidly developing immature inflorescences to darkness, macroscopic growth ceases as their carbohydrate stores are rapidly depleted. The decline in tissue Glc content removes the Glc-based suppression of transcript accumulation of genes associated with light-deprivation signaling (e.g. PIFs) and senescence regulation (e.g. ANAC092). Light-deprivation signaling further enhances the transcript accumulation of these and other genes associated with processes that mobilize carbon from alternative sources. Light-deprivation signaling conversely suppresses the accumulation of gene transcripts associated with biosynthetic pathways, protein synthesis, and cellular growth programs. The reduced carbohydrate status of the tissue is less responsible for the reduced transcript abundance of these genes. At 24 h of darkness, the tissue is surviving by reducing chloroplast function and utilizing the energy stored within the organelle. The metabolism is adaptive and readily reversible. For the next 3 d, chloroplasts are methodically dismantled, as shown by chlorophyll and protein loss, but they maintain enough integrity to be able to regreen upon reexposure to light. By day 5 of darkness, the chloroplasts have been dismantled to the “point of no return,” and this in part has been caused by the action of genes such as ANAC092 and PIFs in conjunction with ABA and ethylene hormone response pathways, all of which were initially induced in the inflorescences within as little as 24 h of darkness.
Figure 12.

A model illustrating the detached immature inflorescence response to darkness. In light, detached immature inflorescences held in water continue development to produce siliques containing seeds. However, inflorescences exposed to 24 h of darkness cease growth and their Glc content declines (indicated by gray). Reduced Glc content releases suppression on the transcript accumulation of senescence- and light deprivation-related genes, leading to their increased transcript abundance. Light deprivation signaling further enhances their accumulation. A proportion of genes are up- and down-regulated independent of tissue carbohydrate status. The transcriptome response at 24 h is adaptive, readily reversible, and centered on mobilizing carbon from alternative sources and the repression of biosynthetic pathways, protein synthesis, and cellular growth programs. Inflorescences can cope with an additional 3 d of darkness before their heterotrophic metabolism has passed the point of no return. This is controlled, in part, by continued expression of genes such as ANAC092 and PIFs, which were induced initially in the inflorescences during their reversible adaptive period.
In summary, we have shown that detached dark-held Arabidopsis inflorescences are a convenient and informative model system for understanding tissue response to energy- and nutrient-deprivation stress. The system revealed that carbohydrate deprivation drives the initial response and regulates the transcript accumulation of key genes such as ANAC092, which control degreening. Translation of these findings using Targeted Induced Local Lesions in Genomes (Slade and Knauf, 2005) or targeted editing technologies (Wood et al., 2011) into commercially relevant vegetables such as the closely related broccoli (Town et al., 2006) has the potential for reducing the external energy requirements necessary for maintaining their quality postharvest. In addition, the inflorescence system would be expected to have wider value as a research tool for investigations into plant adaptation to stress and senescence, given the strong similarity in the molecular response of the inflorescence system with that reported for detached and attached leaves.
MATERIALS AND METHODS
Plant Materials and Treatments
Seeds of Arabidopsis (Arabidopsis thaliana) ecotype Landsberg erecta or Columbia were germinated and grown in a temperature-regulated growth chamber (20°C–22°C, 16-h-light/8-h-dark cycle beginning at 4 am, 100 µmol m−2 s−1 white light, and 60% relative humidity) unless otherwise stated. Inflorescences (growth stages 6.00–6.10; Boyes et al., 2001) from the primary bolts of 5-week-old Arabidopsis plants were typically used for the experiments. Inflorescences were harvested by excising at the junction between the peduncle and the pedicel of the lowest unopened floret at the base of the inflorescence. The detached inflorescences were treated with plant hormones by placing their cut ends in wells of a 96-well microtiter plate containing the hormone dissolved to the appropriate concentration in water. The plant hormones used were 6-benzylaminopurine (B3408; Sigma) and cis-(±)-ABA (A1049; Sigma). Landsberg erecta detached inflorescences for use in the microarray analysis were harvested at 3 pm (11 h into the day period) and either immediately snap frozen in liquid nitrogen and stored at −80°C or placed at 21°C on blotting paper moistened with 50 mL of nanopure water inside a 2-L black plastic container. Ten inflorescences from 10 independent plants were pooled for each time point (0 or 24 h). The whole experiment was subsequently repeated and the results combined.
The oresara mutants ore1 (ANAC092/At5g39610), ore3 (EIN2/At5g03280), ore9 (MAX2/At2g42620), and ore12-1 (AHK3/At1g27320) were kindly provided by Dr. Hong Gil Nam (Plant Systems Bio-Dynamics Laboratory, POSTECH). The T-DNA insertion mutants CS859988 (ANAC092), CS66043 (pif3-7/pif4-2), CS66048 (pif3-7/pif4-2/pil6-1), CS66049 (pif1-1/pif3-7/pif4-2/pil6-1), and CS66047 (pif1-1/pif3-7/pil6-1) were purchased from The Arabidopsis Information Resource (http://www.arabidopsis.org).
Chlorophyll, Protein Content, and Ion Leakage Quantification
Chlorophyll was extracted from single inflorescences by incubating in 96% (v/v) ethanol (10 mg of tissue per 10 µL of ethanol) for 4 d in the dark at 4°C. The chlorophyll content was then determined from 2 µL of the supernatant by measuring the absorbance at wavelengths 649 and 665 nm with a Nanodrop ND-1000 spectrophotometer and performing calculations as described by Wintermans and De Mots (1965). To determine the significance in the fold changes in chlorophyll content, the data were log transformed and analyzed using regression with line and day as factors. The chlorophyll data were log transformed and analyzed using regression with line (or treatment) and day as factors. The change in chlorophyll content from day 0 to the other days for each line (or treatment; Fig. 2) was compared with that of line ecotype Columbia or Landsberg erecta (untreated) by Student's t tests of the regression parameter estimates.
Soluble sugars were extracted from inflorescence tissue (30–40 mg; frozen and ground in liquid N2) using 200 μL of methanol (62.5%, v/v) at 60°C for 15 min. Extracts were centrifuged at 19,350g for 10 min, and sugars were analyzed by HPLC using a Dionex 3000 UltiMate solvent delivery system (Dionex Softron) fitted with a Prevail Carbohydrate ES column (250 × 4.6 mm; Grace Davison) operating in 75% (v/v) acetonitrile at a flow rate of 1 mL min−1. Sugars were detected using evaporative light scattering (model PL-ELS; Polymer Laboratories) and quantified against Glc standards in the range 0.2 to 1 mg mL−1.
Soluble proteins were extracted according to the method of Coupe et al. (2003). In brief, 50 mg of tissue was ground in 500 µL of extraction buffer (100 mm Tris-HCl, pH 7.6, 10 mm MgSO4, and 10 mm dithiothreitol) incubated on ice for 1 h with intermittent vortexing, and the cellular debris was pelleted by centrifugation at 10,000g for 10 min at 4°C. Soluble protein was then determined from the supernatant using the Coomassie dye-binding assay (Bio-Rad Laboratories) with bovine serum albumin as the standard. Relative electrolyte leakage was determined according to the method of Jing et al. (2002). Ten inflorescences (approximately 90 mg) at each time point were placed in a 50-mL tube containing 10 mL of deionized water and incubated at 25°C for 30 min on an orbital shaker (200 rpm). The initial conductivity of the fluid was measured with a Konduktometer model E527 (Metrohm Herisau). The total conductivity was then determined after boiling the sample for 10 min, and the relative electrolyte leakage was expressed as the percentage of the initial conductivity versus total conductivity.
Microarray Analysis
Total RNA was isolated from the inflorescences using Trizol reagent (Invitrogen) according to the manufacturer’s instructions, cleaned using an RNeasy Mini RNA isolation kit (Qiagen), eluted in nuclease-free water, quantified using a Nanodrop ND-1000 spectrophotometer, and then submitted to quality assessment by capillary electrophoresis using an Agilent Bioanalyzer 2100. The rRNA ratios (28S/18S) obtained for samples were between 1.1 and 1.2. Labeling of each sample was performed using the Affymetrix one-cycle kit and hybridization to the chips measured with an Affymetrix 7G Scanner. The microarray results were averages of two independent temporally separated biological experiments. The results were analyzed using ArrayStar software, version 3 (DNASTAR), as described below. Analyses were based on two biological replicates per treatment (0 versus 24 h). Probe intensity data from the GeneChips were processed in a three-stage procedure using Robust Multichip Average (RMA) and the algorithms of Bolstad (2004). For this analysis, a preprocessing RMA background correction method, a quantile normalization (Irizarry et al., 2003), and RMA’s median polish summarization methods were used. Expression levels are based on log2 values. Differentially regulated genes were selected based on the criteria log2(fold change) > 3 and P < 0.05 with moderated Student's t test (Smyth, 2004) corrected for multiple testing (Benjamini and Hochberg, 1995).
qRT-PCR Analysis
Total RNA (1 µg) was treated with DNase (Invitrogen) and used as a template for cDNA synthesis. cDNA was synthesized from the RNA using SuperScript III (Invitrogen) and the reverse-strand primer KS-DT (listed in Supplemental Table S15). After synthesis, the cDNA was diluted 20-fold for use in quantitative PCR. qRT-PCR was performed in 10-µL reactions using a LightCycler 480 SYBR Green 1 Master PCR labeling kit (Roche) and Rotor-Gene 3000 Real Time PCR machine (Corbett Research). The primers were designed using PrimerQuest (http://eu.idtdna.com/Scitools/Applications/Primerquest/), PrimerSelect (DNASTAR), or QuantPrime (www.quantprime.de/) and are listed in Supplemental Table S15. PCR was performed on three biological replicates of five to six pooled inflorescences. Analysis was carried out using the method of “comparative quantification” present in the Corbett Rotor-Gene 6000 Application Software (McCurdy et al., 2008). The reliability of the data was checked by normalizing to three reference genes, ACT2 (At3g18780), SKP1 (At1g75950), and UBQ14 (At4g02890). The three reference genes showed similar changes in transcript abundance in the treatments examined, and results normalized to ACT2 are shown (Supplemental Table S13).
Bioinformatic Analyses
Data sets used in Genevestigator V3 to create Figures 5 and 6 were as follows: (1) juvenile leaf (10-d-old plant, 1 cm long); (2) adult leaf (three leaves fully expanded; 12 leaves visible); (3) senescent leaf (35-d-old plant). These three data sets came from AtGenExpress: Expression Development baseline II courtesy of the Weigel laboratory available in The Arabidopsis Information Resource repository; (4) pollen (E-MEXP-285: gene family analysis of the Arabidopsis pollen transcriptome; Pina et al., 2005); (5) methyl jasmonate late and OPDA late (GSE4733: transcriptional regulators of stamen development in Arabidopsis identified by transcriptional profiling), stamens of opr3 mutants were treated with 0.03% methyl jasmonate or OPDA and stamens were harvested 22 h after treatment (Mandaokar et al., 2006); (6) light signaling (GSE3423), rosettes grown in a 12-h-light/12-h-dark cycle and at the end of night treated under light or continued darkness (control) for 4 h at low (50 µL L−1) [CO2] (Bläsing et al., 2005); (7) low CO2, rosettes grown in a 12-h-light/12-h-dark cycle and at the end of night treated under light for 4 h either with low (50 µL L−1) or normal (350 µL L−1) [CO2] (Bläsing et al., 2005); (8) Glc 4 h (E-MEXP-475), seedlings grown in liquid culture for 7 d on Murashige and Skoog medium containing 0.5% Glc, medium replaced with Glc-free medium for 24 h, then to medium containing 3% Glc for 4 h (Li et al., 2006); (9) extended night (GSE10016: expression data of Arabidopsis rosettes in an extended night), whole rosettes were grown in a 14-h-light/10-h-dark cycle and exposed to a 2- and 4-h (early), 6- and 8-h (intermediate), or 24- and 48-h (late) extended night (Usadel et al., 2008). Venn diagrams and general manipulations of data sets were carried out using the research tools at http://bar.utoronto.ca/welcome.htm.
Enrichment of pathways, gene functions, and organelle associations based on Gene Ontology and other functional annotation data were identified using MapMan 3.5.1 (http://mapman.gabipd.org/) and DAVID (http://david.abcc.ncifcrf.gov/). MapMan 3.5.1 categorized all 1,294 genes (i.e. 1,499 genes minus pollen-associated genes) that changed 3-fold or more into BINs based on redundancy-reduced MapMan ontologies (Usadel et al., 2009). MapMan BINs that changed significantly (P ≤ 0.05) were determined using the Wilcoxon rank test and corrected for multiple testing using the Benjamini-Hochberg procedure in the MapMan program. The DAVID bioinformatics tool was also used to examine the biological significance of the transcriptome changes in the inflorescences, as it provided a different statistical and therefore complementary view to that of MapMan (Huang et al., 2009; Usadel et al., 2009). DAVID analysis identifies significantly enriched biological themes by examining for enrichment in over 40 different publicly available annotation categories. Unlike in MapMan, the DAVID algorithm analyzes the up- and down-regulated sets separately. Significance was determined using a modified Fisher’s exact statistic (EASE score), and the significantly enriched biological themes were identified as clusters of annotated terms and KEGG_PATHWAYs (Huang et al., 2009). A cluster enrichment score of 1.3 for an annotation cluster is equivalent to nonlog scale 0.05, and therefore scores of 1.3 or greater are considered enriched (Huang et al., 2009). In some instances, a cluster could be significantly enriched yet consist entirely of terms that themselves did not meet the 0.05 level of significance after correction for multiple testing using the Benjamini-Hochberg procedure. These clusters were omitted. Fold enrichment scores were also used to indicate the magnitude of enrichment for individual terms and KEGG_PATHWAYs, and fold enrichment scores greater than 1.4 are suggestive of an informative change (Huang et al., 2009).
Sequence data from this article can be found in the Gene Expression Omnibus database under accession numbers GSE41099, GSM1008526, GSM1008527, GSM1008528, and GSM1008529.
Supplemental Data
The following materials are available in the online version of this article.
Supplemental Figure S1. Hormones alter the timing of degreening of detached dark-held inflorescences.
Supplemental Figure S2. The majority of genes in up- and down-regulated inflorescence gene sets are correspondingly up- and down-regulated in naturally aging leaves well before chlorophyll loss occurs.
Supplemental Figure S3. Genes associated with chloroplast function are significantly down-regulated in the inflorescences by 24 h.
Supplemental Figure S4. Inflorescence degreening is delayed by treatment with 3% Glc or Suc.
Supplemental Figure S5. Development is reinitiated when dark-held inflorescences are brought back out to the light.
Supplemental Figure S6. ANAC092 activity limits the ability of detached inflorescences to cope with dark stress.
Supplemental Figure S7. Knockout of PIF transcription factors delays degreening of detached dark-held inflorescences.
Supplemental Table S1. Expression values of 22,810 normalized genes on the ATH1 Arabidopsis GeneChip microarray (raw data) from two independent ATH1 experiments.
Supplemental Table S2. Expression values of significantly regulated genes (2,096) at the 95% confidence level in dark-detached Arabidopsis inflorescences.
Supplemental Table S3. Expression values of significantly regulated genes showing at least 3-fold up-regulation in dark-detached inflorescences.
Supplemental Table S4. Expression values of significantly regulated genes showing at least 3-fold down-regulation in dark-detached inflorescences.
Supplemental Table S5. Developmental leaf senescence gradient data for inflorescence up-regulated genes (data from Breeze et al., 2011).
Supplemental Table S6. Developmental leaf senescence gradient data for inflorescence down-regulated genes (data from Breeze et al., 2011).
Supplemental Table S7. Meta-analysis of 758 inflorescence up-regulated genes.
Supplemental Table S8. Meta-analysis of 741 inflorescence down-regulated genes.
Supplemental Table S9. Transcript accumulation changes of inflorescence genes in light treatment (data from Bläsing et al., 2005).
Supplemental Table S10. MapMan functional groupings of genes summarized in Table II whose mRNA abundance changed 3-fold or more.
Supplemental Table S11. List of genes behind the overrepresented up-regulated clusters of Table III (553-gene set).
Supplemental Table S12. List of genes behind the overrepresented down-regulated clusters of Table IV.
Supplemental Table S13. Validation of the effect of carbohydrate status on inflorescence gene expression.
Supplemental Table S14. Table from Baena-González et al. (2007) on KIN10-activated genes with inflorescence data added.
Supplemental Table S15. Primers used in qRT-PCR.
Supplementary Material
Acknowledgments
We thank Liam Williams of the Centre for Genomics and Proteomics, School of Biological Sciences, University of Auckland, for performing the RNA isolations and Affymetrix GeneChip hybridizations. We thank The New Zealand Institute for Plant & Food Research staff: Ian King for maintaining plants in the controlled growth rooms; Duncan Hedderley for help with microarray analysis; Andrew McLachlan for help with statistical analysis; Marian McKenzie for helpful discussion; and Kevin Davies, Robert Schaffer, and Jason Johnston for critically reviewing the manuscript.
Glossary
- SAG
senescence-associated gene
- ABA
abscisic acid
- OPDA
12-oxo-phytodienoic acid
- qRT
quantitative real-time
- RMA
Robust Multichip Average
- cDNA
to be defined
References
- Baena-González E, Rolland F, Thevelein JM, Sheen J. (2007) A central integrator of transcription networks in plant stress and energy signalling. Nature 448: 938–942 [DOI] [PubMed] [Google Scholar]
- Balazadeh S, Siddiqui H, Allu AD, Matallana-Ramirez LP, Caldana C, Mehrnia M, Zanor MI, Köhler B, Mueller-Roeber B. (2010) A gene regulatory network controlled by the NAC transcription factor ANAC092/AtNAC2/ORE1 during salt-promoted senescence. Plant J 62: 250–264 [DOI] [PubMed] [Google Scholar]
- Becker W, Apel K. (1993) Differences in gene-expression between natural and artificially induced leaf senescence. Planta 189: 74–79 [Google Scholar]
- Benjamini Y, Hochberg Y. (1995) Controlling the false discovery rate: a practical and powerful approach to multiple testing. J R Stat Soc Ser B 57: 289–300 [Google Scholar]
- Bläsing OE, Gibon Y, Günther M, Höhne M, Morcuende R, Osuna D, Thimm O, Usadel B, Scheible WR, Stitt M. (2005) Sugars and circadian regulation make major contributions to the global regulation of diurnal gene expression in Arabidopsis. Plant Cell 17: 3257–3281 [DOI] [PMC free article] [PubMed] [Google Scholar]
- Bolstad BM. (2004) Low-level analysis of high-density oligonucleotide array data: background, normalization, and summarization. PhD thesis. University of California, Berkeley
- Boyes DC, Zayed AM, Ascenzi R, McCaskill AJ, Hoffman NE, Davis KR, Görlach J. (2001) Growth stage-based phenotypic analysis of Arabidopsis: a model for high throughput functional genomics in plants. Plant Cell 13: 1499–1510 [DOI] [PMC free article] [PubMed] [Google Scholar]
- Breeze E, Harrison E, McHattie S, Hughes L, Hickman R, Hill C, Kiddle S, Kim YS, Penfold CA, Jenkins D, et al. (2011) High-resolution temporal profiling of transcripts during Arabidopsis leaf senescence reveals a distinct chronology of processes and regulation. Plant Cell 23: 873–894 [DOI] [PMC free article] [PubMed] [Google Scholar]
- Buchanan-Wollaston V, Earl S, Harrison E, Mathas E, Navabpour S, Page T, Pink D. (2003) The molecular analysis of leaf senescence: a genomics approach. Plant Biotechnol J 1: 3–22 [DOI] [PubMed] [Google Scholar]
- Buchanan-Wollaston V, Page T, Harrison E, Breeze E, Lim PO, Nam HG, Lin JF, Wu SH, Swidzinski J, Ishizaki K, et al. (2005) Comparative transcriptome analysis reveals significant differences in gene expression and signalling pathways between developmental and dark/starvation-induced senescence in Arabidopsis. Plant J 42: 567–585 [DOI] [PubMed] [Google Scholar]
- Chen YT, Chen LFO, Shaw JF. (2008) Senescence-associated genes in harvested broccoli florets. Plant Sci 175: 137–144 [Google Scholar]
- Coello P, Hey SJ, Halford NG. (2011) The sucrose non-fermenting-1-related (SnRK) family of protein kinases: potential for manipulation to improve stress tolerance and increase yield. J Exp Bot 62: 883–893 [DOI] [PubMed] [Google Scholar]
- Coupe SA, Sinclair BK, Watson LM, Heyes JA, Eason JR. (2003) Identification of dehydration-responsive cysteine proteases during post-harvest senescence of broccoli florets. J Exp Bot 54: 1045–1056 [DOI] [PubMed] [Google Scholar]
- Downs CG, Somerfield SD, Davey MC. (1997) Cytokinin treatment delays senescence but not sucrose loss in harvested broccoli. Postharvest Biol Technol 11: 93–100 [Google Scholar]
- Eason JR, Ryan DJ, Watson LM, Hedderley D, Christey MC, Braun RH, Coupe SA. (2005) Suppression of the cysteine protease, aleurain, delays floret senescence in Brassica oleracea. Plant Mol Biol 57: 645–657 [DOI] [PubMed] [Google Scholar]
- Gan SS, Amasino RM. (1997) Making sense of senescence: molecular genetic regulation and manipulation of leaf senescence. Plant Physiol 113: 313–319 [DOI] [PMC free article] [PubMed] [Google Scholar]
- Gapper NE, Coupe SA, McKenzie MJ, Scott RW, Christey MC, Lill RE, McManus MT, Jameson PE. (2005) Senescence-associated down-regulation of 1-aminocyclopropane-1-carboxylate (ACC) oxidase delays harvest-induced senescence in broccoli. Funct Plant Biol 32: 891–901 [DOI] [PubMed] [Google Scholar]
- Guo Y, Gan S. (2006) AtNAP, a NAC family transcription factor, has an important role in leaf senescence. Plant J 46: 601–612 [DOI] [PubMed] [Google Scholar]
- Halford NG, Hey SJ. (2009) Snf1-related protein kinases (SnRKs) act within an intricate network that links metabolic and stress signalling in plants. Biochem J 419: 247–259 [DOI] [PubMed] [Google Scholar]
- Hornitschek P, Lorrain S, Zoete V, Michielin O, Fankhauser C. (2009) Inhibition of the shade avoidance response by formation of non-DNA binding bHLH heterodimers. EMBO J 28: 3893–3902 [DOI] [PMC free article] [PubMed] [Google Scholar]
- Hruz T, Laule O, Szabo G, Wessendorp F, Bleuler S, Oertle L, Widmayer P, Gruissem W, Zimmermann P. (2008) Genevestigator V3: a reference expression database for the meta-analysis of transcriptomes. Adv Bioinformat 2008: 420747. [DOI] [PMC free article] [PubMed] [Google Scholar]
- Huang W, Sherman BT, Lempicki RA. (2009) Bioinformatics enrichment tools: paths toward the comprehensive functional analysis of large gene lists. Nucleic Acids Res 37: 1–13 [DOI] [PMC free article] [PubMed] [Google Scholar]
- Irizarry RA, Hobbs B, Collin F, Beazer-Barclay YD, Antonellis KJ, Scherf U, Speed TP. (2003) Exploration, normalization, and summaries of high density oligonucleotide array probe level data. Biostatistics 4: 249–264 [DOI] [PubMed] [Google Scholar]
- Jing HC, Sturre MJG, Hille J, Dijkwel PP. (2002) Arabidopsis onset of leaf death mutants identify a regulatory pathway controlling leaf senescence. Plant J 32: 51–63 [DOI] [PubMed] [Google Scholar]
- Kim HJ, Ryu H, Hong SH, Woo HR, Lim PO, Lee IC, Sheen J, Nam HG, Hwang I. (2006) Cytokinin-mediated control of leaf longevity by AHK3 through phosphorylation of ARR2 in Arabidopsis. Proc Natl Acad Sci USA 103: 814–819 [DOI] [PMC free article] [PubMed] [Google Scholar]
- Kim JH, Chung KM, Woo HR. (2011) Three positive regulators of leaf senescence in Arabidopsis, ORE1, ORE3 and ORE9, play roles in crosstalk among multiple hormone-mediated senescence pathways. Genes Genomics 33: 373–381 [Google Scholar]
- Kim JH, Woo HR, Kim J, Lim PO, Lee IC, Choi SH, Hwang D, Nam HG. (2009) Trifurcate feed-forward regulation of age-dependent cell death involving miR164 in Arabidopsis. Science 323: 1053–1057 [DOI] [PubMed] [Google Scholar]
- Lee IC, Hong SW, Whang SS, Lim PO, Nam HG, Koo JC. (2011) Age-dependent action of an ABA-inducible receptor kinase, RPK1, as a positive regulator of senescence in Arabidopsis leaves. Plant Cell Physiol 52: 651–662 [DOI] [PubMed] [Google Scholar]
- Leivar P, Monte E, Oka Y, Liu T, Carle C, Castillon A, Huq E, Quail PH. (2008) Multiple phytochrome-interacting bHLH transcription factors repress premature seedling photomorphogenesis in darkness. Curr Biol 18: 1815–1823 [DOI] [PMC free article] [PubMed] [Google Scholar]
- Leivar P, Quail PH. (2011) PIFs: pivotal components in a cellular signaling hub. Trends Plant Sci 16: 19–28 [DOI] [PMC free article] [PubMed] [Google Scholar]
- Li Y, Lee KK, Walsh S, Smith C, Hadingham S, Sorefan K, Cawley G, Bevan MW. (2006) Establishing glucose- and ABA-regulated transcription networks in Arabidopsis by microarray analysis and promoter classification using a Relevance Vector Machine. Genome Res 16: 414–427 [DOI] [PMC free article] [PubMed] [Google Scholar]
- Lim PO, Kim HJ, Nam HG. (2007) Leaf senescence. Annu Rev Plant Biol 58: 115–136 [DOI] [PubMed] [Google Scholar]
- Liu FL, Jensen CR, Andersen MN. (2004) Drought stress effect on carbohydrate concentration in soybean leaves and pods during early reproductive development: its implication in altering pod set. Field Crops Res 86: 1–13 [Google Scholar]
- Lorrain S, Allen T, Duek PD, Whitelam GC, Fankhauser C. (2008) Phytochrome-mediated inhibition of shade avoidance involves degradation of growth-promoting bHLH transcription factors. Plant J 53: 312–323 [DOI] [PubMed] [Google Scholar]
- Mandaokar A, Thines B, Shin B, Lange BM, Choi G, Koo YJ, Yoo YJ, Choi YD, Choi G, Browse J. (2006) Transcriptional regulators of stamen development in Arabidopsis identified by transcriptional profiling. Plant J 46: 984–1008 [DOI] [PubMed] [Google Scholar]
- McCurdy RD, McGrath JJ, Mackay-Sim A. (2008) Validation of the comparative quantification method of real-time PCR analysis and a cautionary tale of housekeeping gene selection. Gene Ther Mol Biol 12: 15–24 [Google Scholar]
- McKenzie MJ, Greer LA, Heyes JA, Hurst PL. (2004) Sugar metabolism and compartmentation in asparagus and broccoli during controlled atmosphere storage. Postharvest Biol Technol 32: 45–56 [Google Scholar]
- Nam HG. (1997) The molecular genetic analysis of leaf senescence. Curr Opin Biotechnol 8: 200–207 [DOI] [PubMed] [Google Scholar]
- Oh SA, Park JH, Lee GI, Paek KH, Park SK, Nam HG. (1997) Identification of three genetic loci controlling leaf senescence in Arabidopsis thaliana. Plant J 12: 527–535 [DOI] [PubMed] [Google Scholar]
- Page T, Griffiths G, Buchanan-Wollaston V. (2001) Molecular and biochemical characterization of postharvest senescence in broccoli. Plant Physiol 125: 718–727 [DOI] [PMC free article] [PubMed] [Google Scholar]
- Parlitz S, Kunze R, Mueller-Roeber B, Balazadeh S. (2011) Regulation of photosynthesis and transcription factor expression by leaf shading and re-illumination in Arabidopsis thaliana leaves. J Plant Physiol 168: 1311–1319 [DOI] [PubMed] [Google Scholar]
- Pina C, Pinto F, Feijó JA, Becker JD. (2005) Gene family analysis of the Arabidopsis pollen transcriptome reveals biological implications for cell growth, division control, and gene expression regulation. Plant Physiol 138: 744–756 [DOI] [PMC free article] [PubMed] [Google Scholar]
- Schippers JHM, Jing HC, Hille J, Dijkwel PP. (2007) Developmental and hormonal control of leaf senescence. In S Gan, J Roberts, eds, Annual Plant Reviews: Senescence Processes in Plants, Vol 26. Blackwell Publishing, Oxford, pp 145–170 [Google Scholar]
- Sharabi-Schwager M, Lers A, Samach A, Guy CL, Porat R. (2010) Overexpression of the CBF2 transcriptional activator in Arabidopsis delays leaf senescence and extends plant longevity. J Exp Bot 61: 261–273 [DOI] [PMC free article] [PubMed] [Google Scholar]
- Slade AJ, Knauf VC. (2005) TILLING moves beyond functional genomics into crop improvement. Transgenic Res 14: 109–115 [DOI] [PubMed] [Google Scholar]
- Smeekens S, Ma JK, Hanson J, Rolland F. (2010) Sugar signals and molecular networks controlling plant growth. Curr Opin Plant Biol 13: 274–279 [DOI] [PubMed] [Google Scholar]
- Smith AM, Stitt M. (2007) Coordination of carbon supply and plant growth. Plant Cell Environ 30: 1126–1149 [DOI] [PubMed] [Google Scholar]
- Smyth GK. (2004) Linear models and empirical Bayes methods for assessing differential expression in microarray experiments. Stat Appl Genet Mol Biol 3: e3. [DOI] [PubMed] [Google Scholar]
- Stintzi A, Browse J. (2000) The Arabidopsis male-sterile mutant, opr3, lacks the 12-oxophytodienoic acid reductase required for jasmonate synthesis. Proc Natl Acad Sci USA 97: 10625–10630 [DOI] [PMC free article] [PubMed] [Google Scholar]
- Thimann KV. (1980) The senescence of leaves. In KV Thimann, ed, Senescence in Plants. CRC Press, Boca Raton, FL, pp 85–115 [Google Scholar]
- Thimann KV, Tetley RM, Krivak BM. (1977) Metabolism of oat leaves during senescence. V. Senescence in light. Plant Physiol 59: 448–454 [DOI] [PMC free article] [PubMed] [Google Scholar]
- Tian MS, Davies L, Downs CG, Liu XF, Lill RE. (1995) Effects of floret maturity, cytokinin and ethylene on broccoli yellowing after harvest. Postharvest Biol Technol 6: 29–40 [Google Scholar]
- Town CD, Cheung F, Maiti R, Crabtree J, Haas BJ, Wortman JR, Hine EE, Althoff R, Arbogast TS, Tallon LJ, et al. (2006) Comparative genomics of Brassica oleracea and Arabidopsis thaliana reveal gene loss, fragmentation, and dispersal after polyploidy. Plant Cell 18: 1348–1359 [DOI] [PMC free article] [PubMed] [Google Scholar]
- Usadel B, Bläsing OE, Gibon Y, Retzlaff K, Höhne M, Günther M, Stitt M. (2008) Global transcript levels respond to small changes of the carbon status during progressive exhaustion of carbohydrates in Arabidopsis rosettes. Plant Physiol 146: 1834–1861 [DOI] [PMC free article] [PubMed] [Google Scholar]
- Usadel B, Poree F, Nagel A, Lohse M, Czedik-Eysenberg A, Stitt M. (2009) A guide to using MapMan to visualize and compare omics data in plants: a case study in the crop species, maize. Plant Cell Environ 32: 1211–1229 [DOI] [PubMed] [Google Scholar]
- van der Graaff E, Schwacke R, Schneider A, Desimone M, Flügge UI, Kunze R. (2006) Transcription analysis of Arabidopsis membrane transporters and hormone pathways during developmental and induced leaf senescence. Plant Physiol 141: 776–792 [DOI] [PMC free article] [PubMed] [Google Scholar]
- van Doorn WG. (2005) Plant programmed cell death and the point of no return. Trends Plant Sci 10: 478–483 [DOI] [PubMed] [Google Scholar]
- Weaver LM, Amasino RM. (2001) Senescence is induced in individually darkened Arabidopsis leaves, but inhibited in whole darkened plants. Plant Physiol 127: 876–886 [PMC free article] [PubMed] [Google Scholar]
- Weaver LM, Gan SS, Quirino B, Amasino RM. (1998) A comparison of the expression patterns of several senescence-associated genes in response to stress and hormone treatment. Plant Mol Biol 37: 455–469 [DOI] [PubMed] [Google Scholar]
- Wingler A, Purdy S, MacLean JA, Pourtau N. (2006) The role of sugars in integrating environmental signals during the regulation of leaf senescence. J Exp Bot 57: 391–399 [DOI] [PubMed] [Google Scholar]
- Wintermans JFGM, De Mots A. (1965) Spectrophotometric characteristics of chlorophylls a and b and their phenophytins in ethanol. Biochim Biophys Acta 109: 448–453 [DOI] [PubMed] [Google Scholar]
- Woo HR, Chung KM, Park JH, Oh SA, Ahn T, Hong SH, Jang SK, Nam HG. (2001) ORE9, an F-box protein that regulates leaf senescence in Arabidopsis. Plant Cell 13: 1779–1790 [DOI] [PMC free article] [PubMed] [Google Scholar]
- Wood AJ, Lo TW, Zeitler B, Pickle CS, Ralston EJ, Lee AH, Amora R, Miller JC, Leung E, Meng XD, et al. (2011) Targeted genome editing across species using ZFNs and TALENs. Science 333: 307. [DOI] [PMC free article] [PubMed] [Google Scholar]
- Zhang K, Gan SS. (2012) An abscisic acid-AtNAP transcription factor-SAG113 protein phosphatase 2C regulatory chain for controlling dehydration in senescing Arabidopsis leaves. Plant Physiol 158: 961–969 [DOI] [PMC free article] [PubMed] [Google Scholar]
Associated Data
This section collects any data citations, data availability statements, or supplementary materials included in this article.