Abstract
The potential of laser desorption postionization mass spectrometry (LDPI-MS) imaging for small molecule quantification is demonstrated here. The N-methylpiperazine acetamide of (MPA) ampicillin was adsorbed into polyelectrolyte multilayer surface coatings composed of chitosan and alginate, both high molecular weight biopolymers. These MPA-ampicillin spiked multilayers were then shown to inhibit the growth of E. faecalis biofilms that play a role in early stage infection of implanted medical devices. Finally, LDPI-MS imaging using 7.87 eV single photon ionization was found to detect MPA-ampicillin with the multilayers before and after biofilm growth with limits of quantification and detection of 0.6 and 0.3 nmoles, respectively. The capabilities of LDPI-MS imaging for small molecule quantification are compared to those of MALDI-MS. Furthermore, these results indicate that 7.87 eV LDPI-MS imaging should be applicable to quantification of a range of small molecular species on a variety of complex organic and biological surfaces. Finally, while MS imaging for quantification was demonstrated here using LDPI, it is a generally useful strategy that can be applied to other methods.
I. Introduction
Traditional quantification techniques based on gas or liquid chromatography mass spectrometry generally require several time-consuming sample cleanup procedures prior to analysis. Over the past decade, matrix assisted laser desorption ionization mass spectrometry (MALDI-MS) has been applied to the rapid quantification of analytes with high sample throughput and simple sample preparation.1–5 However, quantification by MALDI-MS involves several challenges with respect to reproducibility, matrix application and small molecule quantification.
This work demonstrates the potential of laser desorption postionization mass spectrometry (LDPI-MS) imaging for small molecule quantification. LDPI-MS addresses some of the limitations of MALDI-MS quantification while retaining the latter’s benefits of rapid sample throughput and simple sample preparation. LDPI-MS employs vacuum ultraviolet (VUV) radiation for single photon ionization of laser desorbed neutrals.6–8 Use of VUV radiation from the fluorine laser allows single photon ionization of only those analytes with ionization energies below 7.87 eV and in the case of analyte-cluster formation,9 up to ~8.3 eV. This selective ionization simplifies mass spectra, minimizes background signal, and improves signal to noise. Furthermore, derivatization with a low ionization energy tag or chromophore allows 7.87 eV single photon ionization of high ionization energy species.6,7 For example, ampicillin cannot be directly identified by 7.87 eV LDPI-MS,10 but prior results indicate it should be detectable upon derivatization with piperazine.11 MS imaging detects analyte over an entire sample surface, further improving quantification of spatially inhomogeneous analyte distributions. Thus, LDPI-MS imaging should be a robust tool for small molecule quantification with potential applications in the direct analysis of bacterial biofilms on medical devices.7,12
Implanted medical devices are often plagued by colonization with bacterial and/or fungal biofilms, so control of biofilm growth is essential to improve device efficacy and longevity.13 Enterococcus faecalis is an opportunistic pathogen and a natural inhabitant of mammalian gastrointestinal tracts that is also a major cause of infections of the urinary tract, respiratory tract, general skin wounds, root canal and various medical implants.14,15 For example, E. faecalis biofilms are known to colonize peri-prosthesis tissues and to spread out as causative agents of orthopedic implant infections.16 Early stage E. faecalis biofilm formation on medical devices generally occurs within days of implantation17 and often results from inoculation by endogenous bacteria.
Various strategies exist to prevent early stage biofilm formation on implanted medical devices, biomaterials, and other surfaces where biofilm formation is deleterious to designed function.18–22 This work examines the prevention of early stage biofilm formation on medical devices by use of a polyelectrolyte multilayer surface coatings composed of chitosan and alginate, both high molecular weight biopolymers.9 The antimicrobial properties of chitosan have been well studied.23,24 Multilayers composed of chitosan were also found to be antimicrobial25 and chitosan-alginate multilayers have been used for slow release of the common antibiotic ampicillin.26 Ampicillin is derivatized here with piperazine to form the N-methylpiperazine acetamide of ampicillin. The resultant compound is called MPA-ampicillin and it is detected quantitatively by 7.87 eV LDPI-MS when adsorbed in chitosan-alginate multilayers. MPA-ampicillin spiked multilayers are then shown to inhibit the growth of E. faecalis biofilms. Finally, LDPI-MS imaging is used to determine how much of an initial minimum inhibitory concentration of MPA-ampicillin remained in the multilayer after exposure to the biofilm.
II. EXPERIMENTAL DETAILS
7.87 eV LDPI-MS Imaging and MALDI-MS
7.87 eV LDPI-MS imaging was performed using a custom built instrument described in detail previously.7 Briefly, the instrument was equipped with a 349 nm Nd:YLF desorption laser operating at 100 Hz, with a spot size of ~20 μm diameter and typical desorption laser peak power density ranging from 30 to 70 MW/cm2. The sample was rastered at 625 μm/s across a ~1×1 cm square pattern such that no spot on the surface was sampled by more than three individual laser shots. The laser desorbed species at each spot were photoionized by 7.87 eV photon energy pulsed radiation from a fluorine excimer laser and the resultant MS image was processed using open source software (BioMap V 3808, http://maldi-msi.org). Average mass spectra were extracted from each image by creating a region of interest (ROI) using analyte peak localization on the sample. These average mass spectra were used to calculate the peak area for analyte and internal standard via commercial software (OriginPro 8.5). Mass calibration was performed using a mixture of oligothiophenes and 2,5-dihydroxybenzoic acid to calibrate on peaks at m/z 22.99, 154.02, 329.97, 409.93, 493.94 and 657.90.
Linearity as well as limits of quantification and detection (LOQ and LOD, respectively) were determined for LDPI-MS on multilayer samples (see below). 0.3, 0.6, 1.2, 3.1, 10.2, 20.4 and 40.9 nmole aloquots of MPA-ampicillin dissolved in water:acetonitrile (7:3 v:v) were added to separate multilayers. These were allowed to dry in air for 20 min prior to the addition of 18.3 nmoles of sulfadiazine as an internal standard, then air dried again. These multilayers were then analyzed by LDPI-MS imaging for determination of MPA-ampicillin signal linearity with concentration, LOQ, and LOD. MPA-ampicillin spiked multilayers were used for efficacy studies, but the internal standard was added only immediately prior to LDPI-MS imaging. A minimum of three trials were performed for linearity, LOQ, and LOD determination.
The MALDI-MS (4700 TOF/TOF, AB SCIEX, Foster City, CA, USA) used a 355 nm Nd:YAG laser operating at 200 Hz with a laser spot size of ~150 μm and laser power set to ~10 μJ. Collision induced dissociation was performed with helium and mass calibration was performed using the standard calibration mixture (mass standards kit for calibration, 4333604, AB SCIEX).
Preparation of MPA-Ampicillin and Multilayers
The N-methylpiperazine acetamide of ampicillin was prepared in house using previously described methods.11 Ten layer chitosan-alginate polyelectrolyte multilayers were prepared on 0.5 mm thick silicon substrates coated with 100 nm of gold (Sigma-Aldrich) and verified by X-ray photoelectron spectroscopy and attenuated total reflection Fourier transform infrared spectroscopy, as described previously.9
E. faecalis Colony Biofilm Growth and MPA-Ampicillin Activity
Polycarbonate membranes (Millipore, 0.20 μm pore size, 25 mm diameter, Fisher Scientific) were inoculated with 40 μL of 106 colony forming units (CFU) of E. faecalis V583 cultures (ATCC 700802, American Type Culture Collection, Manassus, VA), then grown on tryptic soy agar (TSA) at 37°C for three days while replenishing the agar plate daily.8,20 A growth curve for E. faecalis colony biofilms (see Supporting Information) indicated growth for three days was sufficient to form a mature biofilm. The MPA-ampicillin spiked multilayers were sterilized by 20 min exposure to radiation from a germicidal ultraviolet lamp (254 nm, 4.8 watts, held ~30 cm from the sample, G15T8, Osram Sylvania, Danvers, MA). Figure 1 displays a schematic of the biofilm inhibition procedure: sterilized MPA-ampicillin spiked multilayers were placed on agar plates and mature biofilms on membranes were placed over the multilayers, completely covering them. These efficacy studies were performed in TSA media for 18 h, after which viable cells in the biofilms were counted by microdilution plating. A minimum of three trials were performed for each concentration of MPA-ampicillin.
Figure 1.
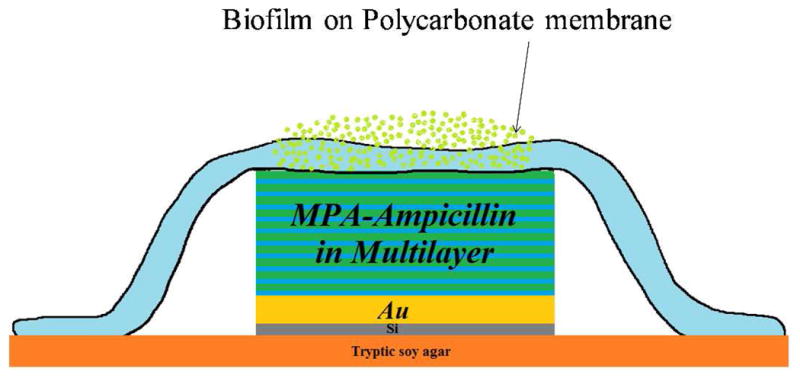
Schematics showing the experimental protocol for biofilm inhibition by MPA-Ampicillin.
III. RESULTS
LDPI-MS of MPA-Ampicillin Neat and in Multilayers
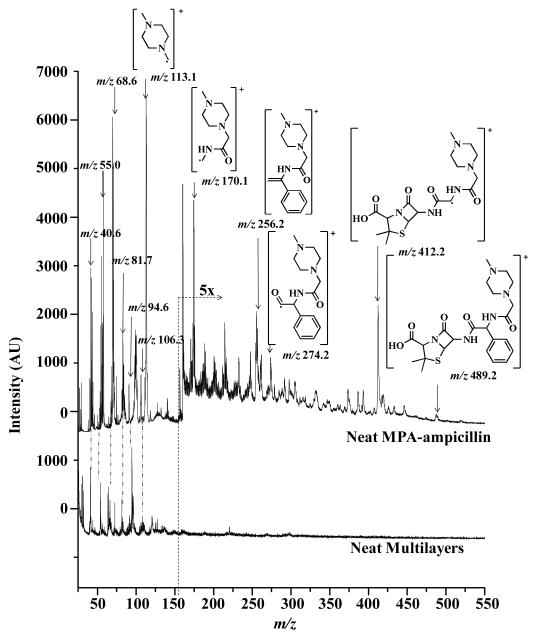
Figure 2 displays 7.87 eV LDPI-MS of neat MPA-ampicillin, with the parent ion at m/z 489.2 and several predicted characteristic fragment ions (structures shown). The characteristic fragment at m/z 412.2 was attributed to the parent ion after loss of benzene from the ampicillin moiety. M/z 274.2 was attributed to the cleavage of the amide bond in the ampicillin moiety, similar to the b-type fragment ions commonly observed in peptides. M/z 256.2 was attributed to loss of water after amide bond cleavage, also consistent with peptide fragmentation where water or ammonia losses from y and b type ions are commonly observed. M/z 170.1 was attributed to the cleavage of the piperazine derivative from the ampicillin moiety and m/z 113.1 was attributed to piperazine.
Figure 2.
7.87 eV laser desorption postionization mass spectra (LDPI-MS, top trace) of neat N-methylpiperazine acetamide of ampicillin (called MPA-ampicillin) shown with the structures of the parent ion and characteristic fragments. Bottom trace displays 7.87 eV LDPI-MS from neat multilayers.
Several fragments observed in LDPI-MS were also observed in the MALDI-MS/MS of the m/z 490.2 protonated parent of MPA-ampicillin (see Supporting Information). The MALDI-MS/MS fragments at m/z 257.1 and 114.1 displayed similar structures to those observed in LDPI-MS, except that the former were protonated. Furthermore, m/z 158.2 observed in the MALDI-MS/MS was similar to m/z 170.1 observed in LDPI-MS, except that the former cleaved immediately adjacent to the amide bond while the latter cleaved one bond away.
The high intensity of the m/z 113.1 peak is consistent with charge residing on the piperazine moiety for all the fragments, as it does following collision induced dissociation of protonated peptides functionalized with piperazine.27 Electronic structure calculations indicated that 7.87 eV single photon ionization is localized on the piperazine chromophore,11 further evidence that this moiety serves as the site of positive charge localization on the cation. Prior 7.87 eV single photon ionization analyses of high ionization energy species derivatized with low ionization energy chromophores typically display intense ions composed in part or entirely of the chromophore.7,11
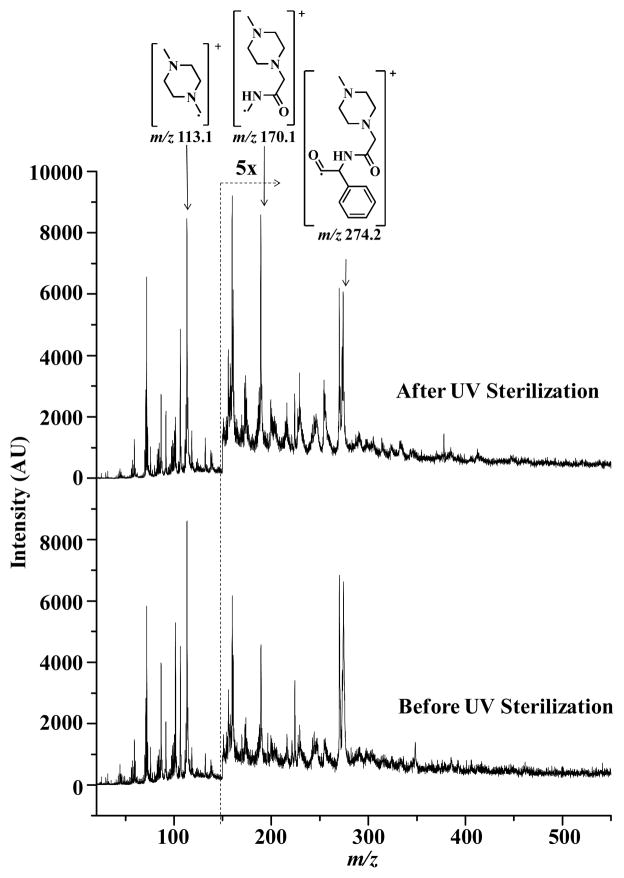
Figure 3 shows the 7.87 eV LDPI imaging mass spectra of 3.1 nmoles of MPA-ampicillin adsorbed onto chitosan-alginate polyelectrolyte multilayers before and after UV sterilization: these spectra indicate that the antibiotic spiked into these multilayers is stable to this level of UV exposure. The antibiotic spiked multilayer displays characteristic fragments of MPA-ampicillin at m/z 274.2, 170.1 and 113.1. Several peaks at m/z 270.1 and below m/z 150 appeared from desorption laser-induced pyrolysis of the multilayer.9 The bottom and top traces show mass spectra before and after UV sterilization, respectively, again indicating no significant differences in the fragmentation pattern of MPA-ampicillin. It is concluded that photolysis or other modification of the antibiotic or multilayer did not result from UV sterilization.
Figure 3.
7.87 eV LDPI-MS spectra of MPA-ampicillin adsorbed on multilayer surface before and after UV sterilization with peaks characteristic to MPA-ampicillin labeled.
MALDI-MS/MS was also performed on the UV sterilized multilayer surfaces with adsorbed antibiotic: no significant difference was observed in the MALDI-MS/MS of the protonated parent of MPA-ampicillin before and after sterilization (see Supporting Information). However, the protonated parent signal observed by MALDI-MS (data not shown) was more intense with respect to MPA-ampicillin fragments compared to the radical cation parent observed by LDPI-MS. Furthermore, several matrix and multilayer interference peaks were also observed at masses below m/z 300 in MALDI-MS that were absent in LDPI-MS.
LDPI-MS analysis of MPA-ampicillin in multilayers resulted in the complete removal of not only the multilayer, but based upon visual analysis, also the ~100 nm thick gold coating from the underlying silicon substrate. This indicated that LDPI-MS sampled through the entire depth of the multilayer surface while MALDI-MS relied upon the matrix to extract the analyte from the multilayer. However, the high laser fluence employed here for Au film desorption likely imparted more internal energy into the desorbed neutrals, enhancing fragmentation upon single photon ionization and reducing the parent ion signal.6,7
Parent ion signal by LDPI-MS for neat MPA-ampicillin was much lower in intensity compared to the fragment ions and for multilayer samples, no parent ion was observed. The piperazine fragment ion at m/z 113.1 was observed as the most intense ion from both neat and multilayer samples. There was also a low multilayer-only signal present at m/z 113.1, but the piperazine ion signal at this mass was ~100× higher, facilitating quantification. Similarly, m/z 186.4 was observed as the most intense peak for the internal standard. Hence, the fragment peaks at m/z 113.1 for MPA-ampicillin and m/z 186.4 for the sulfadiazine internal standard were chosen for quantification of MPA-ampicillin. Attempts to use the other MPA-ampicillin peaks observed from the multilayer for quantification were not successful due to the relatively low signal to noise ratios of both the m/z 170.1 and 274.2 peaks and the proximity of the latter to a multilayer-only peak.
Inhibition of Intact E. faecalis Colony Biofilms by MPA-Ampicillin
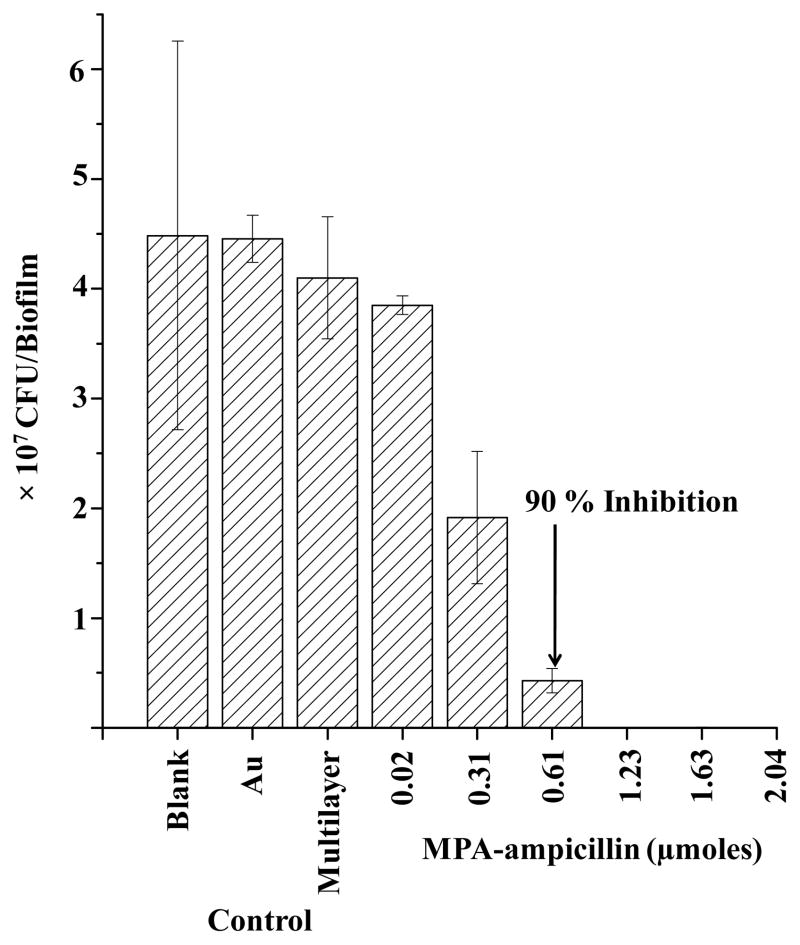
The antibiotic was found to inhibit E. faecalis biofilms growth after 18 h of incubation by the procedure shown in Figure 1. Figure 4 shows the results of this procedure, the inhibition plot against E. faecalis colony biofilms for multilayers spiked with 0.02 to 2.0 μmole aliquots of MPA-ampicillin. Controls consisted of no substrate applied to the biofilm (marked “Blank” in Figure 4), gold-only substrate (“Au)” and multilayer without antibiotic (“Multilayer”): all these samples were incubated with the intact biofilms grown on a 25 mm diameter polycarbonate membrane for 18 h. After incubation, the number of colony forming units (CFU) in each entire biofilm was determined by the microdilution plating method. There was no significant inhibition observed in controls when MPA-ampicillin was absent, while for the Au control there was ~2% inhibition. The multilayer control displayed an ~8% inhibition, consistent with the antimicrobial properties of the chitosan component of the multilayer.23–25
Figure 4.
Inhibition plot for MPA-ampicillin adsorbed on multilayer surface against E. faecalis colony biofilms. or 2.32±0.07 × 10⁴ CFU was observed at 1.23 μmoles MPA-ampicillin and no CFU were observed at ≥1.63 μmoles.
The 90% minimum biofilm inhibitory concentration, (MBIC)90, for MPA-ampicillin adsorbed on multilayer surfaces against these E. faecalis biofilms was achieved by the addition of 0.61 μmoles. 99.9 % inhibition (2.32±0.07 × 10⁴ CFU) was observed by the addition of 1.23 μmoles of MPA-ampicillin and no CFU were observed for larger amounts of antibiotic.
Linearity Range and Analytical Sensitivity of 7.87 eV LDPI-MS Imaging
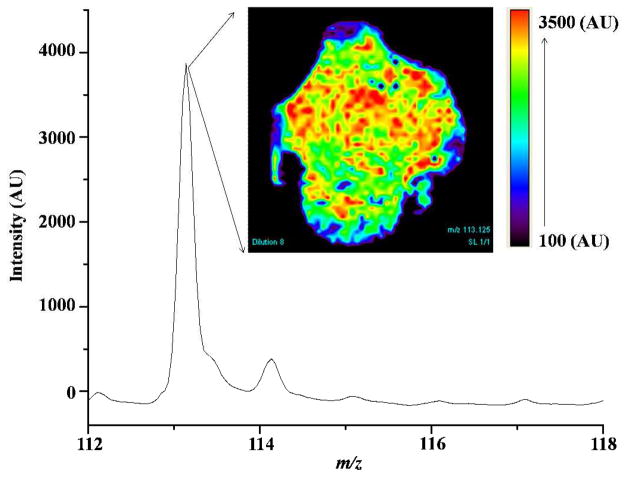
MPA-ampicillin was spotted in amounts ranging from 0.3 to 40.9 nmoles onto multilayer surfaces along with known amounts of sulfadiazine as an internal standard, then analyzed by LDPI-MS imaging. The top right corner of Figure 5 shows a representative MS image for m/z 113.1 (MPA-ampicillin fragment) extracted from LDPI-MS data recorded from a 1×1 cm square antibiotic spiked multilayer. The colored region in the image shows the distribution of MPA-ampicillin and the black region shows its absence in the multilayer. The mass spectrum of the m/z 113.1 piperazine fragment was extracted by averaging over the region of interest (ROI) where the analyte was distributed in a 0.6 to 0.8 cm diameter spot on the multilayer surface. The area of MPA-ampicillin to internal standard peak ratio (ration of m/z 113.1 to 186.4) was calculated at each concentration using the averaged mass spectra from the LDPI-MS image, then used to determine linearity. The linearity range for MPA-ampicillin spiked multilayers was established to be 0.6 to 20 nmoles with R2 of 0.986 (see Supporting Information). The LOQ was 0.6 nmoles with S/N 9 and the LOD was 0.3 nmoles with S/N 6.
Figure 5.
7.87 eV LDPI-MS image (1×1 cm) shows the distribution of MPA-ampicillin (m/z 113.1) on the multilayer surface (inset) and the averaged mass spectrum from the region of interest (ROI).
Quantification of MPA-Ampicillin in Multilayers After Biofilm Growth
A 90% biofilm-inhibiting amount of MPA-ampicillin adsorbed on multilayers was incubated with E. faecalis biofilms for 18h, then the multilayers were treated with internal standard. Analysis by LDPI-MS imaging found that only 0.7% or 3.6 nmoles (RSD of 16.0%) of the initial 0.61 μmoles of MPA-ampicillin remained on the multilayer surface after incubation with the biofilm. The area of MPA-ampicillin to internal standard peak ratio was calculated from the MS image spectra, then the linear regression established above employed to determine the amount of MPA-ampicillin remaining on the multilayer after incubation.
IV. DISCUSSION
Implications for Preventing Infections on Medical Devices
Previous work found that chitosan-alginate polyelectrolyte multilayer surfaces can be used for slow release of ampicillin.26 It is demonstrated here that 0.61 and 1.23 μmoles MPA-ampicillin inhibited 90% and 99.9% of a 25 mm diam E. faecalis biofilm over an 18 h exposure, respectively. If all the MPA-ampicillin instantaneously transferred to the biofilms, assumed to be 0.5 mm thick, then 90% inhibition of the biofilm occurred at ~1 mg/ml antibiotic concentration. While only 0.7% of the antibiotic remained on the multilayer after a 90% inhibiting exposure, prior results indicate that significant release of antibiotic likely continues over several hours, making the instantaneous concentration of MPA-ampicillin in the biofilm ≪1 mg/ml.26 This timescale of release should be effective given that E. faecalis shows high initial adhesion on several common polymeric biomaterials within 3 h of exposure.17 The results of Figure 4, the antibiotic release timescale,26 and the short term adhesion of microbes17 collectively indicate that MPA-ampicillin spiked multilayers should be effective for preventing E. faecalis biofilm formation on medical devices and implants for the first day following implantation.
Quantification by LDPI-MS Imaging vs. MALDI-MS
7.87 eV LDPI-MS imaging was demonstrated to rapidly quantify a small molecule analyte on intact polyelectrolyte multilayers. The power of using MS imaging for quantification lay in its ability to average data over a large area, improving statistics and reducing spot-to-spot variations that can result from sample heterogeneity, fluctuations in desorption efficiencies, and/or other effects. MS imaging for quantification was demonstrated here using LDPI, but is a generally useful strategy that can be applied to other methods. For example, the imaging for quantification strategy should work equally well with MALDI given that non imaging MALDI-MS quantification has been demonstrated for various analytes and samples without prior preparation.1–4
Several issues must be considered when comparing quantification by LDPI-MS and MALDI-MS. The home-built LDPI-MS instrument employed here displayed a mass resolution of ~500 and a mass accuracy of ~340 ppm at m/z 154. These values are much lower than those available with typical commercial MALDI-MS instruments. Combined with its lack of MS/MS capability, this particular LDPI-MS instrument is admittedly limited in its ability to identify compounds based upon their observed peaks. However, future instrumental developments and other sample treatment strategies are expected overcome at least some of these difficulties, as discussed elsewhere.28
While MALDI-MS often observes intact protonated parents of an analyte, 7.87 eV LDPI-MS can display significant fragmentation of the analyte. Fragmentation in LDPI-MS appears to be dominated by energy transfer during the laser desorption event.28,29 Thus, changes in the laser desorption power could vary the degree of fragmentation. The experiments here were performed under constant and relatively high laser desorption power to keep this effect constant and prevent it from affecting quantification. It must also be noted that protonated parent fragmentation is also affected by laser desorption power in MALDI-MS,30 so both methods require careful controls to avoid this problem.
One limiting factor in quantification by MALDI-MS is the need for the addition of matrix which is known to affect sensitivity and reproducibility. Inhomogeneous co-crystallization of matrix and analyte is another additional factor to consider when using MALDI-MS for quantification, particularly when ion signal intensity is derived from single or multiple laser shots. Matrix thickness and matrix-to-analyte ratio are also known to strongly affect ion signal in MALDI-MS.31 LDPI-MS entirely avoids the various quantification-inhibiting effects of matrix application that accompany MALDI-MS analysis of small molecules. Even homogenous application of MALDI matrix can result in matrix crystals that differ in size, quality, analyte extraction efficiency, and density per unit surface. All these factors can vary with the local physical properties of the sample surface, affecting information regarding analyte distributions.32 By contrast, LDPI-MS uses no matrix and hence avoids these limitations.
Competing endogenous species such as proteins or lipids can cause significant ion suppression of the analyte signal as well as compound-dependent ionization efficiencies which will hinder quantification by MALDI-MS, especially in complex samples.32 For example, certain endogenous compounds can have higher proton affinity which allows them to successfully compete for charge with the analyte. Such effects can be reduced by maintaining a constant sample composition for MALDI quantification.33 Use of an internal standard can mitigate this effect, although homogenous introduction of an internal standard on the sample surface is required.32 By contrast, desorption is independent of ionization in LDPI-MS, which additionally selectively ionizes only those analytes whose ionization energy is lower than 7.87 eV. In the absence of secondary proton transfer events observed at elevated pressures, most endogenous compounds will not be ionized and neither competitive ionization nor ion suppression effects should occur in LDPI-MS. Unlike atmospheric pressure photoionization, proton transfer events are not expected here due to the low pressures in the source of the LDPI-MS.28
There are several positive attributes of MALDI-MS that render it preferable for quantification, including the observation that it can approach attomole sensitivity.3,4,32 By contrast, LDPI-MS is only observed here to display 0.3 nanomole sensitivity (LOD). However, this comparison is premature given that commercial MALDI-MS instruments benefited from two decades of development while the LDPI-MS instrument utilized here is a home-built, noncommercial prototype. Another positive aspect of MALDI-MS is the versatility of this ionization method: thermally labile, low mass analytes as well as involatile, high mass biopolymers including for proteins, peptides, lipids, and some pharmaceuticals can all be ionized by MALDI.33
Nevertheless, the ability for selective ionization of low ionization energy analytes by 7.87 eV LDPI-MS for some small molecule analytes provides the advantage of simplifying mass spectra, minimizing background, and improving sensitivity. Overall, 7.87 eV LDPI-MS imaging at this stage should be seen as a complimentary tool still under development for rapid quantification of small molecule analytes without the need for expensive sample clean up procedures. Furthermore, these results indicate that 7.87 eV LDPI-MS imaging should be applicable to quantification of a range of small molecular species on a variety of complex organic and biological surfaces. Finally, the recent development of a new source of 10.5 eV radiation for the LDPI-MS should allow quantification of an even wider range of species.28
Supplementary Material
Acknowledgments
This work was supported by the National Institute of Biomedical Imaging and Bioengineering via grant EB006532. The contents of this manuscript are solely the responsibility of the authors and do not necessarily represent the official views of the National Institute of Biomedical Imaging and Bioengineering or the National Institutes of Health. The authors thank Lasanthi P. Jayathilaka of the UIC Research Resources Center for synthesizing and purifying MPA-ampicillin and Laura Anderson for assistance in naming the compound.
References
- 1.Hatsis P, Brombacher S, Corr J, Kovarik P, Volmer DA. Rap Comm Mass Spectrom. 2003;17:2303–2309. doi: 10.1002/rcm.1192. [DOI] [PubMed] [Google Scholar]
- 2.Persike M, Karas M. Rap Comm Mass Spectrom. 2009;23:3555–3562. doi: 10.1002/rcm.4283. [DOI] [PubMed] [Google Scholar]
- 3.Arnold A, Arrey TN, Karas M, Persike M. Rap Comm Mass Spectrom. 2011;25:2844–2850. doi: 10.1002/rcm.5170. [DOI] [PubMed] [Google Scholar]
- 4.Anderson DS, Kirchner M, Kellogg M, Kalish LA, Jeong JY, Vanasse G, Berliner N, Fleming MD, Steen H. Anal Chem. 2011;83:8357–8362. doi: 10.1021/ac2020905. [DOI] [PubMed] [Google Scholar]
- 5.Persike M, Zimmermann M, Klein J, Karas M. Anal Chem. 2010;82:922–929. doi: 10.1021/ac902130h. [DOI] [PubMed] [Google Scholar]
- 6.Hanley L, Zimmermann R. Anal Chem. 2009;81:4174–4182. doi: 10.1021/ac8013675. and references therein. [DOI] [PMC free article] [PubMed] [Google Scholar]
- 7.Akhmetov A, Moore JF, Gasper GL, Koin PJ, Hanley L. J Mass Spectrom. 2010;45:137–145. doi: 10.1002/jms.1716. and references therein. [DOI] [PMC free article] [PubMed] [Google Scholar]
- 8.Gasper GL, Takahashi LK, Zhou J, Ahmed M, Moore JF, Hanley L. Anal Chem. 2010;82:7472–7478. doi: 10.1021/ac101667q. [DOI] [PMC free article] [PubMed] [Google Scholar]
- 9.Blaze MTM, Takahashi LK, Zhou J, Ahmed M, Gasper GL, Pleticha FD, Hanley L. Anal Chem. 2011;83:4962–4969. doi: 10.1021/ac200693h. [DOI] [PMC free article] [PubMed] [Google Scholar]
- 10.Gasper GL. PhD thesis. University of Illinois; Chicago: 2011. [Google Scholar]
- 11.Akhmetov A, Edirisinghe PD, Hanley L. Proc. 59th ASMS Conf. Mass Spectrom. Allied Topics; Denver, CO. 2011. p. 586. [Google Scholar]
- 12.Vertes A, Hitchins V, Phillips KS. Anal Chem. 2012;84:3858–3866. doi: 10.1021/ac2029997. [DOI] [PubMed] [Google Scholar]
- 13.Ghannoum M, O’Toole GA, editors. Microbial Biofilms. ASM Press; Washington, D.C: 2004. [Google Scholar]
- 14.Tailor SA, Bailey EM, Rybak MJ. Ann Pharmacother. 1993;27:1231–1242. doi: 10.1177/106002809302701014. [DOI] [PubMed] [Google Scholar]
- 15.Klare I, Werner GWW. Contrib Microbiol. 2001;8:108–122. doi: 10.1159/000060406. [DOI] [PubMed] [Google Scholar]
- 16.Arciola CR, Baldassarri L, Campoccia D, Creti R, Pirini V, Huebner J, Montanaro L. Biomater. 2008;29:580–586. doi: 10.1016/j.biomaterials.2007.10.008. [DOI] [PubMed] [Google Scholar]
- 17.Sénéchal A, Catuogno C, Tabrizian M. J Biomater Sci: Polym Ed. 2005;16:112–126. doi: 10.1163/1568562052843311. [DOI] [PubMed] [Google Scholar]
- 18.Kingshott P, Wei J, Bagge-Ravn D, Gadegaard N, Gram L. Lang. 2003;19:6912–6921. [Google Scholar]
- 19.Musk DJJ, Hergenrother PJ. Curr Medicin Chem. 2006;13:2163–2177. doi: 10.2174/092986706777935212. [DOI] [PubMed] [Google Scholar]
- 20.Aydin Sevinc B, Hanley L. J Biomed Mater Res B. 2010;94B:22–31. doi: 10.1002/jbm.b.31620. [DOI] [PMC free article] [PubMed] [Google Scholar]
- 21.Vasilev K, Sah V, Anselme K, Ndi C, Mateescu M, Dollmann B, Martinek P, Ys H, Ploux L, Griesser HJ. Nano Lett. 2010;10:202–207. doi: 10.1021/nl903274q. [DOI] [PubMed] [Google Scholar]
- 22.Green JBD, Fulghum T, Nordhaus MA. Biointerph. 2011;6:MR13. doi: 10.1116/1.3645195. [DOI] [PubMed] [Google Scholar]
- 23.Rabea EI, Badawy ET, Stevens CV, Smagghe G, Steurbaut Biomacromol. 2003;4:1457–1465. doi: 10.1021/bm034130m. [DOI] [PubMed] [Google Scholar]
- 24.Carlson RP, Taffs R, Davidson WD, Stewart PS. J Biomater Sci: Polym Ed. 2008;19:1035–1046. doi: 10.1163/156856208784909372. [DOI] [PubMed] [Google Scholar]
- 25.Fu J, Ji J, Yuan W, Shen J. Biomater. 2005;26:6684–6692. doi: 10.1016/j.biomaterials.2005.04.034. [DOI] [PubMed] [Google Scholar]
- 26.Anal A, Stevens W. Inter J Pharmaceut. 2005;290:45–54. doi: 10.1016/j.ijpharm.2004.11.015. [DOI] [PubMed] [Google Scholar]
- 27.Monica HE, Derek SS, Carol EP, Christoph B. J Mass Spectrom. 2009;44:1637–1660. [Google Scholar]
- 28.Bhardwaj C, Moore JF, Cui Y, Gasper GL, Bernstein HC, Carlson RP, Hanley L. Anal Bioanal Chem. 2012 doi: 10.1007/s00216-012-6454-0. submitted. [DOI] [PMC free article] [PubMed] [Google Scholar]
- 29.Kostko O, Takahashi LK, Ahmed M. Chem, Asian J. 2011;6:3066–3076. doi: 10.1002/asia.201100419. [DOI] [PubMed] [Google Scholar]
- 30.Kim SH, Lee A, Song JY, Han SY. J Amer Soc Mass Spectrom. 2012;23:935–941. doi: 10.1007/s13361-012-0355-5. [DOI] [PubMed] [Google Scholar]
- 31.Huang JT, Hannah-Qiuhua L, Szyszka R, Veselov V, Reed G, Wang X, Price S, Alquier L, Vas G. J Mass Spectrom. 2012;47:155–162. doi: 10.1002/jms.2046. [DOI] [PubMed] [Google Scholar]
- 32.Clemis EJ, Smith DS, Camenzind AG, Danell RM, Parker CE, Borchers CH. Anal Chem. 2012;84:3514–3522. doi: 10.1021/ac202875d. [DOI] [PubMed] [Google Scholar]
- 33.Duncan MW, Roder H, Hunsucker SW. Brief Func Genom Proteom. 2008;7:355–370. doi: 10.1093/bfgp/eln041. [DOI] [PMC free article] [PubMed] [Google Scholar]
Associated Data
This section collects any data citations, data availability statements, or supplementary materials included in this article.


