

Abstract
Phosducin (Pdc), a highly conserved phosphoprotein, plays an important role in the regulation of G protein signaling, transcriptional control, and modulation of blood pressure. Pdc is negatively regulated by phosphorylation followed by binding to the 14-3-3 protein, whose role is still unclear. To gain insight into the role of 14-3-3 in the regulation of Pdc function, we studied structural changes of Pdc induced by phosphorylation and 14-3-3 protein binding using time-resolved fluorescence spectroscopy. Our data show that the phosphorylation of the N-terminal domain of Pdc at Ser-54 and Ser-73 affects the structure of the whole Pdc molecule. Complex formation with 14-3-3 reduces the flexibility of both the N- and C-terminal domains of phosphorylated Pdc, as determined by time-resolved tryptophan and dansyl fluorescence. Therefore, our data suggest that phosphorylated Pdc undergoes a conformational change when binding to 14-3-3. These changes involve the Gtβγ binding surface within the N-terminal domain of Pdc, and thus could explain the inhibitory effect of 14-3-3 on Pdc function.
Introduction
Phosducin (Pdc), a highly conserved acidic phosphoprotein, regulates visual signal transduction by modulating the amount of transducin Gtαβγ heterotrimer through competition with the Gtα subunit for binding to the Gtβγ complex (1,2). Pdc was also suggested to be involved in transcriptional control through its interaction with a transcription factor Crx (3) and in the regulation of transmission at the photoreceptor-to-ON-bipolar cell synapse (4). Many members of the Pdc family (Pdc-like proteins) are known to act as cochaperons and assist in the folding of a variety of proteins (5). Recently, it was shown that Pdc regulates the cardiovascular system by modulating sympathetic activity and blood pressure, and thus represents a potential target for the treatment of stress-dependent hypertension (6,7). However, the mechanism of this modulation is unknown.
The crystal structure of Pdc bound to the Gtβγ complex revealed that Pdc consists of two separate domains that wrap around Gtβγ to form an extensive interface (8,9). The N-terminal domain of bound Pdc is mostly helical and interacts with the portion of the Gtα binding surface of the Gtβγ complex, whereas the C-terminal domain possesses a thioredoxin-like fold and interacts with the Gtβγ surface implicated in membrane binding (Fig. 1 A). The ability of Pdc to bind to the Gtβγ complex depends strongly on its phosphorylation state (10,11). Whereas the unphosphorylated Pdc binds the Gtβγ complex tightly, the phosphorylation of several serine residues within the N-terminal domain reduces its binding affinity through a mechanism that is still unclear. The in vitro experiments showed that the cAMP-dependent protein kinase (PKA) phosphorylates Pdc at Ser-73, and the Ca2+/calmodulin-dependent protein kinase (CaMKII) phosphorylates Ser-6, Ser-36, Ser-54, Ser-73, and Ser-106 (10,12,13). However, the phosphorylation at just Ser-54 and Ser-73 has been shown to be essential for inhibiting Pdc function in vivo in a process that involves Pdc binding to the regulatory 14-3-3 protein (10,11,14).
Figure 1.

(A) Schematic representation of the primary structure of Pdc. Red vertical bars denote locations of the 14-3-3 protein binding motifs. Yellow bars denote locations of single Cys residues used as sites for AEDANS attachment. The green bar denotes the location of a single tryptophan residue, Trp-29. (B) Ribbon representation of the Pdc:Gtβγ complex structure (8,9). The N-terminal domain of Pdc is show in green, and the C-terminal domain is shown in light brown. Residues Ser-54 and Ser-73 (phosphorylation sites) are shown in red, Cys residues (AEDANS attachment sites) are shown in yellow, and tryptophan residue Trp-29 is shown in light green.
The 14-3-3 proteins are highly conserved dimeric molecules that regulate the function of other proteins through a number of different mechanisms (15,16). The 14-3-3 proteins recognize specific phosphoserine/phosphothreonine-containing motifs, and many 14-3-3 binding partners contain two or more such motifs (17–19). The dimeric nature of the 14-3-3 proteins enables simultaneous engagement of two binding motifs and hence the efficient structural modulation of bound ligand and/or the masking of its functional site (20,21). It has been shown that in intact retina the simultaneous phosphorylation of both Ser-54 and Ser-73 is required for a dramatic reduction of Pdc binding to Gtβγ, most likely as a result of the competing interaction between the 14-3-3 protein and phosphorylated Pdc (10–13). The ability of the 14-3-3 proteins to interfere with protein-protein or protein-DNA interactions of their binding partners is well established. For example, such a mode of regulation was shown for the Bcl-2 family member BAD (22), the regulator of G protein signaling 3 (23,24), and forkhead transcription factor FOXO4 (25). In all of these cases, the 14-3-3 protein either sterically occludes and/or affects the structure of its binding partners. The exact role of the 14-3-3 protein in regulating Pdc function is still unclear, but it is entirely possible that similar mechanisms are involved because both putative 14-3-3 binding motifs are located within the N-terminal domain, which participates in Gtβγ binding (Fig. 1 A) (8,9). In addition, the possibility that the 14-3-3 protein may also modulate interactions between Pdc and its other binding partners, such as CRX and SUG1 (3,10,26), cannot be ruled out.
To gain insight into the role of 14-3-3 in regulating Pdc function, we used time-resolved fluorescence spectroscopy, analytical ultracentrifugation (AUC), and dynamic light scattering (DLS) to investigate the structural changes of Pdc induced by phosphorylation and 14-3-3 protein binding.
Materials and Methods
Expression, purification, and phosphorylation of Pdc
The DNA encoding rat Pdc (a kind gift of Dr. D.C. Klein, National Institutes of Health) was ligated into pET-15b (Novagen) using the NdeI and BamHI sites. All mutants of Pdc were generated using the QuikChange kit (Stratagene). All mutations were confirmed by sequencing. The N-terminally histidine-tagged protein was expressed by isopropyl β-D-1-thiogalactopyranoside induction for 20 h at 25°C, and purified from Escherichia coli BL21(DE3) cells using Chelating Sepharose Fast Flow (GE Healthcare Life Sciences) according to the standard protocol. Eluted Pdc was dialyzed against buffer containing 50 mM Tris-HCl (pH 8), 20 mM NaCl, 2 mM EDTA, and 5 mM dithiothreitol (DTT), and purified by anion-exchange chromatography on a Q-Sepharose column (GE Healthcare Life Sciences). The protein was eluted using a linear gradient of NaCl (from 50 to 1000 mM) and concentrated to 10 mg/ml. The final step, size-exclusion chromatography on a Superdex 200 column (GE Healthcare Life Sciences), was performed in buffer containing 20 mM Tris-HCl (pH 7.5), 150 mM NaCl, 1 mM EDTA, 5 mM DTT, and 10% (w/v) glycerol.
Purified Pdc was phosphorylated by incubation (1 h at 30°C and then 15 h at 7°C) with 120 U of PKA (Promega) per milligram of protein in the presence of 0.75 mM ATP and 15 mM MgCl2. The reaction was stopped by dialysis against the buffer containing 20 mM Tris-HCl (pH 7.5), 200 mM NaCl, 1 mM EDTA, 5 mM DTT, and 10% (w/v) glycerol. The completeness of the phosphorylation reaction was checked by matrix-assisted laser desorption ionization time of flight (MALDI-TOF) mass spectrometry (MS).
Labeling of Pdc mutants by 1,5-IAEDANS
Covalent modification of Pdc mutants containing a single cysteine residue (at positions 89, 97, 148, 157, or 168) with the thiol-reactive probe 5-((((2-iodoacetyl)amino)ethyl)amino)naphthalene-1-sulfonic acid (1,5-IAEDANS) was carried out as described elsewhere (24,25). See the Supporting Material for more details.
Expression and purification of the 14-3-3 protein
The 14-3-3 protein wild-type (human isoform ζ), the C-terminally truncated version 14-3-3ΔC (residues 1–230 with deleted disordered C-terminal loop), and the mutant version 14-3-3noW containing no tryptophan residues (mutations Trp59Phe and Trp228Phe) were prepared as described previously (27,28).
MS analysis of Pdc
Samples of unphosphorylated or phosphorylated Pdc were first separated by 15% SDS-PAGE, and excised protein bands were digested with trypsin endoprotease (Promega) directly in gel after destaining and cysteine modification by iodoacetamide (29). The resulting peptide mixtures were extracted and loaded onto the MALDI-TOF target with 2,5-dihydroxybenzoic acid as the matrix. Positively or negatively charged spectra or LIFT MS/MS measurements were acquired with an UltraFLEX III mass spectrometer (Bruker-Daltonics, Bremen, Germany).
AUC
Sedimentation equilibrium and sedimentation velocity experiments were performed using a ProteomeLab XL-I Beckman Coulter analytical ultracentrifuge equipped with an AN50Ti rotor. Samples were dialyzed against buffer containing 20 mM Tris-HCl (pH 7.5), 200 mM NaCl, and 2 mM 2-mercaptoethanol before analysis. The buffer density, viscosity, and partial specific volume of all proteins were estimated using the program SEDNTERP 1.09 (http://www.jphilo.mailway.com). Data analysis was performed with the SEDFIT and SEDPHAT packages (30,31). See the Supporting Material for more details.
DLS
DLS measurements were carried out as described previously (32). See the Supporting Material for more details.
Time-resolved fluorescence measurements
Fluorescence intensity and anisotropy decays were measured on a time-correlated single photon counting apparatus comprised of a femtosecond Ti:Sapphire laser with repetition rate reduced to 4 MHz (Chameleon Ultra II and Pulse Picker HP; Coherent) and time-correlated single photon counting detection with a cooled MCP PMT (R3809U-50; Hamamatsu). AEDANS fluorescence was excited at the 355 nm by a second harmonic of the Ti:Sapphire laser generating at 710 nm. Tryptophan emission was excited at 298 nm by a third harmonic of the laser emitting at 894 nm. AEDANS and Trp fluorescence was collected at 480 and 355 nm using a monochromator equipped with a 400 nm cutoff and UG1 glass filter (Zeiss), respectively, placed in front of its input slit. Typically, the curves were accumulated in 1024 channels until 107 counts per decay were reached with time resolution of 200 or 50 ps per channel for dansyl and tryptophan emissions, respectively. Samples were placed in a thermostatic holder, and all experiments were performed at 22°C in a buffer containing 20 mM Tris-HCl (pH 7.5), 200 mM NaCl, 1 mM EDTA, and 2 mM 2-mercaptoethanol. The Pdc concentration was 30 μM, and the 14-3-3 protein concentration was 60 μM.
The fluorescence decays were acquired under magic-angle conditions in which the measured intensity decay, I(t), is independent of the rotational diffusion of the chromophore. Fluorescence was assumed to decay multiexponentially according to the formula
| (1) |
where τi and αi are the fluorescence lifetimes and the corresponding amplitudes, respectively. A maximum entropy method was used to analyze I(t) (33). The program yields amplitudes, αi, that represent the lifetime distribution. We chose 100 lifetimes equidistantly spaced in the logarithmic scale, covering the range from 20 ps to 20 ns for tryptophan, and 50 ps to 50 ns for dansyl. The mean lifetime was calculated as follows:
| (2) |
where fi is the fractional intensity of the ith lifetime component.
The polarized components I||(t) and I⊥(t) were accumulated quasi-simultaneously with a switching frequency of 30 s. The polarized decays were measured with the emission polarizer set in the fixed vertical position, and excitation polarization plane was rotated 0° and 90°, respectively. This approach minimized the need to correct transmittances of the detection channel for different polarizations, because the G-factor was close to one. The value of the G-factor was determined by an independent experiment. The fluorescence anisotropy decays r(t) were obtained by simultaneous reconvolution analysis of both parallel I||(t) and perpendicular I⊥(t) decay components. Data were analyzed by a model-independent maximum entropy method approach that does not set prior limits on the shape of the distributions (33). The anisotropies r(t) were analyzed for a series of exponentials:
| (3) |
where the amplitudes βi represent the distribution of the correlation times ϕi and are related to the initial anisotropy r0 by the formula
| (4) |
We used 100 correlation times ϕi equidistantly spaced in the logarithmic scale ranging from 50 ps to 200 and 500 ns for tryptophan and AEDANS, respectively.
Results
Preparation of Pdc simultaneously phosphorylated at Ser-54 and Ser-73
It has been suggested that Pdc possesses two 14-3-3 protein binding motifs containing phosphorylation sites Ser-54 and Ser-73 (Fig. 1). Residue Ser-54 is known to be phosphorylated by CaMKII, whereas Ser-73 is a substrate for PKA (10,12,13). The preparation of milligram quantities of Pdc stoichiometrically phosphorylated at both Ser-54 and Ser-73 (denoted as dpPdc) turned out to be very difficult, mainly due to the relatively low activity of CaMKII. Therefore, to prepare a sufficient amount of dpPdc for biophysical studies, we mutated residue Gln-52 to Lys, thereby making residue Ser-54 a substrate for PKA. The Pdc(Gln52Lys) mutant was expressed, purified, and phosphorylated by PKA, and the result of the phosphorylation reaction was determined via in-gel trypsin digestion followed by MALDI-TOF MS. The comparison of the received mass spectra of digested samples with theoretically generated peptides confirmed the expression of the N-terminally His-tagged full-length Pdc construct with cleaved N-terminal methionine. The positive MS data for the phosphorylated Pdc after the trypsin digestion revealed signal at m/z 1000.45 corresponding to the peptide with sequence KMpSSPQSR, and its MS/MS spectrum in negative mode confirmed the phospho moiety on Ser-54. On the other hand, the positive MS signal at 792.34 was detected in unphosphorylated Pdc (sequence MSSPQSR), and no peak was found at m/z 1000.45. The phosphorylation of Ser-73 was determined by two positive signal at m/z 2701.27 and 2829.27 corresponding to sequences KMpSIQEYELIHQDKEDEGCLR and KMpSIQEYELIHQDKEDEGCLRK, respectively. The MS/MS spectrum in negative mode revealed the phospho-group on Ser-73 and carbamidomethyl modification of Cys-89. The positive MS signal at 2493.29 was detected in the unphosphorylated sample (sequence MSIQEYELIHQDKEDEGCLR), and no peak corresponding to phosphorylated peptide was found.
Biophysical characterization of dpPdc:14-3-3 complex
We used AUC to perform a basic biophysical characterization of the interaction between dpPdc and the dimeric 14-3-3 protein. Initial sedimentation equilibrium experiments revealed that an apparent dissociation constant (KD) of a complex between doubly phosphorylated dpPdc and 14-3-3 wild-type (human isoform ζ) is in the micromolar range, suggesting a weak transient interaction (34). To prepare a more stable dpPdc:14-3-3 complex suitable for biophysical analysis, we decided to use in all our experiments (AUC, DLS, and fluorescence measurements) the 14-3-3 protein deleted of its C-terminal 15 residues. This region is disordered in all available crystal structures of the 14-3-3 proteins, presumably due to its high flexibility, and seems to function as an autoinhibitor of 14-3-3–ligand interactions (27,35,36). For example, a similar approach was used by Ottmann et al. (37) to stabilize the interaction between 14-3-3 and plant plasma membrane H+-ATPase.
The sedimentation equilibrium measurements were used to estimate KD. Fig. 2 A shows an example of sedimentation equilibrium profiles at 280 nm for a mixture of 14-3-3 and dpPdc. The obtained data were best analyzed in terms of a reversible dpPdc + 14-3-3 dimer ⇌ dpPdc:14-3-3 (with a 1:2 molar ratio) equilibrium to yield KD of 3 ± 0.5 μM. Next, the sedimentation velocity measurements were used to study the importance of the simultaneous phosphorylation of Ser-54 and Ser-73 for the interaction between Pdc and 14-3-3. The continuous sedimentation coefficient distributions, c(s), obtained from these experiments are shown in Fig. 2, B and C. Analysis of the distributions reveals that the 14-3-3 protein and doubly phosphorylated dpPdc form a complex with a weight-averaged sedimentation coefficient (sw) of 4.0 S (Fig. 2 B), whereas the 14-3-3 protein and dpPdc alone show single peaks with sw values of 3.7 and 2.4 S, respectively. The sedimentation velocity experiments also confirmed the 1:2 stoichiometry of the dpPdc:14-3-3 complex. When dpPdc and 14-3-3 were mixed in a 1:2 molar ratio (30 μM dpPdc, 60 μM 14-3-3), the sedimentation coefficient distribution revealed only one peak at sw of 4.0 S. However, when the proteins were mixed in a 1:1 molar ratio (60 μM dpPdc, 60 μM 14-3-3), the distribution contained two peaks at sw of ∼2 and ∼4 S, suggesting an equilibrium between free dpPdc and the dpPdc:14-3-3 (1:2) complex (Fig. 2 B). The analysis of samples containing singly phosphorylated forms of Pdc (denoted as pPdc(pS54) and pPdc(pS73)) revealed sedimentation coefficient distributions containing peaks that correspond to free pPdc (sw of 1.9 S) and 14-3-3 (sw of 3.5 S), thus suggesting either no or very weak interaction (Fig. 2 C). Therefore, these data confirm that the simultaneous phosphorylation of both Ser-54 and Ser-73 is required for the 14-3-3 protein binding to Pdc, in agreement with previous reports (10,11,14).
Figure 2.
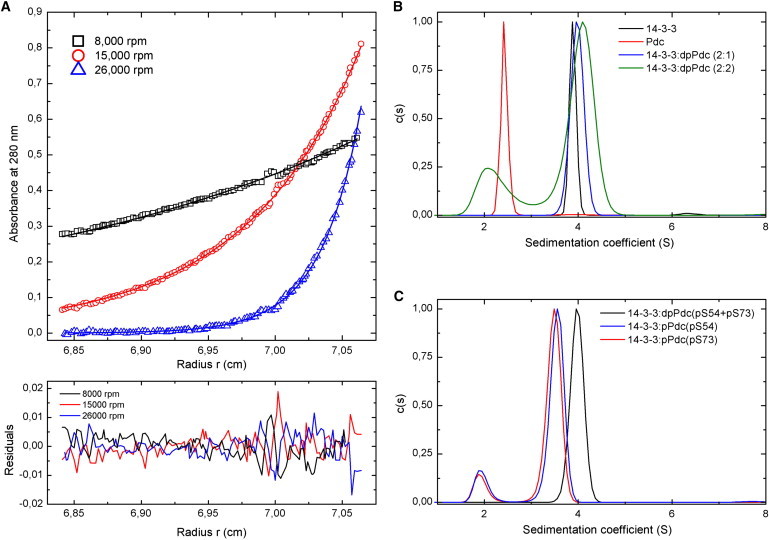
AUC analysis. (A) Example of sedimentation equilibrium profiles at 280 nm for a mixture of 14-3-3 and dpPdc from a global fit (different speeds and different mixing ratio of proteins and dilution series). Symbols correspond to data collected at 8000 (black squares), 15,000 (red circles), and 26,000 (blue triangles) rpm. The lines through the data represent this best-fit analysis. Residuals corresponding to the best-fit analysis in terms of a reversible dpPdc + 14-3-3 dimer ⇌ dpPdc:14-3-3 (with a 1:2 molar ratio) equilibrium are shown. (B) Sedimentation velocity analysis. The normalized continuous sedimentation coefficient distributions, c(s), for the 14-3-3 dimer alone (black), Pdc alone (red), dpPdc and 14-3-3 mixed in the molar ratio 1:2 (blue), and dpPdc and 14-3-3 mixed in the molar ratio 1:1 (green) are shown. (C) Sedimentation velocity analysis. The normalized continuous sedimentation coefficient distributions, c(s), for dpPdc and 14-3-3 mixed in the molar ratio 1:2 (black), pPdc singly phosphorylated at Ser-54 and 14-3-3 mixed in the molar ratio 1:2 (blue), and pPdc singly phosphorylated at Ser-73 and 14-3-3 mixed in the molar ratio 1:2 (red) are shown.
DLS measurements
The small difference in sw between the dpPdc:14-3-3 complex and the 14-3-3 protein dimer alone, as revealed by sedimentation velocity experiments, indicates that the two particles have similar hydrodynamic properties (Fig. 2 B). To check this hypothesis, we determined the hydrodynamic radii (RH) of Pdc, dpPdc, the 14-3-3 dimer, and the dpPdc:14-3-3 complex by DLS. The obtained hydrodynamic radii are summarized in Table 1. The small difference in RH between the 14-3-3 dimer alone and the dpPdc:14-3-3 complex (37 and 44 Å, respectively) is consistent with the results of the sedimentation velocity experiments. This may suggest that in the complex, the molecule of dpPdc is located within the central channel of the cup-shaped 14-3-3 dimer (Fig. S1), and thus the resulting complex would display similar hydrodynamic properties as the 14-3-3 protein dimer alone. In addition, although the 14-3-3 protein dimer shows a relative molecular mass (Mr) ∼2-fold greater than that of Pdc (Mr(14-3-3 dimer) = 57120; Mr(Pdc) = 30300), the RH values of Pdc alone and the 14-3-3 protein dimer were found to be essentially the same (∼37 Å). This suggests that the shape of the Pdc molecule is significantly more asymmetric than that of 14-3-3. The extended conformation of Pdc is also evident from the higher ratio between the experimental and theoretical RH values compared with the 14-3-3 protein dimer (theoretical values were calculated assuming spherical proteins with the corresponding molecular masses and without hydration). It was previously suggested that the N-terminal domain of Pdc is disordered and highly flexible (8,38). Thus, the observed asymmetric shape of the Pdc molecule may result from the disordered nature of the N-terminal domain. The high flexibility of the Pdc structure is also consistent with the higher proteolytic sensitivity of Pdc compared with 14-3-3 (Fig. S2).
Table 1.
Hydrodynamic radii of proteins from DLS experiments
| RH (Å) | 14-3-3 | Pdc | dpPdc | 14-3-3 + Pdc | 14-3-3 + dpPdc |
|---|---|---|---|---|---|
| DLS∗ | 36.6 ± 0.5 | 37.4 ± 0.3 | 38.2 ± 0.5 | 36.9 ± 0.1 | 44.2 ± 0.6 |
| Theoretical† | 25.4‡ | 20.6 | 20.6 | 29.3§ |
Values are the mean ± SD of five measurements in buffer containing 20 mM Tris-HCl (pH 7.5), 1 mM EDTA, 150 mM NaCl, and 5 mM DTT.
Theoretical RH of a spherical rigid protein molecule without hydration estimated from the equation RH [m] = 66×10−12M1/3, where M is a molecular mass [g/mol] (43).
The 14-3-3 protein forms dimers (Mr = 57120).
Assuming the dpPdc:14-3-3 complex with a 1:2 molar stoichiometry.
Time-resolved tryptophan fluorescence of Trp29 shows a 14-3-3 protein-induced structural change at the N-terminus of Pdc
The sequence of Pdc contains only one tryptophan residue, Trp-29 (Fig. 1), that is located (as shown by the crystal structure of the Pdc:Gtβγ complex) in close proximity to both phosphorylation sites Ser-54 and Ser-73 (38) and the SUMOylation site Lys-33 (39). Thus, we used the time-resolved fluorescence intensity and anisotropy decay measurements of Trp-29 to study structural changes in this important regulatory region of Pdc molecule. The human 14-3-3ζnoW protein mutant missing all Trp residues (mutations Trp59Phe and Trp228Phe) was used in all Pdc tryptophan measurements. We previously showed that these two mutations have no effect on the binding properties of the 14-3-3ζ protein (27,28,36). We analyzed the time-resolved fluorescence intensity and anisotropy decays using a singular-value decomposition maximum entropy method as previously described (33). The indole moiety, even in proteins that contain a single Trp residue, frequently exhibits complicated multiexponential decays, and a detailed interpretation of particular decay components is often impossible (40,41). Therefore, we used a mean fluorescent lifetime (τmean) as a robust qualitative indicator of changes in the polarity (and/or the quenching interactions) in the Trp-29 microenvironment (Table 2). It can be seen that although the phosphorylation of Pdc at Ser-54 and Ser-73 by itself has no effect on τmean of Trp-29, the 14-3-3 protein binding to dpPdc caused a significant increase in τmean, suggesting structural changes in the vicinity of Trp-29 upon the complex formation. We studied the segmental motion of Trp-29 using the polarized time-resolved emission measurements. The results of these experiments are presented in Table 2 and Fig. 3. The fluorescence anisotropy decay of Trp-29 reveals three classes of correlation times. Short correlation times located around 0.4–0.5 ns and 1.8–2.7 ns reflect the fast local motion of Trp-29. The third correlation time, ϕ3, likely reflects the rotational diffusion of the whole protein molecule. For comparison with the DLS data, we included the calculated hydrodynamic radius estimated from ϕ3. A comparison of RH from Tables 1 and 2 reveals that the radius obtained from both experiments agree nicely, being 34 Å and 43 Å for dpPdc (Pdc) and the dpPdc:14-3-3 complex, respectively. This observation independently supports the hypothesis that dpPdc molecule docks to the central channel of the 14-3-3 dimer upon complex formation.
Table 2.
Summary of time-resolved tryptophan fluorescence measurements of Pdc(W29)
| Sample | τmean∗† (ns) | β1∗∗ | ϕ1|| (ns) | β2∗∗ | ϕ2|| (ns) | β3∗∗ | ϕ3|| (ns) | RH‡ (Å) |
|---|---|---|---|---|---|---|---|---|
| Pdc | 3.9 | 0.045 | 0.5 | 0.094 | 2.4 | 0.061 | 36 | 34 |
| Pdc + 14-3-3§ | 3.9 | 0.051 | 0.5 | 0.088 | 2.4 | 0.062 | 61 | 41 |
| dpPdc | 3.8 | 0.057 | 0.4 | 0.102 | 2.7 | 0.043 | 36 | 34 |
| dpPdc + 14-3-3 | 4.2 | 0.028 | 0.4 | 0.067 | 1.8 | 0.108 | 71 | 43 |
SD > 0.05 ns.
The mean fluorescent lifetime (τmean) was calculated using Eq. 2.
The hydrodynamic radius RH was estimated from the equation , where η is water viscosity, T is temperature, k is the Boltzmann constant, and V is volume of the spherical rigid rotor .
The human 14-3-3noW protein mutant missing all Trp residues (mutations Trp59Phe and Trp228Phe) was used in all Pdc tryptophan measurements (27,28,36).
SD < 20%.
SD < 0.01.
Figure 3.

Fluorescence anisotropy decays of Trp-29 constructed from the raw polarized decay data for phosphorylated dpPdc (A) and unphosphorylated Pdc (B). Open circles (○) belong to decays in the absence of the 14-3-3 protein; solid circles (●) represent decays in the presence of the 14-3-3 protein. Solid lines are emission anisotropies calculated from the best least-squares fits of polarized decays.
The change in the segmental motion of Trp-29 was assessed from the change in the sum of amplitudes of fast anisotropy decay components βshort (βshort = β1 + β2). Whereas the phosphorylation by itself seems to somewhat increase the segmental motion of Trp-29 (βshort(Pdc) = 0.139; βshort(dpPdc) = 0.159), the 14-3-3 protein binding substantially decreases its segmental motion in dpPdc (βshort(dpPdc + 14-3-3) = 0.095). This is also well demonstrated by the significantly elevated anisotropies at long times after the excitation at Fig. 3 A. These data suggest that the binding of 14-3-3 protein significantly reduces the flexibility of dpPdc in the region surrounding Trp-29, presumably through direct physical contact.
Mapping of interactions between dpPdc and the 14-3-3 protein using time-resolved dansyl fluorescence
The AEDANS moiety is an environmentally sensitive extrinsic fluorophore that is often used to map the binding interfaces in protein complexes and to study the conformational dynamics of protein molecules (24,25,42). In this study, we used the time-resolved fluorescence intensity and anisotropy decay measurements of AEDANS-labeled Pdc mutants to investigate the structural changes of Pdc and map its binding interface with the 14-3-3 protein. The AEDANS was covalently attached to a single cysteine residue of five different Pdc mutants to sample various regions of the Pdc molecule (Fig. 1). The first two residues, Cys-89 and Cys-97, are located within the N-terminal domain of Pdc, whereas residues Cys-148, Cys-157, and Cys-168 are located within its C-terminal domain. The time-resolved fluorescence intensity measurements revealed that all AEDANS-labeled Pdc mutants exhibited complex emission decays with multimodal lifetime distributions. Therefore, variations in the τmean of AEDANS were used to monitor changes in the solvent exposure (polarity) of labeled Pdc surfaces upon phosphorylation and 14-3-3 protein binding (Table 3 and Fig. 4). The phosphorylation of Ser-54 and Ser-73 decreased the τmean of all AEDANS-labeled Pdc mutants, suggesting an increase in the polarity and/or the quenching interactions around the AEDANS moieties (Fig. 4 A). The largest decrease in τmean upon phosphorylation was observed for the Pdc mutant containing Cys residue at position 148 within the C-terminal domain. The observed changes in τmean of all AEDANS-labeled Pdc mutants also suggest that both domains of Pdc interact with each other, and thus a posttranslational modification within the N-terminal domain can affect the structure in the C-terminal domain. The 14-3-3 protein binding to dpPdc, on the other hand, had an opposite effect on the τmean of all AEDANS-labeled Pdc mutants, with the largest increase observed for mutants dpPdc(Cys89), dpPdc(Cys97), and, interestingly, also for dpPdc(Cys168) (Fig. 4 B). Thus, binding of the 14-3-3 protein significantly affects the microenvironment around the AEDANS moieties not only in the N-terminal domain of dpPdc, where both phosphorylation sites and 14-3-3 binding motifs are located, but also in the C-terminal domain, suggesting a direct physical contact between 14-3-3 and the C-terminal domain of dpPdc.
Table 3.
Summary of time-resolved fluorescence measurements of AEDANS-labeled single-cys mutants of Pdc
| Pdc mutant | τmean∗† (ns) | β1§ | ϕ1‡ (ns) | β2§ | ϕ2‡ (ns) | β3§ | ϕ3‡ (ns) | β4§ | ϕ4 (ns) | ||
|---|---|---|---|---|---|---|---|---|---|---|---|
| Cys-89 | Not-P | 15.00 | 0.027 | 0.4 | 0.093 | 2.5 | 0.078 | 13 | 0.032 | > 50 | |
| + 14-3-3 | 15.01 | 0.044 | 0.5 | 0.093 | 3.0 | 0.068 | 16 | 0.025 | > 50 | ||
| P | 14.67 | 0.029 | 0.4 | 0.092 | 2.1 | 0.066 | 8 | 0.043 | > 50 | ||
| + 14-3-3 | 15.52 | 0.013 | 0.3 | 0.076 | 2.1 | 0.066 | 9 | 0.075 | > 50 | ||
| Cys-97 | Not-P | 15.28 | 0.054 | 0.5 | 0.083 | 3.3 | 0.056 | 12 | 0.037 | > 50 | |
| + 14-3-3 | 15.28 | 0.035 | 0.4 | 0.090 | 2.5 | 0.059 | 11 | 0.046 | > 50 | ||
| P | 14.73 | 0.052 | 0.5 | 0.096 | 2.5 | 0.066 | 15 | 0.016 | > 50 | ||
| + 14-3-3 | 15.33 | 0.052 | 0.5 | 0.076 | 3.3 | 0.055 | 15 | 0.047 | > 50 | ||
| Cys-148 | Not-P | 15.70 | 0.006 | 0.3 | 0.088 | 2.7 | 0.071 | 12 | 0.065 | > 50 | |
| + 14-3-3 | 15.51 | 0.022 | 0.5 | 0.077 | 3.0 | 0.074 | 12 | 0.057 | > 50 | ||
| P | 14.99 | 0.023 | 0.4 | 0.078 | 2.5 | 0.084 | 11 | 0.045 | > 50 | ||
| + 14-3-3 | 15.14 | 0.011 | 0.3 | 0.075 | 2.1 | 0.083 | 10 | 0.061 | > 50 | ||
| Cys-157 | Not-P | 14.70 | 0.023 | 0.5 | 0.094 | 3.0 | 0.096 | 18 | 0.017 | > 50 | |
| + 14-3-3 | 14.69 | 0.034 | 0.7 | 0.080 | 2.7 | 0.100 | 19 | 0.016 | > 50 | ||
| P | 14.13 | 0.045 | 0.6 | 0.100 | 3.3 | 0.071 | 18 | 0.014 | > 50 | ||
| + 14-3-3 | 14.32 | 0.038 | 0.4 | 0.124 | 3.0 | 0.034 | 23 | 0.034 | > 50 | ||
| Cys-168 | Not-P | 15.43 | 0.032 | 0.6 | 0.109 | 2.7 | 0.079 | 25 | 0.010 | > 50 | |
| + 14-3-3 | 15.42 | 0.029 | 0.5 | 0.099 | 2.7 | 0.087 | 18 | 0.015 | > 50 | ||
| P | 14.92 | 0.047 | 0.5 | 0.098 | 2.7 | 0.075 | 15 | 0.010 | > 50 | ||
| + 14-3-3 | 15.44 | 0.022 | 0.3 | 0.096 | 2.7 | 0.071 | 18 | 0.041 | > 50 |
SD > 0.05 ns.
The mean fluorescent lifetime (τmean) was calculated using Eq. 2.
SD < 20%.
SD < 0.01.
Figure 4.

Change in the mean excited-state lifetime, τmean, and the overall change in amplitudes of fast anisotropy decay components belonging to a rapid fluorophore motion (βshort = β1 + β2) of AEDANS moieties attached at five different cysteine residues (Cys-89, Cys-97, Cys-148, Cys-157, and Cys-168). (A) Changes induced by phosphorylation of Pdc at Ser-54 and Ser-73. (B) Changes induced by the 14-3-3 protein binding to phosphorylated dpPdc.
It is easy to envisage that the close proximity of the AEDANS moiety and 14-3-3 upon complex formation and/or the phosphorylation- and the 14-3-3 protein binding-induced structural change of AEDANS-labeled dpPdc segment would restrict the mobility of AEDANS. The extent of the fast mobility decrease should depend on both the level of the steric hindrance and the initial rotational freedom of the AEDANS moiety. Thus, to further study the interaction between 14-3-3 and dpPdc, we used the polarized time-resolved emission measurements to examine the segmental dynamics of the AEDANS-labeled Pdc mutants and its changes upon phosphorylation and 14-3-3 protein binding. The results of these measurements are also summarized in Table 3 and Fig. 4. The observed emission anisotropy decays were rather complex, exhibiting four classes of correlation times. Short correlation times located near 500 ps and 3 ns reflect fast local motion of the AEDANS group. The third correlation time, ϕ3, is likely related to the rotational diffusion of large rigid domains of the Pdc molecule. The longest correlation time, ϕ4, can be assigned to the overall rotation of the Pdc molecule. Due to the high local mobility of the AEDANS moiety attached to the Pdc molecule causing almost complete fast depolarization of the emission, rather small-amplitude β4 remains for detection of the overall molecular rotation. Together with an unavoidable trace amount of slowly developing AEDANS-induced aggregates present in our samples (∼0.01–0.02 of β4) biasing ϕ4 toward larger values, this prevented us from determining ϕ4 accurately. We used overall change βshort = β1 + β2 in amplitudes of fast anisotropy decay components belonging to a rapid fluorophore motion as a measure of change in the segmental mobility of Pdc regions containing AEDANS-labeled cysteine residues. It can be seen that the phosphorylation by itself significantly increased the segmental mobility (i.e., the flexibility) of Pdc(Cys157) and slightly increased that of Pdc(Cys97) (Fig. 4 A). Little or no change in βshort was observed for Pdc(Cys89), Pdc(Cys148), and Pdc(Cys168). On the other hand, the 14-3-3 protein binding reduced the flexibility of all labeled regions of dpPdc except for dpPdc(Cys157), with the largest change observed for mutants dpPdc(Cys89) and dpPdc(Cys168) (Fig. 4, Fig. S3, and Fig. S4). Mutant dpPdc(Cys157) exhibited increased segmental flexibility upon binding of 14-3-3. The changes in the raw AEDANS fluorescence anisotropy decays of the dpPdc(Cys168) mutant resulting from the interaction with 14-3-3 are shown in Fig. S3. Visual inspection of this figure reveals that although the binding of 14-3-3 to the phosphorylated dpPdc(Cys168) results in a highly significant change in the decay data (Fig. S3 B), the phosphorylation of Ser-54 and Ser-73 by itself has only a minor effect on AEDANS anisotropy decay (Fig. S3 A). The effect of the addition of 14-3-3 protein to the unphosphorylated Pdc(Cys168) is shown in Fig. S3 C. Because the 14-3-3 protein does not bind the unphosphorylated Pdc, the figure demonstrates the reproducibility of the measured data and serves as a standard for evaluating the observed changes in panels A and B. Similar data quality was obtained for all measured mutants; for example, Fig. S4 shows raw fluorescence anisotropy decays of the AEDANS-labeled dpPdc(Cys89) mutant.
It can also be seen that changes in τmean and βshort have the opposite trend, especially upon binding of the 14-3-3 protein to dpPdc (Fig. 4 B), suggesting a positive correlation between the segmental flexibility and the surface exposure (or polarity) of labeled Pdc regions. Explicitly, an increase of τmean indicates reduced AEDANS exposure to an aqueous or polar microenvironment, which correlates nicely with the decreased internal flexibility of the Pdc structure upon binding of the 14-3-3 protein as quantified by βshort. Hence, the AEDANS emission anisotropy decay measurements reveal that binding of the 14-3-3 protein significantly affects the structure of both domains of dpPdc, presumably through direct physical contacts with various regions of the Pdc molecule.
Discussion
Our goal in this work was to investigate as yet unresolved details concerning the interaction between the phosphoprotein Pdc and the 14-3-3 protein. Retinal Pdc regulates G protein signaling by competing with the Gtα subunit for binding to the Gtβγ complex (1,2). The comparison of in vitro and in vivo studies suggested that the phosphorylation of Pdc at Ser-54 and Ser-73 plays an essential role in this process by initiating Pdc binding to the 14-3-3 protein and thereby inhibiting the interaction between Pdc and Gtβγ through mechanisms that remain unclear (10,11,14). Based on what is currently known about the function of 14-3-3 proteins, it is reasonable to speculate that the 14-3-3 protein blocks the interaction between Pdc and the Gtβγ complex, for example, by sterically occluding the Gtβγ interaction surface of Pdc and/or by changing the Pdc structure (15). Our fluorescence spectroscopy measurements suggest that the 14-3-3 protein interacts with several regions within both domains of dpPdc. The N-terminal domain constitutes the main part of Pdc’s interaction surface with Gtβγ (∼65% of the total binding surface), as shown by the crystal structure of the Pdc:Gtβγ complex (8). The single tryptophan residue that was used for tryptophan fluorescence experiments, Trp-29, is part of a conserved segment located at the N-terminal end of helix 1 that makes extensive interactions with Gtβ (Fig. 1). Furthermore, two of five cysteine residues that were modified by the extrinsic fluorophore AEDANS, Cys-89 and Cys-97, are located within the helix 3, which is also involved in contacts with Gtβ (8). It is likely that the observed changes in the fluorescence properties of the Trp-29 and AEDANS moieties (Figs. 3 A and 4 B; Tables 2 and 3) are caused by steric shielding of the fluorophore upon 14-3-3 protein binding or 14-3-3-binding-induced structural changes, which suggests a physical contact between 14-3-3 and labeled regions of dpPdc. This is also consistent with the results of time-resolved fluorescence anisotropy experiments that showed a restriction of segmental motions of labeled regions upon binding of the 14-3-3 protein to dpPdc. Our data, therefore, show that 14-3-3 interacts with regions that are important parts of Pdc’s binding surface for Gtβγ, and thus suggest an explanation for the inhibitory effect of the 14-3-3 binding on Pdc’s interaction with Gtβγ. The binding of 14-3-3 to the N-terminal domain could also affect Pdc’s function and cellular stability through modulation of its posttranslational modification by the small ubiquitin-related modifier SUMO. The Pdc SUMOylation site, Lys-33, lies in close vicinity to Trp-29 (39), and thus in the region whose structure is changed upon 14-3-3 binding.
The C-terminal domain of Pdc possesses the thioredoxin-like fold and binds to Gtβ in a manner that is likely to disrupt Gtβγ’s orientation relative to the membrane (8). It has also been shown that this domain mediates interactions between Pdc and its two other binding partners, SUG1 and CRX. SUG1 is a subunit of the 26S proteasome, which may also indirectly modulate transcription (26). CRX is the cone-rod homeobox transcription factor that is expressed selectively in retinal photoreceptors and pinealocytes (3). The functional consequences of these interactions are still unknown, but it has been speculated that SUG1 targets Pdc to the 26S proteasome, where it is degraded. On the other hand, the interaction between Pdc and CRX may interfere with the CRX-mediated gene transactivation (3). Time-resolved fluorescence measurements of AEDANS-labeled dpPdc suggest either a direct physical contact between the AEDANS moiety attached at Cys-168 within the C-terminal domain and 14-3-3 and/or a conformational change of this region induced by binding of the 14-3-3 protein (Fig. 4 B and Table 3). Therefore, it is reasonable to speculate that the 14-3-3 binding could modulate dpPdc’s interaction with CRX and SUG1.
It has been suggested that the N-terminal domain of Pdc is highly flexible and disordered. Crystallographic studies revealed this high flexibility especially in regions that do not contact Gtβγ (8,38). Moreover, both one-dimensional proton NMR and circular dichroism experiments indicated that the N-terminal domain of free Pdc (in the absence of Gtβγ) lacks any explicit native conformation (38). The values of RH obtained for Pdc from DLS and time-resolved tryptophan fluorescence that are significantly higher than expected for a globular protein of the given molecular mass, as well as the enhanced proteolytic sensitivity, support the disordered (and/or flexible) nature of this domain (Table 1 and Fig. S2). The time-resolved emission anisotropy decay measurements reveal that the 14-3-3 protein binding reduces the flexibility of labeled regions within both domains of dpPdc. This disorder-to-order transition may be one of the reasons for the relatively low binding affinity of dpPdc for the 14-3-3 protein (KD is in the micrometer range), because the decrease in the configurational entropy upon binding would have an unfavorable effect on the binding affinity. In addition, the crystal structure of the complex between pPdc(pS73) and Gtβγ showed that the phosphorylation of Pdc at Ser-73 causes an order-to-disorder transition of a 20-residue stretch including the phosphorylation site. Consistently, our fluorescence spectroscopy measurements suggest that the phosphorylation by itself affects the structure of both the N- and C-terminal domains of Pdc, as documented by the increase in the segmental flexibility of Trp-29 and changes in τmean of AEDANS moieties attached at all five cysteine residues (Tables 2 and 3; Fig. 4 A). Interestingly, the most profound phosphorylation-dependent changes in fluorescence properties were observed for AEDANS moieties attached at Cys-148 and Cys-157 within the C-terminal domain, although both phosphorylation sites are located at the N-terminus of Pdc (Fig. 1). This suggests that both domains of Pdc interact with each other, possibly through the region that includes both Cys-148 and Cys-157. Thus, a posttranslational modification within the N-terminal domain can affect the structure in the C-terminal domain.
In addition, the consecutive increase in segmental flexibility upon phosphorylation (Fig. 4 A) and the consequent binding of 14-3-3 protein (Fig. 4 B) was observed only for the AEDANS-labeled Pdc(Cys157) mutant. The crystal structure of the complex between Pdc and Gtβγ revealed that Cys-157 is located on the surface of the C-terminal domain (8,9). We may speculate that in the unphosphorylated Pdc the segmental flexibility of the region containing Cys-157 is reduced, presumably due to its interaction with the N-terminal domain, and both phosphorylation and 14-3-3 protein binding affect this interdomain interaction.
Conclusions
The phosphorylation of the N-terminal domain of Pdc at Ser-54 and Ser-73 affects the structure of the whole Pdc molecule, suggesting that the N- and C-terminal domains interact with each other. Phosphorylated Pdc and the 14-3-3 protein form a stable complex with 1:2 molar stoichiometry. Complex formation with 14-3-3 affects the structure and reduces the flexibility of both the N- and C-terminal domains of dpPdc, suggesting that dpPdc undergoes a conformational change when binding to 14-3-3. These changes involve the Gtβγ binding surface within the N-terminal domain of dpPdc, and thus could explain the inhibitory effect of 14-3-3 on Pdc function.
Acknowledgments
This work was supported by the Czech Science Foundation (project P305/11/0708); Grant Agency of Charles University in Prague (grant 28510); Ministry of Education, Youth, and Sports of the Czech Republic Research (project MSM0021620857); and Academy of Sciences of the Czech Republic (research project RVO 67985823).
Supporting Material
References
- 1.Lee R.H., Lieberman B.S., Lolley R.N. A novel complex from bovine visual cells of a 33,000-dalton phosphoprotein with β- and γ-transducin: purification and subunit structure. Biochemistry. 1987;26:3983–3990. doi: 10.1021/bi00387a036. [DOI] [PubMed] [Google Scholar]
- 2.Bauer P.H., Müller S., Lohse M.J. Phosducin is a protein kinase A-regulated G-protein regulator. Nature. 1992;358:73–76. doi: 10.1038/358073a0. [DOI] [PubMed] [Google Scholar]
- 3.Zhu X., Craft C.M. Modulation of CRX transactivation activity by phosducin isoforms. Mol. Cell. Biol. 2000;20:5216–5226. doi: 10.1128/mcb.20.14.5216-5226.2000. [DOI] [PMC free article] [PubMed] [Google Scholar]
- 4.Herrmann R., Lobanova E.S., Arshavsky V.Y. Phosducin regulates transmission at the photoreceptor-to-ON-bipolar cell synapse. J. Neurosci. 2010;30:3239–3253. doi: 10.1523/JNEUROSCI.4775-09.2010. [DOI] [PMC free article] [PubMed] [Google Scholar]
- 5.Willardson B.M., Howlett A.C. Function of phosducin-like proteins in G protein signaling and chaperone-assisted protein folding. Cell. Signal. 2007;19:2417–2427. doi: 10.1016/j.cellsig.2007.06.013. [DOI] [PMC free article] [PubMed] [Google Scholar]
- 6.Beetz N., Hein L. The physiological roles of phosducin: from retinal function to stress-dependent hypertension. Cell. Mol. Life Sci. 2011;68:599–612. doi: 10.1007/s00018-010-0550-0. [DOI] [PMC free article] [PubMed] [Google Scholar]
- 7.Beetz N., Harrison M.D., Hein L. Phosducin influences sympathetic activity and prevents stress-induced hypertension in humans and mice. J. Clin. Invest. 2009;119:3597–3612. doi: 10.1172/JCI38433. (Erratum in J. Clin. Invest. 2011. 121:454) [DOI] [PMC free article] [PubMed] [Google Scholar]
- 8.Gaudet R., Bohm A., Sigler P.B. Crystal structure at 2.4 angstroms resolution of the complex of transducin βγ and its regulator, phosducin. Cell. 1996;87:577–588. doi: 10.1016/s0092-8674(00)81376-8. [DOI] [PubMed] [Google Scholar]
- 9.Loew A., Ho Y.K., Bax B. Phosducin induces a structural change in transducin β γ. Structure. 1998;6:1007–1019. doi: 10.1016/s0969-2126(98)00102-6. [DOI] [PubMed] [Google Scholar]
- 10.Thulin C.D., Savage J.R., Willardson B.M. Modulation of the G protein regulator phosducin by Ca2+/calmodulin-dependent protein kinase II phosphorylation and 14-3-3 protein binding. J. Biol. Chem. 2001;276:23805–23815. doi: 10.1074/jbc.M101482200. [DOI] [PubMed] [Google Scholar]
- 11.Lee B.Y., Thulin C.D., Willardson B.M. Site-specific phosphorylation of phosducin in intact retina. Dynamics of phosphorylation and effects on G protein β γ dimer binding. J. Biol. Chem. 2004;279:54008–54017. doi: 10.1074/jbc.M405669200. [DOI] [PubMed] [Google Scholar]
- 12.Yoshida T., Willardson B.M., Bitensky M.W. The phosphorylation state of phosducin determines its ability to block transducin subunit interactions and inhibit transducin binding to activated rhodopsin. J. Biol. Chem. 1994;269:24050–24057. [PubMed] [Google Scholar]
- 13.Chen F., Lee R.H. Phosducin and βγ-transducin interaction I: effects of post-translational modifications. Biochem. Biophys. Res. Commun. 1997;233:370–374. doi: 10.1006/bbrc.1997.6460. [DOI] [PubMed] [Google Scholar]
- 14.Nakano K., Chen J., Bitensky M.W. Rethinking the role of phosducin: light-regulated binding of phosducin to 14-3-3 in rod inner segments. Proc. Natl. Acad. Sci. USA. 2001;98:4693–4698. doi: 10.1073/pnas.071067198. [DOI] [PMC free article] [PubMed] [Google Scholar]
- 15.Obsil T., Obsilova V. Structural basis of 14-3-3 protein functions. Semin. Cell Dev. Biol. 2011;22:663–672. doi: 10.1016/j.semcdb.2011.09.001. [DOI] [PubMed] [Google Scholar]
- 16.Gardino A.K., Smerdon S.J., Yaffe M.B. Structural determinants of 14-3-3 binding specificities and regulation of subcellular localization of 14-3-3-ligand complexes: a comparison of the X-ray crystal structures of all human 14-3-3 isoforms. Semin. Cancer Biol. 2006;16:173–182. doi: 10.1016/j.semcancer.2006.03.007. [DOI] [PubMed] [Google Scholar]
- 17.Muslin A.J., Tanner J.W., Shaw A.S. Interaction of 14-3-3 with signaling proteins is mediated by the recognition of phosphoserine. Cell. 1996;84:889–897. doi: 10.1016/s0092-8674(00)81067-3. [DOI] [PubMed] [Google Scholar]
- 18.Yaffe M.B., Rittinger K., Cantley L.C. The structural basis for 14-3-3:phosphopeptide binding specificity. Cell. 1997;91:961–971. doi: 10.1016/s0092-8674(00)80487-0. [DOI] [PubMed] [Google Scholar]
- 19.Rittinger K., Budman J., Yaffe M.B. Structural analysis of 14-3-3 phosphopeptide complexes identifies a dual role for the nuclear export signal of 14-3-3 in ligand binding. Mol. Cell. 1999;4:153–166. doi: 10.1016/s1097-2765(00)80363-9. [DOI] [PubMed] [Google Scholar]
- 20.Yaffe M.B. How do 14-3-3 proteins work?—Gatekeeper phosphorylation and the molecular anvil hypothesis. FEBS Lett. 2002;513:53–57. doi: 10.1016/s0014-5793(01)03288-4. [DOI] [PubMed] [Google Scholar]
- 21.Johnson C., Crowther S., MacKintosh C. Bioinformatic and experimental survey of 14-3-3-binding sites. Biochem. J. 2010;427:69–78. doi: 10.1042/BJ20091834. [DOI] [PMC free article] [PubMed] [Google Scholar]
- 22.Zha J., Harada H., Korsmeyer S.J. Serine phosphorylation of death agonist BAD in response to survival factor results in binding to 14-3-3 not BCL-X(L) Cell. 1996;87:619–628. doi: 10.1016/s0092-8674(00)81382-3. [DOI] [PubMed] [Google Scholar]
- 23.Rezabkova L., Boura E., Obsil T. 14-3-3 protein interacts with and affects the structure of RGS domain of regulator of G protein signaling 3 (RGS3) J. Struct. Biol. 2010;170:451–461. doi: 10.1016/j.jsb.2010.03.009. [DOI] [PubMed] [Google Scholar]
- 24.Rezabkova L., Man P., Obsil T. Structural basis for the 14-3-3 protein-dependent inhibition of the regulator of G protein signaling 3 (RGS3) function. J. Biol. Chem. 2011;286:43527–43536. doi: 10.1074/jbc.M111.273573. [DOI] [PMC free article] [PubMed] [Google Scholar]
- 25.Silhan J., Vacha P., Obsil T. 14-3-3 protein masks the DNA binding interface of forkhead transcription factor FOXO4. J. Biol. Chem. 2009;284:19349–19360. doi: 10.1074/jbc.M109.002725. [DOI] [PMC free article] [PubMed] [Google Scholar]
- 26.Zhu X., Craft C.M. Interaction of phosducin and phosducin isoforms with a 26S proteasomal subunit, SUG1. Mol. Vis. 1998;4:13. [PubMed] [Google Scholar]
- 27.Obsilova V., Herman P., Obsil T. 14-3-3zeta C-terminal stretch changes its conformation upon ligand binding and phosphorylation at Thr232. J. Biol. Chem. 2004;279:4531–4540. doi: 10.1074/jbc.M306939200. [DOI] [PubMed] [Google Scholar]
- 28.Obsilova V., Nedbalkova E., Obsil T. The 14-3-3 protein affects the conformation of the regulatory domain of human tyrosine hydroxylase. Biochemistry. 2008;47:1768–1777. doi: 10.1021/bi7019468. [DOI] [PubMed] [Google Scholar]
- 29.Prochazkova K., Osicka R., Sebo P. The Neisseria meningitidis outer membrane lipoprotein FrpD binds the RTX protein FrpC. J. Biol. Chem. 2005;280:3251–3258. doi: 10.1074/jbc.M411232200. [DOI] [PubMed] [Google Scholar]
- 30.Schuck P. Size-distribution analysis of macromolecules by sedimentation velocity ultracentrifugation and lamm equation modeling. Biophys. J. 2000;78:1606–1619. doi: 10.1016/S0006-3495(00)76713-0. [DOI] [PMC free article] [PubMed] [Google Scholar]
- 31.Schuck P. On the analysis of protein self-association by sedimentation velocity analytical ultracentrifugation. Anal. Biochem. 2003;320:104–124. doi: 10.1016/s0003-2697(03)00289-6. [DOI] [PubMed] [Google Scholar]
- 32.Veisova D., Rezabkova L., Obsilova V. The C-terminal segment of yeast BMH proteins exhibits different structure compared to other 14-3-3 protein isoforms. Biochemistry. 2010;49:3853–3861. doi: 10.1021/bi100273k. [DOI] [PubMed] [Google Scholar]
- 33.Vecer J., Herman P. Maximum entropy analysis of analytically simulated complex fluorescence decays. J. Fluoresc. 2011;21:873–881. doi: 10.1007/s10895-009-0589-1. [DOI] [PubMed] [Google Scholar]
- 34.Ozbabacan S.E., Engin H.B., Keskin O. Transient protein-protein interactions. Protein Eng. Des. Sel. 2011;24:635–648. doi: 10.1093/protein/gzr025. [DOI] [PubMed] [Google Scholar]
- 35.Truong A.B., Masters S.C., Fu H. Role of the 14-3-3 C-terminal loop in ligand interaction. Proteins. 2002;49:321–325. doi: 10.1002/prot.10210. [DOI] [PubMed] [Google Scholar]
- 36.Silhan J., Obsilova V., Obsil T. 14-3-3 protein C-terminal stretch occupies ligand binding groove and is displaced by phosphopeptide binding. J. Biol. Chem. 2004;279:49113–49119. doi: 10.1074/jbc.M408671200. [DOI] [PubMed] [Google Scholar]
- 37.Ottmann C., Marco S., Oecking C. Structure of a 14-3-3 coordinated hexamer of the plant plasma membrane H+-ATPase by combining X-ray crystallography and electron cryomicroscopy. Mol. Cell. 2007;25:427–440. doi: 10.1016/j.molcel.2006.12.017. [DOI] [PubMed] [Google Scholar]
- 38.Gaudet R., Savage J.R., Sigler P.B. A molecular mechanism for the phosphorylation-dependent regulation of heterotrimeric G proteins by phosducin. Mol. Cell. 1999;3:649–660. doi: 10.1016/s1097-2765(00)80358-5. [DOI] [PubMed] [Google Scholar]
- 39.Klenk C., Humrich J., Lohse M.J. SUMO-1 controls the protein stability and the biological function of phosducin. J. Biol. Chem. 2006;281:8357–8364. doi: 10.1074/jbc.M513703200. [DOI] [PubMed] [Google Scholar]
- 40.Bajzer Z., Prendergast F.G. A model for multiexponential tryptophan fluorescence intensity decay in proteins. Biophys. J. 1993;65:2313–2323. doi: 10.1016/S0006-3495(93)81325-0. [DOI] [PMC free article] [PubMed] [Google Scholar]
- 41.Chen Y., Barkley M.D. Toward understanding tryptophan fluorescence in proteins. Biochemistry. 1998;37:9976–9982. doi: 10.1021/bi980274n. [DOI] [PubMed] [Google Scholar]
- 42.Obsilova V., Vecer J., Obsil T. 14-3-3 Protein interacts with nuclear localization sequence of forkhead transcription factor FoxO4. Biochemistry. 2005;44:11608–11617. doi: 10.1021/bi050618r. [DOI] [PubMed] [Google Scholar]
- 43.Rothe G.M. Determination of molecular mass, Stokes’ radius, frictional coefficient and isomer-type of non-denatured proteins by time-dependent pore gradient gel electrophoresis. Electrophoresis. 1988;9:307–316. doi: 10.1002/elps.1150090705. [DOI] [PubMed] [Google Scholar]
Associated Data
This section collects any data citations, data availability statements, or supplementary materials included in this article.