Abstract
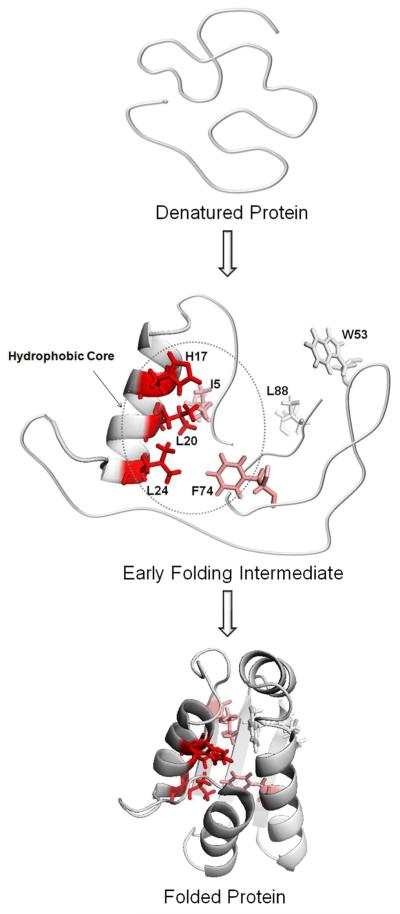
We report a study of sub-millisecond protein folding with amino-acid residue resolution achieved with a two-laser pump/probe experiment with analysis by mass spectrometry. The folding of a test protein, barstar, can be triggered by a laserinduced temperature jump (T jump) from ~0 °C to ~ room temperature. Subsequent reactions via FPOP (fast photochemical oxidation of proteins) at various fractional millisecond points after the T jump leads to oxidative modification of solvent-accessible side chains whose “protection” changes with time and extent of folding. The modifications are identified and quantified by LC-MS/MS following proteolysis. Among all the segments that form secondary structure in the native state, helix1 shows a decreasing trend of oxidative modification during the first 0.1-1 ms of folding while others do not change in this time range. Residues I5, H17, L20, L24 and F74 are modified less in the intermediate state than the denatured state, likely due to full or partial protection of these residues as folding occurs. We propose that in the early folding stage, barstar forms a partially solvent-accessible hydrophobic core consisting of several residues that have long-range interaction with other, more remote residues in the protein sequence. Our data not only are consistent with the previous conclusion that barstar fast folding follows the nucleation-condensation mechanism with the nucleus centered on helix1 formed in a folding intermediate but also show the efficacy of this new approach to following protein folding on the sub millisecond time range.
Introduction
The mechanism of protein folding remains a central problem in molecular biology and biochemistry1. There are two competing models for folding: hydrophobic collapse and the framework model. According to the former, hydrophobic collapse occurs as a relatively early event in the folding pathway before secondary structures can form2. In the framework model, secondary structures form during the early stages of folding, and they guide the slow development of the tertiary structure3. One way of overcoming the difficulty of experimentally accessing the early folding events is to examine folding mechanisms in silico via molecular dynamics and simulations of folding4-6. There is experimental evidence that many globular proteins (e.g., myoglobin7 and staphylococcal nuclease8) follow the partial hydrophobic collapse model while folding. Accompanying the dynamics with temperature-jump experimental verification provides a valuable picture for folding events in the low microsecond time frame to show the fastest folding β-sheet protein9,10.
One way to access folding mechanism is to characterize the intermediates in protein folding. This presents significant challenges for analytical methods. Conventional rapid mixing techniques are adequate for studying the folding for many two-state systems and for later stages of multistate systems. Recent studies show mixing dead times for protein folding as low as 40 μs11. To detect the intermediates formed in more complex folding pathways, however, even faster methods (e.g., T jump) are required12. The folding kinetics is revealed by spectral probes that detect broad features of intermediates13,14. An example showing that amino-acid specificity can be achieved involves placing an isotopically labeled carbonyl in the protein backbone and using fast IR as the spectral probe15. Another approach to specificity is hydrogen/deuterium exchange at the amino-acid level after rapid mixing (0.4 ms) and NMR detection16. Broad application of such methods, however, is difficult.
A method that follows the fate of individual amino acid residues in the transition states is a Φ-value analysis that compares the folding kinetics and stability of the wild-type protein and its point mutants17-20. It is an indirect method based on the assumption that there is a close relationship between protein structure and energy, and that amino-acid substitutions (usually from mutation) do not significantly alter the folding pathway.
Another approach suitable for following fast protein folding may be to employ fast chemical and irreversible chemical labeling to follow a temperature jump. To do this, we chose barstar, an 89-residue single-domain protein containing four helices and three β-sheets, as a well-accepted model for folding studies. Its structure was solved by X-ray 21 and NMR 22. Barstar undergoes reversible unfolding transitions when denatured by high concentration of GdnHCl or urea, extreme pH, or low temperature, and refolds under appropriate conditions23,24. Its folding pathway is extensively characterized23-25. It was suggested by Agashe et al.26 that during the first several milliseconds of barstar folding, the polypeptide chain rapidly collapses to a compact globule possessing a solvent-accessible hydrophobic core that is difficult to monitor. Later, the combination of temperature-jump pump coupled with a fluorescence probe revealed that barstar folds to an intermediate in approximately 1 ms with 50% of the surface area buried compared to the denatured state14. Those authors proposed that barstar folding follows the general nucleation-condensation model whereby the nucleus is centered on the first helix that is consolidated in the intermediate state. The above two proposals seem to be contradictory on whether the helix has formed during the initial folding, likely owing to different experiment conditions, but they agree on the folding model of barstar. Recently, simulations applied to barstar show that helix1, of all possible regions and secondary structures, is the first to form6.
Recent advances in mass spectrometry (MS)-based protein footprinting have produced methods that allow study of folding by examining solvent accessibility as an indicator of protein conformational change, as assessed by corresponding changes in footprinting extents, as measured by MS27,28. Although the overall change of solvent accessibility is reflected by a global mass measurement29, the information on individual residues is more valuable in determining regional structure changes. Our hypothesis is that these changes can be induced by FPOP and revealed by bottom-up proteomic analysis of such protein samples. In this paper, we report a study of barstar early folding at the amino-acid residue level during the first several milliseconds by combining temperature-jump pump and “fast photochemical oxidation of proteins” (FPOP) probe. We introduced this strategy in a previous communication29, which was subsequently highlighted30, and showed that global changes in the protein do reveal the kinetics of folding. We now describe the results at the amino-acid level by conducting a similar experiment but now with proteolysis and LC/MS analysis. Our approach is a direct method that offers high resolution down to the amino-acid residue level.
Experimental
Materials
E. coli-expressed and purified barstar C82A variant was provided by Dr. C. Frieden and Dr. G. DeKoster at the concentration of 118 μM. HPLC-grade water, 30% H2O2, L-glutamine, L-methionine, catalase, guanidinium chloride (GdnCl), phosphate buffered saline (PBS, pH = 7.4) and proteomic-grade trypsin were purchased from Sigma-Aldrich Chemical Company (St. Louis, MO). Acetonitrile was from Honeywell Burdick and Jackson (Muskegon, WI). All chemicals were used without further purification.
Equilibrium Studies
Cold and heat denaturation of barstar was studied by a circular dichroism (CD) temperature scan at 222 nm on a J-815 CD spectrometer (JASCO Analytical Instruments, Tokyo, Japan). The barstar sample in PBS buffer with 1.2 M GdnCl was incubated at 0 °C for 1 h before CD measurement. During the CD scanning, the sample was heated to 30 °C at 20 °C·hr−1 and then to 70 °C at 40 °C·hr−1.
Two-color FPOP
Each protein sample contained 10 μM barstar, 1.2 M GdnCl, and 15 mM glutamine in PBS buffer, incubated at 0 °C for 3 h prior to the experiment. The experiment was conducted as previously described29 (see supplementary Figure S1) but with the following modification. The 150 μm i.d. fused silica was placed in a cooling system comprised of a thermally insulated box with two chambers abutting the FPOP apparatus. The 1st chamber contained copper tubing was connected to a compressed air supply and immersed in an ice bath. The 2nd chamber, into which the copper tubing emptied, enclosed the syringe pump, optics stand, and intervening fused silica, with a 2 cm2 window for laser transmission (see supplementary Figure S2). The temperature in the 2nd chamber was kept to < 3 °C by adjusting the air flow through the ice bath.
The Nd:YAG laser (Quanta-Ray, Mountain View, CA) was set at its full power, and the KrF excimer laser power (GAM Laser Inc., Orlando, FL) was set at 45 mJ/pulse, with the pulse frequency of both lasers set to 5 Hz. The flow rate was adjusted to ensure a 25% exclusion volume to avoid repeat *OH exposure. Eight different time delays between two lasers were applied in this experiment: 0.1, 0.2, 0.4, 0.6, 0.8, 1.0, 1.5, and 2.0 ms. After each adjustment of the delay circuit, the actual delay times were measured with the oscilloscope by using the signals detected by the laser diode. Two sets of control samples were submitted to FPOP at cold temperature and room temperature, respectively, without T jump. Five μL of H2O2 was added to a final concentration of 15 mM just prior to FPOP infusion. The flowing sample solution was collected in an Eppendorf tube containing 20 μL of 70 mM methionine and 100 nM catalase. The modified sample was kept at room temperature for 10 min to allow catalase to breakdown any excess peroxide.
Protein Digestion and LC/MS
Each protein sample was split into two vials and dried under vacuum in a SpeedVac. One vial of sample, to be digested by trypsin, was dissolved in 100 mM ammonium bicarbonate buffer. Trypsin solution (0.4 μL) was prepared according to the manufacturer’s protocol and added to each sample. Samples were stored at 37 °C for 8 h. The other vial of sample, to be digested by Glu-C, was dissolved in 25 mM ammonium carbonate buffer (pH 7.8). The incubation time was 6 h at 25 °C at a weight ratio of 1/40, enzyme:protein.
An aliquot (5 μL) of sample after 1:5 dilution, was loaded onto a custom-built silica capillary column packed with C18 reverse-phase material (Magic, 5 μm, 300 Å, Michrom, Auburn, CA). The gradient was from 2% solvent B (97% acetonitrile, 3% water, 0.1% formic acid) and 98% solvent A (97% water, 3% acetonitrile, 0.1% formic acid) to 50% solvent B over 50 min, then to 85% solvent B for 5 min at a flow rate of 260 nL/min followed by a 5 min re-equilibration step. The solution was sprayed directly from the column into an LTQ-Orbitrap mass spectrometer (Thermo Fisher, Waltham, MA) by using a PicoView PV-500 nanospray source (New Objective, Woburn, MA). A full mass spectrum of eluting peptides was recorded at high mass resolving power (100,000 for ions of m/z 400) with the FT mass spectrometer component while MS/MS experiments on the six most abundant ions from the eluent were conducted in the LTQ at a normalized collision energy of 35% of the maximum, using a 2 Da isolation width and wide-band activation. Ions submitted to MS/MS were placed in a dynamic exclusion list for 8 s.
Data Processing
LC-MS features of all acquisitions were aligned by Rosetta Elucidator (Microsoft, Bellevue, WA) peak detection and alignment software (a “feature” is the naturally occurring isotopic ensemble of one molecule eluting in time). Features were quantified by integrating the areas of all co-eluting LC-MS extracted ion chromatogram (EIC) peaks having the same monoisotopic mass within a 5 ppm resolution tolerance.
The software assigned a feature with a unique ID and associated all product-ion (MS2) spectra with their LC-MS features by using the same unique ID nomenclature. Independent from the Elucidator analysis, the product-ion spectra were searched against a restricted database containing barstar C82A by using Mascot error-tolerant searching. An Excel-based VBA program associated the Mascot calls with their LC-MS features by using the unique ID. This program matched LC-MS Mascot annotations to a theoretical FPOP-modified tryptic peptide list of barstar C82A. These matches, and over 60% of the Mascot calls, were manually validated, corrected, or rejected based on their product-ion (MS2) spectra before the perpeptide and per-residue yield analysis.
Per-residue yields were calculated as follows:
Here the denominator included both modified and unmodified peptides but excluded signal from missed-cleavage peptides spanning residuei if such peptides are not also detected as modified there. Per-peptide yields were determined according to the following equation:
Model curves were fitted to the time course data for each peptide (Figures 4-7) by using nonlinear least squares implemented with the function “Minimize” in Mathcad 14.0 M020 (Parametric Technology Corporation, Needham, MA). The model curve is constant up to time zero and then decays exponentially to a curve limit value at time infinity. The final result for the folded protein at room temperature (marked at 3 ms) is a steady-state result and was not included in the fits. The initial result (at t = 0) is also a steady state result, but was included in the fits shown here. To allow for the possibility of a burst phase31-33 before the first kinetic time point of 100 μsec, the data were fit by excluding the t = 0 point and the first time point.
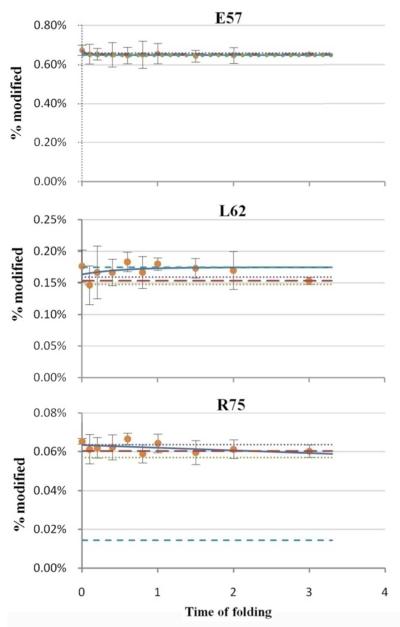
Figure 4.
The time-dependent modification extents for three example residues that show no significant difference between the native and unfolded states and during the early folding time period. The circles represent experimental data; solid lines are the fits of the data; blue dashed line is the curve limit; red dashed line is the measured end point; dotted lines represent the range, plus and minus, of the standard deviation for the measured end point. This legend also applies to the plots in Figures 5-7.
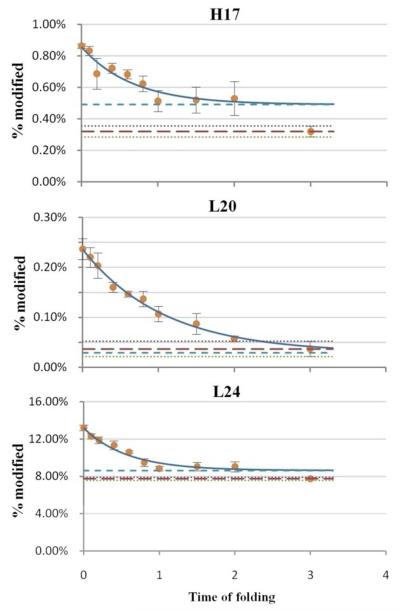
Figure 7.
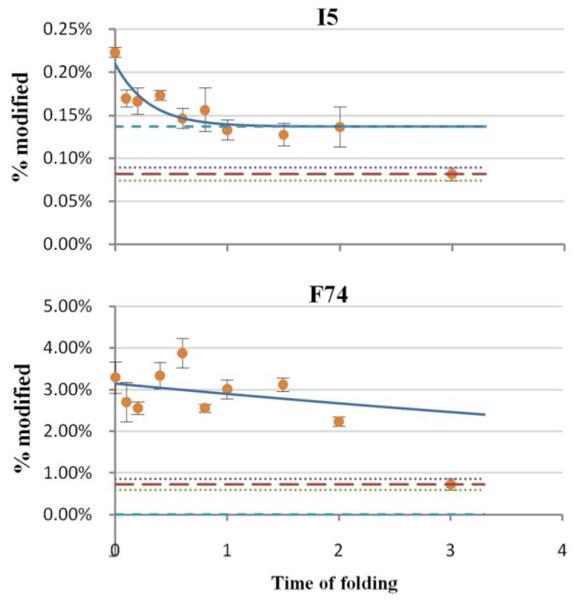
Example residues that show significant differences in extent of oxidative modification between the native and unfolded states. The residues are partially protected in the intermediate state as shown by less modification than in the denatured state. The trend of the modification extent throughout the early folding is less obvious than category three. See Figure 4 for legend.
Results and Discussion
Effect of Temperature on Barstar Folding
Barstar C82A in the presence of 1.2 M GdnCl unfolds at both high and low temperatures, as indicated by a far-UV CD measurement at 222 nm (Figure 1) that monitors secondary structure. The difference in solvent accessibility between the cold-denatured structure and the folded structure was also evaluated by FPOP footprinting and MS measurement, serving as the two end-point controls for the T jump experiment, both on the global scale of the protein and the amino-acid residue level.
Figure 1.
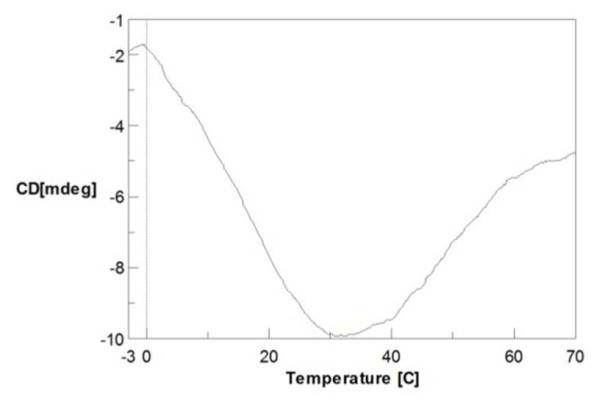
CD spectrum of barstar as function of temperature shows that the protein is unfolded at both low and high temperature. CD temperature scan was performed at 222 nm.
Barstar is not the only protein that exhibits cold unfolding. In fact, cold denaturation is a general phenomenon for all globular proteins34-37. Cold unfolding is driven by specific strongly temperature-dependent interactions that occur between the non-polar groups of a protein and water. Given that cold denaturation of most proteins occurs well below the freezing point of water, a denaturant is sometimes added to shift unfolding to a higher temperature, allowing the cold denaturation to occur and be observed. The concentration of 1.2 M GdnCl is sufficiently high to allow barstar to denature at low temperature but to fold rapidly when the temperature jump occurs.
Peptide Mapping and Oxidative Site Determination
We described the MS analysis of barstar folding dynamics at the global or protein level in a previous communication29. To understand the structural details during folding, however, amino-acid residue resolution is required. There are four essential components for an experiment that identifies the oxidation sites and quantifies the modified products: (1) complete proteolysis with good sequence coverage, (2) base-line separation of the modified and unmodified peptides, (3) high-mass resolving power to afford accurate mass measurement, and (4) MS/MS to reveal the sites that change during folding. Although trypsin digestion yields a complete set of peptides covering the entire protein sequence, there is a 32-residue segment in the middle of the sequence that contains no lysine or arginine. Thus, trypsin digestion gives an intact peptide piece that is not MS favorable. Several unmodified peptides spanning this region were detected, none of which were of sufficient abundance to justify looking for their modified counterparts, which are at lower levels. To achieve better analytical coverage, we used separate Glu-C digestion to complement trypsin digestion, as shown in Figure 2.
Figure 2.
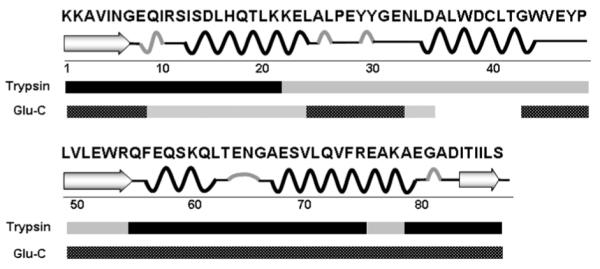
Sequence coverage map of barstar resulting from trypsin and Glu-C digestion. Black bars: sequence covered with peptides giving adequate signal intensities for analysis; gray bars: sequence covered with peptides of low signal intesities owing to miscleavage or the lack of cleavable sites.
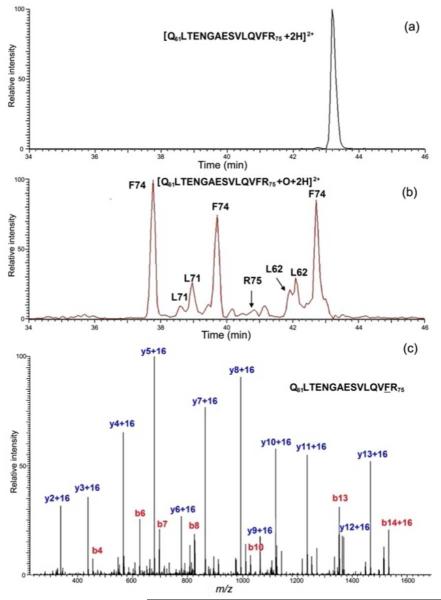
The detection of the substitution of H by OH can be done with high certainty. Typical extracted ion chromatograms for a peptide and its analogs modified most abundantly with a mass increase of 16 (15.9949) show convincingly the incorporation of an oxygen (Figure 3 (a) and (b)). Modified peptides with the same mass are separated, as shown by the chromatogram, quantified by using the integrated EIC peak area in the high resolving power MS domain, and identified by MS/MS (Figure 3 (c)). We will describe in a sequel paper a residuelevel comparison of barstar’s two states and the FPOP data analysis. We found that 19 residues were detected as modified, of which ten residues are significantly more labeled and hence more solvent-accessible in the cold state. With better sequence coverage achieved by complementary digestion, we identified more modified residues, as discussed later in this paper. Some residues, however, are insensitive to FPOP; thus, they cannot report any changes of solvent accessibility even though they may be important in the formation of the native structure of protein.
Figure 3.
(a) EIC of an unmodified tryptic peptide of barstar. (b). EIC of *OH-modified tryptic peptides. (c) Production spectrum of a modified peptide eluting at 37.8 min in (b). The y2+16 and b14+16 ions identify F74 as the modified site.
Folding Dynamics at Amino-acid Level
The amino-acid residues undergoing detectable modification can be grouped into four categories: (1) residues showing little or no difference of modification between native and denatured states, (2) residues modified to different extents between the native and the denatured states but showing little or no change during early folding, (3) residues modified to a different extent for the native and the denatured states and showing significant changes during early folding, and (4) residues partially protected in the intermediate state but showing no significant change in oxidative modification during the early folding. Residues that underwent relatively small percentages of modification are not included in the discussion because the measurement errors are too large to allow conclusions.
We plot the percentage of modification of these four sets in Figures 4-7 and discuss each of them in the following paragraphs. Every plot has two time-independent points: (1) when the folding time is zero (cold, where the protein is denatured) and (2) when the time is “infinite” (i.e., at room temperature when the protein is folded). Error bars are the standard deviations calculated from triplicate experiments. All experiment values except room temperature data were fit by a single exponential function. The %modified at room temperature data defines the measured end point. We fit the data in two ways by (1) including all points except the “infinite” time point (shown here) and (2) excluding additionally the first t = 0 point to allow for the prospect of a burst phase31-33. There is no significant difference between the two fittings except possibly for I5, where the difference is real but small.
Three example residues show either little or no difference in modification between native and denatured states (Figure 4), and they show the sensitivity of the method to regions of a protein that do not change significantly in folding. According to barstar’s NMR structure (PDB ID: 1BTA), E57 and L62 are located in helix3, and R75 is in helix4, with their side chains exposed or partially exposed to solvent. Our time-dependent plots show that these residues are not involved in any hydrophobic interactions throughout folding, and are always exposed. In particular, L62, although a hydrophobic residue and a candidate for interaction with other hydrophobic residues during folding, shows minimal change in solvent accessibility when the protein folds. This lack of change suggests that for small proteins like barstar, the folding process is straightforward; that is, those residues exposed in the final folded stage do not participate in early folding.
Two residues belonging to the second category are modified to different extents in the native and denatured states but show no change of modification during early folding (Figure 5). Both W53 and L88 are buried in the hydrophobic core in the native state; that is, they are more protected when folded. In the process of forming the first intermediate state, however, these residues are not involved in any hydrophobic interactions involving folding. They must be incorporated in the hydrophobic core during the late folding stage when the secondary and tertiary structures consolidate.
Figure 5.
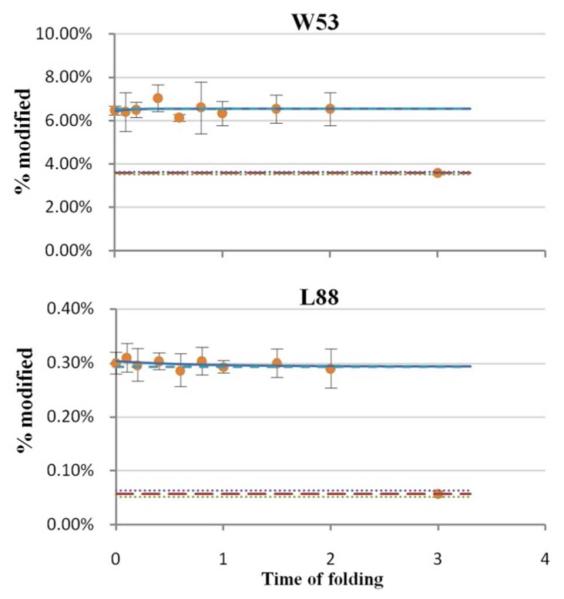
Examples of residues that show significant differences in oxidative modification between the native and unfolded states. No significant change in modification extent, however, occurred during the early folding. See Figure 4 for legend.
Residues of the third category (Figure 6) are of particular interest because they show a significant trend of increasing protection during early folding. The NMR structure shows they are tightly buried in the hydrophobic core in its native state. These residues must play a key role in forming a folding intermediate via a fairly compact structure. As shown in the plots, the modification extents of these residues in the intermediate state are close to those for the final folded state, indicating that this region of protein is condensed to a high extent during the first stage of folding. It should be noted that these residues are all located in helix1.
Figure 6.
Example residues showing significant difference in modification extent between the native and unfolded states. A clear trend that modification decreases with time (protection increases) is demonstrated for the early folding. See Figure 4 for legend.
Residues in the fourth category (Figure 7) are also important for understanding the folding mechanism of barstar and for establishing the validity of our approach. The residues are away from helix1, but they gain protection by the time the intermediate state is formed. Although we are able to fit the data of residue I5 to a curve, we consider the trend not as established as for category three owing to larger errors for category 4. These residues are probably involved in the early folding; their involvement is via an interaction with the condensed structure around helix1. The lack of a clear trend in the modification extent suggests that the interactions are rather weak and fluctuating during the first several hundred μs.
It is worth noting that the error bars are generally larger for the kinetic measurements when the protein is folding than when the protein is equilibrated in either cold temperature or room temperature and gives a steady-state measurement. We attribute the larger error to both experimental error and the nature of protein folding. In this experiment, we are observing an ensemble of conformations of protein, which is likely to be more diversified and uncertain while folding.
Characterization of the Intermediate State
The intermediate state of barstar folding can be represented by the structure formed 2 ms after initiation of folding. The modification extents of each residue shown in Figures 4-7 cannot be used for cross comparison among all residues, owing to the fact that different residues have different reactivity towards hydroxyl radicals and, thus, are modified to different extents even when they have the same solvent accessibility. Thus, we used a degree-of-folding value for each residue to evaluate and compare the folding extent. The degree-of-folding value of a residue in a particular state (s) is defined by the following equation:
When the degree-of-folding value equals 0, the residue is as exposed as in the denatured state. When the value equals 1, the residue is protected as in the native state. Intermediate values indicate either that the residues are involved partially in formation of a folded structure or they constitute a mixture of structures with different degrees of folding.
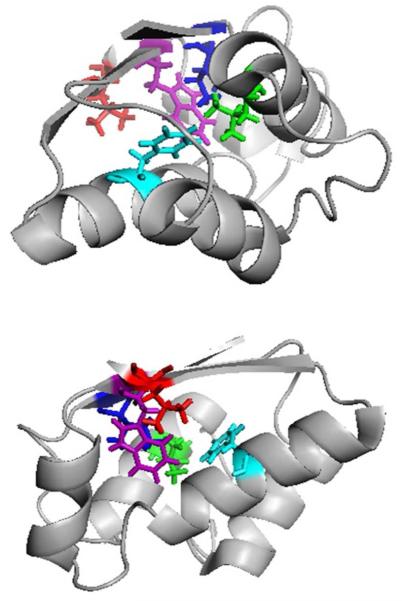
Folding can be better presented in a degree-of-folding plot of three states (cold-denatured, intermediate and native states) for selected residues representing different segments of the protein (Figure 8). All residues are given the value 0 in the denatured state and 1 in the native state, by definition. Among these residues, L20, a residue in helix1, has the largest degree of folding (> 0.8) in the intermediate state, indicating the formation of a partially solvent-excluded core. I5 and F74, residues in β-sheet1 and helix4, have degrees of folding of 0.57 and 0.29, respectively. They are likely to be involved in weaker interactions with the hydrophobic core than L20. W53 and L88, residues in β-sheet2 and β-sheet3, have degrees of folding that are nearly 0, indicating that these are as exposed residues in the intermediate state as in the denatured state. All five residues (H17, L20, L24, I5, F74) are all involved in the hydrophobic core formation in the native state, as shown in Figure 9, but are folded to different extent in the intermediate state.
Figure 8.
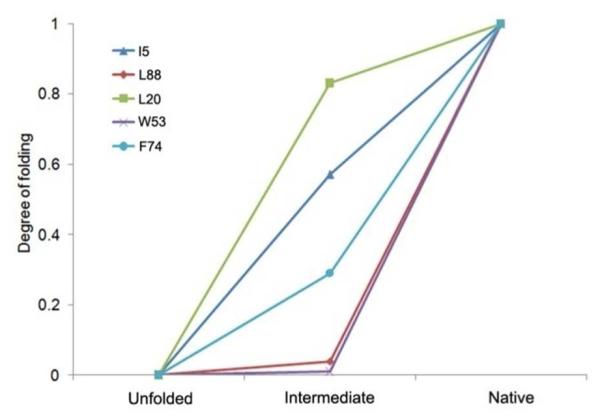
The degree-of-folding values for selected residues show the change from the cold-denatured, intermediate and native (final) states.
Figure 9.
Two views of native barstar with the five residues identified as important in folding according to our pump/probe experiment. The side chains are colored coded: Blue: I5, Green: L20, Purple: W53, Cyan: F74, Red: L88.
Our results can be compared to the Φ values provided by Nolting et al.14. The engineered proteins with the residues involved in the hydrophobic core that were substituted one-at-a-time in site-directed mutagenesis can be arranged in a decreasing order in of Φ values: L16V > I5V > F56A > L51V >, A67G > A77G. It was suggested that L16V with a high Φ probes mainly interactions in helix1 and between helix1 and helix4. Our data are consistent with their results. We are not able to probe A67 and A77 by FPOP, however, owing to the low reactivity of alanine to hydroxyl radicals.
Mechanism of Folding
The FPOP results on barstar folding are consistent with a general nucleation-condensation scheme that implicates a diffuse nucleus and some neighboring residues. According to our data, the folding nucleus is centered in helix1 that contains several residues showing increasing protection during early folding. Other residues (e.g., I5 and F74) may be involved in the folding but to a lesser extent. Their involvement is by long-range interactions with the nucleus, and they serve to stabilize the nucleus as it forms. There are also residues that are essential for the formation of the hydrophobic core in the native state but have no significant contact with the nucleus in the folding intermediate. The loose hydrophobic center with weak interactions is then further consolidated to become a well-established core during the second folding stage, which was not characterized in these experiments but can be predicted. A proposed model of barstar early folding is shown in Figure 10.
Figure 10.
Proposed mechanism of barstar early folding. The folding starts with an ensemble of different conformations of the polypeptide chain, and the protein structure moves with-in 2 ms to an intermediate possessing moderate structure. Residues colored coded in red are closely associated with the hydrophobic center; whereas those color-coded pink weakly interact with the core. Residues colored gray do not participate in the formation of the early folding intermediate.
Conclusion
The two-laser pump/probe approach that we introduced in a previous communication allows us to study directly the mechanisms of protein folding by determining those residues that change in the early stages. The significance of the approach is that it provides insights into the conformational changes occurring at amino-acid residue levels during protein folding. In particular, a nucleus centered on the helix1 region of barstar is formed to a significant extent in the intermediate state before further consolidation of structure occurs. Other residues are involved but via weaker interactions with the nucleus, and yet others are not involved at all in the formation of the nucleus. Owing to the nature of this experiment, we cannot conclude how much secondary structure is formed during the early folding. Although FPOP uses a hydroxyl radical as the reactant in a relatively non-selective mode, the radical does not modify all residues to a detectable extent. To obtain better footprinting coverage, other reagents might be used as complementary probes38-40.
The time frame may be extended to faster processes using the current approach of two lasers or by using an ultra-fast mixing device, taking advantage of the short radical-exposure time (less than one μs) during FPOP. In such cases, this “pump-probe” combination could detect protein folding in early collapsed states that occur on the μs time scale41,42. Our two-laser experiment, on the other hand, can also allow the study of slower process (i.e., the late stages of protein folding) by displacing the probe laser from the pump. The extension of the time frame will be essential for obtaining a more complete picture of protein folding than was obtained here. This is the subject of ongoing research in our laboratory. The methodology presented here for structural analysis of transiently formed protein states is not restricted to folding intermediates but may also pertain to detecting transient states important for protein function.
Supplementary Material
Acknowledgment
We acknowledge the generous financial support from National Institute of General Medical Sciences (8 P41 GM103422-35)) of the National Institutes of Health (PI MLG).
Footnotes
Supporting Information Available
Schematics of the experiment set-up. This information is available free of charge via the internet at http://pubs.acs.org/.
References
- (1).Dill KA, Ozkan SB, Shell MS, Weikl TR. Annu. Rev. Biophys. 2008;37:289–316. doi: 10.1146/annurev.biophys.37.092707.153558. [DOI] [PMC free article] [PubMed] [Google Scholar]
- (2).Dill KA. Biochemistry. 1985;24:1501–1509. doi: 10.1021/bi00327a032. [DOI] [PubMed] [Google Scholar]
- (3).Kim PS, Baldwin RL. Annu. Rev. Biochem. 1982;51:459–489. doi: 10.1146/annurev.bi.51.070182.002331. [DOI] [PubMed] [Google Scholar]
- (4).Marianayagam NJ, Jackson SE. Biophys. Chem. 2004;111:159–171. doi: 10.1016/j.bpc.2004.05.009. [DOI] [PubMed] [Google Scholar]
- (5).Brylinski M, Konieczny L, Roterman I. Biochimie. 2006;88:1229–1239. doi: 10.1016/j.biochi.2006.03.008. [DOI] [PubMed] [Google Scholar]
- (6).Yunger J. Physica A. 2007;386:791–798. [Google Scholar]
- (7).Gilmanshin R, Dyer RB, Callender RH. Protein Sci. 1997;6:2134–2142. doi: 10.1002/pro.5560061008. [DOI] [PMC free article] [PubMed] [Google Scholar]
- (8).Vidugiris GJ, Markley JL, Royer CA. Biochemistry. 1995;34:4909–4912. doi: 10.1021/bi00015a001. [DOI] [PubMed] [Google Scholar]
- (9).Piana S, Sarkar K, Lindorff-Larsen K, Guo M, Gruebele M, Shaw DE. J. Mol. Biol. 2011;405:43–48. doi: 10.1016/j.jmb.2010.10.023. [DOI] [PubMed] [Google Scholar]
- (10).Prigozhin MB, Gruebele M. J. Am. Chem. Soc. 2011;133:19338–19341. doi: 10.1021/ja209073z. [DOI] [PMC free article] [PubMed] [Google Scholar]
- (11).Xu M, Beresneva O, Rosario R, Roder H. J. Phys. Chem. B. 2012;116:7014–7025. doi: 10.1021/jp3012365. [DOI] [PMC free article] [PubMed] [Google Scholar]
- (12).Eigen MLDM. In: In Technique of Organic Chemistry. Pt. 2. Freiss S, L E, Weissberger A, editors. Vol. 8. Interscience Publishing Inc.; New York: 1963. pp. 895–1054. [Google Scholar]
- (13).Ballew RM, Sabelko J, Gruebele M. Proc. Natl. Acad. Sci. U. S. A. 1996;93:5759–5764. doi: 10.1073/pnas.93.12.5759. [DOI] [PMC free article] [PubMed] [Google Scholar]
- (14).Nolting B, Golbik R, Neira JL, Soler-Gonzalez AS, Schreiber G, Fersht AR. Proc. Natl. Acad. Sci. U. S. A. 1997;94:826–830. doi: 10.1073/pnas.94.3.826. [DOI] [PMC free article] [PubMed] [Google Scholar]
- (15).Brewer SH, Song B, Raleigh DP, Dyer RB. Biochemistry. 2007;46:3279–3285. doi: 10.1021/bi602372y. [DOI] [PubMed] [Google Scholar]
- (16).Uzawa T, Nishimura C, Akiyama S, Ishimori K, Takahashi S, Dyson HJ, Wright PE. Proc. Natl. Acad. Sci. U. S. A. 2008;105:13859–13864. doi: 10.1073/pnas.0804033105. [DOI] [PMC free article] [PubMed] [Google Scholar]
- (17).Matouschek A, Kellis JT, Jr., Serrano L, Fersht AR. Nature. 1989;340:122–126. doi: 10.1038/340122a0. [DOI] [PubMed] [Google Scholar]
- (18).Fersht AR, Matouschek A, Serrano L. J. Mol. Biol. 1992;224:771–782. doi: 10.1016/0022-2836(92)90561-w. [DOI] [PubMed] [Google Scholar]
- (19).Fersht AR, Sato S. Proc. Natl. Acad. Sci. U. S. A. 2004;101:7976–7981. doi: 10.1073/pnas.0402684101. [DOI] [PMC free article] [PubMed] [Google Scholar]
- (20).Cho JH, O’Connell N, Raleigh DP, Palmer AG., 3rd J. Am. Chem. Soc. 2010;132:450–451. doi: 10.1021/ja909052h. [DOI] [PMC free article] [PubMed] [Google Scholar]
- (21).Guillet V, Lapthorn A, Fourniat J, Benoit JP, Hartley RW, Mauguen Y. Proteins. 1993;17:325–328. doi: 10.1002/prot.340170309. [DOI] [PubMed] [Google Scholar]
- (22).Lubienski MJ, Bycroft M, Freund SM, Fersht AR. Biochemistry. 1994;33:8866–8877. [PubMed] [Google Scholar]
- (23).Khurana R, Udgaonkar JB. Biochemistry. 1994;33:106–115. doi: 10.1021/bi00167a014. [DOI] [PubMed] [Google Scholar]
- (24).Schreiber G, Fersht AR. Biochemistry. 1993;32:11195–11203. doi: 10.1021/bi00092a032. [DOI] [PubMed] [Google Scholar]
- (25).Shastry MC, Udgaonkar JB. J. Mol. Biol. 1995;247:1013–1027. doi: 10.1006/jmbi.1994.0196. [DOI] [PubMed] [Google Scholar]
- (26).Agashe VR, Shastry MC, Udgaonkar JB. Nature. 1995;377:754–757. doi: 10.1038/377754a0. [DOI] [PubMed] [Google Scholar]
- (27).Takamoto K, Chance MR. Annu. Rev. Biophys. Biomol. Struct. 2006;35:251–276. doi: 10.1146/annurev.biophys.35.040405.102050. [DOI] [PubMed] [Google Scholar]
- (28).Stocks BB, Konermann L. J. Mol. Biol. 2010;398:362–373. doi: 10.1016/j.jmb.2010.03.015. [DOI] [PubMed] [Google Scholar]
- (29).Chen J, Rempel DL, Gross ML. J. Am. Chem. Soc. 2010;132:15502–15504. doi: 10.1021/ja106518d. [DOI] [PMC free article] [PubMed] [Google Scholar]
- (30).Gruebele M. Nature. 2010;468:640–641. doi: 10.1038/468640a. [DOI] [PubMed] [Google Scholar]
- (31).Kuwajima K, Hiraoka Y, Ikeguchi M, Sugai S. Biochemistry. 1985;24:874–881. doi: 10.1021/bi00325a010. [DOI] [PubMed] [Google Scholar]
- (32).Ikeguchi M, Kuwajima K, Mitani M, Sugai S. Biochemistry. 1986;25:6965–6972. doi: 10.1021/bi00370a034. [DOI] [PubMed] [Google Scholar]
- (33).Kuwajima K, Garvey EP, Finn BE, Matthews CR, Sugai S. Biochemistry. 1991;30:7693–7703. doi: 10.1021/bi00245a005. [DOI] [PubMed] [Google Scholar]
- (34).Privalov PL, Griko Yu V, Venyaminov S, Kutyshenko VP. J. Mol. Biol. 1986;190:487–498. doi: 10.1016/0022-2836(86)90017-3. [DOI] [PubMed] [Google Scholar]
- (35).Griko YV, Privalov PL, Sturtevant JM, Venyaminov S. Proc. Natl. Acad. Sci. U. S. A. 1988;85:3343–3347. doi: 10.1073/pnas.85.10.3343. [DOI] [PMC free article] [PubMed] [Google Scholar]
- (36).Privalov PL. Crit. Rev. Biochem. Mol. Biol. 1990;25:281–305. doi: 10.3109/10409239009090612. [DOI] [PubMed] [Google Scholar]
- (37).Pastore A, Martin SR, Politou A, Kondapalli KC, Stemmler T, Temussi PA. J. Am. Chem. Soc. 2007;129:5374–5375. doi: 10.1021/ja0714538. [DOI] [PMC free article] [PubMed] [Google Scholar]
- (38).Gau BC, Chen H, Zhang Y, Gross ML. Anal. Chem. 2010;82:7821–7827. doi: 10.1021/ac101760y. [DOI] [PMC free article] [PubMed] [Google Scholar]
- (39).Gomez GE, Cauerhff A, Craig PO, Goldbaum FA, Delfino JM. Protein Sci. 2006;15:744–752. doi: 10.1110/ps.051960406. [DOI] [PMC free article] [PubMed] [Google Scholar]
- (40).Chen J, Cui W, Giblin D, Gross ML. J. Am. Soc. Mass Spectrom. 2012;23:1306–1318. doi: 10.1007/s13361-012-0403-1. [DOI] [PMC free article] [PubMed] [Google Scholar]
- (41).Arai M, Kondrashkina E, Kayatekin C, Matthews CR, Iwakura M, Bilsel O. J. Mol. Biol. 2007;368:219–229. doi: 10.1016/j.jmb.2007.01.085. [DOI] [PubMed] [Google Scholar]
- (42).Lapidus LJ, Yao S, McGarrity KS, Hertzog DE, Tubman E, Bakajin O. Biophys. J. 2007;93:218–224. doi: 10.1529/biophysj.106.103077. [DOI] [PMC free article] [PubMed] [Google Scholar]
Associated Data
This section collects any data citations, data availability statements, or supplementary materials included in this article.


