Abstract
Exposure of MCF-7 breast tumor cells or HCT-116 colon carcinoma cells to clinically relevant concentrations of doxorubicin (Adriamycin; Farmitalia Research Laboratories, Milan, Italy) or camptothecin results in both autophagy and senescence. To determine whether autophagy is required for chemotherapy-induced senescence, reactive oxygen generation induced by Adriamycin was suppressed by N-acetyl cysteine and glutathione, and the induction of ataxia telangiectasia mutated, p53, and p21 was modulated pharmacologically and/or genetically. In all cases, autophagy and senescence were collaterally suppressed. The close association between autophagy and senescence indicated by these experiments reflects their collateral regulation via common signaling pathways. The potential relationship between autophagy and senescence was further examined through pharmacologic inhibition of autophagy with chloroquine and 3-methyl-adenine and genetic ablation of the autophagy-related genes ATG5 and ATG7. However, inhibition of autophagy by pharmacological and genetic approaches could not entirely abrogate the senescence response, which was only reduced and/or delayed. Taken together, our findings suggest that autophagy and senescence tend to occur in parallel, and furthermore that autophagy accelerates the development of the senescent phenotype. However, these responses are not inexorably linked or interdependent, as senescence can occur when autophagy is abrogated.
Introduction
Cellular senescence is defined as a biological state in which cells have lost the ability to divide, but remain metabolically active for a prolonged period of time (Evan and d'Adda di Fagagna, 2009). Three general types of senescence have been identified: replicative senescence, oncogene-induced senescence, and premature (accelerated or stress-induced) senescence (Gewirtz et al., 2008). Replicative senescence describes a proliferative arrest that is caused by telomere shortening after a genetically predetermined number of cell divisions in nontransformed cells (Shay and Roninson, 2004). Oncogene-induced senescence reflects the capacity of the cells to undergo senescence in the presence of the expression of oncogenes such as Ras, ostensibly in an effort to delay transformation (Lee et al., 1999). Premature, accelerated, or stress-induced senescence occurs through exposure of the cells to exogenous cytotoxic agents generally associated with DNA damage (Campisi and d'Adda di Fagagna, 2007; Gewirtz et al., 2008).
Autophagy is a catabolic process involving the degradation of a cell's own components through the lysosomal machinery (Glick et al., 2010). Autophagy can be either a cytoprotective or cytotoxic response to chemotherapy or radiation (Gewirtz et al., 2009). Although apoptosis and autophagy are highly regulated processes that may cross-talk to determine the ultimate cell fate (Thorburn, 2008), a relatively limited number of reports in the literature have suggested the potential existence of a direct relationship between autophagy and senescence. An increase of autophagic vacuoles and senescence-associated β-galactosidase (SA-β-gal) activity was observed in aging fibroblasts (Gerland et al., 2003). Markers of autophagy and senescence were collaterally observed in the bile duct cells of patients with primary biliary cirrhosis as well as in biliary epithelial cells isolated from mice and treated with either hydrogen peroxide or etoposide (Sasaki et al., 2010). Gosselin et al. (2009) reported the generation of autophagic vesicles in dying senescent keratinocytes, and Patschan et al. (2008) have observed autophagy markers in senescent endothelial cells. In addition, Lu et al. (2008) reported that the Ras homolog ARHI (aplasia Ras homolog member I) promoted autophagic cell death in ovarian cancer cells in culture and contributed to tumor dormancy in vivo, although there were no direct assessments of senescence.
Of perhaps the most direct relevance to the current work, Young et al. (2009) reported the up-regulation of autophagy-related genes during oncogene-induced senescence and that inhibition of autophagy delayed the senescence phenotype. Because autophagy is often considered to be a cytoprotective response to stress, whereas stress-induced senescence could also reflect efforts by the cell to evade direct cell killing (Kroemer and Levine, 2008; Gewirtz, 2009), the current studies using both breast tumor and colon cancer cells were designed to determine the potential relationship between the autophagy and senescence responses of tumor cells exposed to the antitumor drugs doxorubicin [Adriamycin (ADR); Farmitalia Research Laboratories, Milan, Italy] and camptothecin (CPT). More specifically, this work addressed the question of whether senescence was dependent on prior autophagy.
Materials and Methods
Cell Culture and Treatment.
MCF-7 cells were purchased from the American Type Culture Collection (Manassas, VA) and cultured in RPMI 1640 supplemented with 5% (v/v) fetal bovine serum (Gemini, Irvine, CA), 5% (v/v) bovine calf serum (Lonza Walkersville, Inc.,Walkersville, MD), 100 U/ml penicillin G sodium, and 100 μg/ml streptomycin sulfate (Invitrogen, Carlsbad, CA). HCT-116 cells were purchased from the American Type Culture Collection and cultured in RPMI 1640 supplemented with 10% fetal bovine serum and l-glutamine (0.292 mg/ml), 100 U/ml penicillin G sodium (Invitrogen), and 100 μg/ml streptomycin sulfate (Invitrogen). All cells were maintained at less than 80% confluence at 37°C under a humidified 5% CO2 atmosphere. Twenty-four hours after plating, cells were exposed to 1 μM ADR or 5 μM camptothecin for 2 h, rinsed twice with phosphate-buffered saline (PBS), and maintained in complete medium for the indicated time points. In certain experiments, ADR treatment was preceded with 5 μM chloroquine (CQ; Sigma-Aldrich, St. Louis, MO), 5 mM 3-methyl-adenine (3-MA) (Sigma-Aldrich), 20 μM 2-morpholin-4-yl-6-thianthren-1-yl-pyran-4-one (KU-55933) (Calbiochem, San Diego, CA), or 4 mM caffeine (Sigma-Aldrich).
Western Immunoblotting.
After the indicated treatments, cells were washed with PBS and lysed with mammalian protein extraction reagent (Thermo Fisher Scientific, Waltham, MA) containing protease and phosphatase inhibitors. Protein concentrations were determined by the Bradford assay (Bio-Rad Laboratories, Hercules, CA). Total protein lysates (10 μg) were then diluted in SDS sample buffer and dry-boiled for 10 min. Protein samples were subjected to SDS-polyacrylamide gel electrophoresis, transferred to polyvinylidene difluoride membrane, and blocked in 5% milk/1× PBS/0.1% Tween for 1 h. The membrane was incubated with anti-p62 (1:1000; Santa Cruz Biotechnology, Inc., Santa Cruz, CA), anti-p21 (1:1000; BD Biosciences, San Jose, CA), anti-pRb (1:1000; BD Pharmingen, San Diego, CA), anti-p53 (1:1000; BD Pharmingen), anti-Atg5 and anti-Atg7 (1:1000; Santa Cruz Biotechnology, Inc., Santa Cruz, CA), and anti-β-actin (1:1000; Sigma-Aldrich). The membrane was then incubated with a secondary antibody of horseradish peroxidase-conjugated goat anti-rabbit IgG antibody (1:5000; Sigma-Aldrich) or goat anti-mouse (1:5000; Sigma-Aldrich) for 1 h, followed by extensive washing with PBS-Tween. Immunoblots were developed by using Pierce enhanced chemiluminescence reagents and Bio-Max film (Thermo Fisher Scientific).
Detection and Quantification of Acidic Vesicular Organelles by Staining with Acridine Orange.
For quantification of AVOs, treated cells were trypsinized, harvested, and washed with PBS at approximately 1 × 10⁶ cells/ml. Pellets were resuspended in PBS and stained with a final concentration of 1:10,000 acridine orange (Sigma-Aldrich). Samples were incubated for 15 min before analysis by flow cytometry. Flow cytometry was performed by using BD FACS Canto II using BD FACS Diva software (BD Biosciences) at the Virginia Commonwealth University Flow Cytometry Core Facility. A minimum of 10,000 cells within the gated region was analyzed. For detection of AVOs using fluorescent microscopy, treated cells were stained with acridine orange at a final dilution of 1:10,000 and allowed to incubate at 37°C for 15 min. After extensive washing with PBS, cells were examined and imaged under a fluorescence microscope (Olympus, Tokyo, Japan). All images within a given figure were taken at the same magnification.
Transmission Electron Microscopy.
Transmission electron microscopy services including sample fixation, embedding, ultramicrotomy, and staining were provided by the Virginia Commonwealth University Department of Anatomy and Neurobiology Microscopy Facility. Sections were imaged by using a JEOL (Tokyo, Japan) JEM-1230 transmission electron microscope equipped with a Gatan (Pleasanton, CA) UltraScan4000SP 4 K X 4 K charge-coupled device camera. The magnification of each image is indicated by the scale bar at the bottom of the micrographs in the figures.
Detection and Quantification of Senescent Cells.
For detection of SA-β-gal- positive cells, treated cells were washed with PBS and fixed with 2% formaldehyde/0.2% glutaraldehyde/PBS for 5 min. Cells were washed and stained with 5-bromo-4-chloro-3-inolyl-β-d-galactoside in dimethylformamide (20 mg/ml), 40 mM citric acid/sodium phosphate, pH 6.0, 5 mM potassium ferrocyanide, 5 mM potassium ferricyanide, 150m M NaCl, and 2 mM MgCl2 and incubated at 37°C for 24 h. After incubation, cells were washed with PBS and imaged by using an Olympus inverted microscope. All images within a given figure were taken at the same magnification. For quantification of SA-β-gal, cells were treated as described above and analyzed by using the fluorescent β-galactosidase activity marker C12FDG. The protocol was adapted from Debacq-Chainiaux et al. (2009). In brief, plated cells were pretreated with 100 nM bafilomycin A1 for 1 h in culture medium at 37°C, 5% CO2 followed by treatment with C12FDG at a final concentration of 10 μM for 1 h. Cells were washed with 1× PBS and harvested by trypsinization followed by centrifugation. Cells were resuspended in PBS at a concentration of 1 × 10⁶ cells/ml and analyzed on BD FACS Canto II. Cell populations were gated on a two-parameter display of forward scatter versus side scatter. From the gated population, at least 10,000 cell events were depicted on a histogram where the y-axis indicated cell count and the x-axis indicated C12-fluorescin fluorescence intensity. β-Galactosidase activity was estimated by using the mean fluorescent intensity of the population.
RFP-LC3 Redistribution.
The MCF-7 cell line stably expressing RFP-LC3 was a generous gift from Dr. Keith Miskimins (University of South Dakota, Vermillion, SD). Cells were treated as described above, fixed in 3% paraformaldehyde, and visualized by using an Olympus inverted fluorescent microscope.
Monodansylcadaverine Staining for the Detection of Acidic Vesicular Organelles.
Treated cells were incubated with complete medium containing 1 μg/ml monodansylcadaverine for 15 min at 37°C. After incubation, cells were washed with PBS, fresh medium was added, and fluorescent micrographs were taken by using an Olympus inverted fluorescence microscope. All images within a given figure were taken at the same magnification.
DCF Staining for Detection of Reactive Oxygen Species.
Intracellular ROS production was determined by flow cytometry using DCF- diacetate as the fluorescent probe. Cells (1 × 10⁶) were treated appropriately and incubated with the probe for 30 min at 37°C. Subsequently, cells were washed, resuspended in PBS, and analyzed for mean fluorescence intensity by using BD FACS Canto II at the Virginia Commonwealth University Flow Cytometry Core Facility. The median fluorescence intensity was quantified by FACS Diva software and the recorded histograms.
Immunofluorescence Microscopy.
Cells were seeded on chambered slides (Lab-Tek; Nalge Nunc International, Rochester, NY), fixed with 3% paraformaldehyde for 10 min, and permeabilized with 0.1% Triton X-100 for 5 min. Slides were blocked with 1% bovine serum albumin/PBS for 1 h at room temperature, and incubated overnight at 4°C with the following primary antibodies: mouse monoclonal γ-H2AX (1:1000; Millipore Corporation, Billerica, MA) and mouse monoclonal 53BP1 (1:100; Novus Biologicals, Inc., Littleton, CO). After extensive washing with PBS, secondary antibodies labeled with Alexa 488 (1:500; Invitrogen) or Alexa 555 (1:500; Invitrogen) were added, and slides were incubated for 1 h at room temperature. Slides were mounted with mounting media, and images were acquired at room temperature with an Olympus inverted fluorescence microscope.
Statistical Analysis.
Statistical differences were determined by using StatView statistical software (SAS Institute, Cary, NC). The data were expressed as the means ± S.D. (as S.D. of the mean). Comparisons were made by using a one-way analysis of variance followed by Tukey-Kramer post hoc test, and p values ≤0.05 were taken as statistically significant.
Results
Autophagy and Senescence Are Collaterally Induced in MCF-7 Breast Cancer Cells by Adriamycin.
Our previous studies as well as others have established the capacity of Adriamycin to promote premature or accelerated senescence in tumor cells (Chang et al., 1999; Elmore et al., 2002; Di et al., 2009; Gewirtz, 2009), whereas a number of studies have indicated that ADR also promotes autophagy (Di et al., 2009; Qian and Yang, 2009). We have postulated that both autophagy and senescence may represent efforts by the tumor cell to evade drug or radiation-induced toxicity (Gewirtz, 2009), and it is well established that different modes of cell death may coexist in the same cancer cell population in response to genotoxic stress (Di et al., 2009; Jinno-Oue et al., 2010). Furthermore, a number of studies have suggested that autophagy and senescence could be closely related events in aging cells as well as in response to various modes of stress (Gerland et al., 2003; Gosselin et al., 2009; Young et al., 2009). Consequently, we assessed whether senescence and autophagy were coincident responses in MCF-7 breast cancer cells when exposed to pharmacological concentrations of the topoisomerase II poison Adriamycin.
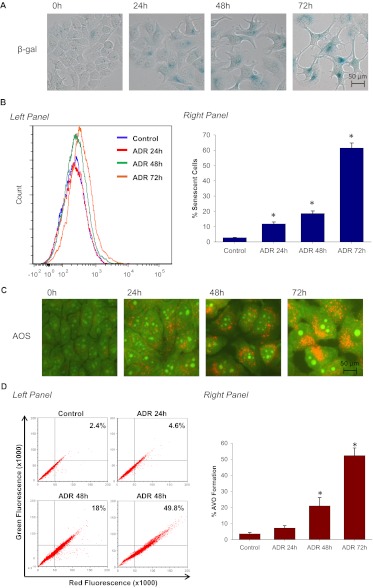
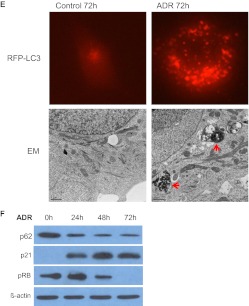
Figure 1 indicates that ADR induces both senescent and autophagic responses in a time-dependent manner. Specifically, Fig. 1A indicates a time-dependent increase in β-galactosidase staining and senescence-associated cell morphology alterations. Figure 1B demonstrates that ADR significantly increased the population of senescent cells over 72 h (from 2.8 to 61.4%) based on FACS analysis. ADR treatment also induced acidic vesicular organelle formation in MCF-7 cells as assayed by acridine orange staining (AOS) (Fig. 1C). AOS quantification by FACS analysis demonstrated that ADR increased autophagic vesicle content (from 2.4 to 53.2%) over the 72-h period subsequent to drug exposure in close parallel with the promotion of senescence (Fig. 1D). Consistent with these observations, ADR triggered the formation of autophagosomes/autolysosomes as visualized by RFP-LC3 punctate formation in MCF-7 cells that stably express the fusion protein as well as by electron microscopy (Fig. 1E). These initial observations suggested that autophagy and senescence might be collaterally induced responses upon exposure to Adriamycin.
Fig. 1.
ADR induces both senescence and autophagy in MCF-7 cells. MCF-7 cells were treated with 1 μM ADR for 2 h followed by drug removal and replacement with fresh medium. A, β-galactosidase staining. Control cells generally show minimal staining. B, left, representative histogram of positive C12FDG fluorescent cells for each treatment. Right, flow cytometric detection of SA-β-gal activity as measured by C12FDG-fluorescin fluorescence. *, p < 0.001 compared with control. C, cells were stained with acridine orange and imaged by fluorescence microscopy. D, left, representative dot plots of positive acridine orange staining for each treatment. Right, cells were quantified for AVO formation produced by ADR treatment by FACS analysis. *, p < 0.001 compared with control. E, punctate signal of RFP-LC3 and transmission electron microscopy imaging 72 h after ADR treatment. Arrowheads in red indicate autophagosome formation. F, immunoblot analysis of p62, p21, pRb, and β-actin. Data are representative of an average of three independent experiments.
Because an increase in autophagic vesicle formation can indicate either promotion of autophagy or interference with vesicle degradation, autophagic flux was assessed based on the degradation of p62 (Mizushima et al., 2010). p62 (SQSTM1) is an oligomerizing signaling adaptor protein that binds to ubiquitin and LC3-II (Pankiv et al., 2007). One important function of p62 in regard to autophagy is its ability to shuttle ubiquinated proteins to the proteasome and autophagosomes (Seibenhener et al., 2004); hence, its status is an indicator of autophagic flux. As shown in Fig. 1F, immunoblotting analyses revealed the degradation of p62 to be maximal between 48 and 72 h after ADR treatment. In addition, we examined the capacity of ADR to induce p21 and promote dephosphorylation of Rb, two well accepted biochemical markers of senescence (Kuilman et al., 2010). p21 interferes with cell cycle progression by inhibiting cyclin-dependent kinases, whereas the dephosphorylation of Rb occurs when the cyclin-dependent kinases are inhibited (Roninson, 2002). Figure 1F demonstrates a time-dependent increase in p21 and a decline in pRb levels when MCF-7 cells are exposed by ADR. These results indicate that both autophagy and senescence are collaterally induced by ADR in MCF-7 breast cancer cells.
Suppression of Free-Radical Generation Interferes with ADR-Induced Senescence and Autophagy.
We have reported previously that ADR-induced senescence is associated with the generation of ROS (Di et al., 2009). To further investigate the potential autophagy-senescence relationship, we assessed the impact of the free-radical scavengers glutathione (GSH) or N-acetyl cysteine (NAC) on ADR-induced senescence and autophagy. As shown in Supplemental Fig. 1A, a time-dependent increase of ROS was observed in MCF-7 cells exposed to ADR, based on the intensity of DCF fluorescence followed by FACS analysis. A peak level of ROS was evident at 96 h after ADR treatment. Repression of ROS generation by GSH or NAC before ADR exposure was observed by fluorescent microscopy (Supplemental Fig. 1B).
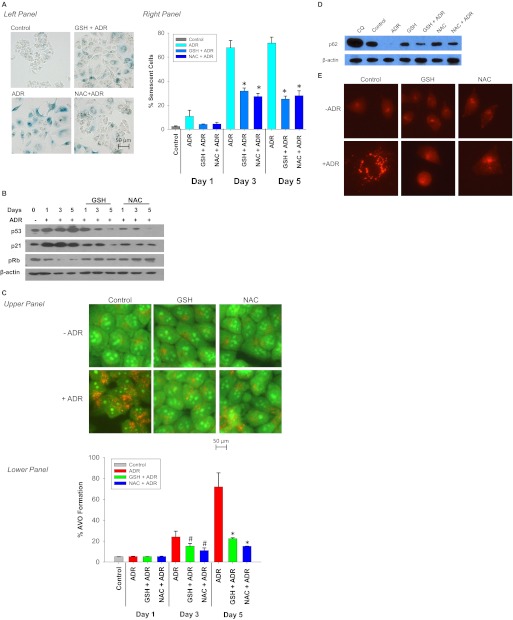
Although there are no clear-cut direct pharmacologic inhibitors of senescence, we have shown previously that NAC and GSH suppressed ADR-induced senescence in MCF-7 cells (Di et al., 2009). Moreover, NAC has also been reported to attenuate cellular senescence induced in fibroblasts by the alkylating agent busulfan (Probin et al., 2007). Thus, we hypothesized that GSH or NAC could be used to probe the putative association between ADR-induced senescence and autophagy. Figure 2A, left shows that both GSH and NAC significantly blocked ADR-induced senescence as assayed by β-galactosidase staining. Specifically, both NAC and GSH inhibited ADR-induced senescence by between 50 and 60% over the course of 5 days (Fig. 2A, right) as quantified by C12FDG-fluorescin fluorescence. These results were also reproduced in HCT-116 colon cancer cells (Supplemental Fig. 1C). Consistent with the effect on the senescence response to ADR, GSH and NAC blocked ADR-induced up-regulation of p53 and p21, and down-regulation of pRb, all of which are associated with stress-induced senescence in MCF-7 cells (Fig. 2B).
Fig. 2.
Involvement of free radicals in ADR-induced senescence and autophagy. MCF-7 cells were pretreated with 20 μM GSH or 20 μM NAC for 1 h followed by 1 μM ADR for 2 h. The drugs were removed, and fresh media were restored. A, senescence was evaluated by β-galactosidase staining 72 h after treatment (left) and quantified for C12FDG-fluorescin fluorescence by FACS analysis (right). *, p < 0.001 compared with control. B, immunoblot analysis of p53, p21, pRb, and β-actin. C, acridine orange staining visualized by fluorescence microscopy (top) and quantified by FACS analysis (bottom). #, p < 0.05 compared with ADR treatment on day 3; *, p < 0.001 compared with ADR treatment on day 5. D, immunoblot analysis of p62 and β-actin were evaluated 72 h after treatment. E, fluorescence microscopy for RFP-LC3 at 72 h after initiation of the indicated treatments.
To further address the putative relationship between chemotherapy-induced autophagy and senescence, the effects of GSH and NAC on ADR-induced autophagy were evaluated by acridine orange staining using fluorescence microscopy and FACS analysis. A marked reduction in AOS formation in MCF-7 cells (Fig. 2C) by GSH and NAC was reproduced in HCT-116 colon cancer cells (Supplemental Fig. 1D). Time course studies by FACS analysis revealed that the addition of NAC or GSH significantly decreased AVO formation induced by ADR (by 49.5 and 56.08%, respectively) over the course of 5 days (Fig. 2C, bottom).
In additional studies, the autophagic flux (reduction in p62 levels) induced by ADR was partially inhibited by pretreatment with either GSH or NAC (Fig. 2D). To further confirm the collateral inhibition of ADR-induced autophagy and senescence by free-radical scavengers, we used MCF-7 cells stably transfected with RFP-LC3. Figure 2E demonstrates that pretreatment with GSH or NAC before ADR effectively abrogated ADR-induced autophagy based on the pronounced reduction of autophagic puncta formation in the cytoplasm. Taking these findings together, we observed collateral modulation of ADR-induced autophagy and senescence when ROS generation was inhibited.
Influence of the DNA Damaging Signaling Pathway on ADR-Induced Autophagy and Senescence.
Adriamycin is a topoisomerase II inhibitor that induces DNA double-strand breaks, with consequent activation of the DNA damage signaling pathway (Kurz et al., 2004). ATM, one of the early sensors of DNA damage, has been implicated in the regulation of both autophagy (Alexander et al., 2010) and senescence (Crescenzi et al., 2008). Specifically, it has been reported that ATM knockout prevents the induction of autophagy in response to ROS (Alexander et al.,2010). With regard to senescence, silencing of ATM caused senescent tumor cells to re-enter the cell cycle (Crescenzi et al., 2008).
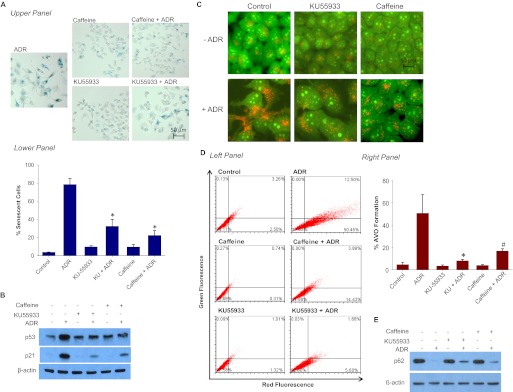
A number of downstream target substrates are phosphorylated by ATM, including histone γ-H2AX, 53BP1, and p53 (Banin et al., 1998; Burma et al., 2001; Lee et al., 2009). To further investigate the potential relationship between autophagy and senescence in response to ADR, we first confirmed that ADR induces ATM and its downstream effectors in MCF-7 cells. Supplemental Fig. 2A demonstrates foci formation for p-ATM, γ-H2AX, and 53BP1 in response to ADR in MCF-7 cells, which confirms activation of the DNA damage signaling pathway. To determine whether suppression of ATM might collaterally suppress autophagy and senescence in response to ADR, caffeine and KU-55933 were used to inhibit ATM activity. Caffeine is a well established inhibitor of the activity of both ATM and ATR kinases (Wang et al., 2008), whereas KU-55933 is a highly specific ATM inhibitor (Hickson et al., 2004). Supplemental Fig. 2B demonstrates a marked reduction in p-ATM foci when MCF-7 cells were treated with either KU-55933 or caffeine in combination with ADR, confirming that these agents are indeed suppressing the functions of ATM. Figure 3A, top demonstrates the capacity of both caffeine and KU-55933 to inhibit ADR-induced senescence, as indicated by the decreased β-galactosidase staining, and effects on the cell size and flattened phenotype of the senescent cells. Quantification of the extent of inhibition of senescence induction by Adriamycin by both KU-55933 and caffeine is presented in Fig. 3A, bottom. Although ADR produced a significant increase in senescent cells, the senescent cell population was decreased from 78 to 31 and 20%, respectively in cells that were also treated with either KU-55933 or caffeine. Furthermore, the induction of both p21 and p53 by ADR was also attenuated with the combination treatments as seen in Fig. 3B. These results are in agreement with the studies by Crescenzi et al. (2008) and findings by Zhan et al. (2010), which link ATM activation to senescence.
Fig. 3.
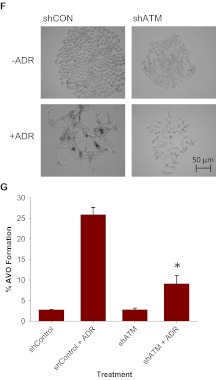
Influence of ATM activity on ADR-induced senescence and autophagy. MCF-7 cells were treated with 1 μM ADR for 2 h preceded by a 2-h exposure to 20 μM KU55933 or 2 mM caffeine. A, top, MCF-7 cells were fixed and stained for β-galactosidase. Bottom, flow cytometric detection of SA-β-gal activity as measured by C12FDG-fluorescin fluorescence. *, p < 0.001 compared with ADR treatment. B, immunoblot analysis of p53, p21, and β-actin. C, acridine orange staining visualized by fluorescence microscopy. D, left, representative dot plots of positive acridine orange staining for each of the indicated treatment. Right, quantification of acridine orange staining by FACS analysis. *, p < 0.001 compared with ADR; #, p < 0.003 compared with ADR. E, immunoblot analyses of p62 and β-actin. F and G, MCF-7 cells were transfected with either shRNA against a scramble control (shCON) or shRNA against ATM (shATM). F, shCON and shATM MCF-7 cells were assessed for β-galactosidase staining 72 h after ADR treatment. G, cells with AVO formation were monitored by FACS analysis 72 h after treatment. *, p < 0.001 compared with shCON + ADR.
To examine whether senescence and autophagy are altered in parallel after ATM inhibition, we again used acridine orange staining. Figure 3C demonstrates that both caffeine and KU-55933 significantly inhibit ADR-induced autophagy as shown by acridine orange staining. Quantification of AVO formation by FACS analysis (Fig. 3D) confirmed these findings. MCF-7 cells treated with ADR demonstrated a significant increase in red fluorescence, whereas when exposure to ADR was preceded by treatment with either KU-55933 or caffeine the intensity of red fluorescence was reduced from 50.95 to 7.28 and 18.32%, respectively (Fig. 3D). In addition, as shown in Fig. 3E, the reduction in p62 levels induced by ADR was antagonized by both caffeine and KU-55933, consistent with the premise that interference with the DNA damage pathway can collaterally suppress both autophagy and senescence. These results further establish that both autophagy and senescence are downstream responses mediated via the DNA damage signaling pathway.
To further confirm the association between the DNA damage signaling pathway and both senescence and autophagy, shRNA was used to down-regulate ATM in MCF-7 cells. In contrast to shRNA scramble cells, depletion of ATM caused a significant decrease in senescence as assayed by β-galactosidase staining (Fig. 3F) and correspondingly blocked autophagy in response to ADR as quantified by FACS analysis of acridine orange-stained cells (Fig. 3G). Thus, the fact that suppression of senescence by ATM depletion collaterally blocked autophagy and senescence further supports the premise that the two may be linked pathways.
Attenuation of Adriamycin-Induced Autophagy by p21 shRNA.
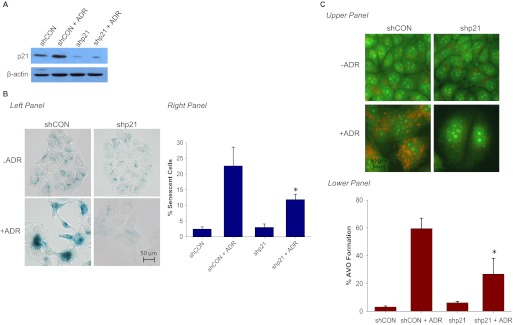
Induction of p21 is a well established response to ADR (Ravizza et al., 2004). Our previous studies showed a robust accumulation of p21 after ADR treatment in association with senescence in both p53 wild-type MCF-7 cells and breast tumor cells lacking functional p53 (Elmore et al., 2002). Downstream of ATM the induction of p21 is generally considered to be a critical component of the senescence response pathway (Macip et al., 2002; Roninson et al., 2003). Furthermore, up-regulation of p21 has been reported to result in ROS accumulation and a senescence response in both normal and tumor cells (Macip et al., 2002). To determine susceptibility to autophagy in cells lacking p21, a MCF-7 cell line stably expressing p21 (shp21) was generated. p21 expression was markedly reduced (by approximately 70%) in the shp21 cells (Fig. 4A) and, as expected, ADR failed to induce p21 (Fig. 4A). As would be expected in cells where p21 induction is attenuated, the extent of senescence induced by ADR was markedly reduced in the shp21 cells (Fig. 4B). Quantification by FACS analysis indicated a more than 50% reduction of senescent cells in MCF-7 shp21 cells in comparison with senescence in the shControl cells (Fig. 4B, right). Furthermore, the morphology of the ADR-treated shp21 MCF-7 cells appeared to be different from that of the wild-type MCF-7 cells in terms of reduced flattening and extensions and the absence of cell enlargement (Fig. 4B, left). These findings, indicating that a blockade to p21 induction suppresses senescence, were confirmed in HCT-116 cells as shown in Supplemental Fig. 3A.
Fig. 4.
Down-regulation of p21 attenuates ADR-induced autophagy. MCF-7 cells were stably infected with either shRNA against a scramble control (shCON) or shRNA against p21 (shp21). Cell lines were treated with 1 μM ADR for 2 h, which was then replaced with complete medium. A, immunoblot analyses of lysates from shCON and shp21 cells treated with or without ADR for 72 h. B, cells were stained with β-galactosidase, and images were taken 72 h after ADR treatment (left) and quantified for C12FDG-fluorescin fluorescence by FACS analysis (right). *, p < 0.05 compared with shCON + ADR. C, top, acridine orange images were taken at 72 h after ADR treatment. Bottom, cells with AVO formation were monitored by FACS analysis 72 h after treatment. *, p < 0.003 compared with shCON + ADR.
With regard to autophagy, shp21 MCF-7 cells demonstrated a significant decrease in autophagy as indicated by the reduced acridine orange staining shown in Fig. 4C, top. In addition, FACS analysis demonstrated an approximately 50% decrease in the extent of autophagy in the shp21 MCF-7 cells in comparison with shControl cells (Fig. 4C, bottom). Similar results were generated in the p21(−/−) HCT-116 colon cancer cells (Supplemental Fig. 3B).
In addition to p21, p53 is a central element in promoting the senescent phenotype (Gewirtz et al., 2008). Our previous studies have demonstrated that in either breast cancer cells where p53 is inactivated by the E6 protein or in which p53 is mutated ADR-induced senescence was essentially abrogated in the bulk of the tumor population in favor of apoptotic cell death (Elmore et al., 2002). Furthermore, as demonstrated above, induction of p21 downstream of p53 is a fundamental requirement for ADR to induce senescence. We therefore evaluated whether interference with senescence by knockdown of p53 affects ADR-induced autophagy. Supplemental Fig. 3C, top confirms that, as would be expected, silencing of p53 significantly blocked senescence in response to ADR in MCF-7/E6 cells. Moreover, MCF-7/E6 cells demonstrated a dramatically attenuated ADR-induced autophagy (Supplemental Fig. 3C, bottom). These observations were confirmed by experiments in the p53 knockout or p21 knockout HCT-116 colon cancer cells (Supplemental Fig. 3, A and B), where collateral attenuation of ADR-induced senescence and autophagy was evident.
Influence of Autophagic Inhibitors on Adriamycin-Induced Senescence.
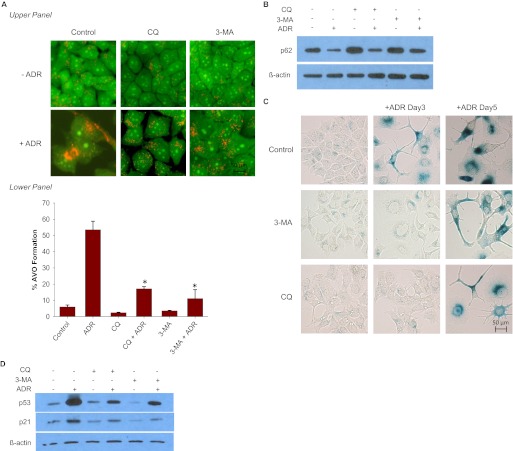
The studies presented to this point suggested the existence of a close relationship between autophagy and senescence; this is likely to be the consequence of the association of autophagy and senescence with common signaling pathways that involve reactive oxygen generation, ATM phosphorylation, and the induction of p53 and p21. To further interrogate the possible linkage between autophagy and senescence, we evaluated whether suppression of autophagy using both pharmacological and genetic inhibition would interfere with ADR-induced senescence. Figure 5A demonstrates the impact of inhibition of autophagy by 3-MA, a phosphatidylinositol 3-kinase/Akt inhibitor or CQ, a late-stage autophagic inhibitor that blocks the fusion of autophagosomes and lysosomes (Petiot et al., 2000; Carew et al., 2010). The addition of either CQ or 3-MA reduced the extent of AVO accumulation in the cytoplasm of MCF-7 cells exposed to ADR (Fig. 5A). Figure 5A, bottom presents FACS analysis indicating that ADR treatment increased the intensity of red fluorescence from 5.1 to 52%, whereas the addition of either 3-MA or CQ decreased the intensity of red fluorescence to approximately 9 and 16% in ADR-treated cells, respectively. Finally, we assessed the combination effects of 3-MA and CQ with ADR on p62 expression levels. ADR treatment alone significantly reduced p62 levels (Fig. 5B), as in Fig. 3E. However, both 3-MA and chloroquine attenuated the capacity of ADR to promote autophagy flux (suppression of p62). These experimental strategies resulted in transient effects on senescence, with attenuation of β-galactosidase staining at day 3, but where the extent of senescence was essentially equivalent to that in the cells exposed to ADR alone by day 5 (Fig. 5C). Immunoblotting analyses showed that both 3-MA and CQ treatment produced a reduction in p53 and p21 levels 72 h after ADR treatment (Fig. 5D), which could account, in part, for the delayed senescence response.
Fig. 5.
Impact of autophagic inhibitors on ADR-induced senescence. MCF-7 cells were pretreated with 5 mM 3-MA or 5 μM chloroquine for 1 h followed by 1 μM ADR for 2 h. ADR was removed, and fresh media were restored with or without 3-MA or chloroquine. A, top, acridine orange images were taken at 72 h after ADR treatment. Bottom, cells with AVO formation were monitored by FACS analysis 72 h after treatment. *, p < 0.001 compared with ADR. B, immunoblot analysis of p62 and β-actin. C, cells were stained with β-galactosidase, and images were taken at the indicated times after ADR treatment. D, immunoblot analysis of p21, p53, and β-actin.
In addition, because inhibition of drug or radiation-induced autophagy often has been shown to sensitize tumor cells through the promotion of apoptosis (Amaravardi et al., 2007; Xi et al., 2011; Notte et al., 2011), we examined the impact of these experimental strategies on apoptosis, to eliminate the trivial explanation that the basis for the collateral suppression of autophagy and senescence was that the cells were simply dying. However, minimal apoptosis or cell death occurred with ADR treatment in combination with the autophagy inhibitors CQ or 3-MA (data not shown).
Silencing of ATG5 or ATG7 Delayed but Failed to Block Senescence.
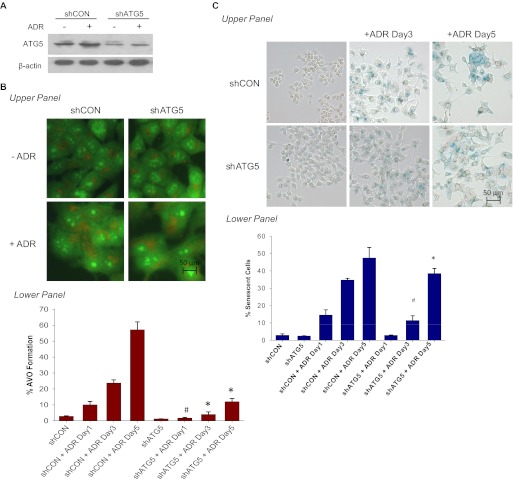
The studies presented in Fig. 5 suggest that interfering with autophagy may delay senescence but that senescence can occur independently of autophagy. Because of the likelihood of off-target effects of the pharmacological inhibitor, we next silenced the essential autophagic protein ATG5 in MCF-7 cells by using shRNA. Stable down-regulation of shATG5 in MCF-7 cells resulted in an approximately 70% knockdown of ATG5; furthermore, ADR treatment was incapable of inducing ATG5 (Fig. 6A). As would be expected, a significant reduction of punctated acridine orange staining was observed in ATG5 knockdown cells exposed to ADR (Fig. 6B). This was accompanied by decreased senescence staining in MCF-7 shATG5 cells on days 3 and 5 after ADR treatment (Fig. 6C). Quantification of senescence by FACS analysis in Fig. 6C, bottom confirmed the visual observations presented in Fig. 6C, top. However, as with pharmacological inhibition of autophagy, senescence was delayed but not abrogated (comparing the extent of senescence at day 5 in the shATG5 cells with that on day 3 in the shControl cells) despite the fact that autophagy remained essentially suppressed (compare Fig. 6C, bottom with Fig. 6B, bottom).
Fig. 6.
Genetic silencing of ATG5 temporarily delayed ADR-induced senescence. MCF-7 cells were stably infected with either shRNA against a scramble control (shCON) or shRNA against ATG5 (shATG5). Cell lines were treated with 1 μM ADR for 2 h, which was then replaced with complete medium. A, immunoblot analyses of lysates from shCON and shATG5 cells treated with or without ADR for 72 h for ATG5 and β-actin. B, acridine orange staining visualized by fluorescence microscopy (top) and quantified by FACS analysis (bottom). *, p < 0.001 compared with shCON + ADR day 3 and shCON + ADR day 5; #, p < 0.05 compared with ADR day 1. C, β-galactosidase staining (top) and flow cytometric detection of SA-β-gal activity as measured by C12FDG-fluorescin fluorescence (bottom). #, p < 0.05 compared with shATG5; *, p < 0.001 compared with shATG5.
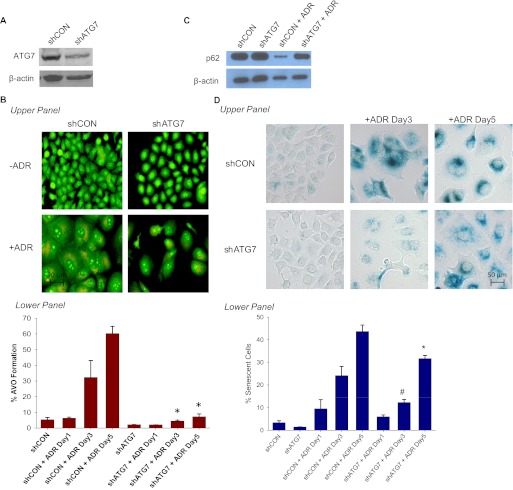
To further corroborate the above results, we used the MCF-7 shATG7 cells as an alternative knockdown model (Fig. 7A). Figure 7B, top shows a significant reduction of orange red puncta formation in the cytoplasm of ATG7-silenced cells, which was confirmed by FACS analysis (Fig. 7B, bottom). Figure 7C confirms that silencing of ATG7 interfered with the capacity of ADR to induce depletion of p62. However, as with the studies using ATG5 knockdown cells, inhibition of ATG7 activity delayed but did not abrogate ADR-induced senescence (Fig. 7D). That is, by day 5, the extent of senescence in the shATG7 cells was similar to that in the shControl cells at day 3 (Fig. 7D, top) and FACS analysis (Fig. 7D, bottom).
Fig. 7.
Genetic silencing of ATG7 temporarily delayed ADR-induced senescence. MCF-7 cells were stably infected with either shRNA against a scramble control (shCON) or shRNA against ATG7 (shATG7). Cell lines were treated with 1 μM ADR for 2 h, which was then replaced with complete medium. A, immunoblot analyses of lysates from shCON and shATG7 cells treated with or without ADR for 72 h for ATG7 and β-actin. B, acridine orange staining visualized by fluorescence microscopy (top) and quantified by FACS analysis (bottom). *, p < 0.001 compared with shCON + ADR day 3 and shCON + ADR day 5. C, immunoblot analyses of lysates from shCON and shATG7 cells treated with or without ADR for 72 h for p62 and β-actin. D, β-galactosidase staining (top) and flow cytometric detection of SA-β-gal activity as measured by C12FDG-fluorescin fluorescence (bottom). #, p < 0.05 compared with shATG7; *, p < 0.001 compared with shATG7. E, immunoblot analysis of p21 and β-actin.
Suppression of Autophagy Delayed Senescence in CPT-Treated MCF-7 Cells.
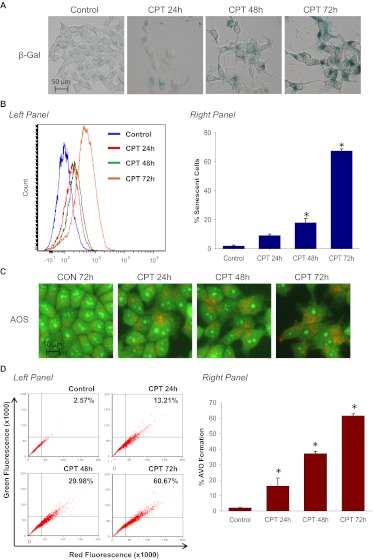
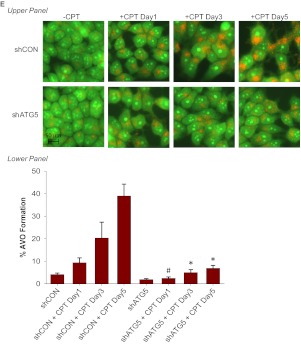
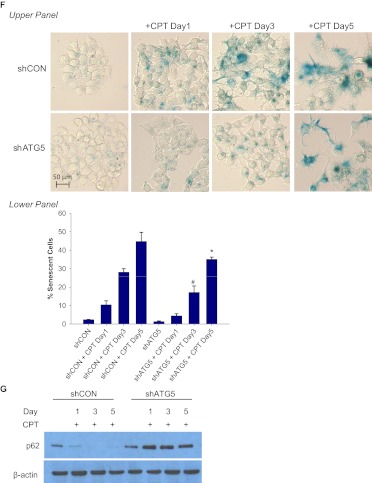
To further confirm the conclusion that suppression of autophagy only delays but does not abrogate senescence, we used the DNA topoisomerase I poison CPT. Both the promotion of senescence based on β-galactosidase staining and FACS analysis (Fig. 8, A and B) and the induction of autophagy (Fig. 8, C and D) increased in parallel in a time-dependent fashion. Treatment of MCF-7/shATG5 cells with CPT did not significantly induce autophagy (Fig. 8E) but only delayed senescence (Fig. 8F), whereas senescence at day 5 was only slightly below that observed in the corresponding shControl cells. These results indicate, that although autophagy can contribute to the establishment of senescence, autophagy is not an absolute requirement because the senescence response is only delayed. The data in Fig. 8G confirm that silencing of ATG5 interferes with the capacity of camptothecin to promote autophagic flux based on p62 degradation (comparing the shATG5 and shControl cells).
Fig. 8.
Silencing autophagy temporarily delayed CPT-induced senescence. MCF-7 cells were treated with 5 μM CPT for 2 h followed by drug removal and replacement with fresh medium. A, β-galactosidase staining. B, left, representative histograms of positive C12FDG fluorescent cells for each treatment. Right, flow cytometric detection of SA-β-gal activity as measured by C12FDG-fluorescin fluorescence. *, p < 0.001 compared with control. C, cells were stained with acridine orange and imaged by fluorescence microscopy. D, left, representative dot plots of positive acridine orange staining for each treatment. Right, cells were quantified for AVO formation produced by CPT treatment by FACS analysis. *, p < 0.001 compared with control. E, acridine orange staining of CPT-treated MCF-7 cells at the indicated time points (top) and quantification of AVO formation by FACS analysis (bottom). *, p < 0.001 compared with shCON + CPT day 3 and shCON + CPT day 5; #, p < 0.05 compared with shCON + CPT day 1. F, β-galactosidase staining of CPT-treated MCF-7 cells at the indicated time points (top) and quantification of C12FDG-fluorescin fluorescence by FACS analysis (bottom). #, p < 0.05 compared with shATG5; *, p < 0.001 compared with shATG5. G, immunoblot analysis of p62 and β-actin.
The delay but not abrogation of senescence in MCF-7 cells in which autophagy was suppressed was confirmed in additional studies using camptothecin with pharmacological inhibitors in MCF-7 cells. Supplemental Fig. 4A shows that camptothecin induced an autophagic response characterized by increased red punctate staining in MCF-7 RFP-LC3 cells. A delayed senescence response was observed when autophagy induced by camptothecin was blocked by CQ or bafilomycin A1 (Supplemental Fig. 4B).
Discussion
We and others have demonstrated that treatment of tumor cells with Adriamycin preferentially induces senescence rather than apoptotic cell death (Chang et al., 1999; Elmore et al., 2002; Su et al., 2009). In addition, previous studies in thyroid cancer and hepatoma cells have demonstrated that Adriamycin can induce autophagy (Lin et al., 2009; Qian and Yang, 2009). Although senescence and autophagy are generally considered to be two distinct cellular events in response to genotoxic stress, there has been accumulating evidence that the two are functionally intertwined (Gerland et al., 2003; Patschan et al., 2008; Gosselin et al., 2009; Jinno-Oue at al., 2010). Specifically, Young et al. (2009) reported that autophagy was considered an effector mechanism of senescence and contributed to the establishment of oncogene-induced senescence in both cultured cells and in vivo. Moreover, Sasaki et al. (2010) demonstrated that autophagy mediates the process of cellular senescence characterizing bile duct damages in primary biliary cirrhosis. Our studies were designed to determine whether autophagy and senescence were collaterally influenced and interdependent responses to chemotherapy.
One incentive for examining the premise of a linkage between autophagy and senescence was our findings linking Adriamycin-induced senescence with reactive oxygen generation (Di et al., 2009). Our studies found that both GSH and NAC markedly suppressed the senescence response to Adriamycin in both p53 wild-type and p53-deficient cells (Di et al., 2009). These observations are consistent with studies in the literature indicating that a rise in ROS level accelerates the onset of the senescence phenotype (Kurz et al., 2004; Lu et al., 2008); that is, ROS may function as messenger molecules activating specific redox-dependent targets that induce senescence (Colavitti and Finkel, 2005). Our current work demonstrates that Adriamycin induced a time-dependent increase of ROS, which is highly consistent with previous similar findings (Song et al., 2005). Furthermore, the antioxidants NAC and GSH prevented ADR-induced up-regulation of p53 and p21 and down-regulation of Rb, all of which are associated with senescence. However, we cannot fully rule out the possibility that these agents provide protection against additional modes of drug action. Kurz et al. (2004) demonstrated that NAC could attenuate ADR-induced phosphorylation and activation of γ-H2AX, Chk1, and Chk2 in breast cancer cells, all of which were mediators of DNA damage response pathway, suggesting actions of this compound that were perhaps not directly related to the suppression of ROS generation.
With regard to autophagy, it has been shown that autophagy is often mediated by ROS and many stresses that induce ROS generation also induce autophagy (Azad et al., 2009; Karna et al., 2010). Camptothecin has also been reported to significantly induce ROS generation in MCF-7 cells (Somasundaram et al., 2002; Akbas et al., 2005). More recently, Luo et al. (2011) found that autophagy regulates ROS-induced cellular senescence via p21 in a p38 mitogen-activated protein kinase α-dependent manner. Specifically, Luo et al. demonstrated that ATG5 small interfering RNA inhibited not only autophagy but also senescence induced by H2O2 primarily by blocking the up-regulation of the expression of p21. In the current work, the antioxidants GSH and NAC significantly inhibited ADR-induced senescence and autophagy. In addition, we found that GSH and NAC suppressed the Adriamycin-induced increase in p53 and p21. These observations suggest that ROS may play a central role in mediating both ADR-induced senescence and autophagy responses. However, ROS could collaterally influence both senescence and autophagy through the DNA damage response pathway, and therefore these experiments do not prove that senescence and autophagy are necessarily linked pathways.
It has been suggested that senescence is essentially a DNA damage response (d'Adda di Fagagna 2008), which would be consistent with data implicating ATM, p53, p21, and Rb in mediating senescence (Gewirtz et al., 2008). As an upstream regulator of p53 and primary mediator of the DNA damage response pathway, ATM has been closely associated with the senescence response (Mallette et al., 2007; Crescenzi et al., 2008; Zhan et al., 2010). Silencing of ATM effectively resulted in evasion of senescence in response to constitutive activation of certain mitogenic genes in human fibroblasts (Mallette et al., 2007). Abolition of ATM or other DNA damage pathway-related genes abrogated oncogene-induced senescence in normal fibroblasts (Di Micco et al., 2006). A similar study by Zhan et al. (2010) showed that blocking ATM activity prevented hydrogen peroxide induced senescence in vascular endothelial cells (Zhan et al., 2010). Here, we show that pharmacological inhibitors of ATM or shATM efficiently inhibit ADR-induced senescence.
Studies have also suggested a possible linkage between ATM and autophagy. For example, Bandhakavi et al. (2010) found that the inhibition of mammalian target of rapamycin (which otherwise blocks autophagy) also leads to the up-regulation of ATM phosphorylation and substrates (Bandhakavi et al., 2010). Here, we found that inhibition of ATM by means of pharmacological inhibitors or shRNA reduced ADR- and CPT-induced autophagy. These results confirm a critical role of ATM as a mediator of both senescence and autophagy in response to DNA damaging agents.
The collateral effects of blocking ATM and ROS generation on senescence and autophagy may simply indicate that ROS and ATM signal to both pathways in the cells. Because the induction of cellular senescence and autophagy in MCF-7 by CPT and ADR was associated with an increased expression of p53 and p21, we investigated the senescent and autophagic responses to Adriamycin in cells where p53 or p21 function had been attenuated. Our findings demonstrate that p53 null cells treated with Adriamycin have a significant reduction in both the senescence and autophagic responses. Likewise, in MCF-7 cells exhibiting reduced p21 levels, both ADR-induced autophagy and ADR-induced senescence are significantly attenuated. Again, although these studies suggest the existence of a close relationship between autophagy and senescence, these data may simply reflect the possibility of similar signaling pathways (reactive oxygen induction, ATM, p53, and p21) influencing both pathways independently. A schematic cartoon depicting the regulatory pathway induced by either Adriamycin or camptothecin leading to senescence, as elucidated by our work, is shown in Supplemental Fig. 5.
To more rigorously assess the potential requirement of autophagy for senescence, we used ATG5 and ATG7 shRNA stable cell lines. ATG5 and ATG7 autophagic-related genes have been demonstrated to be essential for the autophagic process (Kuma et al., 2002; Komatsu et al., 2005). We found that ADR-treated shATG5 and shATG7 cells showed a substantial delay in the promotion of senescence in comparison with shControl cells, but a blockade to autophagy does not abrogate the capacity of the cells to senescence. Nevertheless, these data suggest that autophagy contributes to the establishment of senescence arrest and are in agreement with a report from Young et al. (2009). Those investigators reported that attenuating autophagy in ER:Ras IMR90 cells by shRNA against ATG5 and ATG7 caused SA-β-gal activity to be delayed, but clearly senescence can occur even when autophagy is suppressed.
In conclusion, the treatment of MCF-7 cells with either Adriamycin or camptothecin induced both autophagy and senescence. Interference with ROS generation, ATM activation, and induction of p53 or p21 suppressed both autophagy and senescence. However, these observations may indicate only that both responses are mediated by common DNA damage-induced signaling pathways (that are also associated with conventional growth arrest). When autophagy was blocked either pharmacologically or genetically, senescence was temporally delayed, but the overall extent of senescence induced by Adriamycin and camptothecin was not attenuated. Consequently, although autophagy seems to accelerate and facilitate the senescence process, possibly by providing an additional source of energy to allow the cells to enter a prolonged dormant-like state, it is clear that senescence can occur independently of autophagy. It is furthermore increasingly becoming recognized that both autophagy and senescence are likely to play central roles in signaling to the immune system the presence of tumor cells that require elimination (Ewald et al., 2010; Michaud et al., 2011). Consequently, the autophagy and senescence responses to chemotherapy are likely to have substantive involvement in mediating the complete elimination of tumors in response to chemotherapy.
Supplementary Material
Acknowledgments
Electron microscopy was performed at the Virginia Commonwealth University Department of Anatomy and Neurobiology Microscopy Facility, which is supported, in part, by the National Institutes of Health, National Institute of Neurological Disorders and Stroke [Grant 5P30NS047463]. Quantification of β-galactosidase and acridine orange staining were conducted at the Virginia Commonwealth University Flow Cytometry and Imaging Shared Resource Facility. The RFP-LC3 vector was generously provided by Dr. Keith Miskimins (University of South Dakota, Vermillion, SD) and was originally developed at the laboratory of Dr. A. M. Tolkovsky (University of Cambridge, Cambridge, UK). The MCF7/ATG7−/− cells were a generous gift from the laboratory of Dr. Ameeta Kelekar (University of Minnesota, Minneapolis, MN). We thank Sarah Golding and Amy Hawkins (Department of Radiation Oncology. Virginia Commonwealth University) for guidance with the studies relating to ATM signaling and silencing.
The Virginia Commonwealth University Flow Cytometry and Imaging Shared Resource Facility is supported in part by the National Institutes of Health National Cancer Institute [Grant P30CA16059]. R.W.G. was supported by the National Institutes of Health National Cancer Institute [Grant T32 CA113277-04]. KV was supported in part by the National Institutes of Health [Grants R01-NS064593, R21-CA156995].
Article, publication date, and citation information can be found at http://jpet.aspetjournals.org.
 The online version of this article (available at http://jpet.aspetjournals.org) contains supplemental material.
- SA-β-gal
- senescence-associated β-galactosidase
- ADR
- Adriamycin
- AOS
- acridine orange staining
- ATM
- ataxia telangiectasia mutated
- AVO
- acidic vesicular organelle
- CPT
- camptothecin
- CQ
- chloroquine
- DCF
- 2′,7′-dichlorofluorescin
- FACS
- fluorescence-activated cell sorting
- GSH
- glutathione
- KU-55933
- 2-morpholin-4-yl-6-thianthren-1-yl-pyran-4-one
- 3-MA
- 3-methyl-adenine
- NAC
- N-acetyl cysteine
- PBS
- phosphate-buffered saline
- pRb
- retinoblastoma protein
- Rb
- retinoblastoma
- ROS
- reactive oxygen species
- shControl
- shRNA against a scramble control
- shRNA
- short-haired RNA
- shATM
- shRNA against ATM
- shp21
- shRNA against p21
- shATG
- shRNA against ATG.
Authorship Contributions
Participated in research design: Goehe, Di, Valerie, and Gewirtz.
Conducted experiments: Goehe, Di, Sharma, Bristol, and Henderson.
Contributed new reagents or analytic tools: Rodier and Davalos.
Performed data analysis: Goehe, Di, Henderson, and Gewirtz.
Wrote or contributed to the writing of the manuscript: Goehe, Di, and Gewirtz.
References
- Akbas SH, Timur M, Ozben T. (2005) The effect of quercetin on topotecan cytotoxicity in MCF-7 and MDA-MB 231 human breast cancer cells. J Surg Res 125:49–55 [DOI] [PubMed] [Google Scholar]
- Alexander A, Kim J, Walker CL. (2010) ATM engages the TSC2/mTORC1 signaling node to regulate autophagy. Autophagy 6:672–673 [DOI] [PMC free article] [PubMed] [Google Scholar]
- Amaravadi RK, Yu D, Lum JJ, Bui T, Christophorou MA, Evan GI, Thomas-Tikhonenko A, Thompson CB. (2007) Autophagy inhibition enhances therapy-induced apoptosis in a Myc-induced model of lymphoma. J Clin Invest 117:326–336 [DOI] [PMC free article] [PubMed] [Google Scholar]
- Azad MB, Chen Y, Gibson SB. (2009) Regulation of autophagy by reactive oxygen species (ROS): implications for cancer progression and treatment. Antioxid Redox Signal 11:777–790 [DOI] [PubMed] [Google Scholar]
- Bandhakavi S, Kim YM, Ro SH, Xie H, Onsongo G, Jun CB, Kim DH, Griffin TJ. (2010) Quantitative nuclear proteomics identifies mTOR regulation of DNA damage response. Mol Cell Proteomics 9:403–414 [DOI] [PMC free article] [PubMed] [Google Scholar]
- Banin S, Moyal L, Shieh S, Taya Y, Anderson CW, Chessa L, Smorodinsky NI, Prives C, Reiss Y, Shiloh Y, et al. (1998) Enhanced phosphorylation of p53 by ATM in response to DNA damage. Science 281:1674–1677 [DOI] [PubMed] [Google Scholar]
- Burma S, Chen BP, Murphy M, Kurimasa A, Chen DJ. (2001) ATM phosphorylates histone H2AX in response to DNA double-strand breaks. J Biol Chem 276:42462–42467 [DOI] [PubMed] [Google Scholar]
- Campisi J, d'Adda di Fagagna F. (2007) Cellular senescence: when bad things happen to good cells. Nat Rev Mol Cell Biol 8:729–740 [DOI] [PubMed] [Google Scholar]
- Carew JS, Medina EC, Esquivel JA, 2nd, Mahalingam D, Swords R, Kelly K, Zhang H, Huang P, Mita AC, Mita MM, et al. (2010) Autophagy inhibition enhances vorinostat-induced apoptosis via ubiquitinated protein accumulation. J Cell Mol Med 14:2448–2459 [DOI] [PMC free article] [PubMed] [Google Scholar]
- Chang BD, Xuan Y, Broude EV, Zhu H, Schott B, Fang J, Roninson IB. (1999) Role of p53 and p21waf1/cip1 in senescence-like terminal proliferation arrest induced in human tumor cells by chemotherapeutic drugs. Oncogene 18:4808–4818 [DOI] [PubMed] [Google Scholar]
- Colavitti R, Finkel T. (2005) Reactive oxygen species as mediators of cellular senescence. IUBMB Life 57:277–281 [DOI] [PubMed] [Google Scholar]
- Crescenzi E, Palumbo G, de Boer J, Brady HJ. (2008) Ataxia telangiectasia mutated and p21CIP1 modulate cell survival of drug-induced senescent tumor cells: implications for chemotherapy. Clin Cancer Res 14:1877–1887 [DOI] [PubMed] [Google Scholar]
- d'Adda di Fagagna F. (2008) Living on a break: cellular senescence as a DNA-damage response. Nat Rev Cancer 8:512–522 [DOI] [PubMed] [Google Scholar]
- Debacq-Chainiaux F, Erusalimsky JD, Campisi J, Toussaint O. (2009) Protocols to detect senescence-associated β-galactosidase (SA-βgal) activity, a biomarker of senescent cells in culture and in vivo. Nat Protoc 4:1798–1806 [DOI] [PubMed] [Google Scholar]
- Di X, Shiu RP, Newsham IF, Gewirtz DA. (2009) Apoptosis, autophagy, accelerated senescence and reactive oxygen in the response of human breast tumor cells to adriamycin. Biochem Pharmacol 77:1139–1150 [DOI] [PubMed] [Google Scholar]
- Di Micco R, Fumagalli M, Cicalese A, Piccinin S, Gasparini P, Luise C, Schurra C, Garre' M, Nuciforo PG, Bensimon A, et al. (2006) Oncogene-induced senescence is a DNA damage response triggered by DNA hyper-replication. Nature 444:638–642 [DOI] [PubMed] [Google Scholar]
- Elmore LW, Rehder CW, Di X, McChesney PA, Jackson-Cook CK, Gewirtz DA, Holt SE. (2002) Adriamycin-induced senescence in breast tumor cells involves functional p53 and telomere dysfunction. J Biol Chem 277:35509–35515 [DOI] [PubMed] [Google Scholar]
- Evan GI, d'Adda di Fagagna F. (2009) Cellular senescence: hot or what? Curr Opin Genet Dev 19:25–31 [DOI] [PubMed] [Google Scholar]
- Ewald JA, Desotelle JA, Wilding G, Jarrard DF. (2010) Therapy-induced senescence in cancer. J Natl Cancer Inst 102:1536–1546 [DOI] [PMC free article] [PubMed] [Google Scholar]
- Gerland LM, Peyrol S, Lallemand C, Branche R, Magaud JP, Ffrench M. (2003) Association of increased autophagic inclusions labeled for β-galactosidase with fibroblastic aging. Exp Gerontol 38:887–895 [DOI] [PubMed] [Google Scholar]
- Gewirtz DA. (2009) Autophagy, senescence and tumor dormancy in cancer therapy. Autophagy 5:1232–1234 [DOI] [PubMed] [Google Scholar]
- Gewirtz DA, Hilliker ML, Wilson EN. (2009) Promotion of autophagy as a mechanism for radiation sensitization of breast tumor cells. Radiother Oncol 92:323–328 [DOI] [PubMed] [Google Scholar]
- Gewirtz DA, Holt SE, Elmore LW. (2008) Accelerated senescence: an emerging role in tumor cell response to chemotherapy and radiation. Biochem Pharmacol 76:947–957 [DOI] [PubMed] [Google Scholar]
- Glick D, Barth S, Macleod KF. (2010) Autophagy: cellular and molecular mechanisms. J Pathol 221:3–12 [DOI] [PMC free article] [PubMed] [Google Scholar]
- Gosselin K, Deruy E, Martien S, Vercamer C, Bouali F, Dujardin T, Slomianny C, Houel-Renault L, Chelli F, De Launoit Y, et al. (2009) Senescent keratinocytes die by autophagic programmed cell death. Am J Pathol 174:423–435 [DOI] [PMC free article] [PubMed] [Google Scholar]
- Hickson I, Zhao Y, Richardson CJ, Green SJ, Martin NM, Orr AI, Reaper PM, Jackson SP, Curtin NJ, Smith GC. (2004) Identification and characterization of a novel and specific inhibitor of the ataxia-telangiectasia mutated kinase ATM. Cancer Res 64:9152–9159 [DOI] [PubMed] [Google Scholar]
- Jinno-Oue A, Shimizu N, Hamada N, Wada S, Tanaka A, Shinagawa M, Ohtsuki T, Mori T, Saha MN, Hoque AS, et al. (2010) Irradiation with carbon ion beams induces apoptosis, autophagy, and cellular senescence in a human glioma-derived cell line. Int J Radiat Oncol Biol Phys 76:229–241 [DOI] [PubMed] [Google Scholar]
- Karna P, Zughaier S, Pannu V, Simmons R, Narayan S, Aneja R. (2010) Induction of reactive oxygen species-mediated autophagy by a novel microtubule-modulating agent. J Biol Chem 285:18737–18748 [DOI] [PMC free article] [PubMed] [Google Scholar]
- Kroemer G, Levine B. (2008) Autophagic cell death: the story of a misnomer. Nat Rev Mol Cell Biol 9:1004–10010 [DOI] [PMC free article] [PubMed] [Google Scholar]
- Komatsu M, Waguri S, Ueno T, Iwata J, Murata S, Tanida I, Ezaki J, Mizushima N, Ohsumi Y, Uchiyama Y, et al. (2005) Impairment of starvation-induced and constitutive autophagy in Atg7-deficient mice. J Cell Biol 169:425–434 [DOI] [PMC free article] [PubMed] [Google Scholar]
- Kuilman T, Michaloglou C, Mooi WJ, Peeper DS. (2010) The essence of senescence. Genes Dev 24:2463–2479 [DOI] [PMC free article] [PubMed] [Google Scholar]
- Kuma A, Mizushima N, Ishihara N, Ohsumi Y. (2002) Formation of the approximately 350-kDa Apg12-Apg5.Apg16 multimeric complex, mediated by Apg16 oligomerization, is essential for autophagy in yeast. J Biol Chem 277:18619–18625 [DOI] [PubMed] [Google Scholar]
- Kurz EU, Douglas P, Lees-Miller SP. (2004) Doxorubicin activates ATM-dependent phosphorylation of multiple downstream targets in part through the generation of reactive oxygen species. J Biol Chem 279:53272–53281 [DOI] [PubMed] [Google Scholar]
- Lee AC, Fenster BE, Ito H, Takeda K, Bae NS, Hirai T, Yu ZX, Ferrans VJ, Howard BH, Finkel T. (1999) Ras proteins induce senescence by altering the intracellular levels of reactive oxygen species. J Biol Chem 274:7936–7940 [DOI] [PubMed] [Google Scholar]
- Lee H, Kwak HJ, Cho IT, Park SH, Lee CH. (2009) S1219 residue of 53BP1 is phosphorylated by ATM kinase upon DNA damage and required for proper execution of DNA damage response. Biochem Biophys Res Commun 378:32–36 [DOI] [PubMed] [Google Scholar]
- Lin CI, Whang EE, Abramson MA, Jiang X, Price BD, Donner DB, Moore FD, Jr, Ruan DT. (2009) Autophagy: a new target for advanced papillary thyroid cancer therapy. Surgery 146:1208–1214 [DOI] [PubMed] [Google Scholar]
- Lu Z, Luo RZ, Lu Y, Zhang X, Yu Q, Khare S, Kondo S, Kondo Y, Yu Y, Mills GB, et al. (2008) The tumor suppressor gene ARHI regulates autophagy and tumor dormancy in human ovarian cancer cells. J Clin Invest 118:3917–3929 [DOI] [PMC free article] [PubMed] [Google Scholar]
- Luo Y, Zou P, Zou J, Wang J, Zhou D, Liu L. (2011) Autophagy regulates ROS-induced cellular senescence via p21 in a p38 MAPKα dependent manner. Exp Gerontol 46:860–867 [DOI] [PMC free article] [PubMed] [Google Scholar]
- Macip S, Igarashi M, Fang L, Chen A, Pan ZQ, Lee SW, Aaronson SA. (2002) Inhibition of p21-mediated ROS accumulation can rescue p21-induced senescence. EMBO J 21:2180–2188 [DOI] [PMC free article] [PubMed] [Google Scholar]
- Mallette FA, Gaumont-Leclerc MF, Ferbeyre G. (2007) The DNA damage signaling pathway is a critical mediator of oncogene-induced senescence. Genes Dev 21:43–48 [DOI] [PMC free article] [PubMed] [Google Scholar]
- Michaud M, Martins I, Sukkurwala AQ, Adjemian S, Ma Y, Pellegatti P, Shen S, Kepp O, Scoazec M, Mignot G, et al. (2011) Autophagy-dependent anticancer immune responses induced by chemotherapeutic agents in mice. Science 334:1573–1577 [DOI] [PubMed] [Google Scholar]
- Mizushima N, Yoshimori T, Levine B. (2010) Methods in mammalian autophagy research. Cell 140:313–326 [DOI] [PMC free article] [PubMed] [Google Scholar]
- Notte A, Leclere L, Michiels C. (2011) Autophagy as a mediator of chemotherapy-induced cell death in cancer. Biochem Pharmacol 82:427–434 [DOI] [PubMed] [Google Scholar]
- Pankiv S, Clausen TH, Lamark T, Brech A, Bruun JA, Outzen H, Øvervatn A, Bjørkøy G, Johansen T. (2007) p62/SQSTM1 binds directly to Atg8/LC3 to facilitate degradation of ubiquitinated protein aggregates by autophagy. J Biol Chem 282:24131–24145 [DOI] [PubMed] [Google Scholar]
- Patschan S, Chen J, Polotskaia A, Mendelev N, Cheng J, Patschan D, Goligorsky MS. (2008) Lipid mediators of autophagy in stress-induced premature senescence of endothelial cells. Am J Physiol Heart Circ Physiol 294:H1119–H1129 [DOI] [PubMed] [Google Scholar]
- Petiot A, Ogier-Denis E, Blommaart EF, Meijer AJ, Codogno P. (2000) Distinct classes of phosphatidylinositol 3′-kinases are involved in signaling pathways that control macroautophagy in HT-29 cells. J Biol Chem 275:992–998 [DOI] [PubMed] [Google Scholar]
- Probin V, Wang Y, Zhou D. (2007) Busulfan-induced senescence is dependent on ROS production upstream of the MAPK pathway. Free Radic Biol Med 42:1858–18565 [DOI] [PMC free article] [PubMed] [Google Scholar]
- Qian H, Yang Y. (2009) Alterations of cellular organelles in human liver-derived hepatoma G2 cells induced by adriamycin. Anticancer Drugs 20:779–786 [DOI] [PubMed] [Google Scholar]
- Ravizza R, Gariboldi MB, Passarelli L, Monti E. (2004) Role of the p53/p21 system in the response of human colon carcinoma cells to Doxorubicin. BMC Cancer 4:92–100 [DOI] [PMC free article] [PubMed] [Google Scholar]
- Roninson IB. (2002) Oncogenic functions of tumour suppressor p21(Waf1/Cip1/Sdi1): association with cell senescence and tumour-promoting activities of stromal fibroblasts. Cancer Lett 179:1–14 [DOI] [PubMed] [Google Scholar]
- Roninson IB. (2003) Tumor cell senescence in cancer treatment. Cancer Res 63:2705–2715 [PubMed] [Google Scholar]
- Sasaki M, Miyakoshi M, Sato Y, Nakanuma Y. (2010) Autophagy mediates the process of cellular senescence characterizing bile duct damages in primary biliary cirrhosis. Lab Invest 90:835–843 [DOI] [PubMed] [Google Scholar]
- Seibenhener ML, Babu JR, Geetha T, Wong HC, Krishna NR, Wooten MW. (2004) Sequestosome 1/p62 is a polyubiquitin chain binding protein involved in ubiquitin proteasome degradation. Mol Cell Biol 24:8055–8068 [DOI] [PMC free article] [PubMed] [Google Scholar]
- Shay JW, Roninson IB. (2004) Hallmarks of senescence in carcinogenesis and cancer therapy. Oncogene 23:2919–2933 [DOI] [PubMed] [Google Scholar]
- Somasundaram S, Edmund NA, Moore DT, Small GW, Shi YY, Orlowski RZ. (2002) Dietary curcumin inhibits chemotherapy-induced apoptosis in models of human breast cancer. Cancer Res 62:3868–3875 [PubMed] [Google Scholar]
- Song YS, Lee BY, Hwang ES. (2005) Distinct ROS and biochemical profiles in cells undergoing DNA damage-induced senescence and apoptosis. Mech Ageing Dev 126:580–590 [DOI] [PubMed] [Google Scholar]
- Su D, Zhu S, Han X, Feng Y, Huang H, Ren G, Pan L, Zhang Y, Lu J, Huang B. (2009) BMP4-Smad signaling pathway mediates adriamycin-induced premature senescence in lung cancer cells. J Biol Chem 284:12153–12164 [DOI] [PMC free article] [PubMed] [Google Scholar]
- Thorburn A. (2008) Apoptosis and autophagy: regulatory connections between two supposedly different processes. Apoptosis 13:1–9 [DOI] [PMC free article] [PubMed] [Google Scholar]
- Wang H, Zhao Y, Li L, McNutt MA, Wu L, Lu S, Yu Y, Zhou W, Feng J, Chai G, et al. (2008) An ATM- and Rad3-related (ATR) signaling pathway and a phosphorylation-acetylation cascade are involved in activation of p53/p21Waf1/Cip1 in response to 5-aza-2′-deoxycytidine treatment. J Biol Chem 283:2564–2574 [DOI] [PubMed] [Google Scholar]
- Xi G, Hu X, Wu B, Jiang H, Young CY, Pang Y, Yuan H. (2011) Autophagy inhibition promotes paclitaxel-induced apoptosis in cancer cells. Cancer Lett 307:141–148 [DOI] [PubMed] [Google Scholar]
- Young AR, Narita M, Ferreira M, Kirschner K, Sadaie M, Darot JF, Tavaré S, Arakawa S, Shimizu S, Watt FM, et al. (2009) Autophagy mediates the mitotic senescence transition. Genes Dev 23:798–803 [DOI] [PMC free article] [PubMed] [Google Scholar]
- Zhan H, Suzuki T, Aizawa K, Miyagawa K, Nagai R. (2010) Ataxia telangiectasia mutated (ATM)-mediated DNA damage response in oxidative stress-induced vascular endothelial cell senescence. J Biol Chem 285:29662–29670 [DOI] [PMC free article] [PubMed] [Google Scholar]
Associated Data
This section collects any data citations, data availability statements, or supplementary materials included in this article.


