Abstract
Purpose
We present three methods of performing pattern recognition on spatiotemporal plots produced by pharyngeal high-resolution manometry (HRM).
Method
Classification models, including the artificial neural networks (ANNs) multilayer perceptron (MLP) and learning vector quantization (LVQ), as well as support vector machines (SVM), were evaluated for their ability to identify disordered swallowing. Data were collected from twelve normal and thirteen disordered subjects swallowing 5 ml water boluses. Following extraction of relevant parameters, a subset of the data was used to train the models and the remaining swallows were then independently classified by the networks.
Results
All methods produced high average classification accuracies, with MLP, SVM, and LVQ achieving accuracies of 96.44%, 91.03%, and 85.39% respectively. When evaluating the individual contributions of each parameter and groups of parameters to the classification accuracy, parameters pertaining to the upper esophageal sphincter were most valuable.
Conclusions
Classification models show high accuracy in segregating HRM data sets and represent one method of facilitating application of HRM to the clinical setting by eliminating the time required for some aspects of data extraction and interpretation.
Keywords: artificial neural network, classification model, pharyngeal manometry, high-resolution manometry, deglutition, dysphagia
INTRODUCTION
The pharyngeal swallow is a complex physiological event which requires muscle contraction and consequent pressure generation to move a bolus from the mouth to the esophagus (Kim et al., 1997; McConnel 1988; Cook 1991). Accurate quantification of these rapidly changing pressures requires high spatial and temporal resolution. High-resolution manometry (HRM) represents a promising clinical and research tool which is capable of capturing the detailed pressure activity during the pharyngeal swallow.
Our version of HRM (ManoScan360 High Resolution Manometry System, Sierra Scientific Instruments, Los Angeles, CA) uses 36 circumferential pressure sensors which can measure rapidly changing pressures in asymmetric structures such as the pharynx (Fox and Bredenoord, 2008). Though informative and potentially clinically valuable, it has yet to be applied routinely to the assessment of dysphagia. One reason may be difficulty extracting and interpreting the large amounts of data present in the three-dimensional spatiotemporal plot generated by HRM. An algorithm for efficient, automated interpretation of these data based on pattern recognition techniques may be valuable and facilitate increased clinical use.
Classification models, including artificial neural networks (ANNs) and support vector machines, are powerful mathematical models which can classify data into groups according to nonlinear statistical analysis (Cross et al., 1995; Baxt 1995; Santos et al., 2006). Further, ANNs can handle extremely large data sets. ANNs have been used to analyze voice and swallow events, differentiating between normal and disordered events, as well as distinguishing among different types of disorders (Cross et al., 1995; Baxt 1995; Santos et al., 2006). Acoustic analysis of pathological voice production, achieved a 93.5% success rate in the classification of unknown voice samples as normal or pathological with ANNs (Boyanov and Hadjitodorov, 1997). Recently, pattern recognition of acoustic data has been used to differentiate between patients with muscle tension dysphonia and adductor spasmodic dysphonia (Schlotthauer et al., 2010). ANNs have also been used to differentiate between normal and dysphagic subjects based on swallowing acoustics (Lazareck and Moussavi, 2004). Additionally, patients have been accurately ruled in for gastroesophageal reflux with 100% accuracy (Pace et al., 2005).
Germane to the current study, patients have been classified according to their type of esophageal dysphagia (esophageal dysmotility) based on manometric measurements with an 8 sensor Dentsleeve manometric catheter, achieving a classification accuracy of 80% (Santos et al., 2006). Though previously applied to traditional esophageal manometry, ANNs and other classification models have not been used with HRM of the pharynx. The amount of data points sampled and the potential number of variables extracted increases dramatically when moving from traditional to high-resolution manometry and from measurements in a relatively simple structure, the esophagus, to a complex structure, the pharynx. As such, HRM is well-suited to analysis by ANNs and other classification models.
As a first step in this process, we determined if pattern recognition techniques could correctly classify a swallow as normal or abnormal. We analyzed data from normal and dysphagic subjects and extracted feature vectors containing relevant parameters such as maximum pressures and timing events. Feature vectors form a training set, which is used as the input to train several types of neural networks including a multilayer perceptron, support vector machine, and self-organizing map with learning vector quantization. These networks utilize machine learning algorithms to classify swallows as normal or abnormal. Parameters were tuned to achieve a higher correct classification rate, and the components of the feature vector were examined to consider their individual contribution to classification. Thus, the purpose of this study was to determine which classification approach yielded the most accurate classification of normal versus abnormal swallowing pressure patterns, as well as to determine the relative importance of different feature sets in these classifications.
MATERIALS AND METHODS
Data collection
Equipment
A solid-state high resolution manometer was used for all data collection (ManoScan360 High Resolution Manometry System, Sierra Scientific Instruments, Los Angeles, CA). The manometric catheter has an outer diameter of 4.1 mm and 36 circumferential pressure sensors spaced 1 cm apart. Each sensor spans 2.5 mm and receives input from 12 circumferential sectors. These inputs are averaged and a mean pressure is recorded as the pressure detected by that individual sensor. The system is calibrated to record pressures between −20 and 600 mmHg with fidelity of 2 mmHg. Data were collected at a sampling rate of 50 hertz (Hz) (ManoScan Data Acquisition, Sierra Scientific Instruments). Prior to calibration, the catheter was covered with a protective sheath to preserve sterility without the need to sterilize the catheter between uses (ManoShield, Sierra Scientific Instruments). The catheter was calibrated before each participant according to manufacturer specifications.
Participants
Twenty-three subjects participated in this study with the approval of the Institutional Review Board of the University of Wisconsin-Madison. Twelve subjects were without swallowing, neurological, or gastrointestinal disorders, while thirteen had a diagnosis of a swallowing disorder. All subjects in the disordered group reported at least one symptom of dysphagia: diet change, food sticking, cough with eating, or globus sensation. Subjects also displayed abnormalities on either fiberoptic endoscopic evaluation of swallowing (FEES) or modified barium swallow study (MBSS), as determined by their medical history. Specific clinical characteristics of the disordered subjects are presented in table 1. Subjects displayed significant variation in etiology and manifestation of dysphagia. Including a diverse subject group allowed us to evaluate the robustness of our analysis and also reflects the wide range of symptoms that patients present to the otolaryngologist or speech-language pathologist. Participants were instructed not to eat for four hours and not to drink liquids for two hours prior to testing to avoid any potential confounding effect of satiety.
Table 1.
Clinical descriptions of disordered subjects.
| Subject | Age | Sex | Clinical characteristics |
|---|---|---|---|
|
| |||
| 1 | 87 | M | Cervical spine injury at C7/T1 |
| 2 | 47 | F | Oropharyngeal irritation, severe globus sensation, treated laryngopharyngeal and gastroesophageal reflux disease, slight esophageal dysmotility, high resting upper esophageal sphincter pressure |
| 3 | 72 | M | Total laryngectomy for malignant neoplasm of the larynx, dysphagia following radiotherapy |
| 4 | 64 | F | Raynaud syndrome with dysphagia, esophagitis likely secondary to reflux, possible diagnosis of scleroderma and Sjögren’s syndrome, non-specific white matter changes (per MRI) likely secondary to small vessel disease |
| 5 | 57 | M | Cricopharyngeal bar |
| 6 | 38 | F | Cricopharyngeal dysfunction |
| 7 | 77 | M | Cricopharyngeal bar, multiple instances of aspiration pneumonia, significant esophgaeal reflux |
| 8 | 74 | M | Fall and subsequent subdural hematoma, severe oropharyngeal dysphagia, percutaneous endoscopic gastrotomy tube |
| 9 | 37 | M | Total laryngectomywith bilateral neck dissections for radiation failure of recurrent laryngeal squamous cell carcinoma |
| 10 | 56 | F | Multiple brainstem strokes, severe oropharyngeal dysphagia, cricopharyngeal dysfunction, percutaneous endoscopic gastrotomy tube |
| 11 | 51 | M | Total laryngectomy and bilateral neck dissections for T4N2c squamous cell carcinoma on the right side of the larynx |
| 12 | 61 | F | Dysphagia with hypopharygneal mass (later diagnosed as carcinoma), esophageal dysmotility, gastroesophageal reflux |
| 13 | 72 | F | Left vocal fold paralysis secondary to recurrent laryngeal nerve stretch injury during a successful repair of aortic dissection |
Procedure
Topical 2% viscous lidocaine was applied to the nasal passages with a cotton swab and participants gargled a solution of 4% lidocaine (1 to 2 cc) for several seconds. The manometric catheter was lubricated with 2% viscous lidocaine to ease passage of the catheter through the pharynx. Once the catheter was positioned within the pharynx, participants rested for 5–10 minutes to adjust to the catheter prior to performing the experimental swallows.
For the normal subjects, a 5 ml water bolus was swallowed five times while the subject was upright with the head in the neutral position. Each water bolus was delivered to the oral cavity via syringe. Four random swallows from each normal subject were included in the analysis to ensure approximately equal numbers of normal and disordered swallows were inputted into the ANNs. Disordered participants swallowed 5 ml boluses between one and five times. Forty-eight swallows were analyzed for normal subjects and forty-one swallows were analyzed for disordered subjects. The number of samples per class in a pattern recognition problem should be on the order of five times the number of features worth of samples in each class (Jain and Chandrasekaran, 1982). Our classes contain roughly this number in the full featured set, and meet or exceed this in the reduced feature sets.
Data analysis
Data extraction
Pressure and timing data were extracted using a customized MATLAB program (The MathWorks, Inc., Natick, MA) which locates peak pressures in areas of interest [velopharynx, region of the tongue base/posterior pharyngeal wall, and upper esophageal sphincter (UES)] and then calculates relevant parameters based on those points (Mielens et al., 2011). The basic workflow is automated, but the user may override program suggestions in cases of misidentification and manually select the correct manometric sensors and temporal location of the areas of interest.
Regions of interest were defined manometrically as in McCulloch et al. (2010). The velopharynx is the region of swallow-related pressure change just proximal to the area of continuous nasal cavity quiescence and extending two centimeters distally. The tongue base is the area of swallow related pressure change with a high pressure zone approximately midway between the nasopharynx and UES, with its epicenter at the high pressure point and extending two centimeters proximal and distal to that point. The UES is the midpoint of stable high pressure just proximal (rostral) to the baseline low esophageal pressure zone, extending to a point of low esophageal pressure distally and low baseline pharyngeal pressure proximally. During swallowing, the UES is mobile along the catheter, moving rostrally as much as 4 cm. We account for this movement in our analysis by treating the UES as a range of sensors, and selecting the appropriate sensor for a given time when considering specific phases of the swallow.
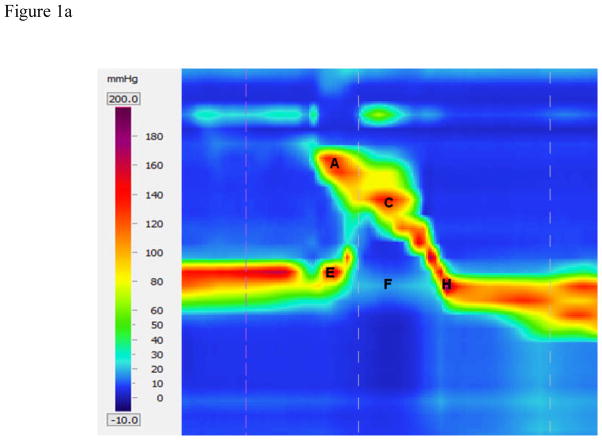
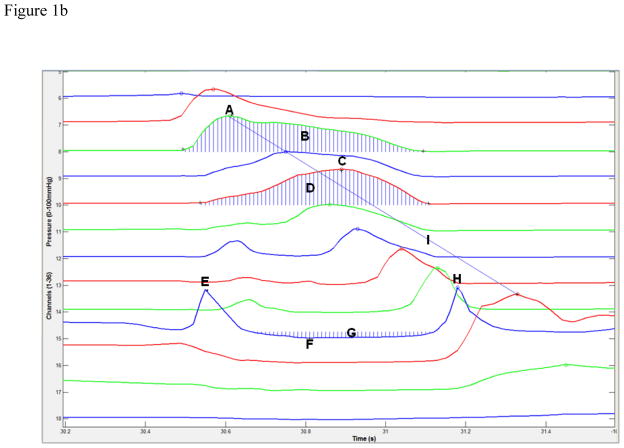
Data were extracted automatically as in Hoffman et al. (2010). An example of the automated analysis algorithm screen is shown in figures 1a and 1b. To locate the regions of interest, the program first locates the peak pressure values on each sensor channel. Once the range is determined, the program identifies which peaks best represent the velopharynx and tongue base. This determination is made on the profile of the peaks present within the range of interest. The velopharynx is detected by comparing the most proximal (rostral) peaks of the range, as the peaks increase continually until maximal velopharyngeal pressure is reached. After the sensor containing the velopharyngeal pressure max is identified, the peaks of the sensors immediately caudal to the maximum continually decrease to a local minimum. The region of the tongue base/posterior pharyngeal wall is then detected by comparing the sensors immediately below this local minimum, which increase until another local maximum is reached, the maximum tongue base pressure. The location of the UES is determined by computing the average resting pressure of each sensor and selecting the sensor with the highest value. Additional pressure maximums before the opening and after the closing of the UES are also of interest. To locate these maximums, allowing for the inherent movement of the UES during swallowing, the program considers up to three sensors immediately rostral to the detected UES sensor. For these sensors there are two peaks corresponding to the pre- and post-swallow UES pressure maximums on that channel, and the highest among the candidate peaks are chosen as the true pre- and post-swallow UES pressure maximums. Minimum UES pressure is also calculated by finding the point of minimum pressure between the detected pre- and post-swallow UES pressure maximums. We consider sensor channels immediately rostral to the UES resting position in order to account for movement of the UES during swallowing.
Figure 1.
High-resolution manometry spatiotemporal plot of one normal swallow (A) and corresponding automated extraction of salient parameters (B). A = maximum velopharyngeal pressure; B = velopharyngeal pressure integral; C = maximum tongue base pressure; D = tongue base pressure integral; E = maximum pre-swallow upper esophageal sphincter (UES) pressure; F = minimum UES pressure; G = UES pressure integral; H = maximum post-swallow UES pressure; I = pressure wave velocity.
Timing
Timing information is calculated by measuring the time elapsed between pressure maximums, as well as the onset and offset of elevated pressure on the relevant sensor channel. Parameters including durations and the rate of pressure increase are determined based on these onset and offset points. UES activity time is calculated similarly, by calculating the difference between the post-swallow UES pressure peak and the point at which the UES pressure begins to fall. Total swallow duration is defined as the time lapse between onset of velopharyngeal pressure and the post-swallow UES pressure peak.
Integrals
While maximum pressure can provide valuable information on swallowing physiology which can easily be compared to previous manometric investigations, it does not provide a complete picture of pharyngeal pressure events. Measuring the total pressure created in a specific region offers more information and, when combined with durative data, reveals more about the shape of the pressure curve and thus a better estimation on the pressure affecting bolus propulsion. Integrals are calculated for the area beneath the velopharynx and tongue base pressure curves, as well as above the UES minimum with the UES resting pressure as an upper limit. Temporal bounds in all cases are the onset and offset of pressure elevation or depression determined previously.
Pressure wave velocity
The pharyngeal swallow can be thought of as a traveling pressure wave, with peak pressure traveling caudally and ending at the UES. We can calculate the velocity of this pressure wave by taking the distance from the velopharyngeal pressure peak to the maximum post-swallow UES pressure peak and dividing by the time lapse between these two points.
Data processing
In total, 89 swallows were analyzed and the derived feature sets were used as a basis for determining models of normal and disordered swallowing. By attaching the known status of a swallow to its feature vector, machine learning techniques can be applied with the goal of modeling the relationship between the input features and the pathological status of a given swallow. These techniques share the common procedure of first being presented with the known data, going through a 'training' stage, and finally being presented with new data during a 'test' stage. The training data and testing data are kept separate in order to better gauge the generalizing ability of the classification.
Data were normalized and each variable in the data set ranged in value from −1 to 1, with a mean of 0 and a standard deviation of 1. Normalizing the data improves both the efficiency and accuracy of the algorithms, especially when using the scaled conjugate gradient algorithm in the multi-layer perceptron technique (Saarinen et al., 1993). Additionally, principal component analysis was used to reduce dimensionality to improve generalization. The feature set was subjected to two levels of reduction, which removed features that minimally contributed to overall variation. This was done because extra features which do not significantly contribute to classification can be detrimental to correct classification rates. The two levels of reduction were compared to the full, unreduced feature set.
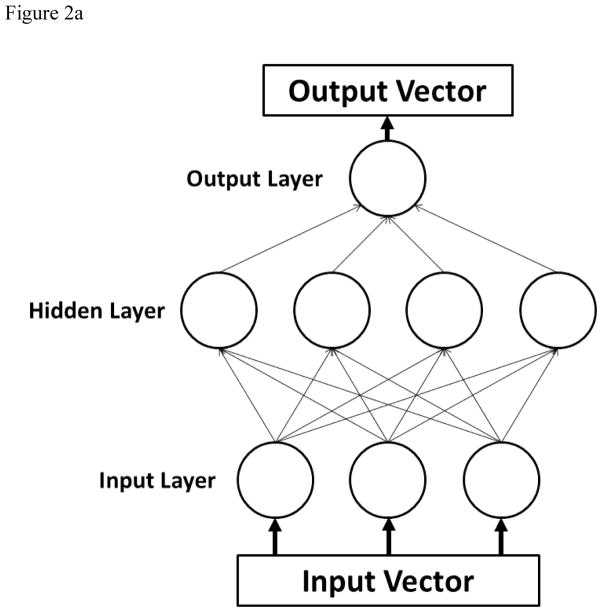
For training purposes, a five-fold cross validation was performed. As random influences may occur during the partitioning process, a more stable performance measurement was obtained by repeating each classification task twenty times and averaging over the individual results. A standard multi-layer perceptron (figure 2a) was created using sigmoidal activation functions in one hidden layer, and the number of nodes in the hidden layer was varied in increments of 5 from N=5 to N=60 to attain better performance. The Levenberg-Marquardt learning algorithm was used. The goal of the learning algorithm in this model is to modify the weights associated with the connections between the nodes (represented by lines in figure 2a) such that an input vector will produce the specified desired output vector, essentially mapping the input space onto the output classes of a normal or disordered swallow.
Figure 2.
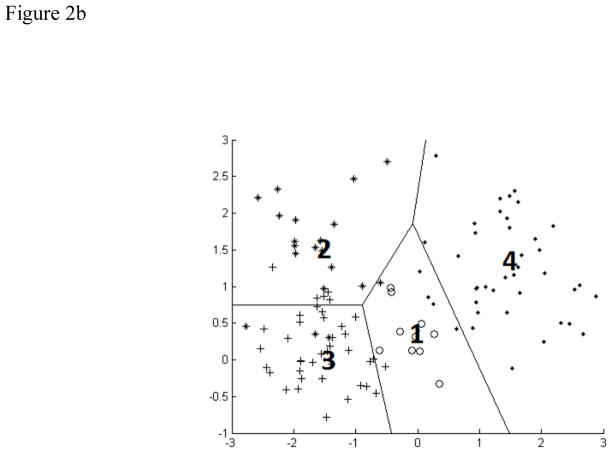
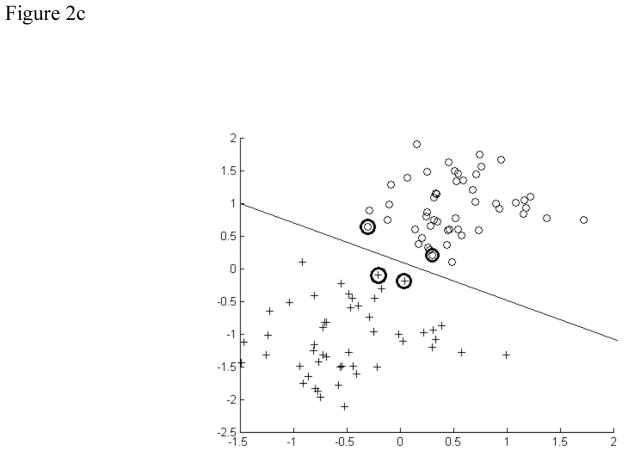
A) Schematic of a multilayer perceptron neural network. Each parameter of interest in the input vector has a corresponding node in the input layer. The hidden layer contains the nodes, the number of which was varied during the experiment. The output vectors are the possible classifications of data, which were normal and disordered in this study. B) Schematic of a learning vector quantization neural network. The four codebook vectors (1–4) represent average positions in the four possible classes of data. The regions established for these classes are outlined. In our study, there were only two classes. C) Schematic of a support vector machine neural network. Support vectors on the periphery of the data clusters (circled) help construct the hyperplane by locating the maximum margin between the classes.
The second approach used was Kohonen's learning vector quantization (figure 2b) (Kohonen 1988). Learning vector quantization is a competitive learning technique, where the goal is to move 'codebook vectors' into positions where they accurately represent the structure of the input space. Codebook vectors are hypothetical input vectors which attempt to represent the feature space by locating themselves in regions containing many swallows. Then, individual swallows can be classified by determining the codebook vector nearest to it, making learning vector quantization similar to a nearest neighbor clustering method. We modified the number of codebook vectors to reduce misclassifications. Noting that with large codebook sizes comes a high degree of overfitting and poor generalization, we kept the codebook size low enough to prevent each vector from simply associating with a particular subject. This allowed us to keep good generalization with new subjects.
The third and final approach used was support vector machines (figure 2c). Support vector machines are traditionally a linear classification technique, where a hyperplane with a maximum-margin of separation between the two classes (normal and disordered) is constructed. Classification is then a simple matter of projecting a new swallow into this feature space, and determining the side of the hyperplane to which it falls. We use a non-linear approach (Boser et al., 1992) known as the kernel trick, whereby the feature space undergoes a non-linear transformation, and the hyperplane is then fit to this higher dimensional data. In particular, we use a radial basis function with a variable gamma parameter as our kernel function, which provides the transformation from our feature space into the higher dimensional space used for classification.
Separate from the variation of models, the feature set was selectively reduced in an attempt to discover the classification ability of various subsets of the features. These subsets included the categorical elimination of pressures, integrals, timing parameters, and the three manometrically defined regions of interest. In addition to their inclusion in these subsets, all parameters were used on their own as a singular input.
Receiver operating characteristic analysis
To determine the potential of each classification model as a diagnostic tool, receiver operating characteristic (ROC) analysis was performed and area under the curve (AUC) was determined.
RESULTS
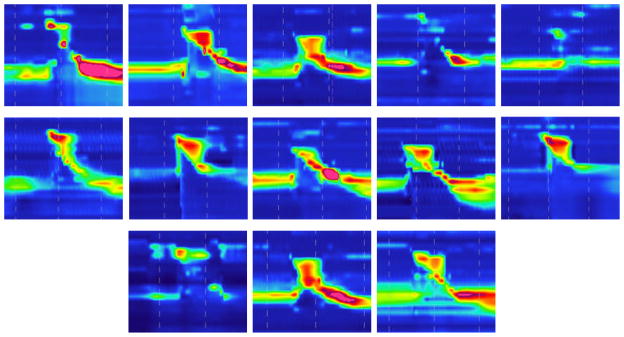
Summary data from normal and disordered subjects are presented in table 2. Sample spatiotemporal plots from each subject are provided in figure 3.
Table 2.
Summary data from normal (n=12) and disordered (n=13) subjects.
| Parameter | Normal | Disordered |
|---|---|---|
| VP max (mmHg) | 154 ± 42 | 148 ± 42 |
| VP duration (s) | 0.84 ± 0.21 | 0.79 ± 0.14 |
| VP rise rate (mmHg/s) | 880 ± 301 | 638 ± 282 |
| VP integral | 5777 ± 1837 | 6067 ± 2686 |
| VP line integral | 312 ± 77 | 309 ± 83 |
| TB max (mmHg) | 307 ± 172 | 144 ± 80 |
| TB duration (s) | 0.58 ± 0.17 | 0.59 ± 0.16 |
| TB rise rate (mmHg/s) | 1534 ± 713 | 747 ± 817 |
| TB integral | 4983 ± 2140 | 4252 ± 2093 |
| TB line integral | 491 ± 384 | 349 ± 220 |
| UES pre (mmHg) | 226 ± 115 | 84 ± 45 |
| UES post (mmHg) | 318 ± 135 | 221 ± 146 |
| UES min (mmHg) | −4 ± 7 | 2 ± 6 |
| UES duration (s) | 0.94 ± 0.18 | 0.85 ± 0.28 |
| UES integral | 11320 ± 40020 | 2913 ± 1750 |
| UES line integral | 137 ± 87 | 198 ± 107 |
| Total swallow duration (s) | 0.89 ± 0.13 | 0.95 ± 0.26 |
| Pressure velocity (cm/s) | 9.99 ± 1.85 | 10.19 ± 2.58 |
Figure 3.
Sample spatiotemporal plots representing from each of the thirteen disordered subjects. Note the wide range of abnormalities present across subjects.
ANN techniques
A multilayer perceptron using the Levenberg-Marquardt training algorithm provided the lowest average error rate (3.56% across architectures with varying numbers of hidden nodes) and also performed well with a modest number of hidden nodes (2.58% N=25, where N = number of hidden nodes). Among the learning vector quantization models, codebook size (the number of hypothesized classes) had little impact on misclassification rate (average misclassification rate of 8.97%). The support vector machine models performed the worst, with an average misclassification rate of 14.61%.
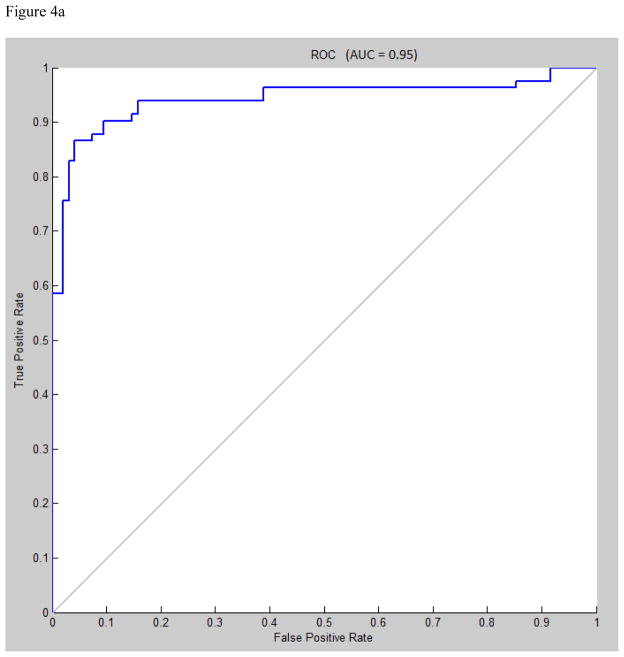
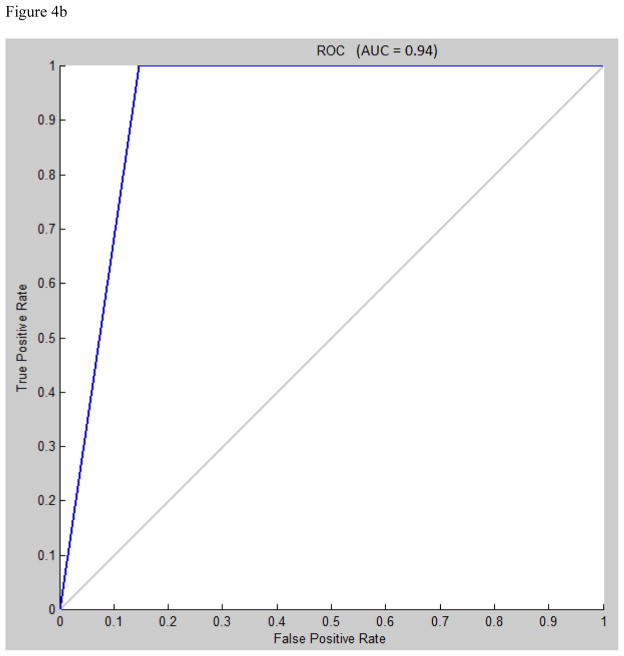
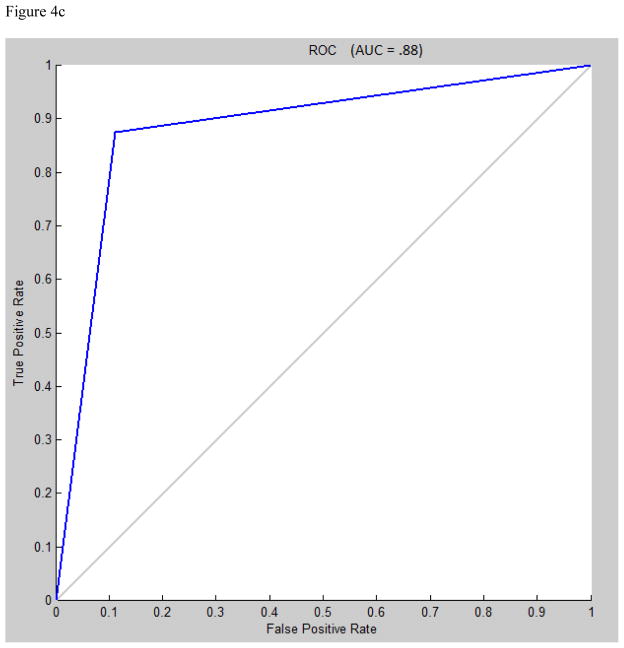
Area under the receiver operating characteristic (ROC) curve for multilayer perceptron, learning vector quantization, and support vector machine were 0.95, 0.94, and 0.88, respectively (figures 4a, 4b, 4c).
Figure 4.
A) Receiver operating characteristic (ROC) curve for multilayer perceptron classification, Levenberg-Marquardt algorithm, N=30. B) ROC curve for learning vector quantization classification, N=7. C) ROC curve for support vector machine classification, radial bases function with gamma=1.
Feature reduction
Principal component analysis provided no significant benefit, and reduced performance in several instances, so the full featured data set was selected as optimal. In addition to PCA, eliminating features associated with the UES resulted in the greatest increase in misclassification, while eliminating the velopharygeal measurements decreased misclassification only slightly. Concerning individual parameters (table 5), the pressure maximum prior to UES opening performed the best, achieving a misclassification rate approaching that of the support vector machines (average misclassification 20.68%). The UES integral performed the worst, barely improving on randomness (average misclassification 45.6%). This analysis was done to identify individual features which contribute most strongly to correct classification. We found that the features associated with the UES were most crucial to achieving correct classification.
Table 5.
Average classification accuracy for each parameter in isolation.
| Parameter | MLP | LVQ | SVM |
|---|---|---|---|
|
| |||
| VP max (mmHg) | 69.25 ± 3.27 | 53.14 ± 2.15 | 53.65 ± 1.08 |
| VP duration (s) | 66.62 ± 2.17 | 52.09 ± 1.24 | 53.37 ± 0.65 |
| VP rise rate (mmHg/s) | 72.72 ± 3.03 | 68.12 ± 1.01 | 70.79 ± 0.92 |
| VP integral | 61.75 ± 2.39 | 53.45 ± 0.98 | 52.53 ± 1.69 |
| VP line integral | 62.96 ± 2.09 | 57.09 ± 1.78 | 53.09 ± 1.69 |
| TB max (mmHg) | 66.80 ± 3.14 | 66.17 ± 2.12 | 65.73 ± 1.12 |
| TB duration (s) | 65.62 ± 1.17 | 58.12 ± 2.45 | 53.93 ± 0 |
| TB rise rate (mmHg/s) | 66.98 ± 2.14 | 70.45 ± 1.98 | 71.07 ± 1.69 |
| TB integral | 63.93 ± 2.21 | 63.55 ± 4.45 | 57.02 ± 5.22 |
| TB line integral | 64.80 ± 2.47 | 59.12 ± 3.41 | 50.28 ± 1.92 |
| UES pre (mmHg) | 79.32 ± 2.19 | 75.63 ± 1.65 | 76.69 ± 0.56 |
| UES post (mmHg) | 78.52 ± 3.21 | 71.75 ± 1.71 | 72.47 ± 1.95 |
| UES duration (s) | 67.72 ± 2.28 | 62.52 ± 1.27 | 61.24 ± 1.12 |
| UES integral | 55.40 ± 4.12 | 51.49 ± 1.48 | 53.93 ± 0 |
| UES line integral | 66.77 ± 2.44 | 66.88 ± 2.47 | 64.89 ± 3.82 |
| Total swallow duration (s) | 68.88 ± 2.3 | 61.48 ± 2.44 | 54.49 ± 1.12 |
DISCUSSION
Subject health status (normal or disordered) was determined prior to the manometric experiment and accomplished using traditional assessments such as history and physical exam, modified barium swallow study, or fiberoptic endoscopic evaluation of swallowing. We achieved greater than 95% classification accuracy and agreement with health status determined using the aforementioned metrics. Therefore, different results were not obtained between traditional assessment tools and HRM with topical anesthetic. Also, though topical anesthesia was used in this study, it may not have significantly altered swallowing physiology with regard to our measurements (McCulloch et al., 2010). Omitting topical anesthetic in pilot experiments led to increased gagging and resting UES pressure, confounding data collection. As swallowing is a sensorimotor phenomenon, impairing pharyngeal afferent nerves could potentially alter normal physiology. However, mechanoreceptors deep to the mucosa are largely responsible for modulating swallow physiology (Ali et al., 1997) and these fibers were likely unaffected. Additionally, the oral mucosa was minimally affected, and afferent information from this area is also important to regulating swallow function. We believe that the benefit of increased subject comfort at the expense of short-term pain/temperature afferent alteration improved the reliability of our data.
Three classification model techniques were studied to determine effective discrimination between normal and disordered swallowing based on data extracted from HRM spatiotemporal plots. The ability to distinguish normal from disordered swallows is the first step in in distinguishing among different specific disorders, which is the goal of this type of analysis in a clinical setting. If normal subjects present with significant variation, then the likelihood of a classifier distinguishing among disorders is low. The three classification techniques used in this study were multi-layer perceptron (MLP), learning vector quantization (LVQ), and support vector machine (SVM). The multi-layer perceptron technique performed best, achieving an average classification accuracy of 96.44%. However, support vector machines classified normal versus disordered swallows with 85.39% accuracy, which is also considered a high success rate. These results suggest that these techniques, particularly the ANNs, can effectively distinguish normal from abnormal swallowing, which could be valuable clinically.
Our efforts to improve performance by modifying the architecture of the ANN, such as increasing the number of hidden nodes and codebook sizes, had a minimal effect in most cases. This is likely a consequence of implementing measures to prevent overfitting in large networks. Increasing the number of data points available by analyzing more swallows from a larger subject pool could potentially prevent this overfitting and allow these larger networks to run longer, potentially improving accuracy and generalization to new data (i.e. different types of dysphagia).
Differences between the three techniques could point to a lack of well defined clustering in the data or could be the result of combining dysphagic subjects into a single group rather than separating them by disorder. With both learning vector quantization and support vector machines, the winner-take-all nature of the learning algorithm means that correct classification depends to a great degree on the identification of clusters associated with particular output classes. The multilayer perceptron, though clearly improved by clustered data, is not as reliant on that condition since it lacks both the competitive nature of learning vector quantization and the direct partition construction, and inherent clustering, utilized by support vector machines.
Performing a feature reduction analysis allows us to determine which parameters are most frequently affected by dysphagia. Variations in these parameters may be sensitive indicators of swallowing abnormalities. Using maximum pre-opening UES pressure as the only parameter of interest, a classification accuracy of 79.32% was obtained. The accuracy obtained using this one parameter approached that using the entire feature set, demonstrating the impact of the UES to disruptions in swallowing physiology. Removing all UES-related parameters from the feature set resulted in the greatest decrease in classification accuracy (table 4), in part due to the sensitivity of the maximum pre-opening UES pressure. As the UES was the region most sensitive to physiological abnormalities, we expected the UES integral to be a powerful parameter in distinguishing normal from disordered swallows; however, classification accuracy was only 55.40%. At our modest sample size in this preliminary stage, this may be due to some subjects exhibiting hypertonicity and some subjects exhibiting hypotonicity. Additionally, our method used to calculate the UES integral may have contributed to this as local pressure maximums occur far above resting UES pressure, but the integral we measured was the area above minimum UES pressure but below resting UES pressure. Extending the area of interest to include the area bounded by local pressure maximums, and thus integrating by parts over multiple sensor channels, may increase the utility of the parameter by more accurately accounting for the movement of the UES during swallowing. Interestingly, removing velopharyngeal pressure from the feature set did not greatly affect classification accuracy (table 4), resulting in a decrease of only 1-2% depending on the classification method.
Table 4.
Average percent accurate classification for each classification model excluding a set of variables. Values are presented as mean ± standard deviation. L-M = Levenberg-Marquardt algorithm.
| Parameter excluded | Multilayer Perceptron LM | Support Vector Machine | Learning Vector Quantization |
|---|---|---|---|
| None | 96.44 ± 1.27 | 85.39 ± 2.4 | 91.03 ± 0.98 |
| Pressures | 86.29 ± 1.49 | 87.08 ± 1.12 | 90.73 ± 5.45 |
| Durations | 89.22 ± 0.39 | 90.17 ± 1.69 | 84.45 ± 3.75 |
| Velopharynx | 95.61 ± 3.62 | 83.43 ± 0.56 | 90.13 ± 5.46 |
| Tongue base | 89.48 ± 0.83 | 84.55 ± 1.08 | 85.71 ± 3.49 |
| UES | 83.57 ± 2.19 | 84.55 ± 2.81 | 79.45 ± 4.35 |
| Integrals | 91.84 ± 0.65 | 86.52 ± 0.92 | 85.50 ± 1.75 |
| Line integrals | 90.25 ± 1.49 | 83.43 ± 1.92 | 84.78 ± 5.12 |
Based on the data presented in this study, UES abnormalities are likely the most common errant pressure feature associated with dysphagia, at least for our subject pool. As the UES requires fairly complex and appropriately timed sphincteric action, this is not surprising. Bolus gravitational force may be sufficient to compensate for a dysfunctional velopharynx or tongue base and elevated velopharyngeal pressure may adjust for low tongue base pressure. However, UES opening to facilitate bolus passage to the esophagus and closing to prevent regurgitation and reflux are critical aspects of a functional swallow.
Even at this preliminary stage, the pattern recognition techniques employed here appear to be clinically useful in distinguishing normal from abnormal swallowing. We recognize that the ultimate goal of a swallowing evaluation is to define the underlying physiologic abnormality that impairs successful swallow function. However, an immediate report on whether a subject’s swallow is normal or disordered could aid clinicians in patient screening and assessment based on pharyngeal HRM. The next step is to define manometric abnormalities according to dysphagia characteristics, which would be further aided by coupling HRM with videofluoroscopy. Although this study focused on differentiating normal and disordered swallows, the many features generated by our analysis of HRM data could prove able to distinguish between different types of dysphagia. The high accuracy in this preliminary study provides evidence that HRM has potential as an alternative clinical assessment tool, especially when coupled with ANN techniques.
CONCLUSION
Three neural networks are presented which can be used effectively to distinguish normal from disordered swallowing based on pharyngeal high-resolution manometry. Feature reduction analysis demonstrated that the upper esophageal sphincter is critical region for distinguishing normal versus disordered swallows in our data set. Continuing to modify the pattern recognition methods along with the use of additional disorder-specific data will refine the utility of these techniques. Even at this preliminary stage, high classification rates were achieved. As high-resolution manometry provides robust information on swallow events, applying pattern recognition methods will be useful in facilitating clinical application and enhancing assessment utility.
Table 3.
Summary data from each classification model.
| Artificial neural network | % Accuracy |
|---|---|
|
| |
| Multilayer perceptron (MLP) | 96.44 ± 1.27 |
| Learning vector quantization (LVQ) | 91.03 ± .98 |
| Support vector machine (SVM) | 85.39 ± 2.4 |
Acknowledgments
This research was supported by NIH grant numbers R01 DC008850 and R21 DC011130A from the National Institute on Deafness and other Communicative Disorders.
Footnotes
Conflicts of interest: None.
References
- Ali GN, Cook IJ, Laundl TM, Wallace KL, De Carle DJ. Influence of altered tongue contour and position on deglutitive pharyngeal and UES function. American Journal of Physiology. 1997 Nov;273(5 Pt 1):G1071–6. doi: 10.1152/ajpgi.1997.273.5.G1071. [DOI] [PubMed] [Google Scholar]
- Baxt WG. Application of artificial neural networks to clinical medicine. The Lancet. 1995 Oct 28;346(8983):1135–8. doi: 10.1016/s0140-6736(95)91804-3. [DOI] [PubMed] [Google Scholar]
- Boser B, Guyon IM, Vapnik VN. A training algorithm for optimal margin classifiers. In: Haussler D, editor. 5th Annual ACM Workshop on COLT. Pittsburgh, PA: ACM Press; 1992. pp. 144–52. [Google Scholar]
- Boyanov B, Hadjitodorov S. Acoustic analysis of pathological voices. A voice analysis system for the screening of laryngeal diseases. IEEE Engineering in Medicine and Biology Magazine. 1997 Jul-Aug;16(4):74–82. doi: 10.1109/51.603651. [DOI] [PubMed] [Google Scholar]
- Cook IJ. Normal and disordered swallowing: new insights. Bailliere's Clinical Gastroenterology. 1991 Jun;5(2):245–67. doi: 10.1016/0950-3528(91)90029-z. [DOI] [PubMed] [Google Scholar]
- Cross SS, Harrison RF, Kennedy RL. Introduction to neural networks. The Lancet. 1995 Oct 21;346(8982):1075–9. doi: 10.1016/s0140-6736(95)91746-2. [DOI] [PubMed] [Google Scholar]
- Fox MR, Bredenoord AJ. Oesophageal high-resolution manometry: moving from research into clinical practice. Gut. 2008 Mar;57(3):405–23. doi: 10.1136/gut.2007.127993. [DOI] [PubMed] [Google Scholar]
- Hoffman MR, Ciucci MR, Mielens JD, Jiang JJ, McCulloch TM. Pharyngeal swallow adaptations to bolus volume measured with high resolution manometry. Laryngoscope. 2010 Dec;120(12):2367–73. doi: 10.1002/lary.21150. [DOI] [PMC free article] [PubMed] [Google Scholar]
- Jain AK, Chandrasekaran B. Dimensionality and sample size considerations in pattern recognition practice. North Holland: 1982. [Google Scholar]
- Kim SM, McCulloch TM, Rim K. Pharyngeal pressure analysis by the finite element method during liquid bolus swallow. Annals of Otology, Rhinology, and Laryngolology. 2000 Jun;109(6):585–9. doi: 10.1177/000348940010900610. [DOI] [PubMed] [Google Scholar]
- Kohonen T. Learning vector quantization. Neural Networks. 1988;1(suppl 1):303. [Google Scholar]
- Lazareck LJ, Moussavi ZM. Classification of normal and dysphagic swallows by acoustical means. IEEE Transactions on Biomedical Engineering. 2004 Dec;51(12):2103–12. doi: 10.1109/TBME.2004.836504. [DOI] [PubMed] [Google Scholar]
- McConnel FM. Analysis of pressure generation and bolus transit during pharyngeal swallowing. Laryngoscope. 1988 Jan;98(1):71–8. doi: 10.1288/00005537-198801000-00015. [DOI] [PubMed] [Google Scholar]
- McCulloch T, Hoffman MR, Ciucci MR. High resolution manometry of pharyngeal swallow pressure events associated with head turn and chin tuck. Annals of Otology, Rhinology, and Laryngology. 2010 Jun;119(6):369–76. doi: 10.1177/000348941011900602. [DOI] [PMC free article] [PubMed] [Google Scholar]
- Mielens JD, Hoffman MR, Ciucci MR, Jiang JJ, McCulloch TM. Automated analysis of pharyngeal pressure data obtained with high-resolution manometry. Dysphagia. 2011 Mar;26(1):3–12. doi: 10.1007/s00455-010-9320-2. [DOI] [PMC free article] [PubMed] [Google Scholar]
- Pace F, Buscema M, Dominici P, Intraligi M, Baldi F, Cestari R, et al. Artificial neural networks are able to recognize gastro-oesophageal reflux disease patients solely on the basis of clinical data. European Journal Gastroenterology and Hepatology. 2005 Jun;17(6):605–10. doi: 10.1097/00042737-200506000-00003. [DOI] [PubMed] [Google Scholar]
- Saarinen S, Bramley R, Cybenko G. Ill-conditioning in neural network training problems. SIAM Journal on Scientific Computing. 1993;14:693–714. [Google Scholar]
- Santos R, Haack HG, Maddalena D, Hansen RD, Kellow JE. Evaluation of artificial neural networks in the classification of primary oesophageal dysmotility. Scandanavian Journal of Gastroenterology. 2006 Mar;41(3):257–63. doi: 10.1080/00365520500234030. [DOI] [PubMed] [Google Scholar]
- Schlotthauer G, Torres ME, Jackson-Menaldi MC. A pattern recognition approach to spasmodic dysphonia and muscle tension dysphonia automatic classification. Journal of Voice. 2010 May;24(3):346–53. doi: 10.1016/j.jvoice.2008.10.007. [DOI] [PubMed] [Google Scholar]


