

Abstract
Certain mutations within the mammalian target of rapamycin (mTOR) pathway, most notably those affecting the tuberous sclerosis complex (TSC), lead to aberrant activation of mTOR and result in a high incidence of epilepsy in humans and animal models. Although hyperactivation of mTOR has been strongly linked to the development of epilepsy and, conversely, inhibition of mTOR by rapamycin treatment is protective against seizures in several models, the downstream epileptic mechanisms have remained elusive. Autophagy, a catabolic process that plays a vital role in cellular homeostasis by mediating the turnover of cytoplasmic constituents, is negatively regulated by mTOR. Here we demonstrate that autophagy is suppressed in brain tissues of forebrain-specific conditional TSC1 and phosphatase and tensin homlog knock-out mice, both of which display aberrant mTOR activation and seizures. In addition, we also discovered that autophagy is suppressed in the brains of human TSC patients. Moreover, conditional deletion of Atg7, an essential regulator of autophagy, in mouse forebrain neurons is sufficient to promote development of spontaneous seizures. Thus, our study suggests that impaired autophagy contributes to epileptogenesis, which may be of interest as a potential therapeutic target for epilepsy treatment and/or prevention.
Introduction
Macroautophagy, henceforth referred to as autophagy, is a catabolic process that mediates the turnover of cytoplasmic constituents via lysosomal degradation (Rubinsztein et al., 2005; Yang and Klionsky, 2010). Genetic studies primarily in yeast revealed that a set of autophagy-related (Atg) genes acting similarly to the ubiquitin-conjugation system modulates autophagosome biogenesis (Suzuki et al., 2001; Kim et al., 2002; Xie and Klionsky, 2007). Autophagy has been implicated in various physiological processes (Levine and Kroemer, 2008), including the adaptive response to starvation, quality control of intracellular proteins and organelles (mitophagy) (Wang and Klionsky, 2011), embryonic development, cellular defense against bacterial invasion (Mizushima et al., 2008), antigen presentation (Deretic and Levine, 2009), tumor suppression (Chen and Debnath, 2010; Komatsu, 2011; Takamura et al., 2011), homeostasis of axons (Komatsu et al., 2007), and neurodegeneration (Komatsu et al., 2005, 2006; Hara et al., 2006; Rubinsztein, 2006). Autophagy activity is negatively regulated by the mammalian target of rapamycin (mTOR) in response to growth factors, nutrient bioavailability, and stress (Levine and Klionsky, 2004). Recent studies revealed that mTOR regulates autophagy via phosphorylation of the autophagy-initiating kinase Ulk1 (Kim et al., 2011).
mTOR itself is tightly controlled by upstream regulators, including tuberous sclerosis complex (TSC) and phosphatase and tensin homlog (PTEN) (Laplante and Sabatini, 2012). Loss-of-function mutations in these regulators lead to hyperactivation of mTOR (European Chromosome 16 Tuberous Sclerosis Consortium, 1993; van Slegtenhorst et al., 1997; Inoki et al., 2002; Onda et al., 2002; Baybis et al., 2004) and result in a high incidence of epilepsy in both humans (Padberg et al., 1991; Thiele, 2004; Holmes and Stafstrom, 2007) and animal models (Meikle et al., 2008; Zeng et al., 2008; Zhou et al., 2009; Sunnen et al., 2011). It is generally believed that aberrant hyperactivation of mTOR is primarily responsible for the epileptogenic process (Cao et al., 2009; Wong, 2010); however, the downstream mechanisms remain to be elucidated. Recent studies found that autophagy activity is downregulated in mouse embryonic fibroblast cells after TSC2 deletion (Ng et al., 2011; Parkhitko et al., 2011), although the effects of disinhibition of mTOR on autophagy in neurons remain unclear. Autophagy has also recently been found to be compromised in Lafora disease, which is strongly associated with epilepsy (Knecht et al., 2010), further supporting a possible role for autophagy in epileptogenesis. In the present study, we investigated whether autophagy, a downstream component of the mTOR pathway, is altered in association with loss of function of TSC1 or PTEN and, furthermore, whether inactivation of autophagy is sufficient to cause seizures.
Materials and Methods
Animals.
Atg7flox/flox [developed by Komatsu et al. (2005)], TSC1flox/flox (Kwiatkowski et al., 2002), and PTENflox/flox (Groszer et al., 2001) [from The Jackson Laboratory (Bar Harbor, ME)] mice were crossed with CaMKIIα-Cre mice [strain T29-1 (Tsien et al., 1996)]. Animals were housed in a pathogen-free, temperature- and humidity-controlled facility with a 12 h light cycle (lights on at 7:00 A.M.) and ad libitum access to food and water. All experiments were performed according to the guidelines set by the Animal Care and Use Committee as well as the National Institutes of Health Guide for the Care and Use of Laboratory Animals. Efforts were made to minimize suffering and unnecessary use of animals.
Genotyping.
DNA extraction was accomplished by digestion of 2 mm mouse tail snips in 500 μl of digestion buffer (50 mm KCl, 10 mm Tris-HCl, 2.5 mm MgCl2, 0.45% v/v NP-40, and 0.45% v/v Tween 20) with 100 μg/ml proteinase K at 56°C overnight. On the next day, the samples were heated to 95°C for 5 min. PCR was performed using the following primers: wild-type Atg7 sense 5′-tgcatgtctgtggttgcttc, antisense 5′-agaggggtacaggggcatac; floxed Atg7 sense 5′-ggacttgtgcctcaccagat, antisense 5′-ctcgtcactcatgtcccaga; TSC [detects wild-type (WT) and mutant] sense 5′-gtcacgaccgtaggagaagc, antisense 5′-gaatcaaccccacagagcat; PTEN (detects WT and mutant) 5′-caagcactctgcgaactgag, antisense 5′-aagtttttgaaggcaagatgc; and Cre sense 5′-gcatttctggggattgtta, antisense 5′-cccggcaaaacaggtagtta.
Transcardial perfusion and fixation.
Mice were anesthetized by intraperitoneal injection of pentobarbital (30 mg/kg) supplemented with inhalation of isoflurane. Mice were first perfused with 30 ml of PBS and subsequently perfused with 4% paraformaldehyde. Brains were removed and held in 4% paraformaldehyde for 24 h at 4°C and transferred into 30% sucrose solution at 4°C until they were completely submerged. Brain tissues were then frozen and sectioned into 40 μm slices using a cryostat and stored at 4°C in PBS with sodium azide.
Western blot.
Mice were killed, and the brains were removed and sliced into 2-mm-thick sections in a stainless steel matrix. Similar anatomic regions were identified, and a 2-mm-diameter hole punch was used to isolate two punches from the desired regions for each animal. Isolated tissues were homogenized in lysis buffer consisting of 50 mm Tris, pH 7.4, 2 mm EDTA, and a proteinase inhibitor set (Roche). The lysates were then mixed with equal volumes of 2× lithium dodecyl sulfate sample buffer composed of 20% β-mercaptoethanol, 20 mm NaF, 20 mm of Na3VO4, and proteinase inhibitor and heated at 95°C for 5 min. Insoluble cell debris was removed by centrifugation at 10,000 × g for 10 min. Protein samples were resolved in an 8% Bis-Tris gel in MES buffer (50 mm MES, 50 mm Tris-HCl, 1 mm EDTA, and 0.1% SDS) and transferred to a 0.45 μm nitrocellulose membrane in transfer buffer (25 mm Tris, 200 mm glycine, and 20% methanol). For LC3 detection, proteins were resolved by 15% SDS-PAGE and transferred onto a PVDF membrane. Membranes were subsequently blocked in 5% nonfat dry milk in TBST (25 mm Tris-HCl, pH 7.4, 1.5 M NaCl, and 0.05% Tween 20) for 1 h at room temperature (RT) and incubated with rabbit anti-p62, anti-S6, anti-phospho S6(Ser235/236), anti-Ulk1, anti-phospho Ulk1(Ser757), anti-LC3, or anti-GAPDH antibodies (Cell Signaling Inc.) at 1:1000 dilution at 4°C overnight. Anti-Ulk1 for mouse and human were purchased from Sigma-Aldrich and Cell Signaling Technology Inc., respectively. Membranes were washed in TBST and incubated with an anti-rabbit HRP-conjugated secondary antibody (1:10,000) in 5% milk in TBST for 1 h at RT. Membranes were washed in TBST, followed by a final wash in TBS. Signals were visualized with ECL reagent (Pierce Chemical) and an LAS-4000 luminescent image analyzer (Fujifilm). ImageJ software was used to subtract background and to perform densitometry.
Human brain specimens.
Brain tissues were obtained from Albany Medical Center (AMC) and the National Institute of Child Health and Human Development (NICHD) brain and tissue bank at the University of Maryland at Baltimore. All TSC specimens were obtained from patients with a history of neurological manifestations including seizures. TSC was confirmed by neuropathological diagnosis, including the presence of cortical tubers, subependymal nodules, and/or subependymal giant cell astrocytomas (SEGA). TSC samples were obtained from 16 patients, nine males and seven females ranging from 13 to 56 years old. Five were surgical specimens, and 11 were postmortem tissues with an average postmortem interval of 5 h. From the 16 patients, 12 tuber samples (five fixed and five frozen from NICHD and two fixed from AMC) and 12 SEGA samples (five fixed and three frozen from NICHD and four fixed from AMC) were collected. In some cases, both tuber and SEGA were collected from the same person. Control cortical tissues were obtained from autopsies of 14 patients who had no history of epilepsy or TSC and died of non-neurological causes. Fifteen samples (five fixed and five frozen from NICHD and five fixed from AMC) were acquired with an average postmortem interval of 5.5 h. One set of fixed and frozen tissues was collected from the same person. All specimens assessed were histologically intact. Brain slices were prepared from paraffin-embedded tissues sectioned at 5 μm. All human tissues were obtained in accordance with a protocol approved by the Albany Medical College Institute Review Board and Committee on Human Research.
Immunohistochemistry.
Slides were cleared in two rinses of xylene and rehydrated via ethanol gradient treatment, including two rinses in 100% ethanol; a rinse in 95% ethanol; and, finally, a rinse in 70% ethanol. Endogenous peroxidase activity was blocked by quenching in 3% H2O2, and slices were blocked with 10% BSA with 0.4% Triton X-100 for 1 h at RT. Slices were incubated in a primary antibody overnight at 4°C (anti-p62, 1:100 dilution, American Research Products; anti-phospho-S6, 1:25 dilution, Cell Signaling; anti-synapsin, 1:1000 dilution, Millipore). Slices were again rinsed in PBS and incubated with a biotinylated secondary antibody (1:200) for 30 min at RT, followed by another rinse in PBS and incubation in ABC reagent (Vectastain Elite kit; Vector Laboratories) for 30 min at RT. Slices were washed, and staining was visualized using ImmPact DAB (Vector Laboratories). Specimens were dehydrated with a reverse ethanol gradient and mounted in DPX mountant. NIH ImageJ was used for image analysis. For quantification of p62 in human samples, 20× images were selected from five regions that contained the highest number of cells with a positive staining for each slice. All cells that were readily identified as individual cells via the presence of a recognizable soma were analyzed. Regions of interest were defined by manually outlining a cell, and the mean intensity was measured. Additionally, five areas on an image that contained no distinct staining were measured, and the average intensity served as the background for each individual image. A cell was counted as positively stained only if it had an intensity that was greater than or equal to 1.5 times the background level.
Cresyl violet and hematoxylin and eosin staining.
Mice were transcardially perfused and sectioned as described above. Slices were adhered to coated coverslips and rinsed in H2O. For cresyl violet staining, slides were incubated in 0.1% cresyl violet acetate dissolved in H2O for 3 min. For H&E staining, slides were submerged in Gill 3 hematoxylin (Richard-Allan Scientific) for 5 min, rinsed in H2O for 5 min, and differentiated in 1% acid alcohol for 30 s. Slides were then rinsed in H2O for 1 min, submerged in 0.2% ammonia, and rinsed again in H2O. Slides were dipped into 95% ethanol and treated with Eosin-Y (Richard-Allan Scientific) for 1 min. Finally, the specimens were dehydrated via ethanol gradient, rinsed in xylene, and mounted with DPX.
TUNEL staining.
Detection of apoptosis in Atg7KO mouse brains by TUNEL staining was performed using a NeuroTACS II kit (Trevigen). Brain sections of 40 μm were adhered to coated glass slides and rinsed in PBS for 10 min. NeuroPore solution was added for 25 min at RT. Slices were rinsed in PBS and quenched in 3% H2O2 for 5 min. A labeling reaction mix consisting of TdT dNTP, TdT enzyme, TdT labeling buffer, and Mn2+ cation was applied to sections for 60 min in a humidified chamber. Brain slices that were treated with nuclease served as a positive control. The reaction was terminated using a stop buffer, and the slides were washed in PBS. DAB was used to visualize apoptotic cells. Slides were rinsed in H2O, counterstained, dehydrated in a reverse ethanol gradient followed by xylene, and mounted in DPX.
Video/EEG recording of spontaneous seizures.
Spontaneous seizure activities were detected by continuous video monitoring of 16 Atg7KO, 10 TSC1KO, and 10 PTENKO mice from 8:00 P.M. until 8:00 A.M. 5 d per week starting at 3 weeks of age and continuing to 10 weeks for TSC1KO and PTENKO and 20 weeks for Atg7KO. Videos were analyzed by trained researchers, and behavioral seizures that presented with forepaw clonus, rearing, rearing with falling, or wild running were identified. Videos were examined from 3 weeks of age until a behavioral seizure was identified, at which point the animal was counted as positive for spontaneous seizures. We acknowledge that this method may fail to identify subtle seizure events or seizures without behavioral manifestation, which may result in underestimation of the actual onset of seizures. Five mice from each group with positive behavioral seizures were further monitored for electrographic seizures with electroencephalography (EEG). Mice were sedated using isoflurane inhalation and placed into a stereotaxic chamber. Three electrodes were linked to stainless steel surgical screws (J.I. Morris). Two screws were implanted at AP −1.8, ML 1.8 (left and right) serving as differential recording electrodes. A third screw was placed into the skull serving as a ground. Electrodes were held in place using dental cement (Harvard Apparatus). Mice were given 5 d to recover before recording. EEG recordings were performed in free-moving mice hooked to a Pinnacle 8200 EEG system (Pinnacle Technology) along with continuous video monitoring. EEG data were analyzed with the Sirenia Seizure program (Pinnacle Technology), and seizures were manually identified by characteristic high-frequency and high-amplitude firing. Additionally, most seizures were followed by brief postictal suppression. All electrographic seizures were verified behaviorally by video recording.
LC3 flux.
For experiments determining LC3 flux, mice were killed, and brains were removed, quickly placed into ice-cold dissection buffer (75 mm sucrose, 87 mm NaCl, 25 mm NaHCO3, 7 mm MgCl, 1.25 mm NaH2PO4, 2.5 mm KCl, 25 mm d-glucose, and 0.5 mm CaCl2), and subsequently mounted onto a block for sectioning. Using a vibratome, slices were cut in an ice-cold slurry of dissection buffer while bubbled with oxygen. After cutting, the slices were quickly transferred to separate dishes containing ACSF (125 mm NaCl, 25 mm NaHCO3, 1 mm MgCl, 1.25 mm NaH2PO4, 2.5 mm KCl, 10 mm d-glucose, and 1 mm CaCl2) bubbled with oxygen with or without 100 μm chloroquine diphosphate (MP Biomedicals). Slices were incubated for 2 h at RT, and hippocampal tissues were collected using a 2 mm hole punch. Lysates for Western blot were prepared as described above. LC3 flux was calculated by taking the ratio of LC3II/LC3I in chloroquine (CQ)-treated versus control slices. Because ECL signals for LC3II were very weak and for LC3I were very robust, digital images for LC3 Western blots were acquired by multiple exposures ranging from 5 s to 2 min. Images with a short and long exposure were used for quantification of LC3I and LC3II, respectively.
Statistical analysis.
Statistics were performed using GraphPad Prism and included t tests for comparisons between two groups and one-way ANOVA with a Tukey's post hoc test for three or more groups.
Results
Mice develop severe seizures and show increased mortality after deletion of TSC1 or PTEN in forebrain neurons
We first set out to determine whether autophagy is impaired in mouse brains under conditions where mTOR is hyperactivated. We used TSC1 and PTEN conditional KO mice by crossing TSC1flox/flox (Kwiatkowski et al., 2002) or PTENflox/flox (Groszer et al., 2001) mice with a CaMKIIα-Cre mouse line (Tsien et al., 1996), in which Cre recombinase is robustly expressed in neurons within the cortex and hippocampus, key brain structures involved in epileptogenesis (Meyer and Beck, 1955). Using video recording, we found that both TSC1KO and PTENKO mice began to display behavioral seizure activity as early as 5 weeks of age, with 80–90% of mice developing seizures by week 10 (Fig. 1a). No seizures were observed in control TSCflox/flox, PTENflox/flox, or CaMKIIα-Cre mice. TSC1KO and PTENKO mice showed a significant decrease in survival rate, with a steep drop occurring between postnatal weeks 6 and 8 (Fig. 1b), indicating a positive correlation between the onset of seizures and mortality. Video recording confirmed that all deaths that occurred during recording or during routine handling immediately followed severe seizures (accounting for 40 and 50% of total mortality for TSC1KO and PTENKO, respectively), suggesting that seizures are primarily responsible for the mortality. To verify that the behavioral seizure events observed in TSC1KO and PTENKO mice also presented with electrographic abnormalities, we selected five pairs of TSC1KO and PTENKO mice with behavioral seizures for cortical EEG and verified that the seizures were presenting with increased amplitude and frequency of firing (Fig. 1c,d). Western blot analysis revealed that TSC1KO mice at postnatal day 28 started to display higher levels of mTOR activity as indicated by phosphorylation of S6 at Ser235/236 than that in age-matched controls (Fig. 1e,f). The level of p-S6 in TSC1KO mice is also slightly elevated at postnatal day 28, compared with TSC1KO mice at postnatal days 14 and 21, but did not reach a statistical significance. This indicates that the epileptogenic window is a 2–3 week period beginning at postnatal week 4. We also observed that the level of p-S6 at postnatal day 28 in wild-type mice was reduced compared with postnatal days 14 and 21. These data are consistent with a recent study that reported that mTOR activity is lower in the mature brain than in the immature brain (Talos et al., 2012).
Figure 1.
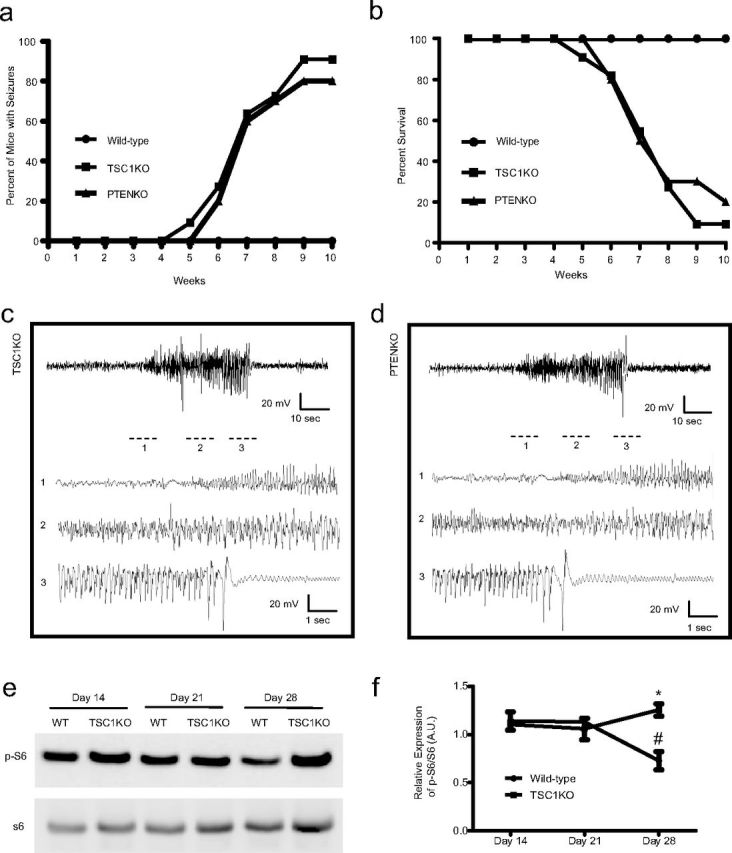
TSC1KO and PTENKO mice demonstrate spontaneous recurrent seizures and increased mortality. a, Percentage of WT (circle), TSC1KO (square), and PTENKO (triangle) mice that displayed behavioral seizure activities by 10 weeks of age. b, Percentage of survival of wild-type, TSC1KO, and PTENKO mice by 10 weeks of age. c, d, Representative electrographic recordings in TSC1KO and PTENKO mice during a spontaneous seizure episode. e, Western blot showing increased p-S6 levels in TSC1KO mouse brains at postnatal week 4. f, Quantification of p-S6. *Significant difference between WT and TSC1KO mice on day 28 (mean ± SEM; n = 3; p < 0.05, ANOVA). #Significant difference between day 28 and day 14 or 21 in WT mice (mean ± SEM; n = 3; p < 0.05, ANOVA). A.U., Arbitrary units.
TSC1KO and PTENKO mice display impaired autophagy activity
Ulk1 is a critical component that mediates initiation of autophagy (Kim et al., 2011). A recent study revealed that mTOR phosphorylates Ulk1 at Ser757 (p-Ulk1 Ser757), resulting in inhibition of autophagy (Kim et al., 2011). Therefore, we examined whether Ulk1 phosphorylation at Ser757 is altered in vivo after genetic disinhibition of mTOR via TSC1 or PTEN deletion. We found that both TSC1KO and PTENKO mice displayed a significant increase in Ulk1 phosphorylation at Ser757 in both cortex and hippocampus when compared with wild-type littermates, indicative of reduced autophagy activation (Figs. 2a,b, 3a,b). Phosphorylation of S6 at Ser235/236 is also elevated in TSC1KO and PTENKO mouse cortex and hippocampus, consistent with mTOR hyperactivation (Figs. 2a,c, 3a,c). Neither S6 nor Ulk1 displayed any change in phosphorylation in the cerebellum (Figs. 2a–c, 3a–c), where Cre expression is minimal (Tsien et al., 1996). The mTOR inhibitor rapamycin reduced the levels of phosphorylated Ulk1 concurrent with a reduction in S6 phosphorylation (Figs. 2a–c, 3a–c), confirming that increased Ulk1 phosphorylation reflects activation of mTOR because of inactivation of TSC1 and PTEN.
Figure 2.
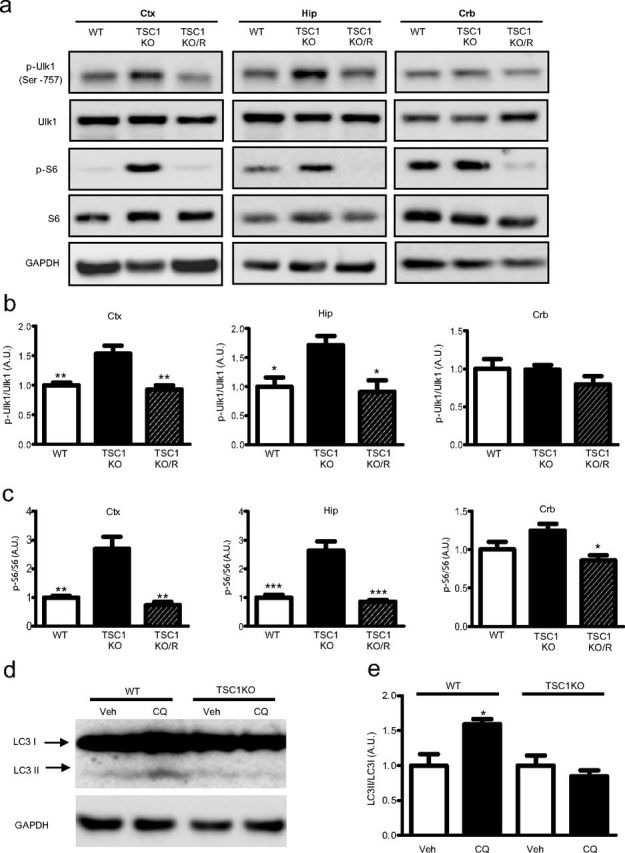
Autophagy levels are reduced in TSC1KO mice. a, Representative Western blots from lysates prepared from cortex, hippocampus, and cerebellum of wild-type mice, TSC1KO mice, and TSC1KO mice treated with rapamycin (TSC1KO/R) (5 mg/kg, i.p.) for 3 d. b, Quantifications of phospho-Ulk1 against total Ulk1. c, Quantifications of phospho-S6 against total S6 (ANOVA with Tukey's post hoc test; n = 5; *p < 0.05; **p < 0.01; ***p < 0.001, between TSC1KO and wild-type or TSC1KO/R). d, Representative Western blot of hippocampal lysates of wild-type and TSC1KO mice prepared from slices incubated in ACSF or CQ (100 μm) for 2 h. e, Quantification of autophagy flux, as measured by the LC3II/LC3I ratio in the CQ-treated slices over that in ACSF-treated slices, revealed a significant reduction in TSC1KO mice (mean ± SEM; n = 5; t test, p < 0.05). Ctx, Cortex; Hip, hippocampus; Crb, cerebellum; Veh, vehicle.
Figure 3.
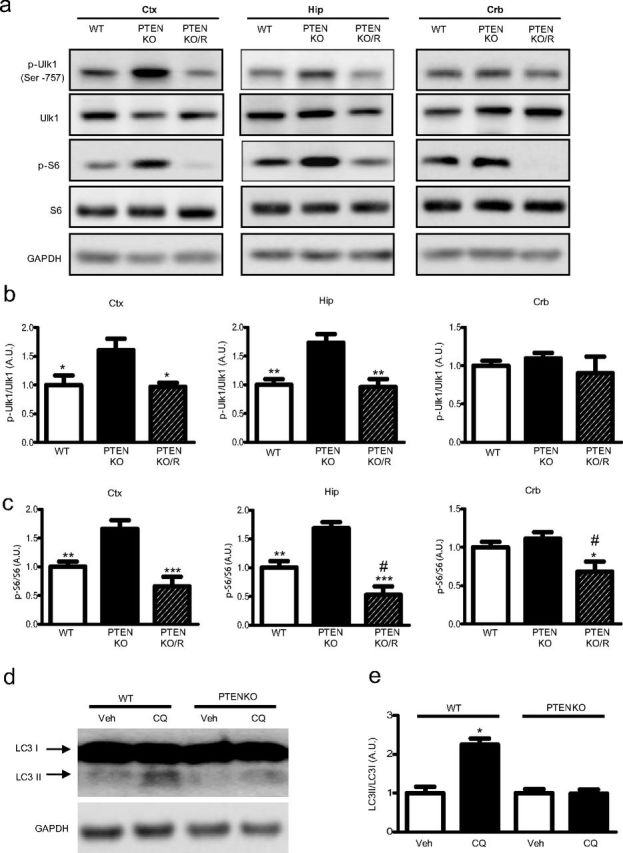
Autophagy levels are reduced in PTENKO mice. a, Representative Western blots from lysates prepared from cortex, hippocampus, and cerebellum of wild-type mice, PTENKO mice, and PTENKO mice treated with rapamycin (PTENKO/R) (5 mg/kg, i.p.) for 3 d. b, Quantifications of phospho-Ulk1 against total Ulk1. c, Quantifications of phospho-S6 against total S6 (ANOVA with Tukey's post hoc test, *p < 0.05; **p < 0.01; ***p < 0.001, between PTENKO and wild-type or PTENKO/R; #Significant difference between wild-type and PTENKO/R). d, Representative Western blot of hippocampal lysates of wild-type and PTENKO mice prepared from slices incubated in ACSF or CQ (100 μm) for 2 h. e, Quantification of autophagy flux, as measured by the LC3II/LC3I ratio in the CQ-treated slices over that in ACSF-treated slices, revealed a significant reduction in PETNKO mice (mean ± SEM; n = 5; t test, p < 0.05). Ctx, Cortex; Hip, hippocampus; Crb, cerebellum; Veh, vehicle.
Modification of microtubule-associated protein 1 light-chain 3 (LC3) from LC3I to LC3II is another marker of autophagy activity (Tanida et al., 2008). The basal level of autophagy in the brain was very low, as little LC3II was detected (Figs. 2d, 3d). To increase the sensitivity of detection, we monitored autophagy flux by blocking degradation of LC3II, a strategy that has been used previously (Kaushik et al., 2011; Zois et al., 2011). We used CQ to attenuate degradation of LC3II by inhibiting lysosomal activity (Zois et al., 2011). We observed a significant accumulation of LC3II in hippocampal tissues prepared from control mice, whereas no accumulation occurred in TSC1KO (Fig. 2d,e) or PTENKO (Fig. 3d,e) mice. These data indicate that autophagy activity is downregulated in TSC1KO and PTENKO mouse brains.
Autophagy activity is impaired in the brains of human TSC patients
We next extended our study to brain tissues from human TSC patients. TSC is an autosomal dominant disorder caused by mutations in either the TSC1 or TSC2 gene (European Chromosome 16 Tuberous Sclerosis Consortium, 1993; van Slegtenhorst et al., 1997; Crino et al., 2006) and characterized by severe neurological manifestations, including cognitive dysfunction (Prather and de Vries, 2004) and a high incidence of early-onset, intractable epilepsy (in 60–90% of patients) (Thiele, 2004; Holmes and Stafstrom, 2007). Typical pathological changes include cortical tubers (Yamanouchi et al., 1997), subependymal nodules, and SEGA (Trombley and Mirra, 1981). We found that both tubers and SEGA displayed a significant increase in phosphorylation of Ulk1at Ser757 (Fig. 4a,b) along with an increase of phosphorylated S6 when compared with control cortical tissues (Fig. 4a,c). p62/SQSTM1 is a ubiquitin-binding protein and a substrate of autophagy; therefore, its levels generally reflect autophagy flux (Komatsu et al., 2006; Ichimura and Komatsu, 2010). Western blotting revealed significant accumulation of p62 in cortical tubers and SEGA (Fig. 4a,d). Immunohistological staining revealed strong p62 staining in morphologically distinct cell types: enlarged, dysmorphic giant ganglion-like cells in cortical tubers and spindle-shaped astroglial-like cells in SEGA (Fig. 4e,f). In contrast, only a few weakly stained p62-positive cells were found in control cortical brain specimens. In addition, phosphorylation of S6 was also slightly increased in giant cells and astroglial-like cells (Fig. 4e). Amorphic and fairly weak staining of synapsin was also observed in both tubers and SEGA, perhaps reflecting the loss of neuronal identity and defects in synapse formation (Fig. 4e).
Figure 4.

Autophagy is inhibited in the brains of TSC patients. a, Representative Western blots from control cortex from normal human brains compared with cortical tuber or SEGA tissues from human TSC patients. Quantifications of phospho-Ulk1 (b), phospho-S6 (c), and p62 (d) in control, cortical tuber, and SEGA. e, Immunohistochemical staining for p62, phospho-S6, and synapsin in human control cortex and tissues from TSC patients, including tuber and SEGA (40× magnification). f, Quantifications of p62-positive cell counts from 20× magnification (mean ± SEM; n = 3–6; t test or ANOVA with Tukey's post hoc test; *p < 0.05; **p < 0.01; ***p < 0.001). Con, Control; Tuber, cortical tuber.
Genetic ablation of Atg7 in mice results in spontaneous recurrent seizures
We next investigated whether direct inhibition of autophagy is sufficient to alter seizure susceptibility. Atg7 is an E1-like enzyme that mediates conversion of LC3I to LC3II in the autophagy pathway (Yang and Klionsky, 2010). To address the role of autophagy in epileptogenesis, Atg7flox/flox mice were crossbred with CaMKIIα-Cre mice. Atg7flox/flox; CaMKIIα-Cre (Atg7KO) mice were viable with normal body weight at birth when compared with their wild-type littermates. Although LC3II levels were low in control mice, we found that LC3II nearly disappeared in the cortex and hippocampus of 6- to 7-week-old Atg7KO mice but remained in the cerebellum (Fig. 5a,b). p62 was barely detectable in control mice but, in stark contrast, was markedly accumulated in cortical and hippocampal tissues of Atg7KO mice (Fig. 5a,c). We also monitored phosphorylation of S6 to determine whether inactivation of autophagy by Atg7 deletion has any impact on mTOR activation. We did not find any significant change in p-S6 (Fig. 5a,d). Immunohistological staining of p62 revealed accumulation throughout the forebrain, with a pronounced increase in cortical neurons, hippocampal CA1 and CA3 pyramid cells, and a few cells in the dentate gyrus (Fig. 5e). Together, these data confirmed that ablation of Atg7 results in inhibition of autophagy in the cortex and hippocampus.
Figure 5.
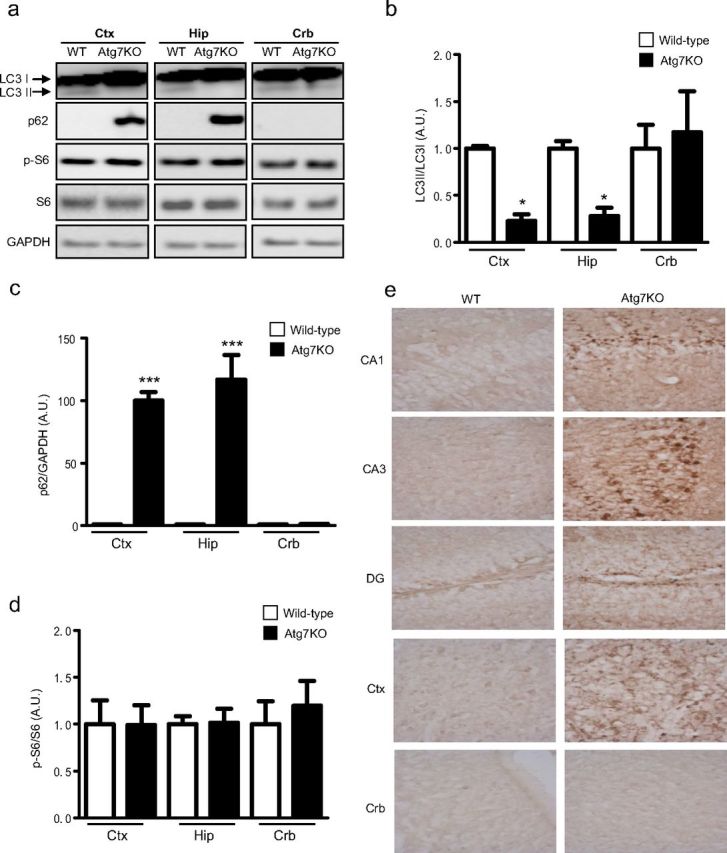
Atg7KO mice display impaired autophagy and spontaneous recurrent seizures. a, Representative Western blots of lysates from the cortex, hippocampus, and cerebellum of wild-type and Atg7KO mice. b–d, Quantifications of LC3 ratio (b), p62 (c), and phospho-S6 (d) in cortex, hippocampus, and cerebellum in WT and Atg7KO mice (mean ± SEM; n = 3–6; t test; *p < 0.05; ***p < 0.001). e, Images of immunohistochemical staining of p62 in WT and Atg7KO mice in the hippocampus (CA1, CA3, dentate gyrus), cortex, and cerebellum acquired at 40× magnification. Ctx, Cortex; Hip, hippocampus; Crb, cerebellum.
In previous studies, mice with a broad deletion of either Atg7 or Atg5 in either neural progenitors (using a nestin-Cre line) or cerebellar Purkinje neurons (using the Pcp2-Cre line) displayed neurodegeneration, but neither of them was reported to develop spontaneous seizures (Hara et al., 2006; Komatsu et al., 2006, 2007). To ascertain whether inhibition of autophagy specifically in relatively mature forebrain neurons can lead to epilepsy, we used video monitoring to document spontaneous recurrent seizures in 6- to 12-week-old Atg7KO mice. We found that ∼75% of KO mice developed spontaneous behavioral seizures (Fig. 6a), which began as early as 6–7 weeks of age, but the majority of mice developed seizures around postnatal weeks 8–10. Seizures lasted an average of ∼30 s and presented with forepaw clonus, rearing, rearing with falling, and periods of wild running that were occasionally followed by a tonic phase and death. We also selected five Atg7KO mice with behavioral seizures for cortical EEG and verified that the seizures were presenting with abnormal electrographic activity (Fig. 6c,d). In addition, Atg7KO mice displayed reduced survival, beginning around 6–8 weeks of age, eventually falling to ∼75% survival by 20 weeks (Fig. 6b). Of note, all mortality that was caught during video/EEG monitoring or routine handling was confirmed to be from sudden death immediately after a severe seizure episode, suggesting that most mortality was likely associated with seizures.
Figure 6.

Atg7KO mice demonstrate spontaneous recurrent seizures and increased mortality a, Percentage of wild-type (circle) and Atg7KO (square) mice that displayed behavioral seizure activities by 20 weeks of age. b, Percentage of survival of wild-type and Atg7KO mice by 20 weeks of age. c, d, Representative electrographic recording in a WT mouse during a typical wake period (c) and an Atg7KO mouse during a spontaneous seizure episode (d).
Previous studies have shown that inactivation of either Atg7 or Atg5 in neuronal progenitor cells leads to neurodegeneration (Komatsu et al., 2006); however, our Atg7flox/flox; CaMKIIα-Cre mice at 6–7 weeks old did not display any overt neuronal loss based on hematoxylin and eosin (H&E) or cresyl violet staining, nor any significant increase in TUNEL staining (Fig. 7a,b).
Figure 7.

Atg7KO does not result in significant cell death. a, Representative H&E and cresyl violet staining of the hippocampus and cortex demonstrating no gross morphological abnormalities in Atg7KO mouse brains. b, TUNEL staining in the cortex, dentate gyrus (DG), and CA3 from age-matched 6- to 8-week-old WT and Atg7KO mice. Nuclease treatment serves as a positive control. Ctx, Cortex; Hip, hippocampus.
Discussion
Hyperactivation of mTOR is generally recognized as the mechanism underlying epileptogenesis in rodent genetic TSC1 and PTEN models as well as in human TSC patients (Baybis et al., 2004; Meikle et al., 2008; Zeng et al., 2008; Zhou et al., 2009). The mTOR signaling pathway regulates a myriad of cascades, including protein translation, Akt activity, autophagy, and others (Laplante and Sabatini, 2012); however, the exact contribution to epileptogenesis from these downstream mechanisms remains elusive. Here, we showed that autophagy is inhibited in the brains of TSC1KO and PTENKO mice as well as in human TSC patients. Furthermore, mice deficient in autophagy activity through deletion of Atg7 in the forebrain developed spontaneous seizures. Therefore, our data suggest that impaired autophagy is a contributing mechanism to epileptogenesis in response to hyperactivation of mTOR.
Possible mechanisms by which impaired autophagy leads to epileptogenesis
The importance of autophagy within neurons has long been controversial, as in vivo analysis has demonstrated very low levels of autophagy in the brain, even after prolonged nutrient starvation (Mizushima et al., 2004). Since the development of conditional Atg7 and Atg5 knock-out mice, it has been repeatedly demonstrated that, despite low basal levels, autophagy plays a critical role in the CNS, regulating maintenance of axons, neurodegeneration, and mitophagy (Komatsu et al., 2005, 2006, 2007; Hara et al., 2006; Rubinsztein, 2006). Our results are consistent with previous findings, as we detected very low levels of LC3II in the brain (Fig. 5a,b). However, we demonstrate here for the first time that inhibition of autophagy alone is sufficient to promote the development of spontaneous recurrent seizures when Atg7 is deleted specifically in relatively mature neurons (Fig. 6). Of particular note, in previous studies, mice with a broad deletion of either Atg7 or Atg5 in neuron progenitors displayed neurodegeneration but were not reported to develop spontaneous seizures (Hara et al., 2006; Komatsu et al., 2006, 2007). In contrast, in the present study, deletion of Atg7 in mature neurons did not result in overt neurodegeneration detectable by TUNEL staining (Fig. 7). It is conceivable that subtle neurodegeneration beyond our detection limits could have occurred. Alternatively, Atg7 deletion may have less of an impact on mature neurons than on immature neurons.
The precise mechanism by which impairment of autophagy leads to neuronal hyperexcitability and seizures remains to be elucidated. Previous studies revealed that Atg7 deletion led to axon degeneration in cerebellar Purkinje cells (Komatsu et al., 2007) and interfered with axonal growth in hypothalamic neurons (Coupé et al., 2012). However, a very recent study reported that deletion of Atg7 protects against axonal degeneration induced by a neurotoxin or axotomy (Cheng et al., 2011). These findings suggest that autophagy may regulate homeostasis of axons in a context-dependent manner. Mossy fiber sprouting is a characteristic pathological change in the hippocampus in epileptic brains (Sutula et al., 1989) which involves an abnormal growth of the mossy fiber axons of dentate granule cells. Although its role in epileptogenesis remains debatable, it will be of interest to see whether there is abnormal mossy fiber growth in TSC1flox/flox;CaMKIIα-Cre and Atg7flox/flox;CaMKIIα-Cre mice. Mitophagy is a cellular process by which damaged mitochondria are degraded through the autophagy pathway (Wang and Klionsky, 2011). Autophagy plays an important role in homeostasis of mitochondria (Harris and Rubinsztein, 2011). A recent study reported that embryonic deletion of TSC1 leads to a 10-fold increase in mitochondria (Goto et al., 2011). Therefore, altered mitochondrial homeostasis from hyperactivation of mTOR and impaired autophagy may trigger epileptogenesis. In addition, recent studies revealed that neurons with a TSC1 deletion became sensitive to stress (Di Nardo et al., 2009; Ng et al., 2011). As both the mTOR and autophagy pathways are critical in responding to stress, it is possible that the neurons with impaired autophagy observed in TSC may become less able to cope with stress, resulting in altered neuronal excitability. Finally, a recent study also reported that p62 associates with mTOR complex 1 and modulates mTOR signaling in response to nutrient availability (Duran et al., 2011). However, we did not find any significant alteration of p-S6 in Atg7KO mice (Fig. 5a,d). Thus, our data suggest that autophagy impairment leads to spontaneous seizures, independent of mTOR activity secondary to autophagy inactivation in our Atg7KO model.
Developmental and cell-type-specific contributions of the TSC/mTOR/autophagy pathway to epileptogenesis
As a genetically inherited disease, it is expected that TSC function is impaired from birth, and thus TSC mutation exerts its epileptogenic effects either through modification of brain development or through its continual effects on relatively mature neurons. Using the CaMKIIα Cre line, we found that deletion of either TSC1 or Atg7 in relatively mature mouse neurons at 21–28 d of age (Tsien et al., 1996) is sufficient to promote epileptogenesis, supporting the notion that the effects of loss of TSC1 or Atg7 in mature neurons are capable of recapitulating the epileptic phenotype. However, because Cre is expressed around postnatal days 14–21 in the CaMKIIα Cre line, we cannot necessarily rule out a contribution from a possible alteration in later brain development. In light of our findings, we propose that epileptogenesis in the TSC1 model is not restricted to a developmental time point but may, in fact, be a continuous process throughout the course of life. This hypothesis is also clinically relevant. Although the vast majority of TSC patients first develop epilepsy as infants, a small fraction of patients do not show seizures until adolescence or adulthood (Chu-Shore et al., 2010). Our observation provides credence to the concept that pharmacological intervention, by targeting the TSC/mTOR/autophagy pathway, could still be effective at a later point in life in TSC patients or in those with a later onset of seizure manifestation.
TSC impairment affects multiple cell types, including various subsets of neurons and glia. Recent studies revealed that in vivo broad deletion of TSC1 in neurons results in seizures and premature death (Meikle et al., 2008). Mice with TSC1 deletion in astrocytes also developed severe seizures (Zeng et al., 2008). However, interestingly, other studies have shown that TSC1 deletion restricted to GABAergic neurons does not result in spontaneous seizures (Wang et al., 2007; Fu et al., 2011), indicating that the pathogenic effect from TSC1 inactivation may be neuron subtype specific, i.e., affecting excitatory and inhibitory neurons differently. In the present study, we found that mice with selective deletion of TSC1 mainly in excitatory neurons (using the CaMKIIα-cre line) developed very severe seizures. Thus, our data suggest that dysregulated mTOR in excitatory neurons may play a major role in epileptogenesis. We demonstrated that deficiency of autophagy activity in excitatory neurons also results in epilepsy. Future studies will determine whether there are any similar epileptogenic effects of inactivation of autophagy in GABAergic inhibitory neurons and astrocytes.
Impaired autophagy is one of the mechanisms contributing to epileptogenesis in TSC
In the present study, mice with a deletion of TSC1 or PTEN developed much more severe seizures, including earlier onset and higher mortality when compared with Atg7KO mice (Figs. 1a,b, 6a,b). Given the multiple processes under the control of the mTOR pathway, it is likely that other epileptogenic alterations occur concomitantly after disinhibition of mTOR because of loss of TSC1 or PTEN function. Therefore, our data suggest that impairment of autophagy is likely one of several epileptogenic mechanisms downstream of mTOR. In addition, we observed that the degree of autophagy impairment in Atg7KO mice exceeds that of TSC1KO or PTENKO mice. The possible interpretation is that Atg7 is essential for autophagy, whereas mTOR plays a modulatory role. This is exemplified by the extensive accumulation of p62 in Atg7KO mice (Fig. 5a,c,e), which is mostly absent in TSC1KO and PTENKO mice (J. McMahon and Y. Huang, unpublished data). Interestingly, p62 accumulation is striking in human TSC brains. We speculate that interspecies variation may account for the differences in p62 accumulation between human TSC and TSC1KO mice. It may also reflect the time period in which autophagy has been impaired, ranging from 13 to 56 years in the human TSC patients in the present study versus only a few weeks after TSC1 deletion in mice.
In summary, our data suggest that impaired autophagy is a contributing factor to epileptogenesis in TSC. We believe that future studies to identify other contributing factors downstream of mTOR are a priority. We hope that, through identification of additional pathogenic mechanisms in TSC, it will become possible to devise novel therapeutic strategies to prevent or reverse the epileptogenic modifications brought on by TSC mutation and, ultimately, to alleviate seizures while avoiding adverse side effects such as the immunosuppression and growth retardation typically associated with the mTOR inhibitor rapamycin (Anderl et al., 2011). In addition, mTOR activity was found to be elevated in multiple acquired epilepsy models (Buckmaster et al., 2009; Zeng et al., 2009; Huang et al., 2010; Raffo et al., 2011; Talos et al., 2012; van Vliet et al., 2012); therefore, it will be of interest to determine whether autophagy is also altered in acquired epilepsy.
Footnotes
This work was supported by NIH–NINDS Grants R01NS062068 (Y.H.) and R01NS060123 (Z.Y.), a National Alliance for Research on Schizophrenia and Depression Young Investigator Award (Y.H.), and NIH–NIDDK Grant K08DK088950 (X. Z.). We thank Christine Sheehan and Ann Dence for assistance with brain slide preparation. Human tissues were obtained from the NICHD Brain and Tissue Bank for Developmental Disorders at the University of Maryland at Baltimore (Baltimore, MD).
The authors declare no competing financial interests.
References
- Anderl S, Freeland M, Kwiatkowski DJ, Goto J. Therapeutic value of prenatal rapamycin treatment in a mouse brain model of tuberous sclerosis complex. Hum Mol Genet. 2011;20:4597–4604. doi: 10.1093/hmg/ddr393. [DOI] [PMC free article] [PubMed] [Google Scholar]
- Baybis M, Yu J, Lee A, Golden JA, Weiner H, McKhann G, 2nd, Aronica E, Crino PB. mTOR cascade activation distinguishes tubers from focal cortical dysplasia. Ann Neurol. 2004;56:478–487. doi: 10.1002/ana.20211. [DOI] [PubMed] [Google Scholar]
- Buckmaster PS, Ingram EA, Wen X. Inhibition of the mammalian target of rapamycin signaling pathway suppresses dentate granule cell axon sprouting in a rodent model of temporal lobe epilepsy. J Neurosci. 2009;29:8259–8269. doi: 10.1523/JNEUROSCI.4179-08.2009. [DOI] [PMC free article] [PubMed] [Google Scholar]
- Cao R, Li A, Cho HY. mTOR signaling in epileptogenesis: too much of a good thing? J Neurosci. 2009;29:12372–12373. doi: 10.1523/JNEUROSCI.3486-09.2009. [DOI] [PMC free article] [PubMed] [Google Scholar]
- Chen N, Debnath J. Autophagy and tumorigenesis. FEBS Lett. 2010;584:1427–1435. doi: 10.1016/j.febslet.2009.12.034. [DOI] [PMC free article] [PubMed] [Google Scholar]
- Cheng HC, Kim SR, Oo TF, Kareva T, Yarygina O, Rzhetskaya M, Wang C, During M, Talloczy Z, Tanaka K, Komatsu M, Kobayashi K, Okano H, Kholodilov N, Burke RE. Akt suppresses retrograde degeneration of dopaminergic axons by inhibition of macroautophagy. J Neurosci. 2011;31:2125–2135. doi: 10.1523/JNEUROSCI.5519-10.2011. [DOI] [PMC free article] [PubMed] [Google Scholar]
- Chu-Shore CJ, Major P, Camposano S, Muzykewicz D, Thiele EA. The natural history of epilepsy in tuberous sclerosis complex. Epilepsia. 2010;51:1236–1241. doi: 10.1111/j.1528-1167.2009.02474.x. [DOI] [PMC free article] [PubMed] [Google Scholar]
- Coupé B, Ishii Y, Dietrich MO, Komatsu M, Horvath TL, Bouret SG. Loss of autophagy in pro-opiomelanocortin neurons perturbs axon growth and causes metabolic dysregulation. Cell Metab. 2012;15:247–255. doi: 10.1016/j.cmet.2011.12.016. [DOI] [PMC free article] [PubMed] [Google Scholar]
- Crino PB, Nathanson KL, Henske EP. The tuberous sclerosis complex. N Engl J Med. 2006;355:1345–1356. doi: 10.1056/NEJMra055323. [DOI] [PubMed] [Google Scholar]
- Deretic V, Levine B. Autophagy, immunity, and microbial adaptations. Cell Host Microbe. 2009;5:527–549. doi: 10.1016/j.chom.2009.05.016. [DOI] [PMC free article] [PubMed] [Google Scholar]
- Di Nardo A, Kramvis I, Cho N, Sadowski A, Meikle L, Kwiatkowski DJ, Sahin M. Tuberous sclerosis complex activity is required to control neuronal stress responses in an mTOR-dependent manner. J Neurosci. 2009;29:5926–5937. doi: 10.1523/JNEUROSCI.0778-09.2009. [DOI] [PMC free article] [PubMed] [Google Scholar]
- Duran A, Amanchy R, Linares JF, Joshi J, Abu-Baker S, Porollo A, Hansen M, Moscat J, Diaz-Meco MT. p62 is a key regulator of nutrient sensing in the mTORC1 pathway. Mol Cell. 2011;44:134–146. doi: 10.1016/j.molcel.2011.06.038. [DOI] [PMC free article] [PubMed] [Google Scholar]
- European Chromosome 16 Tuberous Sclerosis Consortium. Identification and characterization of the tuberous sclerosis gene on chromosome 16. Cell. 1993;75:1305–1315. doi: 10.1016/0092-8674(93)90618-z. [DOI] [PubMed] [Google Scholar]
- Fu C, Cawthon B, Clinkscales W, Bruce A, Winzenburger P, Ess KC. GABAergic interneuron development and function is modulated by the Tsc1 gene. Cereb Cortex. 2011;22:2111–2119. doi: 10.1093/cercor/bhr300. [DOI] [PMC free article] [PubMed] [Google Scholar]
- Goto J, Talos DM, Klein P, Qin W, Chekaluk YI, Anderl S, Malinowska IA, Di Nardo A, Bronson RT, Chan JA, Vinters HV, Kernie SG, Jensen FE, Sahin M, Kwiatkowski DJ. Regulable neural progenitor-specific Tsc1 loss yields giant cells with organellar dysfunction in a model of tuberous sclerosis complex. Proc Natl Acad Sci U S A. 2011;108:E1070–E1079. doi: 10.1073/pnas.1106454108. [DOI] [PMC free article] [PubMed] [Google Scholar]
- Groszer M, Erickson R, Scripture-Adams DD, Lesche R, Trumpp A, Zack JA, Kornblum HI, Liu X, Wu H. Negative regulation of neural stem/progenitor cell proliferation by the Pten tumor suppressor gene in vivo. Science. 2001;294:2186–2189. doi: 10.1126/science.1065518. [DOI] [PubMed] [Google Scholar]
- Hara T, Nakamura K, Matsui M, Yamamoto A, Nakahara Y, Suzuki-Migishima R, Yokoyama M, Mishima K, Saito I, Okano H, Mizushima N. Suppression of basal autophagy in neural cells causes neurodegenerative disease in mice. Nature. 2006;441:885–889. doi: 10.1038/nature04724. [DOI] [PubMed] [Google Scholar]
- Harris H, Rubinsztein DC. Control of autophagy as a therapy for neurodegenerative disease. Nat Rev Neurol. 2011;8:108–117. doi: 10.1038/nrneurol.2011.200. [DOI] [PubMed] [Google Scholar]
- Holmes GL, Stafstrom CE. Tuberous sclerosis complex and epilepsy: recent developments and future challenges. Epilepsia. 2007;48:617–630. doi: 10.1111/j.1528-1167.2007.01035.x. [DOI] [PubMed] [Google Scholar]
- Huang X, Zhang H, Yang J, Wu J, McMahon J, Lin Y, Cao Z, Gruenthal M, Huang Y. Pharmacological inhibition of the mammalian target of rapamycin pathway suppresses acquired epilepsy. Neurobiol Dis. 2010;40:193–199. doi: 10.1016/j.nbd.2010.05.024. [DOI] [PMC free article] [PubMed] [Google Scholar]
- Ichimura Y, Komatsu M. Selective degradation of p62 by autophagy. Semin Immunopathol. 2010;32:431–436. doi: 10.1007/s00281-010-0220-1. [DOI] [PubMed] [Google Scholar]
- Inoki K, Li Y, Zhu T, Wu J, Guan KL. TSC2 is phosphorylated and inhibited by Akt and suppresses mTOR signalling. Nat Cell Biol. 2002;4:648–657. doi: 10.1038/ncb839. [DOI] [PubMed] [Google Scholar]
- Kaushik S, Rodriguez-Navarro JA, Arias E, Kiffin R, Sahu S, Schwartz GJ, Cuervo AM, Singh R. Autophagy in hypothalamic AgRP neurons regulates food intake and energy balance. Cell Metab. 2011;14:173–183. doi: 10.1016/j.cmet.2011.06.008. [DOI] [PMC free article] [PubMed] [Google Scholar]
- Kim J, Huang WP, Stromhaug PE, Klionsky DJ. Convergence of multiple autophagy and cytoplasm to vacuole targeting components to a perivacuolar membrane compartment prior to de novo vesicle formation. J Biol Chem. 2002;277:763–773. doi: 10.1074/jbc.M109134200. [DOI] [PMC free article] [PubMed] [Google Scholar]
- Kim J, Kundu M, Viollet B, Guan KL. AMPK and mTOR regulate autophagy through direct phosphorylation of Ulk1. Nat Cell Biol. 2011;13:132–141. doi: 10.1038/ncb2152. [DOI] [PMC free article] [PubMed] [Google Scholar]
- Knecht E, Aguado C, Sarkar S, Korolchuk VI, Criado-García O, Vernia S, Boya P, Sanz P, Rodríguez de Córdoba S, Rubinsztein DC. Impaired autophagy in Lafora disease. Autophagy. 2010;6:991–993. doi: 10.4161/auto.6.7.13308. [DOI] [PMC free article] [PubMed] [Google Scholar]
- Komatsu M. Potential role of p62 in tumor development. Autophagy. 2011;7:1088–1090. doi: 10.4161/auto.7.9.16474. [DOI] [PubMed] [Google Scholar]
- Komatsu M, Waguri S, Ueno T, Iwata J, Murata S, Tanida I, Ezaki J, Mizushima N, Ohsumi Y, Uchiyama Y, Kominami E, Tanaka K, Chiba T. Impairment of starvation-induced and constitutive autophagy in Atg7-deficient mice. J Cell Biol. 2005;169:425–434. doi: 10.1083/jcb.200412022. [DOI] [PMC free article] [PubMed] [Google Scholar]
- Komatsu M, Waguri S, Chiba T, Murata S, Iwata J, Tanida I, Ueno T, Koike M, Uchiyama Y, Kominami E, Tanaka K. Loss of autophagy in the central nervous system causes neurodegeneration in mice. Nature. 2006;441:880–884. doi: 10.1038/nature04723. [DOI] [PubMed] [Google Scholar]
- Komatsu M, Wang QJ, Holstein GR, Friedrich VL, Jr, Iwata J, Kominami E, Chait BT, Tanaka K, Yue Z. Essential role for autophagy protein Atg7 in the maintenance of axonal homeostasis and the prevention of axonal degeneration. Proc Natl Acad Sci U S A. 2007;104:14489–14494. doi: 10.1073/pnas.0701311104. [DOI] [PMC free article] [PubMed] [Google Scholar]
- Kwiatkowski DJ, Zhang H, Bandura JL, Heiberger KM, Glogauer M, el-Hashemite N, Onda H. A mouse model of TSC1 reveals sex-dependent lethality from liver hemangiomas, and up-regulation of p70S6 kinase activity in Tsc1 null cells. Hum Mol Genet. 2002;11:525–534. doi: 10.1093/hmg/11.5.525. [DOI] [PubMed] [Google Scholar]
- Laplante M, Sabatini DM. mTOR Signaling. Cold Spring Harb Perspect Biol. 2012;4:pii:a011593. doi: 10.1101/cshperspect.a011593. [DOI] [PMC free article] [PubMed] [Google Scholar]
- Levine B, Klionsky DJ. Development by self-digestion: molecular mechanisms and biological functions of autophagy. Dev Cell. 2004;6:463–477. doi: 10.1016/s1534-5807(04)00099-1. [DOI] [PubMed] [Google Scholar]
- Levine B, Kroemer G. Autophagy in the pathogenesis of disease. Cell. 2008;132:27–42. doi: 10.1016/j.cell.2007.12.018. [DOI] [PMC free article] [PubMed] [Google Scholar]
- Meikle L, Pollizzi K, Egnor A, Kramvis I, Lane H, Sahin M, Kwiatkowski DJ. Response of a neuronal model of tuberous sclerosis to mammalian target of rapamycin (mTOR) inhibitors: effects on mTORC1 and Akt signaling lead to improved survival and function. J Neurosci. 2008;28:5422–5432. doi: 10.1523/JNEUROSCI.0955-08.2008. [DOI] [PMC free article] [PubMed] [Google Scholar]
- Meyer A, Beck E. The hippocampal formation in temporal lobe epilepsy. Proc R Soc Med. 1955;48:457–462. doi: 10.1177/003591575504800618. [DOI] [PMC free article] [PubMed] [Google Scholar]
- Mizushima N, Yamamoto A, Matsui M, Yoshimori T, Ohsumi Y. In vivo analysis of autophagy in response to nutrient starvation using transgenic mice expressing a fluorescent autophagosome marker. Mol Biol Cell. 2004;15:1101–1111. doi: 10.1091/mbc.E03-09-0704. [DOI] [PMC free article] [PubMed] [Google Scholar]
- Mizushima N, Levine B, Cuervo AM, Klionsky DJ. Autophagy fights disease through cellular self-digestion. Nature. 2008;451:1069–1075. doi: 10.1038/nature06639. [DOI] [PMC free article] [PubMed] [Google Scholar]
- Ng S, Wu YT, Chen B, Zhou J, Shen HM. Impaired autophagy due to constitutive mTOR activation sensitizes TSC2-null cells to cell death under stress. Autophagy. 2011;7:1173–1186. doi: 10.4161/auto.7.10.16681. [DOI] [PubMed] [Google Scholar]
- Onda H, Crino PB, Zhang H, Murphey RD, Rastelli L, Gould Rothberg BE, Kwiatkowski DJ. Tsc2 null murine neuroepithelial cells are a model for human tuber giant cells, and show activation of an mTOR pathway. Mol Cell Neurosci. 2002;21:561–574. doi: 10.1006/mcne.2002.1184. [DOI] [PubMed] [Google Scholar]
- Padberg GW, Schot JD, Vielvoye GJ, Bots GT, de Beer FC. Lhermitte-Duclos disease and Cowden disease: a single phakomatosis. Ann Neurol. 1991;29:517–523. doi: 10.1002/ana.410290511. [DOI] [PubMed] [Google Scholar]
- Parkhitko A, Myachina F, Morrison TA, Hindi KM, Auricchio N, Karbowniczek M, Wu JJ, Finkel T, Kwiatkowski DJ, Yu JJ, Henske EP. Tumorigenesis in tuberous sclerosis complex is autophagy and p62/sequestosome 1 (SQSTM1)-dependent. Proc Natl Acad Sci U S A. 2011;108:12455–12460. doi: 10.1073/pnas.1104361108. [DOI] [PMC free article] [PubMed] [Google Scholar]
- Prather P, de Vries PJ. Behavioral and cognitive aspects of tuberous sclerosis complex. J Child Neurol. 2004;19:666–674. doi: 10.1177/08830738040190090601. [DOI] [PubMed] [Google Scholar]
- Raffo E, Coppola A, Ono T, Briggs SW, Galanopoulou AS. A pulse rapamycin therapy for infantile spasms and associated cognitive decline. Neurobiol Dis. 2011;43:322–329. doi: 10.1016/j.nbd.2011.03.021. [DOI] [PMC free article] [PubMed] [Google Scholar]
- Rubinsztein DC. The roles of intracellular protein-degradation pathways in neurodegeneration. Nature. 2006;443:780–786. doi: 10.1038/nature05291. [DOI] [PubMed] [Google Scholar]
- Rubinsztein DC, DiFiglia M, Heintz N, Nixon RA, Qin ZH, Ravikumar B, Stefanis L, Tolkovsky A. Autophagy and its possible roles in nervous system diseases, damage and repair. Autophagy. 2005;1:11–22. doi: 10.4161/auto.1.1.1513. [DOI] [PubMed] [Google Scholar]
- Sunnen CN, Brewster AL, Lugo JN, Vanegas F, Turcios E, Mukhi S, Parghi D, D'Arcangelo G, Anderson AE. Inhibition of the mammalian target of rapamycin blocks epilepsy progression in NS-Pten conditional knockout mice. Epilepsia. 2011;52:2065–2075. doi: 10.1111/j.1528-1167.2011.03280.x. [DOI] [PMC free article] [PubMed] [Google Scholar]
- Sutula T, Cascino G, Cavazos J, Parada I, Ramirez L. Mossy fiber synaptic reorganization in the epileptic human temporal lobe. Ann Neurol. 1989;26:321–330. doi: 10.1002/ana.410260303. [DOI] [PubMed] [Google Scholar]
- Suzuki K, Kirisako T, Kamada Y, Mizushima N, Noda T, Ohsumi Y. The pre-autophagosomal structure organized by concerted functions of APG genes is essential for autophagosome formation. EMBO J. 2001;20:5971–5981. doi: 10.1093/emboj/20.21.5971. [DOI] [PMC free article] [PubMed] [Google Scholar]
- Takamura A, Komatsu M, Hara T, Sakamoto A, Kishi C, Waguri S, Eishi Y, Hino O, Tanaka K, Mizushima N. Autophagy-deficient mice develop multiple liver tumors. Genes Dev. 2011;25:795–800. doi: 10.1101/gad.2016211. [DOI] [PMC free article] [PubMed] [Google Scholar]
- Talos DM, Sun H, Zhou X, Fitzgerald EC, Jackson MC, Klein PM, Lan VJ, Joseph A, Jensen FE. The interaction between early life epilepsy and autistic-like behavioral consequences: a role for the mammalian target of rapamycin (mTOR) pathway. PloS One. 2012;7:e35885. doi: 10.1371/journal.pone.0035885. [DOI] [PMC free article] [PubMed] [Google Scholar]
- Tanida I, Ueno T, Kominami E. LC3 and autophagy. Methods Mol Biol. 2008;445:77–88. doi: 10.1007/978-1-59745-157-4_4. [DOI] [PubMed] [Google Scholar]
- Thiele EA. Managing epilepsy in tuberous sclerosis complex. J Child Neurol. 2004;19:680–686. doi: 10.1177/08830738040190090801. [DOI] [PubMed] [Google Scholar]
- Trombley IK, Mirra SS. Ultrastructure of tuberous sclerosis: cortical tuber and subependymal tumor. Ann Neurol. 1981;9:174–181. doi: 10.1002/ana.410090211. [DOI] [PubMed] [Google Scholar]
- Tsien JZ, Chen DF, Gerber D, Tom C, Mercer EH, Anderson DJ, Mayford M, Kandel ER, Tonegawa S. Subregion- and cell type-restricted gene knockout in mouse brain. Cell. 1996;87:1317–1326. doi: 10.1016/s0092-8674(00)81826-7. [DOI] [PubMed] [Google Scholar]
- van Slegtenhorst M, de Hoogt R, Hermans C, Nellist M, Janssen B, Verhoef S, Lindhout D, van den Ouweland A, Halley D, Young J, Burley M, Jeremiah S, Woodward K, Nahmias J, Fox M, Ekong R, Osborne J, Wolfe J, Povey S, Snell RG, et al. Identification of the tuberous sclerosis gene TSC1 on chromosome 9q34. Science. 1997;277:805–808. doi: 10.1126/science.277.5327.805. [DOI] [PubMed] [Google Scholar]
- van Vliet EA, Forte G, Holtman L, den Burger JC, Sinjewel A, de Vries HE, Aronica E, Gorter JA. Inhibition of mammalian target of rapamycin reduces epileptogenesis and blood-brain barrier leakage but not microglia activation. Epilepsia. 2012;53:1254–1263. doi: 10.1111/j.1528-1167.2012.03513.x. [DOI] [PubMed] [Google Scholar]
- Wang K, Klionsky DJ. Mitochondria removal by autophagy. Autophagy. 2011;7:297–300. doi: 10.4161/auto.7.3.14502. [DOI] [PMC free article] [PubMed] [Google Scholar]
- Wang Y, Greenwood JS, Calcagnotto ME, Kirsch HE, Barbaro NM, Baraban SC. Neocortical hyperexcitability in a human case of tuberous sclerosis complex and mice lacking neuronal expression of TSC1. Ann Neurol. 2007;61:139–152. doi: 10.1002/ana.21058. [DOI] [PubMed] [Google Scholar]
- Wong M. Mammalian target of rapamycin (mTOR) inhibition as a potential antiepileptogenic therapy: from tuberous sclerosis to common acquired epilepsies. Epilepsia. 2010;51:27–36. doi: 10.1111/j.1528-1167.2009.02341.x. [DOI] [PMC free article] [PubMed] [Google Scholar]
- Xie Z, Klionsky DJ. Autophagosome formation: core machinery and adaptations. Nat Cell Biol. 2007;9:1102–1109. doi: 10.1038/ncb1007-1102. [DOI] [PubMed] [Google Scholar]
- Yamanouchi H, Jay V, Rutka JT, Takashima S, Becker LE. Evidence of abnormal differentiation in giant cells of tuberous sclerosis. Pediatr Neurol. 1997;17:49–53. doi: 10.1016/s0887-8994(97)00036-2. [DOI] [PubMed] [Google Scholar]
- Yang Z, Klionsky DJ. Eaten alive: a history of macroautophagy. Nat Cell Biol. 2010;12:814–822. doi: 10.1038/ncb0910-814. [DOI] [PMC free article] [PubMed] [Google Scholar]
- Zeng LH, Xu L, Gutmann DH, Wong M. Rapamycin prevents epilepsy in a mouse model of tuberous sclerosis complex. Ann Neurol. 2008;63:444–453. doi: 10.1002/ana.21331. [DOI] [PMC free article] [PubMed] [Google Scholar]
- Zeng LH, Rensing NR, Wong M. The mammalian target of rapamycin signaling pathway mediates epileptogenesis in a model of temporal lobe epilepsy. J Neurosci. 2009;29:6964–6972. doi: 10.1523/JNEUROSCI.0066-09.2009. [DOI] [PMC free article] [PubMed] [Google Scholar]
- Zhou J, Blundell J, Ogawa S, Kwon CH, Zhang W, Sinton C, Powell CM, Parada LF. Pharmacological inhibition of mTORC1 suppresses anatomical, cellular, and behavioral abnormalities in neural-specific Pten knock-out mice. J Neurosci. 2009;29:1773–1783. doi: 10.1523/JNEUROSCI.5685-08.2009. [DOI] [PMC free article] [PubMed] [Google Scholar]
- Zois CE, Giatromanolaki A, Sivridis E, Papaiakovou M, Kainulainen H, Koukourakis MI. “Autophagic flux” in normal mouse tissues: focus on endogenous LC3A processing. Autophagy. 2011;7:1371–1378. doi: 10.4161/auto.7.11.16664. [DOI] [PubMed] [Google Scholar]