Abstract
We apply optical manipulation to prepare lipid bilayers between pairs of water droplets immersed in an oil matrix. These droplet pairs have a well-defined geometry allowing use of droplet shape analysis to perform quantitative studies of the dynamics during the bilayer formation and to determine time-dependent values for the droplet volumes, bilayer radius, bilayer contact angle, and droplet centerline approach velocity. During bilayer formation, the contact angle rises steadily to an equilibrium value determined by the bilayer adhesion energy. When there is a salt concentration imbalance between the droplets, there is a measurable change in droplet volume. We present an analytical expression for this volume change and use this expression to calculate the bilayer permeability to water.
Introduction
The ability to form lipid bilayers at the interfaces between oil and water phases has received significant attention over the past several years. Lipid molecules introduced in the oil or water phase self-assemble to form lipid monolayers at the interface between the two phases. When two lipid monolayers are brought into contact, they expel the intervening oil film to form lipid bilayers. This was experimentally observed in emulsion systems consisting of aqueous droplets formed in a lipid-oil solution.1 Funakoshi et al. were the first to demonstrate the viability of this technique as a means to study transmembrane protein function using a microfluidic chip.2 Following this report Holden et al. demonstrated that lipid bilayers could be formed at the interface of aqueous droplets placed in an oil medium containing lipid molecules. The drops were mechanically placed on a poly(methyl methacrylate) surface with a square array of micro-machined dimples.3 In this approach the aqueous drops were brought into contact using a micromanipulator and the resulting lipid bilayers were referred to as “Droplet Interface Bilayers.” Other approaches using droplet based emulsions to form lipid bilayers include flow based systems,4 electrowetting driven droplet contact,5 contacting sessile aqueous droplets adhering to a measurement electrode6 and dielectrophoresis based droplet contact.7 Droplet based lipid bilayer systems have also been used to build devices such as protein diodes8 and batteries.9
Recently, our group demonstrated that lipid bilayers could be formed between two aqueous droplets containing lipid vesicles in a mineral oil matrix using laser heating based convection to drive drop motion.10 The use of mineral oil as the oil matrix is dictated largely by the need for a large contact angle for the aqueous droplets on the polystyrene Petri dish that houses the emulsion. This is a necessary condition in order to allow the convection currents to mobilize the droplets.10 In all the above-mentioned approaches, the oil film between the approaching lipid monolayers thins due to the drainage of the intervening oil and eventually leads to the formation of a lipid bilayer. While there will always be a residual amount of the oil phase trapped in the lipid bilayer, it is assumed to be negligible as per the values obtained from capacitance measurements of the bilayer membrane.2, 3, 11 The dynamics of the formation of such droplet bilayers has never been investigated. Optical droplet based manipulation techniques,10, 12–14 offer a unique opportunity to study the thin film dynamics that precede the formation of such droplet bilayers. In this report we provide quantitative details of the dynamics of the formation of the lipid bilayer interface as the oil drains between two contacting lipid monolayers in a water-in-mineral oil emulsion system.
A key factor in our studies is that the droplets are free standing on a surface and too small to exhibit gravitational shape changes.15, 16 This allows the use of droplet shape analysis to determine time-dependent droplet volumes, bilayer radius, bilayer contact angle, and droplet centerline approach velocities.
The contact angle is an important parameter for the bilayer. The bilayer interface, often described as a thin liquid film, is in contact with the bulk mineral oil in a region called the Plateau Border. The three phase contact line is defined as the line at which the convex droplet surfaces in the Plateau border region meet with the plane of the thin film. The contact angle is defined as the angle that is subtended between the two convex meniscus surfaces17 and is a macroscopic quantity that can be easily measured. The contact angle indicates the strength of the interaction energy between the two drops.1
We also use droplet shape analysis to investigate the permeability of these lipid bilayers to water in response to an osmotic gradient due to a differential salt concentration across the lipid bilayer interface. An analytical model is developed to account for the changing droplet volumes and the water permeability as a function of time. We observe that the transport of the water molecules is observed only once the contact angle between the adhering water droplets reaches a value greater than ~84 degrees.
Materials and Methods
DphPC (1,2-diphytanoyl-sn-glycero-3-phosphocholine) was purchased from Avanti Polar Lipids Inc. The fluorescent lipid probe, NBD-PE (N-(7-nitrobenz-2-oxa-1,3-diazol-4-yl)-1,2-dihexadecanoyl-sn-glycero-3-phosphoethanolamine, triethylammonium salt) was purchased from Invitrogen Corporation. Deionized water was used for the preparation of all buffers after filtration using a 0.2-μm filter. Phosphate buffers were used for all experiments. Lipids were dissolved in chloroform and appropriate volumes were measured to transfer 100 mol% DphPC (Solution B) or 99 mol% DphPC + 1 mol% NBD-PE (Solution A) into glass vials. The chloroform was evaporated in a steady stream of nitrogen for about 30 minutes under a fume hood. The resulting dry lipid film was hydrated with deionized water, vortexed vigorously, and stored overnight at 4 °C. Lipid vesicles were extruded using 100 nm polycarbonate membranes or a sequence of 400 nm and 100 nm polycarbonate membranes and a mini extruder (Avanti Polar Lipids Inc) with a minimum of 19 passes through the extruder to yield a 2.36 mM lipid solution in deionized water. The final lipid concentration in the aqueous drops varied based on further dilution with the requisite buffers. Aqueous drops in the oil phase were prepared by drawing a 34 gauge syringe needle (Microfil, WPI) containing the lipid solution through 3 to 4 mL of light mineral oil (Sigma M5310 BioXtra, sterile-filtered, 0.85 specific gravity) placed in a Petri dish. Prior to use, the Petri dish was spray cleaned with a 70% ethanol in water solution and dried using Kimwipes (Kimberly-Clark®) and compressed air. For measurements on the water permeability of the lipid bilayers, a gradient in NaCl was established across the lipid membrane. Table 1 lists the salt concentrations used in creating the osmotic gradient for each droplet pair. Sørensen’s phosphate buffer was used in this study. Droplets with lower salt concentrations were made using the lipid vesicle solution containing NBD-PE, i.e. solution A, to easily distinguish droplets with high and low salt concentrations prior to laser manipulation.
Table 1.
Solute Concentrations for Water Permeability Experiments
| Droplet | DphPC:NBD-PE | Sørensen’s Phosphate Buffer [mM] | NaCl [mM] | Total Solute [mM] |
|---|---|---|---|---|
| A | 99:1 (mol %) | 75.75 | 0 | 75.75 |
| B | 100:0 (mol %) | 75.75 | 55.5 | 131.25 |
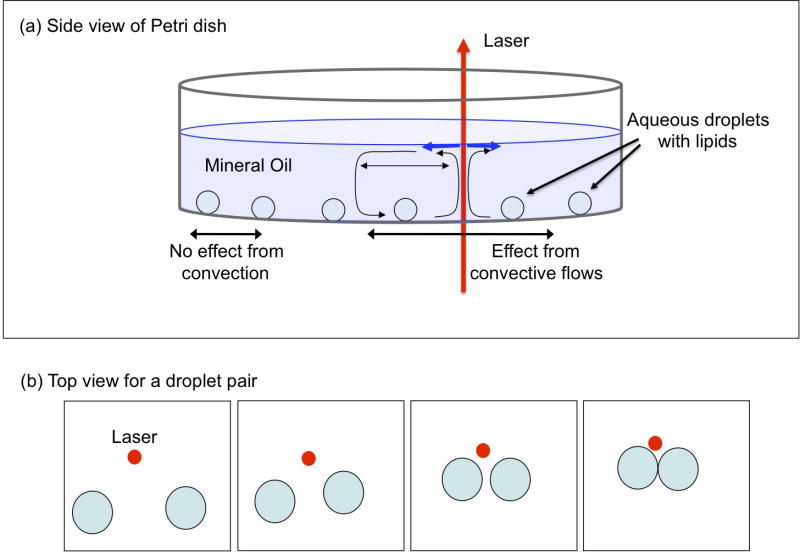
All measurements were performed on a Nikon TE-2000 microscope platform. A 1457-nm infrared diode laser (FOL 1402PLY-617-1457, Furukawa Electric) was used for establishing convection currents in the mineral oil. Two lenses in a 4f arrangement were used to facilitate alignment and focus the laser at the microscope image plane. Droplet images were acquired using a 4x objective in the light path and a Retiga Exi camera (QImaging). Brightfield imaging was performed during droplet manipulation and for droplet shape analysis. Fluorescence imaging was used to identify droplets based on fluorescent lipid addition (see Table 1). Fluorescence measurements were performed using a mercury lamp as the excitation source with the upper turret of the TE-2000 dedicated to this light path. A 480-nm filter in this incident light path was used as the excitation filter and a 535-nm filter (Chroma) in the emission filter wheel was used to collect the fluorescence emission signal from the droplets. The emission filter wheel was fitted before the camera in the exit port of the microscope. The laser power was measured at the 4X objective using a power meter (Coherent model 210) with and without a Petri dish containing mineral oil. Typical laser power for droplet manipulation is ~10 mW. The presence of the mineral oil reduces the power of the laser that is transmitted through the oil layer by approximately 10% for the 1.5 mm depth of mineral oil (4 mL of oil), resulting in ~1 mW deposited in the mineral oil. The local heating of the mineral oil results in toriodal Marangoni (theromocapillary) convection currents.10, 18, 19 These currents are used to steer lipid-coated water droplets into contact and adhesion. A schematic showing the droplet motion is presented in Figure 1. The laser is positioned some distance away from the droplet pair that is to be manipulated. No direct heating of the water droplets was allowed during these experiments. The laser heating zone is easily observed in brightfield as a shadowgraph of the thermal gradient produced by the laser. When the current to the laser is turned on or off quickly, the shadowgraph from the thermal gradient appears or disappears in less than 100 ms. A gradual increase in the laser power results in the drops being propelled towards the laser and this is a hallmark of convective based fluid flows.10, 13 Depending on the degree of adhesion between the droplet and the polystyrene surface, we sometimes observe one droplet in the pair moving more rapidly towards the laser. Often there is little control over how each droplet will interact with the polystyrene Petri dish surface locally. We have also observed that a slight horizontal mechanical vibration often suffices to dislodge droplets that may be adhering to the Petri dish surface more strongly than is typical. The laser position is manipulated to gradually move away from the approaching droplets to reduce the speed of approach of the droplets. When the droplets are in contact as assessed by the real time streaming images of the droplets observed on the computer screen (image acquisition software written in Labview™), the laser is switched off and the droplets interfaces interact with each other, gradually approaching each other and eventually flattening out to form a bilayer as the residual mineral oil in the film is squeezed out (see video in Supporting Information). At high laser powers, the droplets often adhere only briefly and coalesce thereafter. This effect is expected if the convective flows are strong and the droplet interfaces are not given sufficient time to interact to form a stable interface. With appropriate steps taken to control droplet-surface interactions and laser power, droplet bilayers can be reliably produced.
Figure 1.
Schematic of the nature of convection currents set up in the mineral oil-water droplet system. The presence of the laser results in a temperature dependent change in the surface tension at the air-mineral oil interface. This effect draws the water droplets within a certain radius towards the laser beam. Proper steering of the location of the beam results in selective droplet-droplet adhesion.
Droplet Shape Measurements
We used droplet shape analysis to find droplet volumes, bilayer radii, contact angles, droplet-droplet approach velocity, and bilayer permeability. Droplets were modeled as spheres with truncations at the bilayer surface and at the substrate surface. This assumption is valid when the radii of the droplets are sufficiently small that the influence of gravity on the droplet shape is negligible.15, 16 In this case the internal pressure in the droplet is uniform and the curvature is also uniform. Droplet volumes and other parameters were determined by fitting circles to the droplet outlines and performing corrections for the tilt of the bilayer interface and truncations at the bilayer and substrate surfaces.
Circle fitting was performed using the public domain, Java-based image processing program ImageJ with a script for automation. Individual images were read into ImageJ as an image stack. “Threshold” and “Analyze Particles” operations were used to find a Region of Interest (ROI) associated with each droplet outline. Since each ROI selection comprises vertices of a polygon, a “Draw” operation was used to produce non-zero points corresponding to the full droplet outline against a zero background. A circle was fit to these non-zero points using an ImageJ circle fitting routine20 based on Chernov’s circle-fitting algorithm.21 For adhering droplets, the “Watershed” operation was used to split the thresholded droplet images before using “Analyze Particles” to obtain two outlines from an adhered pair of droplets. These split droplet outlines comprised a circular portion and a portion along the bilayer or contact surface. The contact portion was occasionally jagged. The contact portion of the split outline along the droplet contact was removed by performing an image multiply of the split outline with the outline points before the watershed processing, resulting in only the circular portion of the split droplet. Image creation dates were used to obtain the time for each data point.
Theory – Droplet Geometric Calculations
Simple geometric relations were used to determine droplet shapes using the parameters from the circle fitting. Since gravity has only a minimal influence on the droplet shapes, the droplet surfaces can be easily modeled since the surfaces acquire a spherical shape due to the droplets minimizing their surface area subject to the interfacial tensions on each surface. For a curved surface under tension, there is a higher pressure inside the curved surface. This pressure increase ΔP is given by the Young Laplace equation, which for a spherical surface is
| (1) |
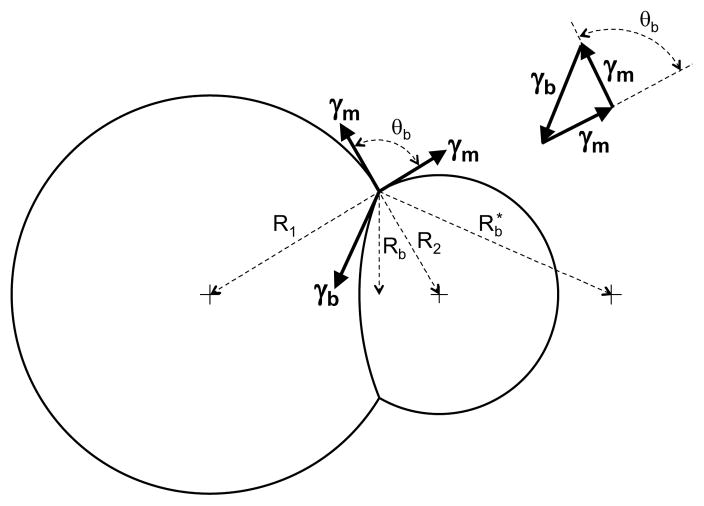
where γ is the interfacial tension and R is the radius of curvature. When the droplets have different radii, the smaller droplet will have a higher pressure, causing the bilayer to bulge into the larger droplet. This is illustrated in Figure 2, which diagrams how the interfacial tensions determine the droplet shapes. We denote the interfacial tensions on the outer water/lipid/oil boundary (the lipid monolayer) as γm and the interfacial tension on the bilayer surface as γb. The radii of the two droplets are R1 and R2. We arbitrarily refer to the larger droplet as droplet 1. The radius of curvature for the bilayer bulge is Rb*. The vectors for the three interfacial tensions at the three phase contact line (i.e., the outer bilayer boundary) combine to produce no net force, as is seen from the vector diagram in the upper right of Figure 2. Equating the projections of the three vectors onto a line parallel to the γb vector gives an equation for the bilayer contact angle in terms of the ratio of the interfacial tensions
Figure 2.
Diagram of interfacial tensions for lipid monolayer and lipid bilayer. The amount of the bilayer bulge is exaggerated to illustrate the geometry of the interfacial tensions. All radii and vectors are in a plane containing the centers of the two droplets.
| (2) |
Note that at the three phase contact line, the three interfacial tension vectors for γm, γm, and γb, are perpendicular to the three radii R1, R2, and Rb*, respectively. Equating the projections of the three vectors onto a line parallel to the droplet-droplet centerline gives an equation for the radius of curvature for the bilayer bulge Rb*
| (3) |
Equation 3 can also be derived from the pressure difference between the two droplets using Equation 1. Together, Equations 2 and 3 describe the behavior of the bilayer contact angle θb as a function of the droplet radii and the interfacial tensions. Note that the contact angle depends only on the interfacial tension ratio and not on the droplet radii. As the radius ratio R2/R1 changes, the three interfacial tension vectors rotate together toward the smaller droplet. The rotation of the two monolayer interfacial tension vectors conforms to the droplet outer boundaries found with dissimilar droplet radii while the bilayer interfacial tension rotates toward the large droplet an equal amount to maintain the force balance, in the process creating the bilayer curvature.
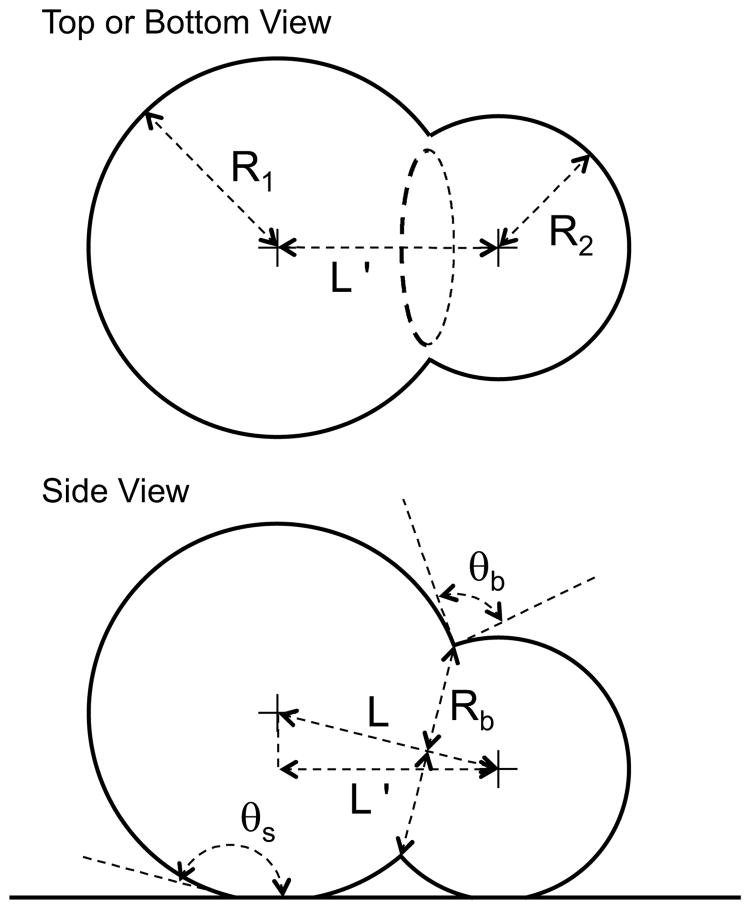
Now that we have a physical basis for the droplet shapes, we consider how to use measurements of the droplet contours to determine droplet parameters such as contact angle and droplet volume. Parameters for these calculations are shown in Figure 3. As in Figure 2, size differences between the two droplets is exaggerated for illustrative purposes. The fitting process has provided the radii of the two droplets, R1 and R2, and the apparent center-to-center distance between droplets, L′.
Figure 3.
Schematic of a droplet pair showing parameters used in calculations.
The parameters of interest such as the bilayer contact angle, θb, and the bilayer radius, Rb, cannot be directly determined from the top or bottom view because the three phase contact line (outer bilayer boundary), shown as an oval for the “top or bottom view” in Figure 3, is not perpendicular to the viewing direction. Therefore, the true center-to-center distance, L, is first determined from L′ by the equation
| (4) |
where θs is the contact angle of the droplet on the surface. Once L is known, the law of cosines may be used to calculate the bilayer contact angle θb according to
| (5) |
and the law of sines may be used to determine the bilayer radius Rb according to
| (6) |
When calculating the volume of each droplet, one must compensate for three effects: truncation of the sphere at the bilayer, the bilayer curvature, and the truncation at the support surface. All three corrections are made using the formula for a spherical cap volume
| (7) |
where Ri is the radius of the droplet (R1 or R2) and β is the central half angle subtended by the spherical cap. The largest correction is for the truncation at the bilayer surface, which is accounted for by removing a spherical cap of radius Ri with a central half angle given by
| (8) |
The bilayer curvature can be described as a spherical cap of radius Rb* with a central half angle given by
| (9) |
which is added to the smaller droplet and subtracted from the larger droplet. This cap fits precisely where the bilayer truncation was made. Both caps have a diameter of Rb, though the radii of curvature are Ri and Rb* for the truncation and curvature, respectively.
The final correction is a truncation at the support surface contact, which is made by subtracting a spherical cap of radius Ri with a central half angle given by
| (10) |
Using Equations 7, 8, 9, and 10 together, the formula for the droplet volumes becomes
| (11) |
where Vi is the volume of droplet 1 or 2 (V1 or V2). In this equation, the first term is the volume with no truncation, the second is the truncation for the bilayer, the third is the correction for the bilayer curvature, and the fourth is the truncation for the support surface contact. The plus sign for the third (bilayer curvature) term is used for the smaller droplet and the minus sign for the larger droplet. For isolated droplets, Equation 11 gives the correct limit for Rb → 0 and Rb* → ∞. Values for the radius ratios and the bilayer truncation and bilayer curvature terms are given in Tables 2 and 3 for two limiting cases R1 = R2 and R1 » R2, corresponding to equal droplet sizes and one droplet adhering to a planar surface.
Table 2.
Limiting Values for Radius Ratios
|
|
|
|
|
|
||||||
|---|---|---|---|---|---|---|---|---|---|---|
| R1 = R2 |
|
|
∞ | ∞ | 0 | |||||
| R1 » R2 | 0 | sin θb | 0 |
|
|
Table 3.
Limiting Values for Bilayer Truncation and Bilayer Curvature Corrections
| Bilayer Truncation Term | Bilayer Curvature Term | |||
|---|---|---|---|---|
| R1 = R2 Both Droplets |
|
0 | ||
| R1 » R2 Droplet 1 |
0 | 0 | ||
| R1 » R2 Droplet 2 |
|
|
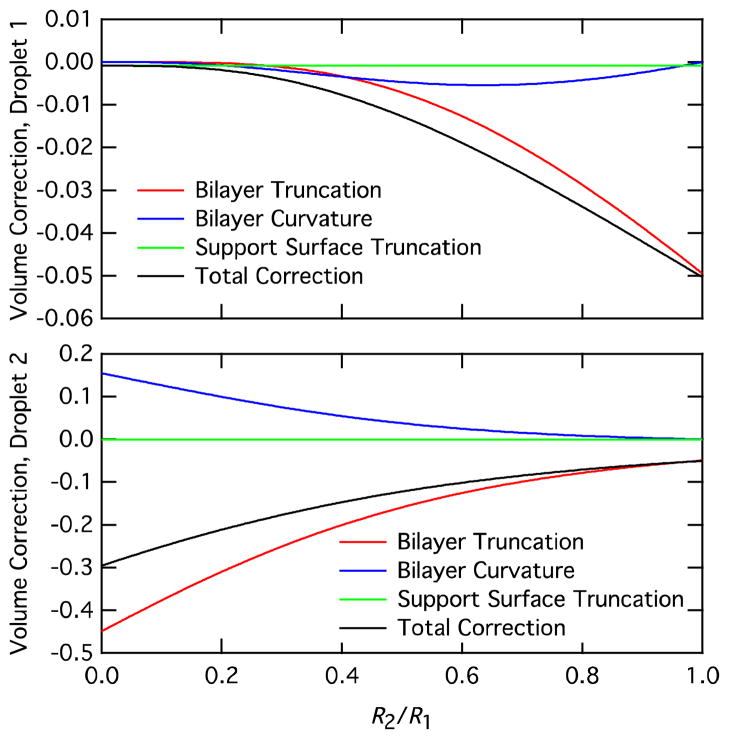
The magnitude of the volume corrections in Equation 11 are illustrated in Figure 4. This figure shows the value for each of the three correction terms in Equation 11 as a function of the droplet radius ratio R2/R1 for a ratio of bilayer and monolayer interfacial tensions γb/γm = 1.45 and a support surface contact angle θs = 165 degrees, which are typical values for our experiments. There is some variation of θs, which appears to be due to surface charge on the petri dish; this variation has negligible impact on our calculations because the support surface truncation for large contact angles is quite small. Calculations were performed using Equation 11 and Rb and Rb* defined by Equations 3 and 6. Note that the vertical scaling for the droplet 2 volume corrections are much larger than the corrections for droplet 1 because the corrections are a fraction of the uncorrected droplet volume . The support surface correction is the same for all values of R2/R1, with a value of ~0.1% for θs = 165 degrees. When R1 = R2, the bilayer truncation correction leads to a volume reduction of ~5% and there is no contribution from the bilayer curvature. As the droplet radius ratio R2/R1 decreases, the corrections to droplet 1 become smaller, approaching the support surface truncation correction for R1 » R2. On the other hand, the corrections to droplet 2 increase continually for decreasing R2/R1, reaching limiting total correction of ~30%.
Figure 4.
Volume correction terms for droplet 1 and droplet 2 as a function of droplet radius ratio R2/R1.
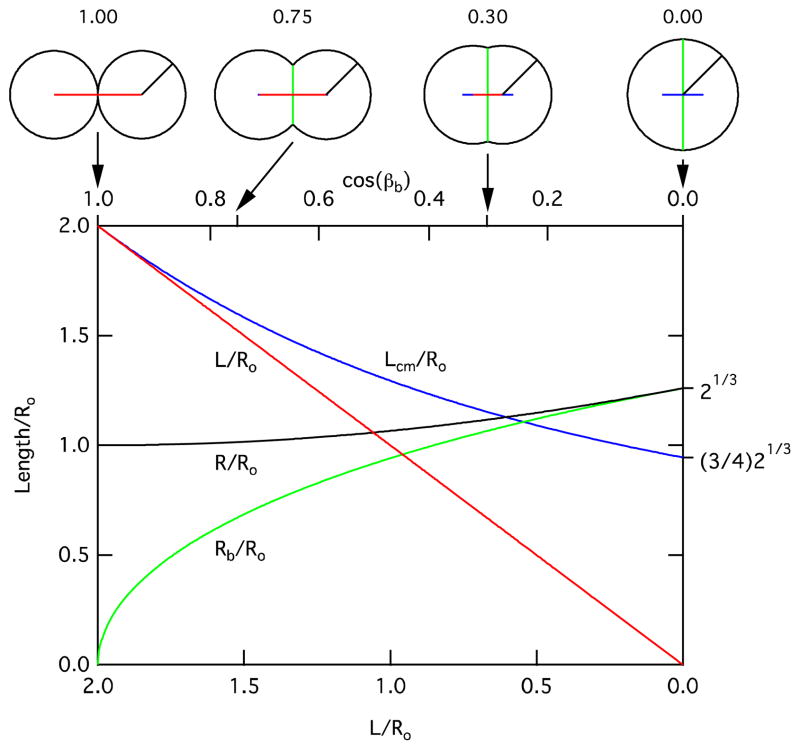
As two droplets approach each other and adhere, the reduction in center to center distance, L, occurs simultaneously with deformation of the droplets from their initial shapes at the bilayer interface. This deformation leads to a shift of the droplet center of mass in the opposite direction from the droplet motion. The center of mass for a truncated sphere shifts by an amount
| (12) |
from the sphere center in the direction opposite the truncation where βb is the central half angle of the truncation, Rb is the radius of the planar truncated surface (i.e., bilayer radius of Figures 2 and 3) and Vt is the volume of the truncated sphere, which is essentially constant during droplet deformation. The magnitude of this shift is illustrated in Figure 5, which shows the variation in center-to-center distance, L, center of mass centerline distance, Lcm, droplet radius, R, and bilayer radius, Rb, as functions of L and the bilayer central half angle (specifically cos βb) for the case of identical droplet volumes, for which there is no contribution of the bilayer curvature to these parameters. All length scales are normalized to the initial (undeformed) droplet radius, Ro. From Figure 5, we note that the effects of the droplet deformation on the center of mass centerline distance, Lcm, and the droplet radius, R, are relatively large in the limiting case of cosβb, L → 0. However, for droplets of similar diameters, typical interfacial tensions limit cosβb to a range between 1 and ~0.75 (see Equation 2). In this physically relevant range for cosβb, Rb grows quickly to approximately half of its maximal change, while the perturbation of Lcm and R are relatively small (approximately 5% and 1.5% of L and Ro, respectively).
Figure 5.
Plots of droplet center-to-center distance, L, center of mass centerline distance, Lcm, droplet radius, R, and bilayer radius, Rb, as functions of L and the bilayer central half angle βb (or, specifically cos βb) for the case of identical droplet volumes. All length scales are normalized to the initial droplet radius, Ro. Note that the bottom scale is linear, while the top (for cos βb) is slightly nonlinear because of the ratio R/Ro is not constant.
Theory – Water Transport Calculations
We used the time dependence of droplet volumes to calculate the transport of water across the bilayer. The molar flux of water Φw through a membrane with osmotic permeability, P, and area, A, due to a molarity salt gradient Δcs is given by the equation22
| (13) |
where the van ‘t Hoff factor ι represents the number of ions per molecule of solute and φ is the osmotic coefficient. For our experiments, the concentration gradient is continually changing as water moves from one droplet to the other. To describe this situation we rewrite Equation 13 as
| (14) |
where V̄ is the partial molar volume of water, we have substituted ι = 2 for NaCl, and the two droplets, identified as 1 and 2, have volumes V1 and V2 and contain N1 and N2 moles of solute. For these calculations, either droplet 1 or 2 can be larger than the other. Note that for the small droplet diameters involved in our experiments, diffusion is fast compared with water transport, and the influence of concentration gradients near the bilayer is negligible. We consider N1 and N2 as constant because the transport of the solute is negligible compared with the transport of the water. To simplify Equations 14, we express the volume and amount of solute for each droplet as a fraction of the two-drop totals VT = V1 + V2 and NT = N1 + N2 and define η in terms of known or measured parameters by
| (15) |
Using these parameters and defining the fractional concentrations, ni = Ni/NT, and fractional volumes vi = Vi/VT, where i = 1 or 2, we can write the differential equations of Equations 14 in two forms, as a line with slope P and x-intercept ni
| (16) |
and as a solution for P
| (17) |
An analytical expression for the variation of vi and t is found by integrating Equation 16 or Equation 17 to give
| (18) |
where vi = vi0 at time t = t0 and the time-like variable τ is given by
| (19) |
Results and Discussion
We have measured the interfacial tension of the water/lipid/mineral oil monolayer, γm, by taking images of much larger sessile droplets (~1 mm radius). The outline of these droplets was fit to an appropriate shape using a plugin for ImageJ that performs a fit using low-Bond axisymmetric drop shape analysis.16 The plugin uses the fit to determine values for the capillary constant C = Δρg/γm, where Δρ is the density difference inside and outside the droplet and g is the acceleration of gravity. For our case, C exceeded the maximum value allowed in the program (106 m-2). We avoided this limit by scaling our distances down by a factor of 2 and increasing the value of the capillary constant from the fit by 4. This gave an interfacial tension of the monolayer of γm = 1.3 ± 0.2 mN/m, which is similar to other reported measurements.23 The influence of gravity produces at most a percentage change of CR2 in the radius of curvature R between the top and bottom of the droplet, which for 100 μm diameter droplets in our experiments is ~1%. Equation 2 gives γb = 1.9 ± 0.3 mN/m for our experiments, and the energy of adhesion is 2γm − γb = 0.7 mN/m.
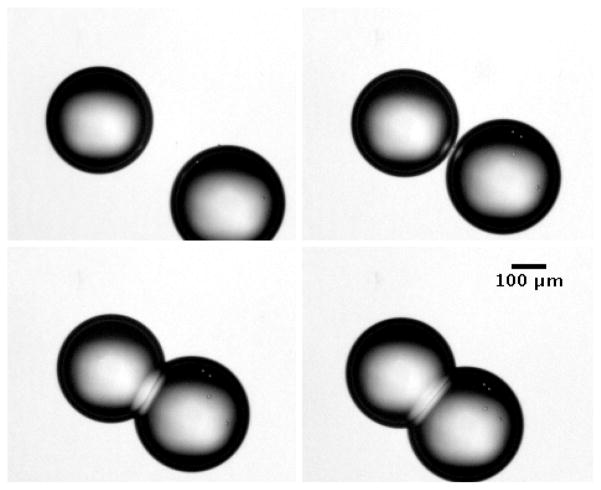
The formation of a lipid bilayer from two contacting monolayers in an aqueous water-in-oil emulsion involves the expulsion of the intervening oil film so as to facilitate the van der Waals forces to initiate monolayer adhesion. Infrared laser based optical manipulation of lipid monolayer coated droplets by convective forces allows for the precise control of the force fields that enable droplet mobility and contact. In the Petri dish geometry of our experiments, the droplets have a small contact area with the polystyrene surface as mentioned in the Materials and Methods section. When the droplet surfaces touch and adhesion is initiated, the infrared laser is turned off. Convective currents stop and the adhesion interaction is allowed to proceed under the influence of the intermolecular forces. This interaction is observed as the oil trapped between the interacting lipid monolayers is squeezed out of the interface until a stable bilayer is formed. In our measurements, this process was visualized in image sequences that were captured as the laser manipulated the droplets into contact and then was turned off. This image sequence was analyzed as described in the Materials and Methods section. Example images are shown in Figure 6. A video of continuous images are available as supplemental information.
Figure 6.
Images of droplet pair during laser guided approach and adhesion to form a bilayer.
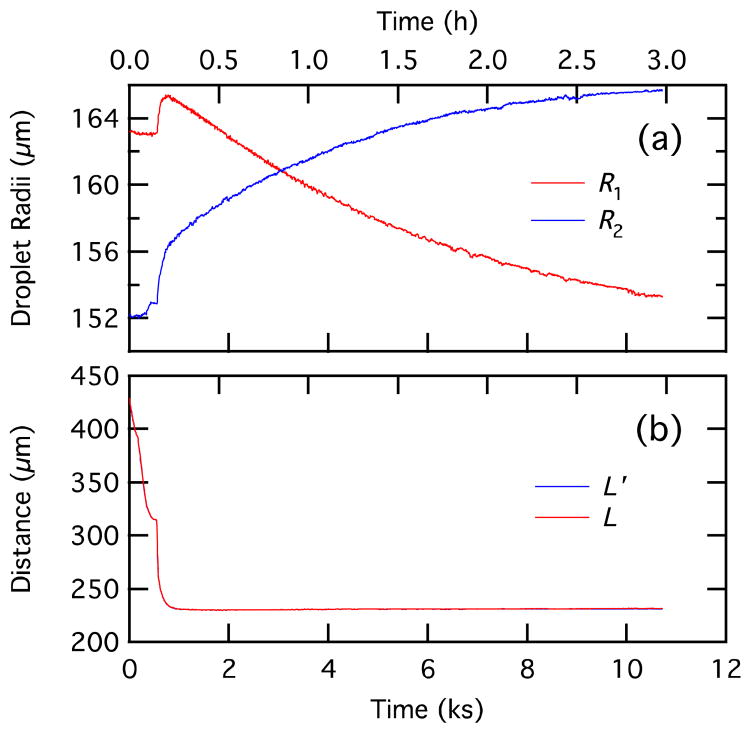
Raw data (droplet radii and center-to-center distance) for individual droplets approaching and adhering are shown in Figure 7. These are the direct outputs of the circle fitting. All of the parameters in Figures 8, 9, 10, 11, 12, and 13 are derived from these parameters, except for the laser power in Figure 8. The steep changes in the radii and center-to-center distance at 550 s corresponds to the bilayer formation process (see also Figure 7). The changes in radii and center-to-center distance will be better understood through the description of Figures 8 through 10 below.
Figure 7.
Raw data for droplet pair interaction showing droplet radii, R1 and R2, (a), and apparent and true center-to-center distances L′ and L (b). Since the droplet diameters are nearly the same, L′ and L are almost identical. To facilitate comparison with Figure 7 with time in seconds, we show time in kiloseconds; time in hours is shown on the top axis.
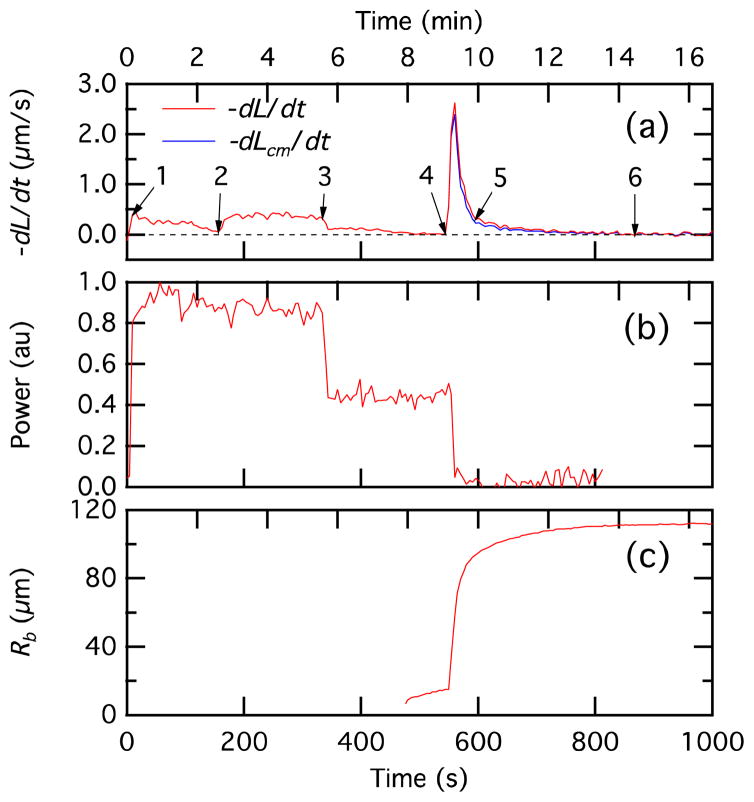
Figure 8.
Temporal variation of droplet-droplet center velocity (dL/dt and dLcm/dt top), laser power (center), and bilayer radius (bottom). The images corresponding to points 1, 4, 5, and 6 are shown in Figure 6; a complete image set from point 1 through point 6 is available as supplemental information. The trace in Figure 8(b) is derived from the intensity of the laser shadowgraph in the images and is primarily intended to show the timing of the changes in laser power.
Figure 9.
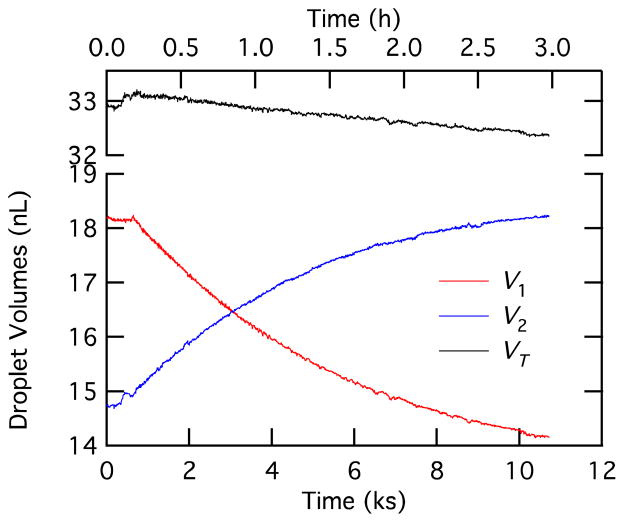
Droplet volumes as a function of time.
Figure 10.
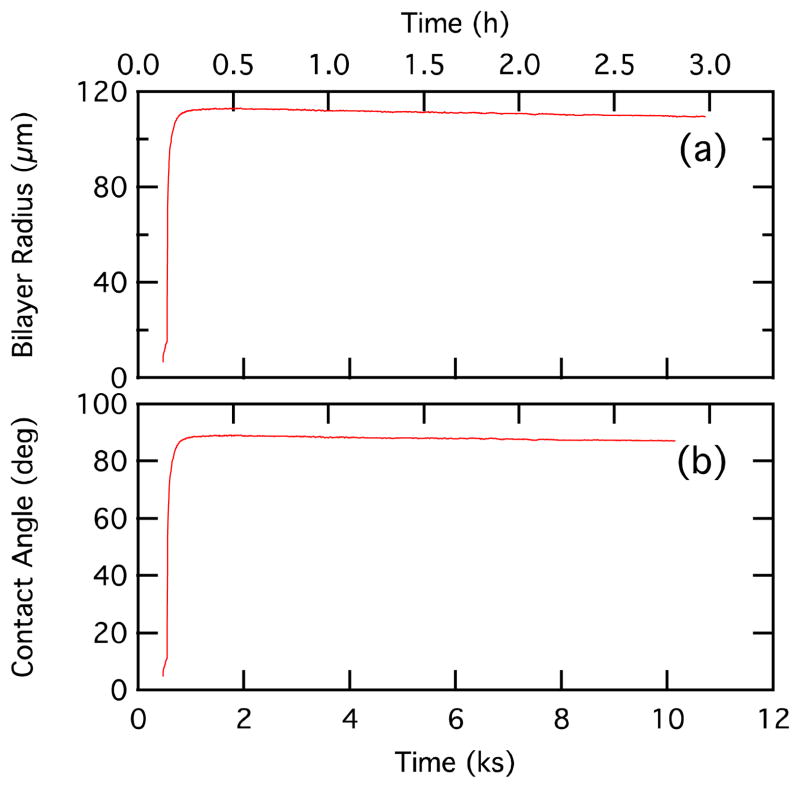
Temporal variation of bilayer radius (top) and contact angle (bottom).
Figure 11.
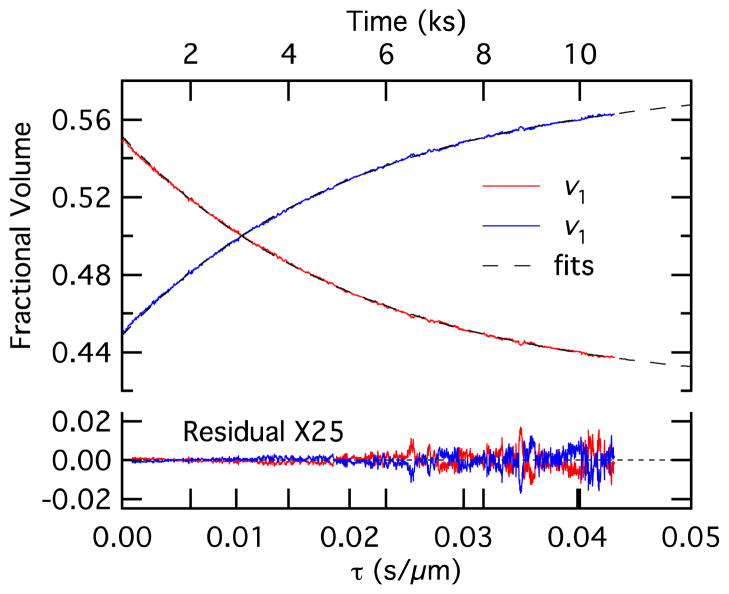
Fractional volume vi versus time-like variable τ together with fits from Equation 18. Time is shown on the top axis, although the scale is slightly nonlinear because the bilayer area and total volume are not constant.
Figure 12.
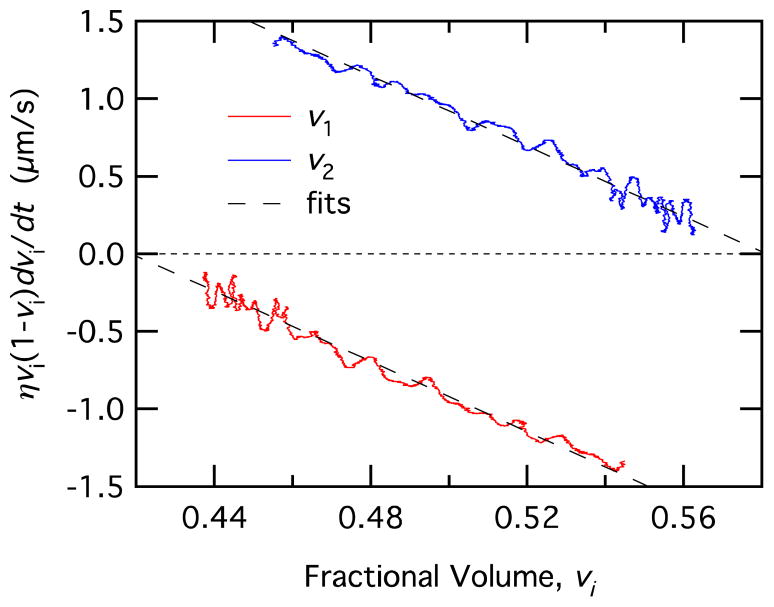
Data and fits using Equation 16 to determine the permeability, P.
Figure 13.
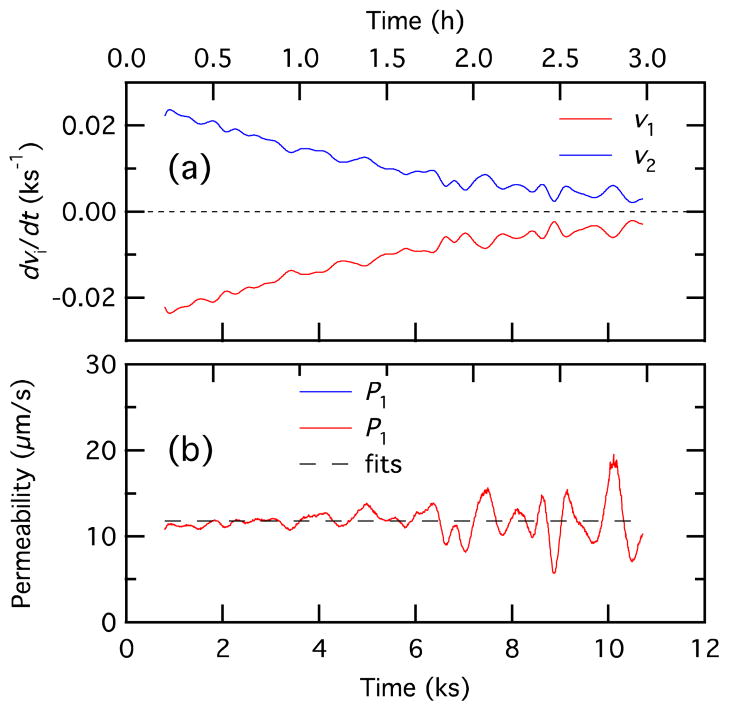
Plot of dv1/dt (a) and P (b) as a function of time.
The processes involved in the bilayer formation are understood from the plots of the centerline velocity, laser power, and bilayer radius in Figures 8a, 8b, and 8c, respectively. When the laser power is turned up to approximately 12 mW at the beginning of the data set there is an initial increase in the droplet center-center approach velocity dL/dt (point “1” in Figures 8a and 8b). However, it is important to note that the droplets do not approach each other head on; instead they approach each other at an angle, which is determined by the position of the laser (see Figure 1b). At point “2,” the laser is moved closer to the droplets and the velocity increases again. At point “3” the laser power is reduced to approximately 7 mW and the velocity decreases. At point “4,” the laser is turned off as the droplets touch and the van der Waals attraction of the droplets leads to a sharp spike in the velocity as an interface begins to evolve between the adhering droplets and the droplets deform. This large increase in the center-center approach velocity corresponds to an interaction between the lipid monolayers since at this time, the laser is turned off and there is no active heating of the mineral oil. This velocity is almost completely due to the droplets moving toward each other rather than droplet deformation (the droplet center-of-mass relative velocity, dLcm/dt, is only 10% less than the droplet center relative velocity, dL/dt). The corresponding rapid increase in the bilayer radius is shown in Figure 8c. The interface comprises two lipid monolayers that have self assembled at the water droplet-mineral oil interface. As the intervening mineral oil is squeezed out of the interface, it flattens. At equilibrium, the interface resembles a lipid bilayer with some trapped mineral oil. It is not unusual to have a significant time interval for completion of film drainage (point “5”) and the formation of a metastable lipid bilayer interface as indicated by the stabilized values of the bilayer radius (~110 μm) and contact angle (~88 degrees) (point “6”). This is because the mineral oil used in the present study had a viscosity of 26 mPa·sec at 25 °C (Certificate of Analysis, Sigma), which is significantly higher than that of n-hexadecane (3.032 mPa·sec at 25 °C),24 the oil medium of choice in all previous reports on droplet bilayers. In fact, viscosity is indeed the dominant factor in film drainage. The higher the viscosity of the continuous phase, the longer the time for film drainage, as demonstrated in a recent study of water–oil–water bitumen emulsion films.25 The bilayer radius increases by a steady rate of ~4 μm/s during the rapid portion of the rise (Rb = 10 to 70 μm in Figure 8). Thutupalli et al.23 also observed a steady contact line velocity for droplet bilayers, although theirs is much faster (1.9 mm/s). This rate should depend on the pressure applied on the thinning oil layer.
Droplet volumes calculated using Equation 11 and the data in Figure 7 are shown in Figure 9. Droplet 1 loses volume, droplet 2 gains volume by an approximately equal amount, and the total droplet volume decreases slightly. The change in droplet volumes is due to water transport from the salt gradient. Note the small increase in volume for droplet 2 between time 0 and formation of the bilayer at time 550 s. The droplet volume can’t change during this time, so this variation is an indication of the error in correction for the various factors in Equation 11, which is 1.5% for this experiment. Note also that the total volume drops by 2.3% between formation of the bilayer and the end of the experiment (10.5 ks or 3 hr). We believe that this volume change is real and is a direct consequence of dissolution of the water phase into the mineral oil via inverse micelles or due to the evolution of the emulsion.26
The temporal changes in the bilayer radius and contact angle are shown in Figure 10. Both rise quickly during the bilayer formation and then reach equilibrium values. Monitoring the contact angle with the droplet shape analysis provides a method to check whether the bilayer has reached a stable condition. Although the data in Figure 10 show a steady approach to the equilibrium contact angle and bilayer length, we occasionally observe droplet pairs that reach an intermediate or metastable contact angle and bilayer length below the equilibrium values, with subsequent change to the typical equilibrium values (a contact angle near 88 degrees). An example of such data is shown in the supplemental data.
The data of Figure 9 can also be used to determine the permeability. The best estimates for the permeability were obtained by fitting Equation 18 to experimental values of the fractional droplet volumes as a function of τ. The fitting was only performed over periods when the contact angle and bilayer radius were constant to avoid transient effects. Values for τ were calculated using Equation 19. The value for φ came from the literature.27 We used 18 cm3/mole for V̄. The value for NT was calculated from the initial salt concentrations for each droplet and the initial droplet volumes from the shape analysis (Figure 9). Time-dependent values for VT and A = πRb2 were obtained from the bilayer radius and droplet volume in Figures 9 and 10. Fits to Equation 18 were performed using a curve fitting routine with a user-defined function in the graphing program Igor Pro. Since Equation 18 is not readily inverted to solve for vi, it was necessary to use τ as the dependent variable. However, the primary variability is in vi, which is the independent variable, and fitting is usually performed with the parameter having the larger uncertainty as the dependent variable. To address this, we used orthogonal distance regression in Igor Pro, which uses the freely available ODRPACK95 weighted orthogonal distance regression code to perform fits based on the values of the independent variable. Experimental and fit data for the fractional volumes vi as a function of τ are shown in Figure 11, where τ is plotted as the independent variable on the abscissa where a time-like variable would normally be found, which is reasonable since the orthogonal distance regression has allowed the variation typical for an independent variable in vi. Although we plot both v1 and v2 in Figure 11, the fitting results are the same because v1 and v2 differ only by a constant (v1 = 1 – v2). The parameters P, v10, and n1 were used as fitting parameters. The fit results and corresponding residuals are shown in Figure 11, where red and blue show the results for v1 and v2, respectively, and the dashed lines show the fits. The analytical expression of Equation 18 follows the data exceptionally well as exhibited by the small magnitudes and random variation in the residuals, which are magnified 25 times in the Figure. Although the data and fit in Figure 11 appear to be exponential, an exponential is not a good approximation for the fractional volume versus τ relationship. This is clarified in the Supporting Information.
We can also calculate P using Equation 16. Plotting the left hand side of Equation 16 as a function of vi has the form of a straight line with a slope −P and an x intercept ni. We used the central difference formula to calculate dv1/dt and the result was smoothed to reduce noise. Applying this method to the same data gives the result shown in Figure 12 with P and ni as fitting parameters. This method has the advantage of using a simple linear fit to determine P. However, differentiation to find dv1/dt increases the noise in the values used in the fit.
With Equation 17 is it possible to examine the variation in the permeability P with time. The derivative dv1/dt and time profile for P are shown in Figure 13. From the figure we see that noise introduced by taking the derivative makes it difficult to obtain an accurate time dependence for P. This calculation is sensitive to the exact value for ni, with clear systematic errors from inaccurate values for ni when the term ni – vi in the denominator becomes small. To achieve good results, we use the value of ni determined from the fit for Equation 18 rather than the calculated value, although the two differ by only 0.5 and 1.5% for Figures 11 and 12.
We get an asymptotic value of 12 μm/s for P, a number that is similar to values reported for black lipid membranes (10 μm/s)22 and droplet bilayers (19 μm/s).9 The permeability is significantly lower than that measured in liposomes (~200 μm/s),28 though the experimental conditions are quite different (the liposomes had no oil phase and the radius of curvature of the liposome bilayer is 100 nm).
It is interesting to compare the relative magnitudes of the osmotic pressure and maximal pressure the bilayer can support. For a dilute solute, the osmotic pressure Π is given approximately by
| (20) |
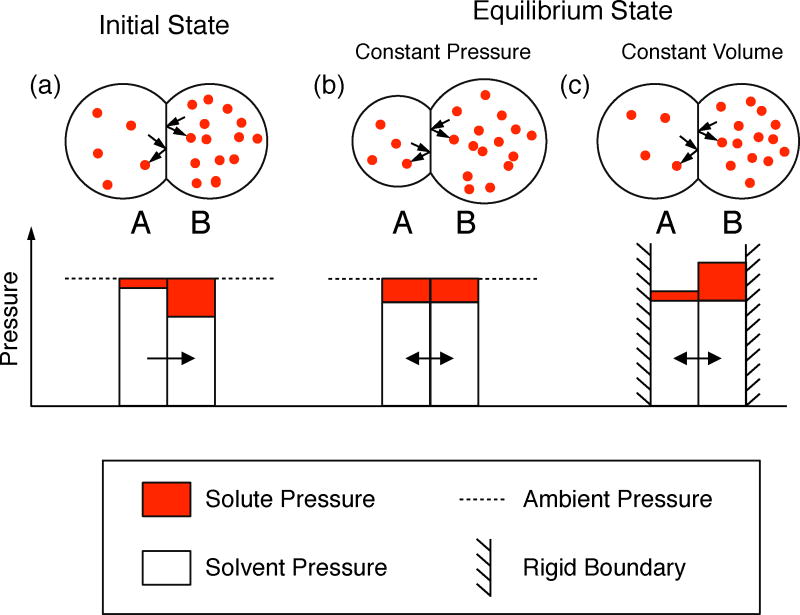
where R is the gas constant, T is the temperature, and ι and Δc are the van ‘t Hoff factor and salt gradient as in Equation 13. This equation has the same form as the ideal gas law; the osmotic pressure is due to the collisions of the solute particles with the bilayer membrane following the same principles as for an ideal gas. For a salt gradient of 50 mM and 300 K, the osmotic pressure is ~250,000 N/m2. For a bilayer interfacial tension γb = 2 mN/m and a bilayer supporting radius R = 100 μm, the Young Laplace equation (Equation 1) gives a value for the maximum pressure that the bilayer can support of 40 N/m2, or more than 4 orders of magnitude smaller than the osmotic pressure. Thus it would appear that the osmotic pressure would quickly rupture the bilayer during its formation. However, the net pressure on the bilayer is small, as can be seen from the diagrams in Figure 14. The solute concentration in droplet B (shown as the red spheres) is higher than in droplet A. The bilayer is impermeable to this solute. Collisions of the solute with the droplet boundary and bilayer produce a pressure associated with the momentum changes as the solute changes direction on impacting the boundary.
Figure 14.
Schematic of osmotic pressure in different situations: (a) initial conditions, (b) final equilibrium for constant pressure boundary conditions, and (c) final equilibrium for constant volume boundary conditions.
The total pressure in each droplet is equal to the ambient pressure in the oil phase plus a small contribution due to the interfacial tension of the oil/lipid/water monolayer interface, the latter being equal when the two droplets are the same size. We refer to the difference between the osmotic pressure and the ambient pressure as the partial pressure of the solvent (water). This solvent partial pressure can produce a net flow of water across the bilayer, which the osmotic (solute) partial pressure due to the solute cannot. The properties of the solvent are indeed consistent with a solvent pressure reduced by the osmotic pressure.29 In our experiments, flow of water from the droplet with the low solute concentration to the droplet with the high solute concentration (from droplet A to droplet B) is accommodated by expansion of the volume of droplet B (and contraction of droplet A). This constitutes a constant pressure boundary condition at the droplet/oil interface. The flow continues until the concentrations are balanced on each side of the bilayer and the solvent partial pressures are equal [Figure 14(b)]. In the course of the water flow from the initial condition in Figure 14(a) to equilibrium in Figure 14(b) there is no large pressure across the bilayer since the osmotic partial pressure is continually balanced by the solvent partial pressure, or in other words, the pressure on each side of the bilayer is essentially the ambient pressure in the oil phase. A different circumstance is shown in Figure 14(c), which shows a hypothetical example where the outer boundaries of the droplets are rigid and the volumes of each droplet are not allowed to change (a constant volume boundary condition at the outer surfaces of the droplets). In this case the movement of the solvent from droplet A to droplet B also continues until the solvent partial pressures are the same on each side of the bilayer, although in this case droplet B has a pressure exceeding that of droplet A by an amount equal to the osmotic pressure across the bilayer. The experiment will never reach this condition of course because the bilayer would rupture well before a total pressure differential equal to the osmotic pressure is reached.
In summary, we have demonstrated a droplet shape analysis method for individual droplets and droplet bilayer pairs. The method provides information on droplet volumes, the bilayer radius and contact angle, and the droplet centerline approach velocity. We present an analytical expression of the volume change associated with osmosis between droplets and used it to calculate the bilayer permeability.
Supplementary Material
Acknowledgments
This research was supported by the National Institutes of Health (grant number R21CA133537) and internal research and development funds from SRI International. A. P. was supported by the NSF through the Research Experiences for Undergraduates Program under grant number PHY-1002892.
Footnotes
Supporting Information Available
Shape of fractional volume curve
Droplet pair with delayed equilibrium bilayer conditions
Video of laser-driven droplet-droplet adhesion
This information is available free of charge via the Internet at http://pubs.acs.org/.
References
- 1.Poulin P, Bibette J. Adhesion of water droplets in organic solvent. Langmuir. 1998;14:6341–6343. [Google Scholar]
- 2.Funakoshi K, Suzuki H, Takeuchi S. Lipid bilayer formation by contacting monolayers in a microfluidic device for membrane protein analysis. Anal Chem. 2006;78:8169–8174. doi: 10.1021/ac0613479. [DOI] [PubMed] [Google Scholar]
- 3.Holden MA, Needham D, Bayley H. Functional bionetworks from nanoliter water droplets. J Am Chem Soc. 2007;129:8650–8655. doi: 10.1021/ja072292a. [DOI] [PubMed] [Google Scholar]
- 4.Stanley CE, Elvira KS, Niu XZ, Gee AD, Ces O, Edel JB, Demello AJ. A microfluidic approach for high-throughput droplet interface bilayer (DIB) formation. Chem Commun (Camb) 2010;46:1620–1622. doi: 10.1039/b924897h. [DOI] [PubMed] [Google Scholar]
- 5.Poulos JL, Nelson WC, Jeon TJ, Kim CJ, Schmidt JJ. Electrowetting on dielectric-based microfluidics for integrated lipid bilayer formation and measurement. Appl Phys Lett. 2009;95:013706. [Google Scholar]
- 6.Poulos JL, Portonovo SA, Bang H, Schmidt JJ. Automatable lipid bilayer formation and ion channel measurement using sessile droplets. J Phys: Condens Matter. 2010;22:454105. doi: 10.1088/0953-8984/22/45/454105. [DOI] [PubMed] [Google Scholar]
- 7.Aghdaei S, Sandison ME, Zagnoni M, Green NG, Morgan H. Formation of artificial lipid bilayers using droplet dielectrophoresis. Lab Chip. 2008;8:1617–1620. doi: 10.1039/b807374k. [DOI] [PubMed] [Google Scholar]
- 8.Maglia G, Heron AJ, Hwang WL, Holden MA, Mikhailova E, Li QH, Cheley S, Bayley H. Droplet networks with incorporated protein diodes show collective properties. Nature Nanotech. 2009;4:437–440. doi: 10.1038/nnano.2009.121. [DOI] [PubMed] [Google Scholar]
- 9.Xu J, Sigworth FJ, LaVan DA. Synthetic protocells to mimic and test cell function. Adv Mater. 2010;22:120–127. doi: 10.1002/adma.200901945. [DOI] [PMC free article] [PubMed] [Google Scholar]
- 10.Dixit SS, Kim H, Vasilyev A, Eid A, Faris GW. Light-driven formation and rupture of droplet bilayers. Langmuir. 2010;26:6193–6200. doi: 10.1021/la1010067. [DOI] [PMC free article] [PubMed] [Google Scholar]
- 11.Punnamaraju S, Steckl AJ. Voltage control of droplet interface bilayer lipid membrane dimensions. Langmuir. 2011;27:618–626. doi: 10.1021/la1036508. [DOI] [PubMed] [Google Scholar]
- 12.Baroud CN, Delville JP, Gallaire F, Wunenburger R. Thermocapillary valve for droplet production and sorting. Phys Rev E. 2007;75:046302. doi: 10.1103/PhysRevE.75.046302. [DOI] [PubMed] [Google Scholar]
- 13.Vela E, Hafez M, Regnier S. Laser-induced thermocapillary convection for mesoscale manipulation. Int J Optomechatronics. 2009;3:289–302. [Google Scholar]
- 14.Verneuil E, Cordero M, Gallaire F, Baroud CN. Laser-induced force on a microfluidic drop: origin and magnitude. Langmuir. 2009;25:5127–5134. doi: 10.1021/la8041605. [DOI] [PubMed] [Google Scholar]
- 15.Widom B. Line tension and the shape of a sessile drop. J Phys Chem. 1995;99:2803–2806. [Google Scholar]
- 16.Stalder AlF, Melchior T, Müller M, Sage D, Blu T, Unser M. Low-bond axisymmetric drop shape analysis for surface tension and contact angle measurements of sessile drops. Colloid Surf A. 2010;364:72–81. [Google Scholar]
- 17.Danov KD, Kralchevsky PA, Ivanov IB. Handbook of Detergents, Part A: Properties. Vol. 82. Marcel Dekker; New York: 1999. pp. 303–418. [Google Scholar]
- 18.Basu AS, Gianchandani YB. Virtual microfluidic traps, filters, channels and pumps using Marangoni flows. J Micromechan Microeng. 2008;18:115031. [Google Scholar]
- 19.Hu W, Ohta A. Aqueous droplet manipulation by optically induced Marangoni circulation. Microfluid Nanofluid. 2011;11:307–316. [Google Scholar]
- 20.Doube M. FitCircle Java class for fitting circles to 2D coordinate data. 2009. [Google Scholar]
- 21.Chernov N. Circular and linear regression: Fitting circles and lines by least squares. Vol. 117 CRC Press/Taylor & Francis; Boca Raton, Florida: 2010. [Google Scholar]
- 22.Cass A, Finkelstein A. Water permeability of thin lipid membranes. J Gen Physiol. 1967;50:1765–1784. doi: 10.1085/jgp.50.6.1765. [DOI] [PMC free article] [PubMed] [Google Scholar]
- 23.Thutupalli S, Herminghaus S, Seemann R. Bilayer membranes in micro-fluidics: from gel emulsions to soft functional devices. Soft Matter. 2011;7:1312–1320. [Google Scholar]
- 24.Coursey BM, Heric EL. Viscosity of some binary systems of hexadecane and normal chloroalkanes. J Chem Eng Data. 1969;14:426–430. [Google Scholar]
- 25.Khristov K. Thin liquid film technique — application to water–oil–water bitumen emulsion films. Colloid Surf A. 2000;174:183–196. [Google Scholar]
- 26.Jiao J, Burgess DJ. Ostwald ripening of water-in-hydrocarbon emulsions. J Colloid Interface Sci. 2003;264:509–516. doi: 10.1016/S0021-9797(03)00276-5. [DOI] [PubMed] [Google Scholar]
- 27.Hamer WJ, Wu YC. Osmotic coefficients and mean activity coefficients of uni-univalent electrolytes in water at 25°C. J Phys Chem Ref Data. 1972;1:1047–1100. [Google Scholar]
- 28.Paula S, Volkov AG, Van Hoek AN, Haines TH, Deamer DW. Permeation of protons, potassium ions, and small polar molecules through phospholipid bilayers as a function of membrane thickness. Biophys J. 1996;70:339–348. doi: 10.1016/S0006-3495(96)79575-9. [DOI] [PMC free article] [PubMed] [Google Scholar]
- 29.Hammel HT. Evolving ideas about osmosis and capillary fluid exchange. FASEB J. 1999;13:213–231. doi: 10.1096/fasebj.13.2.213. [DOI] [PubMed] [Google Scholar]
Associated Data
This section collects any data citations, data availability statements, or supplementary materials included in this article.


