

Abstract
To define the proteins whose expression is regulated by cAMP and protein kinase A (PKA), we used a quantitative proteomics approach in studies of wild-type (WT) and kin- (PKA-null) S49 murine T lymphoma cells. We also compared the impact of endogenous increases in the level of cAMP [by forskolin (Fsk) and the phosphodiesterase inhibitor isobutylmethylxanthine (IBMX)] or by a cAMP analogue (8-CPT-cAMP). We identified 1056 proteins in WT and kin- S49 cells and found that 8-CPT-cAMP and Fsk with IBMX produced differences in protein expression. WT S49 cells had a correlation coefficient of 0.41 between DNA microarray data and the proteomics analysis in cells incubated with 8-CPT-cAMP for 24 h and a correlation coefficient of 0.42 between the DNA microarray data obtained at 6 h and the changes in protein expression after incubation with 8-CPT-cAMP for 24 h. Glutathione reductase (Gsr) had a higher level of basal expression in kin- S49 cells than in WT cells. Consistent with this finding, kin- cells are less sensitive to cell killing and generation of malondialdehyde than are WT cells incubated with H2O2. Cyclic AMP acting via PKA thus has a broad impact on protein expression in mammalian cells, including in the regulation of Gsr and oxidative stress.
The second messenger cAMP is ubiquitously found in eukaryotic cells and regulates many cellular functions, including cell growth, death, and metabolism.1 Synthesis of cAMP is regulated by G-protein-coupled receptors (GPCRs) that couple to heterotrimeric G-proteins and modulate the activity of adenylyl cyclases (ACs), which catalyze cAMP formation. Hydrolysis of cAMP by cyclic nucleotide phosphodiesterases (PDEs) and receptor desensitization influence the duration and extent of the increase in the level of cellular cAMP. Alterations in the cAMP signaling pathway occur in numerous settings, including in certain cancer cells; this pathway is thus a potential target for cancer therapy.2,3 The actions of cAMP primarily occur via the activation of PKA, which can promote the proliferation of certain cells but induces cell-cycle arrest and apoptosis in others.2,4,5 Even though PKA is the major mechanism for cAMP-mediated events in eukaryotic cells, only a portion of the proteins that undergo PKA-mediated regulation are known.
The CD4+/8+ S49 T lymphoma cell line, derived from a BALB/c mouse tumor, is a useful system for assessing the actions of cAMP. Treatments that raise cellular cAMP levels produce G1-phase cell-cycle arrest and then apoptosis in wild-type (WT) S49 cells.4,5 This apoptotic response facilitated the isolation of cAMP-resistant clones and has made S49 cells useful for investigating cAMP generation and action.6 Kin- cells, a clonal, cAMP-resistant S49 variant that lacks PKA activity and expression of the catalytic subunit of PKA,5−8 provide a null cell system for identifying cAMP/PKA-dependent responses.5−8 Such responses include not only G1-phase cell-cycle arrest and mitochondria-dependent intrinsic apoptosis but also induction of PDE and proteins that contribute to apoptosis3,5,7−11 and inhibition of expression of other proteins, including ornithine decarboxylase, S-adenosylmethionine decarboxylase, and c-myc.12,13
Cyclic AMP acts via PKA to alter the expression of many mRNAs in WT, but not kin-, S49 cells and by inference in other eukaryotic cells.3 How those mRNA changes relate to effects of cAMP/PKA on protein expression is unclear, especially because mRNA and protein expression do not highly correlate (correlation coefficients between the two range from 0.2 to 0.614,15). Here we undertook quantitative proteomics analysis to identify cAMP/PKA-mediated changes in protein expression in S49 cells as a system for defining such changes in mammalian cells.
Experimental Procedures
Growth of S49 Cells and Treatment with a cAMP Analogue or IBMX and Fsk
WT and kin- S49 cells were grown in a suspension culture in Dulbecco’s modified Eagle’s medium supplemented with 10% heat-inactivated horse serum and 10 mM HEPES (pH 7.4) in a humidified atmosphere containing 10% CO2 at 37 °C. Cells were incubated for 6 or 24 h with 100 μM 8-(4-chlorophenylthio)-cAMP (8-CPT-cAMP) (Sigma), a cAMP analogue that activates PKA. In addition, we incubated WT S49 cells for 6 h with 100 μM IBMX, a PDE inhibitor, and 10 μM Fsk, an AC activator, to increase endogenous levels of cAMP. Cultures were initiated at a density of 2.5 × 10⁵ cells/mL, and stock cells were maintained at a density of <2 × 10⁶ cells/mL.
Cell Lysis, Protein Digestion, Peptide Labeling, and Mass Spectrometry Analysis
Equal (100 μg) aliquots of proteins from WT (treatment with 8-CPT-cAMP for 0, 6, and 24 h or incubation with IBMX and Fsk for 6 h) and kin- S49 cells (treatment with 8-CPT-cAMP for 0 and 6 h) were lysed in 2% Rapigest, 50 mM HEPES (pH 7.3), and protease inhibitors. The proteins were reduced, alkylated, and digested with trypsin at a protein:enzyme ratio of 100:1. The resulting peptides were acidified, desalted, and labeled with different 8-plex isobaric tagging for relative and absolute quantitation (iTRAQ) reagents16 and combined. Half of the resulting peptide mixture was loaded on a reverse-phase C18 column (RP1, 360 μm outside diameter × 200 μm inside diameter, 5 μm Zorbax SB-C18, 20 cm packing) using a pressure chamber and then desalted. The peptides were eluted to a strong cation exchange column [SCX, 360 μm outside diameter × 200 μm inside diameter, 5 μm Poly-SULPHOETHYL A (PolyLC, Inc.), 5 cm packing] online using an Agilent 1100 HPLC system (Agilent Technologies, Santa Clara, CA). The peptides on the SCX column were step-eluted to a C18 analytical column with an integrated tip [RP2, 360 μm outside diameter × 200 μm inside diameter, 5 μm Zorbax SB-C18 (Agilent Technologies), 20 cm packing] with a series of salt gradients (38 steps). After each salt elution, the peptides were eluted (at a flow rate of ∼500 nL/min) with acetonitrile (from 0 to 80% in 150 min) to an LTQ-Orbitrap XL mass spectrometer (Thermo Fisher Scientific, San Jose, CA), which was operated under the data-dependent mode with gas-phase fractionation with the full MS scan range divided into three scan ranges (400–805, 800–1055, and 1050–2000). Each MS scan (Orbitrap, 7500R) was followed by four pairs of pulsed Q dissociation–collision-activated dissociation (PQD–CAD) scans on the top four most abundant parent ions in LTQ. A dynamic exclusion of 1 min was used. The capillary temperature was 150 °C.
Data Analysis
Spectrum Mill version 3.03 (Agilent Technologies) was used to analyze the data and to identify and quantify peptides and proteins. The CAD and PQD spectra from the same parent ion were merged together and searched against the International Protein Index mouse database (version 3.31, 56555 protein sequences). The peptides were limited fully tryptic with a maximum of cleavage of 2. Other parameters included the following: carbamidomethylation of cysteines, static; iTRAQ modification on the N-terminus and lysine, differential; ±20 ppm for precursor ions; ±0.7 Da for fragment ions; minimal matched percent scored peak intensity, 50%. We constructed a concatenated forward–reverse database to calculate the false discovery rate (FDR). Proteins with two or more unique peptides were selected for quantitative analysis. To take into account database redundancy, we grouped proteins with the same set or subset of unique peptides and identified a “protein group leader”, which usually was the protein with the largest number of peptides. Hereafter, the term “protein” refers to this protein group leader.
For protein quantitation, we used three biological replicates and calculated protein iTRAQ reporter ion intensities by summing the iTRAQ reporter ion intensities of unique peptides for a given protein. We corrected for isotope impurities of iTRAQ reagents by using correction factors provided by the manufacturer (Applied Biosystems). A minimal total iTRAQ reporter ion intensity (sum of two channels compared) of 50 was used to filter out low-intensity spectra. The reporter ion ratios were calculated and normalized to the median ratio. Conclusions regarding a change in protein abundance required the following criteria to be fulfilled: (1) The protein had to be quantified in at least two data sets. (2) If the protein was quantified in all three replicates, its abundance ratios had to be ≤0.67 or ≥1.5 in all three replicates. (3) If the protein was quantified in only two data sets, both had to yield abundance ratios of ≤0.67 or ≥1.5. We opted not to use a t test for iTRAQ because that test can be too stringent for identifying proteins with fold differences that are biologically significant.17
We used the DAVID 6.7 bioinformatics tool (http://david.abcc.ncifcrf.gov)18 for gene functional categorization and pathway analysis. This tool provides gene annotation and gene ontology (GO) term enrichment analysis and highlights the most relevant GO terms in a list of genes.
Immunoblot Analysis
To verify iTRAQ data, we used immunoblotting to analyze the expression of glutathione reductase (Gsr), the expression of which differed in WT and kin- cells under basal conditions, and of Lgals7, a protein that we found is regulated by cAMP. Whole cell lysates prepared from WT S49 cells under basal conditions or after treatment with 8-CPT-cAMP for 6 and 24 h were separated by 4 to 12% NuPAGE Bis-Tris gels (Invitrogen) and transferred according to the manufacturer’s instructions. We used the following antibodies: rabbit polyclonal Gsr (H-120) (Santa Cruz Biotechnology), rabbit polyclonal Lgals7 and rabbit polyclonal GAPDH (Abcam, Inc.), and mouse monoclonal α-tubulin (Sigma). Protein expression was quantitated by densitometry using ImageJ version 1.41o.19
Cell Death Studies
WT and kin- S49 cells were incubated for 16 h at 37 °C with 150 μM hydrogen peroxide (H2O2, Fisher Scientific), 1 μM staurosporine (Sigma-Aldrich), or an equivalent volume of water (Control) in a tissue culture incubator in standard medium and in a 10% CO2/90% air mixture. Cells were then prepared for Annexin V/propidium iodide (PI) staining according to the manufacturer’s instructions (BD Pharmingen). We stained 2 × 10⁵ cells in 5 μL of Annexin V-FITC/5 μL of PI in a final volume of 100 μL of the manufacturer’s buffer for 15 min at room temperature. Stained cells were diluted with 400 μL of PBS and assessed using a BD FACScan; files were analyzed using CellQuest. The data shown are the percentages of cells that had high levels of staining with both PI and Annexin V (death by both necrosis and apoptosis).
Malondialdehyde (MDA) Analysis
We assessed oxidative stress by measuring the production of malondialdehyde, an index of lipid peroxidation, using a Thiobarbituric Acid Reactive Substances (TBARS) assay (Cayman Chemical Co.) according to the manufacturer’s instructions. Briefly, S49 cells were pelleted at 1000g and 4 °C for 10 min and resuspended in PBS at a density of 2 × 10⁷ cells/mL. The cell suspensions were sonicated three times for 5 s at 40 V on ice. Reaction mixtures were prepared by mixing 100 μL of sample or MDA standard with 100 μL of SDS solution and 4 mL of a thiobarbituric acid solution, placed in a boiling water bath for 1 h and then on ice for 10 min, and warmed to room temperature prior to duplicate 150 μL aliquots being read at 530 nm in a microplate reader (Tecan US, Durham, NC).
Results
Proteomic Profiling of WT and kin- S49 Cells
Figure 1 shows the workflow we used for quantitative proteomics analysis of WT and kin- S49 cells. We conducted this analysis in three biological replicates using 8-plex iTRAQ labeling16 and identified and quantified the proteins with Spectrum Mill. Using a 1% FDR cutoff for peptide identification, we identified 1591 proteins, 260 of which could be detected only with a single peptide. We identified 1056 proteins if a 0.1% FDR cutoff was used for proteins with a single peptide and a 1% FDR cutoff for proteins detected with multiple peptides. To minimize the detection of false positives, we used the latter criteria and required the detection of at least two unique peptides for each protein. This more conservative approach yielded 708 such proteins in S49 cells (Table 1 of the Supporting Information). We obtained results for WT and kin- S49 cells under basal conditions and after the cells had been treated with the cAMP analogue, 8-CPT-cAMP, and for WT cells, by also comparing the effect on protein expression in response to incubation of cells with 8-CPT-cAMP, or Fsk with IBMX; the latter treatment was used to increase endogenous cAMP levels in the cells.
Figure 1.

Diagram of the workflow of the proteomic studies. Proteins in wild-type (WT) and kin- S49 cells were digested in three biological replicates of cells (WT control, WT for 6 and 24 h with CPT-cAMP (100 μM) treatment, WT incubated with 100 μM IBMX and 10 μM Fsk, kin- control, and kin- cells incubated with 100 μM CPT-cAMP for 6 h). The resulting peptides were desalted and labeled with different iTRAQ reagents. The labeled peptides from each sample were pooled and then separated with online 2D LC with PQD/CAD acquisition on an LTQ-Orbitrap. Spectrum Mill was used to search the raw data for protein identification and quantitation. The proteins whose level of expression was increased or decreased were analyzed using the DAVID bioinformatics tool.
Basal Protein Expression: Differences between WT and kin- S49 Cells
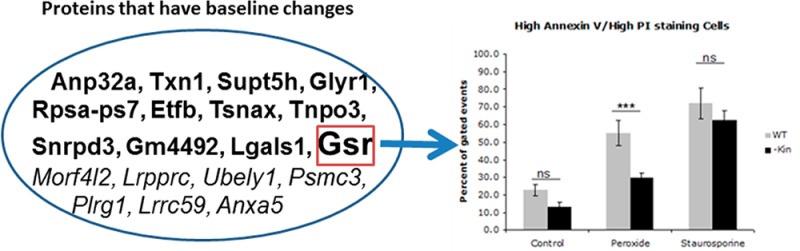
The absence of PKA activity in kin- S49 cells should change the expression of proteins that contribute to “basal” actions of cAMP required for cell viability, growth, and division. We identified 19 proteins (12 upregulated and 7 downregulated in kin- cells) that differed in their expression in WT and kin- cells (Table 1). Proteins with increased levels of expression in kin- cells are acidic (leucine-rich) nuclear phosphoprotein 32 family, member A (Anp32a), suppressor of Ty 5 homologue (Supt5h), and thioredoxin 1 (Txn1); kin- cells have decreased levels of expression of leucine-rich PPR-motif containing (Lrpprc) and mortality factor 4-like protein 2 (Morf4l2). kin- cells have decreased levels of expression of the proteasome (prosome, macropain) 26S subunit, ATPase 3 (Psmc3), and ubiquitin-activating enzyme E1, Chr Y 1 (Ube1y1), while the level of expression of Gsr is increased in kin- cells.
Table 1. Differences in Basal Levels of Protein Expression in WT and kin- S49 Cellsa.
| kin- ctrl:WT ctrl |
|||||
|---|---|---|---|---|---|
| gene | accession number | average ratio | unique_pep | spectrum_num | protein |
| Regulation of Transcription | |||||
| Anp32a | IPI00314736 | 3.62 | 2 | 30 | acidic leucine-rich nuclear phosphoprotein 32 family member A |
| Txn1 | IPI00226993 | 2.49 | 2 | 50 | thioredoxin |
| Supt5h | IPI00453975 | 1.70 | 2 | 24 | isoform 2 of transcription elongation factor SPT5 |
| Morf4l2 | IPI00463666 | 0.63 | 2 | 10 | mortality factor 4-like protein 2 |
| Lrpprc | IPI00420706 | 0.33 | 2 | 12 | leucine-rich PPR motif-containing protein |
| Adenyl Nucleotide Binding | |||||
| Gsr | IPI00760002 | 2.39 | 3 | 30 | glutathione reductase |
| Ube1y1 | IPI00123313 | 0.59 | 10 | 54 | Ube1x ubiquitin-activating enzyme E1 X |
| Psmc3 | IPI00758064 | 0.54 | 3 | 17 | proteasome (Prosome, macropain) 26S subunit ATPase 3 |
| Rpsa-ps7 | IPI00677305 | 4.55 | 7 | 287 | similar to 40S ribosomal protein SA |
| Etfb | IPI00121440 | 3.48 | 2 | 47 | electron transfer flavoprotein subunit β |
| Tsnax | IPI00137296 | 2.72 | 2 | 17 | translin-associated protein X |
| Tnpo3 | IPI00464114 | 2.44 | 4 | 49 | isoform 1 of transportin-3 |
| Glyr1 | IPI00817029 | 2.00 | 2 | 4 | putative oxidoreductase isoform 1 |
| Snrpd3 | IPI00119224 | 1.92 | 4 | 236 | small nuclear ribonucleoprotein Sm D3 |
| Gm4492 | IPI00853739 | 1.90 | 4 | 65 | Gm4492 similar to gag |
| Lgals1 | IPI00229517 | 1.81 | 3 | 114 | galectin-1 |
| Plrg1 | IPI00331172 | 0.61 | 2 | 18 | pleiotropic regulator 1 |
| Lrrc59 | IPI00123281 | 0.58 | 2 | 17 | leucine-rich repeat-containing protein 59 |
| Anxa5 | IPI00317309 | 0.10 | 2 | 8 | Annexin A5 |
Proteins whose levels of expression differ between kin- and WT S49 cells under basal (control, ctrl) conditions are listed. The proteins are classified according to the DAVID bioinformatics software. The data shown are the average ratios (kin- ctrl:WT ctrl) from at least two biological replicates. The data for proteins whose expression is increased in kin- cells are shown in bold; proteins with decreased expression in kin- cells are shown in italics. Also shown are the number of unique peptides identified for each protein (unique_pep) and the number of PQD spectra (spectrum_num) used for each protein quantitation.
To confirm the findings from the proteomic analysis, we tested the biologic role of Gsr, which has enhanced basal expression in kin- cells. Immunoblot studies confirmed this result (Figure 2A). Incubation with H2O2 produced more cell killing and generated more of the oxidative product malondialdehyde in WT than in kin- cells (Figures 2B,C). These findings imply that PKA suppresses Gsr expression in WT cells and enhances their sensitivity to oxidative damage.
Figure 2.

Enhanced glutathione reductase expression and reduced sensitivity to cell death and lipid peroxidation in response to H2O2 of kin- vs WT S49 cells. (A) Immunoblotting confirms data from the proteomics analysis that kin- cell lysates have more glutathione reductase than do WT S49 cell lysates (both 25 μg of protein/well). The bottom panel shows quantitation of protein expression by densitometry (mean ± SEM; n = 3). *p < 0.05. (B) Incubation of WT and kin- cells for 16 h at 37 °C with 150 μM H2O2 produced greater cell death (representing both necrosis and apoptosis) in WT cells than in kin- cells, but this difference was not observed in cells incubated with 1 μM staurosporine. kin- cells also experienced less cell death under control conditions (incubation with H2O for 16 h). (C) A 16 h incubation at 37 °C with 150 μM H2O2 produced more lipid peroxidation, assessed as MDA, in WT cells than in kin- cells. The data shown in panels B and C are means ± SEM (n = 7). *p < 0.05; ***p < 0.001.
Comparison of Changes in Protein Expression between WT and kin- S49 Cells Incubated with 8-CPT-cAMP for 6 h: cAMP/PKA-Dependent and cAMP/PKA-Independent Changes in Protein Expression
Incubation of WT S49 cells with 8-CPT-cAMP for 6 h increased the expression of 16 proteins and decreased the expression of 9 proteins. Expression of 21 of these 25 proteins was unchanged in similarly treated kin- cells, and thus, these changes are cAMP/PKA-dependent. Treatment of kin- cells with 8-CPT-cAMP changed the expression of 4 of these 25 proteins, three of which are cAMP/PKA-independent, as their expression changed similarly in WT cells (Exosc7, exosome component 7; Thy1, Thy-1 membrane glycoprotein precursor; Psme2, proteasome activator complex subunit 2). The expression of isocitrate dehydrogenase 3 [NAD+], gamma (Idh3g) produced opposite changes in WT and kin- cells.
Table 2 lists proteins with changes in the levels of expression in response to 8-CPT-cAMP and their functional classifications by bioinformatic analysis. These include increased expression in WT cells of proteins involved in coenzyme metabolic processes and altered expression (both increase and decrease) of certain proteins that modify chromatin or are involved in protein transport. Thus, on the basis of differences between WT and kin- S49 cells, cAMP appears to regulate many metabolic processes, chromatin modifications, and protein transport pathways in a PKA-dependent manner.
Table 2. Effect of Treatment with CPT-cAMP for 6 h on Protein Expression of WT and kin- S49 Cellsa.
| WT CPT 6 h:WT ctrl |
|||||
|---|---|---|---|---|---|
| gene symbol | accession number | average ratio | unique_pep | spectrum_num | protein |
| PKA-Dependent | |||||
| Coenzyme Metabolic Process | |||||
| Idh3g | IPI00109169 | 4.43 (0.55*) | 2 | 22 | isocitrate dehydrogenase [NAD] subunit γ |
| Gsr | IPI00760002 | 4.28 | 3 | 30 | glutathione reductase |
| Glyr1 | IPI00817029 | 2.18 | 2 | 4 | glyoxylate reductase 1 homologue |
| Chromatin Modification | |||||
| Morf4l2 | IPI00463666 | 2.46 | 2 | 10 | mortality factor 4-like protein 2 |
| Huwe1 | IPI00453615 | 0.57 | 4 | 27 | isoform 4 of E3 ubiquitin-protein ligase |
| Nasp | IPI00115987 | 0.32 | 2 | 17 | nuclear autoantigenic sperm protein isoform 1 |
| Protein Transport | |||||
| Gdi2 | IPI00122565 | 2.02 | 3 | 17 | isoform 1 of Rab GDP dissociation inhibitor β |
| Ran | IPI00134621 | 1.56 | 2 | 72 | GTP-binding nuclear protein Ran |
| Nasp | IPI00115987 | 0.32 | 2 | 17 | nuclear autoantigenic sperm protein isoform 1 |
| Ptges3 | IPI00762817 | 5.45 | 2 | 5 | prostaglandin E synthase 3 |
| Tsnax | IPI00137296 | 4.20 | 2 | 17 | translin-associated protein X |
| Capza2 | IPI00111265 | 2.45 | 2 | 9 | F-actin-capping protein subunit α2 |
| Rpsa-ps7 | IPI00677305 | 2.25 | 7 | 287 | similar to 40S ribosomal protein SA |
| Dcps | IPI00459280 | 2.10 | 2 | 13 | scavenger mRNA-decapping enzyme |
| Exosc4 | IPI00310857 | 1.89 | 2 | 35 | exosome complex exonuclease RRP41 |
| Pgam5 | IPI00226387 | 1.86 | 2 | 16 | isoform 2 of phosphoglycerate mutase family member 5 |
| Gm4492 | IPI00853739 | 1.64 | 4 | 65 | similar to gag |
| Anp32e | IPI00277026 | 1.64 | 4 | 121 | isoform 2 of acidic leucine-rich nuclear phosphoprotein 32 family member E |
| Ppia | IPI00554989 | 1.60 | 4 | 34 | peptidyl-prolyl cis–trans isomerase |
| Anxa5 | IPI00317309 | 0.47 | 2 | 8 | Annexin A5 |
| Cops4 | IPI00131871 | 0.46 | 2 | 7 | signalosome complex subunit 4 |
| Lrrc59 | IPI00123281 | 0.46 | 2 | 17 | leucine-rich repeat-containing protein 59 |
| Uchl5 | IPI00124938 | 0.45 | 2 | 11 | isoform 1 of ubiquitin carboxyl-terminal hydrolase isozyme L5 |
| Tnpo1 | IPI00798527 | 0.22 | 4 | 12 | Tnpo1 transportin-1 |
| PKA-Independent | |||||
| Exosc7 | IPI00387489 | 0.60 (0.46*) | 2 | 12 | exosome component 7 |
| Thy1 | IPI00109727 | 0.40 (0.5*) | 2 | 14 | Thy-1 membrane glycoprotein |
| Psme2 | IPI00124225 | 0.24 (0.3*) | 3 | 13 | Psme2b-ps proteasome activator complex subunit 2 |
Proteins whose levels of expression change in WT or kin- S49 cells incubated with CPT-cAMP for 6 h are listed. The proteins are classified according to the DAVID bioinformatics software. The data shown are the average ratios (WT CPT 6 h:WT ctrl or kin-CPT 6 h:kin- control cells) from at least two independent experiments. The proteins whose levels of expression increased and decreased upon treatment are shown in bold and italics, respectively. Also shown are the number of unique peptides identified for each protein (unique_pep) and of PQD spectra (spectrum_num) used for protein quantitation. The PKA-independent proteins (i.e., whose expression changes in the kin- cells following a 6 h incubation with CPT-cAMP) have two numbers in the average ratio column. The ratios upon CPT-cAMP treatment for 6 h in kin- cells (kin- CPT 6 h:kin- Ctrl) are shown in parentheses.
Changes in Protein Expression in WT Cells Incubated with 8-CPT-cAMP for 24 h
Incubation of WT cells with 8-CPT-cAMP for 24 h altered the expression of 30 proteins (10 decreasing and 20 increasing) (Table 3). Bioinformatics analysis revealed that these include proteins involved in the regulation of the cell cycle, response to stress, protein transport, and transcription. In terms of molecular function, eight proteins bind purine nucleotides (seven are ATP binding proteins) and three are metal ion binding proteins. Treatment with 8-CPT-cAMP for 24 h decreased expression of several transport proteins but increased expression of multiple proteins that regulate transcription or bind ATP. Incubation with 8-CPT-cAMP of WT cells for 24 h thus has more widespread effects on protein expression than does incubation for 6 h. Of note, WT S49 cells that have increased cellular levels of cAMP for 24 h undergo arrest in the G1 phase of the cell cycle; such cells then begin to undergo mitochondria-dependent intrinsic apoptosis.5,11
Table 3. Effect of Incubation with CPT-cAMP for 24 h on Protein Expression in WT S49 Cellsa.
| WT CPT 24 h:WT ctrl |
|||||
|---|---|---|---|---|---|
| gene symbol | accession number | average ratio | unique_pep | spectrum_num | protein |
| Regulation of Cell Cycle | |||||
| Calr | IPI00123639 | 1.90 | 4 | 206 | CalrCalreticulin |
| Ywhah | IPI00227392 | 0.56 | 3 | 38 | Ywhah 14-3-3 protein η |
| Cep192 | IPI00762607 | 0.41 | 2 | 63 | Cep192 40 kDa protein |
| ATP Binding | |||||
| Skiv2l2 | IPI00460846 | 4.82 | 2 | 6 | Superkillerviralicidic activity 2-like 2 |
| Galk1 | IPI00265025 | 3.09 | 3 | 9 | galactokinase 1 |
| Zap70 | IPI00331216 | 2.63 | 2 | 35 | tyrosine-protein kinase ZAP-70 |
| Map2k1 | IPI00466610 | 1.67 | 4 | 18 | dual-specificity mitogen-activated protein kinase kinase 1 |
| Ruvbl2 | IPI00123557 | 1.60 | 2 | 20 | RuvB-like 2 |
| Vars | IPI00130353 | 1.60 | 8 | 153 | valyl-tRNA synthetase |
| Mthfd1 | IPI00122862 | 0.56 | 3 | 21 | C1-tetrahydrofolate synthase, cytoplasmic |
| Cellular Response to Stress | |||||
| Supt16h | IPI00120344 | 1.88 | 4 | 8 | FACT complex subunit |
| Ruvbl2 | IPI00123557 | 1.60 | 2 | 20 | RuvB-like 2 |
| Pcna | IPI00113870 | 0.60 | 4 | 142 | proliferating cell nuclear antigen |
| Protein Transport | |||||
| Pcna | IPI00113870 | 0.60 | 4 | 142 | proliferating cell nuclear antigen |
| Ywhah | IPI00227392 | 0.56 | 3 | 38 | 14-3-3 protein η |
| Rpl38 | IPI00677340 | 0.55 | 2 | 19 | similar to ribosomal protein L38 |
| Regulation of Transcription | |||||
| Anp32a | IPI00314736 | 2.93 | 2 | 30 | acidic leucine-rich nuclear phosphoprotein 32 family member A |
| Supt16h | IPI00120344 | 1.88 | 4 | 8 | FACT complex subunit |
| Pdlim1 | IPI00309768 | 1.86 | 2 | 22 | PDZ and LIM domain protein 1 |
| Ruvbl2 | IPI00123557 | 1.60 | 2 | 20 | RuvB-like 2 |
| Ywhah | IPI00227392 | 0.56 | 3 | 38 | 14-3-3 protein η |
| Zinc Ion Binding | |||||
| Calr | IPI00123639 | 1.90 | 4 | 206 | calreticulin precursor |
| Pdlim1 | IPI00309768 | 1.86 | 2 | 22 | PDZ and LIM domain protein 1 |
| Cpsf3 | IPI00648606 | 0.64 | 2 | 33 | Cpsf3 protein |
| Lgals7 | IPI00468187 | 5.89 | 3 | 19 | lectin, galactose binding, soluble 7 |
| Gsr | IPI00760002 | 4.34 | 3 | 30 | cytoplasmic of glutathione reductase |
| Ptges3 | IPI00762817 | 4.04 | 2 | 5 | prostaglandin E synthase 3 |
| Ndrg1 | IPI00125960 | 3.63 | 2 | 37 | protein NDRG1 |
| Dcps | IPI00459280 | 2.29 | 2 | 13 | scavenger mRNA-decapping enzyme |
| Hint1 | IPI00108189 | 2.19 | 3 | 17 | histidine triad nucleotide-binding protein 1 |
| Diap1 | IPI00831596 | 2.15 | 6 | 57 | diaphanous homologue 1 |
| Hnrpab | IPI00117288 | 1.93 | 3 | 110 | heterogeneous nuclear ribonucleoprotein A/B |
| Tpi1 | IPI00467833 | 1.73 | 6 | 230 | triosephosphate isomerase |
| BC018371 | IPI00351472 | 1.66 | 5 | 123 | hypothetical AMP-dependent synthetase- and ligase-containing protein |
| Dbi | IPI00108756 | 0.54 | 2 | 15 | acyl-CoA-binding protein |
| AK122209 | IPI00605125 | 0.50 | 2 | 6 | hypothetical protein LOC382038 |
| Acat2 | IPI00228253 | 0.36 | 2 | 62 | acetyl-CoA acetyltransferase |
| Exosc7 | IPI00387489 | 0.28 | 2 | 12 | exosome component 7 |
Proteins whose levels of expression change in WT S49 cells incubated with CPT-cAMP for 24 h are listed. The proteins are classified according to the DAVID bioinformatics software. The average ratios (WT CPT 24 h:WT Ctrl) of protein expression are shown for data obtained in at least two independent experiments. The proteins whose levels of expression increased and decreased upon treatment are shown in bold and italics, respectively. Also shown are the number of unique peptides identified for each protein (unique_pep) and the number of PQD spectra (spectrum_num) used for protein quantitation.
Changes in Protein Expression in WT S49 Cells Incubated with Fsk and IBMX for 6 h
A 6 h incubation of WT S49 cells with Fsk and IBMX, which stimulate membrane ACs and inhibit PDEs, respectively, and prominently increase intracellular cAMP levels in S49 cells,9,20 decreased expression of 10 proteins and increased that of 14 proteins (Table 4). Changes in expression were noted for proteins involved in protein transport or regulation of transcription and include those classified as cofactor binding proteins and adenyl nucleotide binding proteins. Such changes in protein expression likely contribute to the response of S49 cells to increases in the level of endogenous cAMP.
Table 4. Effect of Incubation with Fsk and IBMX for 6 h on the Protein Expression of WT S49 Cellsa.
| WT Fsk 6 h:WT ctrl |
|||||
|---|---|---|---|---|---|
| gene symbol | accession number | average ratio | unique_pep | spectrum_num | protein |
| Cofactor Binding | |||||
| Pygb | IPI00229796 | 2.33 | 3 | 11 | glycogen phosphorylase, brain form |
| Idh3g | IPI00109169 | 1.58 | 2 | 22 | isocitrate dehydrogenase [NAD] subunit γ |
| Gsr | IPI00760002 | 5.80 | 3 | 30 | cytoplasmic isoform of glutathione reductase |
| Dbi | IPI00108756 | 0.37 | 2 | 15 | acyl-CoA-binding protein |
| Protein Transport | |||||
| Copa | IPI00761529 | 2.07 | 4 | 7 | coatomer protein complex subunit α |
| Gdi2 | IPI00122565 | 1.69 | 3 | 17 | isoform 1 of Rab GDP dissociation inhibitor β |
| Spnb2 | IPI00121892 | 0.48 | 11 | 17 | isoform 2 of spectrin β chain, brain 1 |
| Macf1 | IPI00663180 | 0.49 | 7 | 10 | microtubule-actin cross-linking factor 1 isoform 2 |
| Regulation of Transcription | |||||
| Anp32a | IPI00314736 | 1.99 | 2 | 30 | acidic leucine-rich nuclear phosphoprotein 32 family member A |
| Hmgb1 | IPI00620379 | 2.83 | 4 | 12 | 14 kDa protein |
| Morf4l2 | IPI00463666 | 2.21 | 2 | 10 | mortality factor 4-like protein 2 |
| Supt16h | IPI00120344 | 2.08 | 4 | 8 | FACT complex subunit |
| Ywhah | IPI00227392 | 0.64 | 3 | 38 | 14-3-3 protein η |
| Adenyl Nucleotide Binding | |||||
| Idh3g | IPI00109169 | 1.58 | 2 | 22 | isocitrate dehydrogenase [NAD] subunit γ |
| Gsr | IPI00760002 | 5.80 | 3 | 30 | glutathione reductase |
| Psmc3 | IPI00758064 | 0.30 | 3 | 17 | proteasome (prosome, macropain) 26S subunit ATPase 3 |
| Psme2 | IPI00124225 | 0.44 | 3 | 13 | Psme2b-ps proteasome activator complex subunit 2 |
| Lrrc59 | IPI00123281 | 0.46 | 2 | 17 | leucine-rich repeat-containing protein 59 |
| Cops4 | IPI00131871 | 0.56 | 2 | 7 | COP9 signalosome complex subunit 4 |
| Ncaph | IPI00224053 | 0.56 | 3 | 20 | condensin complex subunit 2 |
| Nol5 | IPI00463468 | 0.58 | 4 | 37 | nucleolar protein 5 |
| Gripap1 | IPI00775775 | 1.64 | 3 | 10 | GRIP1-associated protein 1 |
| Dap3 | IPI00275050 | 2.68 | 2 | 21 | isoform 1 of mitochondrial 28S ribosomal protein S29 |
| Exosc4 | IPI00310857 | 1.73 | 2 | 35 | exosome complex exonuclease RRP41 |
| Ptges3 | IPI00762817 | 9.12 | 2 | 5 | prostaglandin E synthase 3 |
| Tsnax | IPI00137296 | 2.76 | 2 | 17 | translin-associated protein X |
Proteins whose levels of expression change in WT S49 cells incubated with Fsk and IBMX for 6 h are listed. The proteins are classified according to the DAVID bioinformatics software. The average ratios of protein expression (WT Fsk 6 h:WT ctrl) are shown from data obtained in at least two independent experiments. The proteins whose levels of expression increased and decreased upon incubation with Fsk and IBMX are shown in bold and italics, respectively. Also shown are the number of unique peptides identified for each protein (unique_pep) and the number of PQD spectra (spectrum_num) used for protein quantitation.
Changes in Protein Expression in S49 WT Cells Incubated with 8-CPT-cAMP or Fsk with IBMX
Comparison of the proteins expressed in response to a 6 h treatment of WT S49 cells with 8-CPT-cAMP, or Fsk with IBMX, revealed 10 proteins with similar directional changes (seven increasing and three decreasing) (Figure 3), while in cells incubated with 8-CPT-cAMP for 24 h or with Fsk and IBMX for 6 h, six proteins had similar such changes (four increasing and two decreasing). We identified 14 proteins with similar responses (nine increasing and five decreasing) in cells incubated with 8-CPT-cAMP (6 or 24 h) or Fsk and IBMX. Those 14 proteins include ones involved in coenzyme binding and regulation of transcription. Overall, the results indicate that treatment of S49 WT cells with 8-CPT-cAMP, or Fsk with IBMX, have some similarities but also several differences in their impact on the S49 proteome.
Figure 3.

Proteins with changes in expression in WT S49 cells incubated with CPT-cAMP, or IBMX with Fsk. The diagram shows the proteins that have significant changes in WT cells incubated for 6 h with CPT-cAMP, or Fsk with IBMX, or for 24 h with CPT-cAMP. The names of proteins whose levels of expression increased are shown in bold, and the names of proteins whose levels of expression decreased are shown in italics.
Comparison of Data Derived from DNA Microarray and Proteomics Analyses
DNA microarray data are available3 for 196 of the 708 proteins identified in this study of S49 cells. We compared the two data sets in terms of the responses of WT S49 cells treated with 8-CPT-cAMP for 6 and 24 h relative to expression of control WT cells. We found no correlation (r2 < 0.001) between the two data sets in cells incubated with 8-CPT-cAMP for 6 h. By contrast, the correlation coefficient between the DNA microarray data and proteomic studies was 0.41 for WT cells incubated for 24 h with 8-CPT-cAMP and 0.42 between the DNA microarray data of cells incubated with 8-CPT-cAMP for 6 h and the changes in protein expression after incubation with 8-CPT-cAMP for 24 h. Among the 196 proteins quantified in both DNA microarrays and proteomics, eight proteins had similar directional changes in cells incubated with 8-CPT-cAMP for 6 or 24 h.
Immunoblot Analysis of Lgals7 in WT Cells Incubated with 8-CPT-cAMP
Immunoblot analysis of WT S49 cells (control or after treatment with 8-CPT-cAMP for 6 and 24 h) showed an increase in the level of expression of Lgals7, especially at the 24 h time point, confirming the data obtained by iTRAQ (Figure 4).
Figure 4.

Immunoblot analysis of Lgals7 in WT S49 cells. Proteins from control WT cells and WT cells incubated with CPT-cAMP for 6 and 24 h were analyzed by immunoblotting as described in Experimental Procedures. α-Tubulin was used as a loading control. The data shown are from two separate experiments.
Discussion
The goal of this study was to use S49 lymphoma cells to define the cAMP/PKA-regulated proteome. We compared protein expression of WT and kin- S49 cells under basal culture conditions and assessed the impact of increases in the level of cAMP in WT S49 cells by a cAMP analogue or by increasing the level of endogenous cAMP via activation of AC and blockade of PDE. Using a conservative approach for protein detection, we identified 708 proteins, some of which exhibited changes in expression in response to increases in the level of cAMP. Classification of these proteins by a bioinformatics tool revealed different categories, GO terms, and pathways for cAMP/PKA-dependent events, many of which have not been previously known.
WT and kin- S49 cells differ in their levels of expression of 19 proteins under basal conditions: five such proteins are classified in the biological process subcategory “regulation of transcription” and three in the subcategory “adenyl nucleotide binding”. Txn1 and Gsr, which both have higher basal expression in kin- cells, are involved in protection of cells from oxidant-induced injury and can influence cell proliferation and apoptosis.21,22 The greater expression of Txn1 and Gsr in kin- cells implies that cAMP and PKA inhibit their expression in WT cells. Gsr, an enzyme of cellular antioxidant defense, reduces oxidized glutathione disulfide (GSSG) to GSH. The results (Figure 2) provided independent evidence that Gsr protein expression is greater in kin- cells than in WT cells and that kin- cells are less sensitive to oxidative stress, implying that PKA inhibits Gsr expression under basal conditions and enhances the sensitivity to oxidative damage. By contrast with the results indicating greater expression of Txn1 in kin- cells, increases in the level of cAMP induce Txn1 and extend survival of retinal pigment epithelial cells in a PKA-dependent manner.23 The contrasting results in retinal pigment epithelial cells and S49 cells suggest that cAMP and PKA can have opposite effects on the expression of Txn1 in different cell types but that its enhanced expression increases the rate of cell survival.
We assessed time-dependent changes in protein expression in S49 cells in response to increases in the level of cAMP to identify proteins that may be primary targets of cAMP/PKA (at an earlier, 6 h, time point) while proteins with altered expression after 24 h likely include secondary ones. We identified 22 potential primary targets that had altered expression in WT but not kin- S49 cells incubated for 6 h with 8-CPT-cAMP. Such proteins are involved in protein transport, chromatin modification, and coenzyme metabolism (Table 2). Among the three proteins associated with chromatin modification, expression of Huwe1and Nasp decreased in WT cells. Nasp is required for DNA replication, cell-cycle progression, and cell proliferation and interacts with histones.24,25 Previous data have implied a role for cAMP/PKA in regulating histone modifications and chromatin structure (e.g., ref (26)).
WT S49 cells incubated with 8-CPT-cAMP for 24 h have altered expression of proteins involved in biological processes that include cell-cycle regulation (Calr, calreticulin; Cep192, centrosomal protein 192; Ywhah), cellular response to stress (Ruvbl2, RuvB-like protein 2; Pcna, proliferating cell nuclear antigen; Supt16h), and regulation of transcription. Calr can modulate gene transcription by nuclear hormone receptors27 and also has extracellular functions, e.g., tumor and apoptotic cell recognition and wound healing.28,29 Cep192 regulates centrosomes.30 The Ywhah gene encodes 14-3-3 η; because 14-3-3 can be anti-apoptotic,31 perhaps the decrease in the level of expression of 14-3-3 η influences cAMP/PKA-promoted apoptosis of S49 cells.5 The cell cycles of one-cell stage mouse fertilized eggs32 and cycling Xenopus egg extracts33 are accompanied by a decrease in cAMP concentration and PKA activity at the onset of mitosis and transition between mitosis and the G1 phase of the cell cycle. Such findings suggest that the changes in protein expression that we observe in S49 cells may occur in other cells in which cAMP and PKA regulate cell-cycle progression.
Among the three proteins classified as “cellular response to stress” is Ruvbl2, a component of the NuA4 histone acetyltransferase complex that contributes to the transcription of certain genes by acetylation of nucleosomal histones H4 and H2A.34 The NuA4 complex can influence DNA repair and may activate transcriptional programs associated with oncogene-mediated growth induction, tumor suppressor-stimulated growth arrest, replicative senescence, and apoptosis.34 We found that cAMP/PKA activation decreases expression of Pcna; of note, low levels of Pcna are associated with apoptosis.35
Lgals7 has the greatest increase in expression of all the proteins we identified in WT S49 cells incubated with 8-CPT-cAMP for 24 h. As a pro-apoptotic protein36 that functions upstream of JNK activation and cytochrome c release,37 Lgals7 may contribute to cAMP/PKA-promoted apoptosis in WT S49 cells.4,5 We also found sustained changes in certain transport proteins in response to 6 and 24 h incubations of WT S49 cells with 8-CPT-cAMP. Cyclic AMP/PKA-dependent pathways influence transport proteins in many cell types (e.g., Sf9 and COS-738 and HEK29339 cells).
Increases in cellular cAMP levels might perturb cellular function via PKA or by Epac or CNG channels, other effectors of cAMP action.40 kin- cells provide a means to identify proteins whose expression is PKA-dependent and does not require activation of Epac. We found numerous differences in basal protein expression and in the effects of increases in the level of cAMP on protein expression in WT cells compared to kin-S49 cells (Tables 1–4). Such proteins include those involved in coenzyme binding and regulation of transcription. A role for cAMP/PKA in transcription is well-known (e.g., refs (5) and (41)). DNA microarray analysis of WT S49 cells incubated with 8-CPT-cAMP for 24 h reveals changes in ∼33% of the transcriptome.3 We find that changes in the transcriptome are concordant with those in the proteome in cells incubated with 8-CPT-cAMP for 24 h but not 6 h, likely reflecting the delay in protein synthesis that follows changes in mRNA expression. In addition, increases in the level of cAMP may influence protein expression through effects on protein translation (e.g., ref (42)).
As part of efforts to validate discovery- and target-based protein quantification using iTRAQ and PQD, Wu and co-workers recently reported a change in expression of certain proteins in WT and kin- S49 cells treated with 8-CPT-cAMP for 4 h.43 They identified 18 proteins with basal differences in expression between WT and kin- cells, three of which were only identified by the target-based approach. We identified 10 of the 15 proteins that Wu et al. quantified using the discovery-based approach. We found three of the same proteins (LOC100041831 similar to glyceraldehyde-3-phosphate dehydrogenase, LOC633016 similar to chromobox homologue 3 isoform 2, and Snd1 staphylococcal nuclease domain-containing protein 1) in two of our three data sets that changed as observed by Wu et al; in one of our three data sets, we identified three other proteins (glycyl-tRNA synthetase, Mthfd2 bifunctional methylenetetrahydrofolate dehydrogenase/cyclohydrolase, and RuvB-like 1) with changes akin to those noted by Wu et al. (Table 1 of the Supporting Information). Wu et al. found that a 4 h incubation of WT cells with 8-CPT-cAMP altered expression of three proteins, while we identified 22 such proteins in WT cells incubated with this analogue for 6 h (Table 2). One of the three proteins identified by Wu et al. (T-complex protein subunit β) had similar changes in two of our three data sets. Thus, the data from Wu et al. are similar to our findings, but there are some disparities, which likely reflect several differences between their studies and ours, including the duration of the treatment of cells with 8-CPT-cAMP, sample processing protocols, and criteria for identifying changes in protein expression.
Previous studies reported that cAMP/PKA increases the level of expression of cytotoxic T lymphocyte antigen-2α (CTLA-2α) and Bcl-2-interacting mediator of cell death (Bim) in WT S49 cells.5,44 We did not detect changes in these low-abundance proteins, because our analytical procedure favors detection of more abundant ones. S49 cells have large nuclei relative to their amount of cytoplasm; detection of some proteins is thus more difficult than with other cell types. Cyclic AMP/PKA-promoted apoptosis of S49 and other immature lymphoid cells occurs via mitochondria-mediated events.10,11 Thus, it will be of interest to conduct proteomics analysis of mitochondria of S49 cells following increases in the level of cAMP and activation of PKA. In addition, an important future direction will be to conduct phosphoproteomics analysis in these cells. Recent studies have shown that cAMP and PKA target important structural, regulatory, and transporter proteins in rat inner medullary collecting duct cells.45 Comparisons of cAMP/PKA-regulated proteins in different cell types should thus prove to be important in terms of identifying proteins that are shared “targets” versus those that are unique to particular cell types.
Acknowledgments
We thank Zhouxin Shen for his help with the database search and Thalia McCann for experimental assistance.
Glossary
Abbreviations
- 8-CPT-cAMP
8-(4-chlorophenylthio)-cAMP
- AC
adenylyl cyclases
- CAD
collision-activated dissociation
- CNG
cyclic nucleotide-gated
- Epac
exchange protein activated by cAMP
- FDR
false discovery rate
- Fsk
forskolin
- GO
gene ontology
- GPCR
G-protein-coupled receptor
- IBMX
3-isobutyl-1-methylxanthine
- iTRAQ
isobaric tagging for relative and absolute quantitation
- PDE
cyclic nucleotide phosphodiesterase
- PI
propidium iodide
- PKA
protein kinase A
- PKG
protein kinase G
- PQD
pulsed Q dissociation–collision
- SEM
standard error of the mean
- SPI
scored peak intensity
- WT
wild-type
Supporting Information Available
A list of all the proteins identified in this study (Supplemental Table 1). This material is available free of charge via the Internet at http://pubs.acs.org.
The authors declare no competing financial interest.
This work was supported by the Howard Hughes Medical Institute (S.S.T.) and National Institutes of Health Grants DK54441 (S.S.T.), GM066232 (P.A.I.), and HL107200 (P.A.I.).
Funding Statement
National Institutes of Health, United States
Supplementary Material
References
- Skalhegg B. S.; Tasken K. (2000) Specificity in cAMP/PKA signaling pathway. Differential expression, regulation, and subcellular localization of subunits of PKA. Front. Biosci. 5, D678–D693. [DOI] [PubMed] [Google Scholar]
- Weissinger E. M.; Oettrich K.; Evans C.; Genieser H. G.; Schwede F.; Dangers M.; Dammann E.; Kolb H. J.; Mischak H.; Ganser A.; Kolch W. (2004) Activation of protein kinase A (PKA) by 8-Cl-cAMP as a novel approach for antileukaemic therapy. Br. J. Cancer 91, 186–192. [DOI] [PMC free article] [PubMed] [Google Scholar]
- Zambon A. C.; Zhang L.; Minovitsky S.; Kanter J. R.; Prabhakar S.; Salomonis N.; Vranizan K.; Dubchak I.; Conklin B. R.; Insel P. A. (2005) Gene expression patterns define key transcriptional events in cell-cycle regulation by cAMP and protein kinase A. Proc. Natl. Acad. Sci. U.S.A. 102(24), 8561–8566. [DOI] [PMC free article] [PubMed] [Google Scholar]
- Insel P. A.; Zhang L.; Murray F.; Yokouchi H.; Zambon A. C. (2012) Cyclic AMP is both a pro-apoptotic and anti-apoptotic second messenger. Acta Physiol. 204(2), 277–287. [DOI] [PMC free article] [PubMed] [Google Scholar]
- Zhang L.; Insel P. A. (2004) The Pro-apoptotic protein Bim is a convergence point for cAMP/protein kinase A- and glucocorticoid-promoted apoptosis of lymphoid cells. J. Biol. Chem. 279, 20858–20865. [DOI] [PubMed] [Google Scholar]
- Van DaalenWetters T.; Coffino P. (1987) Cultured S49 mouse T lymphoma cells. Methods Enzymol. 151, 9–19. [DOI] [PubMed] [Google Scholar]
- Insel P. A.; Bourne H. R.; Coffino P.; Tomkins G. M. (1975) Cyclic AMP-dependent protein kinase: Pivotal role in regulation of enzyme induction and growth. Science 190, 896–898. [DOI] [PubMed] [Google Scholar]
- Richardson M. D.; Goka T. J.; Barber R.; Butcher R. W. (1994) Growth of S49 wild type cells in 3 nM epinephrine increases cyclic AMP phosphodiesterase activity. Life Sci. 54, 863–875. [DOI] [PubMed] [Google Scholar]
- Zhang L.; Insel P. A. (2001) Bcl-2 protects lymphoma cells from apoptosis but not growth arrest promoted by cAMP and dexamethasone. Am. J. Physiol. 281, C1642–C1647. [DOI] [PubMed] [Google Scholar]
- Zambon A. C.; Wilderman A.; Ho A.; Insel P. A. (2011) Increased expression of the pro-apoptotic protein BIM, a mechanism for cAMP/protein kinase A (PKA)-induced apoptosis of immature T cells. J. Biol. Chem. 286, 33260–33267. [DOI] [PMC free article] [PubMed] [Google Scholar]
- Zhang L.; Zambon A. C.; Vranizan K.; Pothula K.; Conklin B. R.; Insel P. A. (2008) Gene expression signatures of cAMP/protein kinase A (PKA)-promoted, mitochondrial-dependent apoptosis. Comparative analysis of wild-type and cAMP-deathless S49 lymphoma cells. J. Biol. Chem. 283, 4304–4313. [DOI] [PMC free article] [PubMed] [Google Scholar]
- Insel P. A.; Honeysett J. M. (1981) Glucocorticoid-mediated inhibition of ornithine decarboxylase activity in S49 lymphoma cells. Proc. Natl. Acad. Sci. U.S.A. 78, 5669–5672. [DOI] [PMC free article] [PubMed] [Google Scholar]
- Albert D. A. (1995) The effect of cyclic-AMP on the regulation of c-myc expression in T lymphoma cells. J. Clin. Invest. 95, 1490–1496. [DOI] [PMC free article] [PubMed] [Google Scholar]
- Tian Q.; Stepaniants S. B.; Mao M.; Weng L.; Feetham M. C.; Doyle M. J.; Yi E. C.; Dai H.; Thorsson V.; Eng J.; Goodlett D.; Berger J. P.; Gunter B.; Linseley P. S.; Stoughton R. B.; Aebersold R.; Collins S. J.; Hanlon W. A.; Hood L. E. (2004) Integrated genomic and proteomic analyses of gene expression in mammalian cells. Mol. Cell. Proteomics 3, 960–969. [DOI] [PubMed] [Google Scholar]
- Hegde P. S.; White I. R.; Debouck C. (2003) Interplay of transcriptomics and proteomics. Curr. Opin. Biotechnol. 14, 647–651. [DOI] [PubMed] [Google Scholar]
- Ross P. L.; Huang Y. N.; Marchese J. N.; Williamson B.; Parker K.; Hattan S.; Khainovski N.; Pillai S.; Dey S.; Daniels S.; Purkayastha S.; Juhasz P.; Martin S.; Bartlet-Jones M.; He F.; Jacobson A.; Pappin D. J. (2004) Multiplexed protein quantitation in Saccharomyces cerevisiae using amine-reactive isobaric tagging reagents. Mol. Cell. Proteomics 3, 1154–1169. [DOI] [PubMed] [Google Scholar]
- O’Brien R. N.; Shen Z.; Tachikawa K.; Lee P. A.; Briggs S. P. (2010) Quantitative proteome analysis of pluripotent cells by iTRAQ mass tagging reveals post-transcriptional regulation of proteins required for ES cell self-renewal. Mol. Cell. Proteomics 9, 2238–2251. [DOI] [PMC free article] [PubMed] [Google Scholar]
- Huang D. W.; Sherman B. T.; Lempicki R. A. (2009) Systematic and integrative analysis of large gene lists using DAVID bioinformatics resources. Nat. Protoc. 4, 44–57. [DOI] [PubMed] [Google Scholar]
- Rasband W. S. (1997–2012) ImageJ, National Institutes of Health, Bethesda, MD. [Google Scholar]
- Heuschneider G.; Schwartz R. (1989) cAMP and forskolin decrease γ-aminobutyric acid-gated chloride flux in rat brain synaptoneurosomes. Proc. Natl. Acad. Sci. U.S.A. 86, 2938–2942. [DOI] [PMC free article] [PubMed] [Google Scholar]
- Fujii J.; Ito J. I.; Zhang X.; Kurahashi T. (2011) Unveiling the roles of the glutathione redox system in vivo by analyzing genetically modified mice. J. Clin. Biochem. Nutr. 49, 70–78. [DOI] [PMC free article] [PubMed] [Google Scholar]
- Fernandes A. P.; Holmgren A. (2004) Glutaredoxins: Glutathione-Dependent Redox Enzymes with Functions Far Beyond a Simple Thioredoxin Backup System. Antioxid. Redox Signaling 6, 63–74. [DOI] [PubMed] [Google Scholar]
- Ramamoto M.; Sato N.; Tajima H.; Furuke K.; Ohira A.; Honda Y.; Yodoi J. (1997) Induction of human thioredoxin in cultured human retinal pigment epithelial cells through cyclic AMP-dependent pathway; involvement in the cytoprotective activity of prostaglandin E1. Exp. Eye Res. 65, 645–652. [DOI] [PubMed] [Google Scholar]
- O’Rand M. G.; Richardson R. T.; Zimmerman L. J.; Widgren E. E. (1992) Sequence and localization of human NASP: Conservation of a Xenopus histone-binding protein. Dev. Biol. 154(1), 37–44. [DOI] [PubMed] [Google Scholar]
- Alekseev O. M.; Widgren E. E.; Richardson R. T.; O’Rand M. G. (2005) Association of NASP with HSP90 in mouse spermatogenic cells: Stimulation of ATPase activity and transport of linker histones into nuclei. J. Biol. Chem. 280(4), 2904–2911. [DOI] [PubMed] [Google Scholar]
- Li J.; Guo Y.; Schroeder F. A.; Youngs R. M.; Schmidt T. W.; Ferris C.; Konradi C.; Akbarian S. (2004) Dopamine D2-like antagonists induce chromatin remodeling in striatal neurons through cyclic AMP-protein kinase A and NMDA receptor signaling. J. Neurochem. 90(5), 1117–1131. [DOI] [PMC free article] [PubMed] [Google Scholar]
- Perrone L.; Tell G.; Di Lauro R. (1999) Calreticulin enhances the transcriptional activity of thyroid transcription factor-1 by binding to its homeodomain. J. Biol. Chem. 274(8), 4640–4645. [DOI] [PubMed] [Google Scholar]
- Chao M. P.; Jaiswal S.; Weissman-Tsukamoto R.; Alizadeh A. A.; Gentles A. J.; Volkmer J.; Weiskopf K.; Willingham S. B.; Raveh T.; Park C. Y.; Majeti R.; Weissman I. L. (2010) Calreticulin is the dominant pro-phagocytic signal on multiple human cancers and is counterbalanced by CD47. Sci. Transl. Med. 2(63), 63–94. [DOI] [PMC free article] [PubMed] [Google Scholar]
- Tarr J. M.; Young P. J.; Morse R.; Shaw D. J.; Haigh R.; Petrov P. G.; Johnson S. J.; Winyard P. G.; Eggleton P. (2010) A mechanism of release of calreticulin from cells during apoptosis. J. Mol. Biol. 401(5), 799–812. [DOI] [PubMed] [Google Scholar]
- Zhu F.; Lawo S.; Bird A.; Pinchev D.; Ralph A.; Richter C.; Müller-Reichert T.; Kittler R.; Hyman A. A.; Pelletier L. (2008) The mammalian SPD-2 ortholog Cep192 regulates centrosome biogenesis. Curr. Biol. 18(2), 136–141. [DOI] [PubMed] [Google Scholar]
- Gardino A. K.; Yaffe M. B. (2011) 14-3-3 proteins as signaling integration points for cell cycle control and apoptosis. Semin. Cell Dev. Biol. 22(7), 688–695. [DOI] [PMC free article] [PubMed] [Google Scholar]
- Yu B.; Wang Y.; Liu Y.; Liu Y.; Li X.; Wu D.; Zong Z.; Zhang J.; Yu D. (2005) Protein kinase A regulates cell cycle progression of mouse fertilized eggs by means of MPF. Dev. Dyn. 232(1), 98–105. [DOI] [PubMed] [Google Scholar]
- Grieco D.; Porcellini A.; Avvedimento E. V.; Gottesman M. E. (1996) Requirement for cAMP-PKA pathway activation by M phase-promoting factor in the transition from mitosis to interphase. Science 271(5256), 1718–1723. [DOI] [PubMed] [Google Scholar]
- Utley R. T.; Lacoste N.; Jobin-Robitaille O.; Allard S.; Côté J. (2005) Regulation of NuA4 histone acetyltransferase activity in transcription and DNA repair by phosphorylation of histone H4. Mol. Cell. Biol. 25(18), 8179–8190. [DOI] [PMC free article] [PubMed] [Google Scholar]
- Paunesku T.; Mittal S.; Protić M.; Oryhon J.; Korolev S. V.; Joachimiak A.; Woloschak G. E. (2001) Proliferating cell nuclear antigen (PCNA): Ringmaster of the genome. Int. J. Radiat. Biol. 77(10), 1007–1021. [DOI] [PubMed] [Google Scholar]
- Bernerd F.; Sarasin A.; Magnaldo T. (1999) Galectin-7 overexpression is associated with the apoptotic process in UVB-induced sunburn keratinocytes. Proc. Natl. Acad. Sci. U.S.A. 96, 11329–11334. [DOI] [PMC free article] [PubMed] [Google Scholar]
- Kuwabara I.; Kuwabara Y.; Yang R. Y.; Schuler M.; Green D. R.; Zuraw B. L.; Hsu D. K.; Liu F. T. (2002) Galectin-7 (PIG1) exhibits pro-apoptotic function through JNK activation and mitochondrial cytochrome c release. J. Biol. Chem. 277, 3487–3497. [DOI] [PubMed] [Google Scholar]
- Pristupa Z. B.; McConkey F.; Liu F.; Man H. Y.; Lee F. J. S.; Wang Y. T.; Niznik H. B. (1998) Protein kinase-mediated bidirectional trafficking and functional regulation of the human dopamine transporter. Synapse 30(1), 79–87. [DOI] [PubMed] [Google Scholar]
- Mant A.; Elliott D.; Eyers P. A.; O’Kelly I. M. (2011) Protein kinase A is central for forward transport of two-pore domain potassium channels K(2P)3.1 and K(2P)9.1. J. Biol. Chem. 286, 14110–14119. [DOI] [PMC free article] [PubMed] [Google Scholar]
- Poppe1 H.; Rybalkin S. D.; Rehmann H.; Hinds H. R.; Tang X.; Christensen A. E.; Schwede F.; Genieser H.; Bos J. L.; Doskeland S. O.; Beavo J. A.; Butt E. (2008) Cyclic nucleotide analogs as probes of signaling pathways. Nat. Methods 5, 277–278. [DOI] [PubMed] [Google Scholar]
- Hu G.; Steen B. R.; Lian T.; Sham A. P.; Tam N.; Tangen K. L.; Kronstad J. W. (2007) Transcriptional regulation by protein kinase A in Cryptococcus neoformans. PLoS Pathog. 3(3), e42. [DOI] [PMC free article] [PubMed] [Google Scholar]
- Menon K. M. J.; Menon B. (2012) Structure, function and regulation of gonadotropin receptors: A perspective. Mol. Cell. Endocrinol. 356, 88–97. [DOI] [PMC free article] [PubMed] [Google Scholar]
- Wu W. W.; Wang G.; Insel P. A.; Hsiao C.; Zou S.; Martin B.; Maudsley S.; Shen R. (2012) Discovery- and target-based protein quantification using iTRAQ and pulsed Q collision induced dissociation (PQD). J. Proteomics 75(8), 2480–2487. [DOI] [PMC free article] [PubMed] [Google Scholar]
- Zhang L.; Yun H.; Murray F.; Lu R.; Wang L.; Hook V.; Insel P. A. (2011) Cytotoxic T lymphocyte antigen-2α induces apoptosis of murine T-lymphoma cells and cardiac fibroblasts and is regulated by cAMP/PKA. Cell. Signalling 23(10), 1611–1616. [DOI] [PMC free article] [PubMed] [Google Scholar]
- Bansal A. D.; Hoffert J. D.; Pisitkun T.; Hwang S.; Chou C. L.; Boja E. S.; Wang G.; Knepper M. A. (2010) Phosphoproteomic profiling reveals vasopressin regulated phosphorylation sites in collecting duct. J. Am. Soc. Nephrol. 21, 303–315. [DOI] [PMC free article] [PubMed] [Google Scholar]
Associated Data
This section collects any data citations, data availability statements, or supplementary materials included in this article.