

FLAIR* is an MR imaging contrast technique that combines the advantages of cerebrospinal fluid–suppressed T2-weighted imaging and T2*-weighted imaging, yielding images that provide high contrast for white matter (WM) lesions and veins in the brain and that are well suited to routine imaging of WM diseases, such as multiple sclerosis, in a clinical setting.
Abstract
Purpose:
To evaluate a magnetic resonance (MR) imaging contrast technique, called FLAIR*, that combines the advantages of T2-weighted fluid-attenuated inversion recovery (FLAIR) contrast and T2*-weighted contrast on a single image for assessment of white matter (WM) diseases such as multiple sclerosis (MS).
Materials and Methods:
This prospective pilot study was HIPAA compliant and institutional review board approved. Ten patients with clinically definite MS (eight men, two women; mean age, 41 years) provided informed consent and underwent 3.0-T MR imaging. Images from a T2-weighted FLAIR sequence were combined with images from a T2*-weighted segmented echo-planar imaging sequence performed during contrast material injection, yielding high-isotropic-resolution (0.55 × 0.55 × 0.55 mm3) FLAIR* images. Qualitative assessment was performed for image quality, lesion conspicuity, and vein conspicuity. Contrast-to-noise ratio (CNR) was calculated to compare normal-appearing WM (NAWM) with cerebrospinal fluid, lesions, and veins. To evaluate the differences in CNR among imaging modalities, a bootstrap procedure clustered on subjects was used, together with paired t tests.
Results:
High-quality FLAIR* images of the brain were produced at 3.0 T, yielding conspicuous lesions and veins. Lesion-to-NAWM and NAWM-to-vein CNR values were significantly higher for FLAIR* images than for T2-weighted FLAIR images (P < .0001). Findings on FLAIR* images included intralesional veins for lesions located throughout the brain and a hypointense rim around some WM lesions.
Conclusion:
High-isotropic-resolution FLAIR* images obtained at 3.0 T yield high contrast for WM lesions and parenchymal veins, making it well suited to investigate the relationship between WM abnormalities and veins in a clinical setting.
© RSNA, 2012
Introduction
Among conventional magnetic resonance (MR) imaging techniques, T2-weighted fluid-attenuated inversion recovery (FLAIR) is considered one of the most useful contrast techniques for investigating white matter (WM) diseases such as multiple sclerosis (MS) (1). Because of its high sensitivity to WM abnormalities and its excellent suppression of cerebrospinal fluid signal, brain imaging with T2-weighted FLAIR is used routinely to diagnose disease and to evaluate changes in lesion load (2). However, T2-weighted FLAIR imaging cannot provide specific information about lesion pathology (3).
Magnetic susceptibility-weighted (so-called T2*-weighted) MR imaging has been shown to provide specific information about parenchymal veins (4,5), hemorrhage and calcification (6,7), tissue iron deposition (8), and iron-laden macrophages (9–11), especially at high field strength (7.0 T). However, in most of these previous studies, T2* imaging was performed by using a conventional T2*-weighted gradient-echo sequence, which requires long acquisition times to achieve whole-brain coverage. As a result, imaging in these prior studies was typically limited to the supratentorial region, neglecting the brainstem and cerebellum, both of which are often affected in MS.
Recently, an acquisition strategy different from the conventional gradient-echo sequence has been introduced, which allows for fast, high-isotropic-resolution susceptibility imaging of the whole brain (12). By using a T2*-weighted segmented echo-planar imaging (segEPI) sequence in healthy brains at 7.0 T, T2*-weighted images with high anatomic fidelity and a considerable gain in volume coverage relative to conventional T2*-weighted gradient-echo images were obtainable without a sacrifice of acquisition time. To translate this technique to the clinic, we recently implemented a T2*-weighted segEPI protocol at 3.0 T that allows the acquisition of high-isotropic-resolution T2*-weighted images by using standard 3.0-T MR equipment (13). However, unlike T2-weighted FLAIR images, the T2*-weighted images produced by this protocol lacked cerebrospinal fluid suppression and high contrast between lesions and normal-appearing WM (NAWM), both of which are extremely helpful for detection of MS lesions by clinicians.
Thus, the purpose of our study was to evaluate an MR imaging contrast technique, called FLAIR*, that combines the advantages of T2-weighted FLAIR contrast and T2*-weighted contrast on a single image for assessment of WM diseases such as MS.
Materials and Methods
Subjects
Ten patients (eight men, two women; mean age, 41 years; range, 26–52 years) with clinically definite MS in accordance with the 2010 revised McDonald criteria (14) were included in this prospective pilot study, which was performed from June to August 2011. Among the 10 patients, seven had relapsing-remitting MS, one had secondary-progressive MS, and two had primary-progressive MS. All patients gave written informed consent in accordance with the institutional review board. These patients were between 18 and 70 years old, not pregnant, and able to tolerate MR examinations. Exclusion criteria included metal implants (such as pacemakers, aneurysm clips, and metallic prostheses), a history of allergic reactions to gadolinium-based contrast agents, and impaired renal function. All patients underwent a 3.0-T MR imaging examination and a physical examination to rate disability by using the Expanded Disability Status Scale (EDSS) (15). The patients had a median EDSS score of 1.5 (range, 1.0–6.5) and a mean disease duration of 9.4 years (range, 0.4–21 years).
MR Imaging
MR imaging was performed by using a 3.0-T whole-body MR system (Achieva 3.0 T; Philips Healthcare, Best, the Netherlands) with a manufacturer-provided eight-channel head coil for reception and body coil for transmission. The MR imaging protocol was implemented by one author (P.S., with 5 years of experience in MR imaging) and included the following: T1-weighted magnetization-prepared rapid gradient echo (MP-RAGE), T2-weighted FLAIR, and T2*-weighted segEPI sequences. These three-dimensional sequences covered the entire brain and were performed in the sagittal plane. The main sequence parameters are available in Table 1.
Table 1.
Protocol for 3.0-T MR Imaging
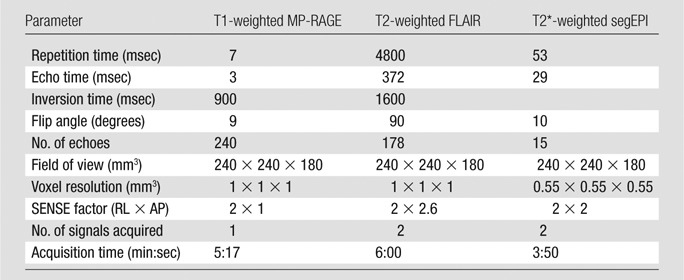
Note.—AP = anterior-posterior, RL = right-left, SENSE = sensitivity encoding for fast MR imaging.
During imaging, a single dose (0.1 mmol/kg) of gadopentetate dimeglumine (Magnevist; Bayer Healthcare, Leverkusen, Germany) was injected by using a power injector (Medrad, Warrendale, Pa) over a period of 60 seconds to assess for the presence of enhancing MS lesions. T1-weighted MP-RAGE imaging was performed before contrast agent injection, T2*-weighted segEPI during injection, and T2-weighted FLAIR imaging approximately 4 minutes after injection.
Image Postprocessing
Image postprocessing was performed by three authors (C.D.S., I.C.G., and P.S. with 2, 3, and 5 years of experience in image processing, respectively). The sagittal three-dimensional magnitude images were collected directly from the MR imager and then postprocessed by using an automated pipeline built in-house in MIPAV (Medical Image Processing, Analysis & Visualization, National Institutes of Health; mipav.cit.nih.gov) and JIST (Java Image Science Toolkit, Johns Hopkins University/Vanderbilt University; www.nitrc.org/projects/jist/) (16). All images were first reformatted to the axial orientation without interpolation. Both T2-weighted FLAIR and T1-weighted MP-RAGE images were bias-field corrected by using the N3 algorithm (17). T2*-weighted segEPI was used as the target for registering the T1-weighted MP-RAGE and T2-weighted FLAIR images, which involved interpolation to match the resolution and dimensions of T2*-weighted segEPI, so that all the images were available at the highest isotropic resolution possible. To correct for motion that might occur between the acquisitions, a rigid registration was performed by using six degrees of freedom, a normalized mutual information as the cost function, and windowed sinc interpolation. The final FLAIR* image was calculated as the product of the coregistered T2-weighted FLAIR and T2*-weighted segEPI images and, when saved in Digital Imaging and Communications in Medicine, or DICOM, format, could be visualized directly on a clinical image viewer and reformatted into any desired plane. Note that for clinical use, only three postprocessing steps were required to generate FLAIR* images: (a) co-registration between T2-weighted FLAIR and T2*-weighted segEPI images, (b) interpolation of the registered T2-weighted FLAIR image to match the high-spatial-resolution of the T2*-weighted segEPI image, and (c) multiplication of the coregistered interpolated T2-weighted FLAIR image by the T2*-weighted segEPI image. The N3 bias-field correction is optional and was applied here to use the automated segmentation (LesionTOADS; http://www.nitrc.org/projects/toads-cruise/) and dura-stripping algorithms required for our quantitative analysis, as introduced below.
Image Analysis
FLAIR, T2*-weighted segEPI, and FLAIR* images were analyzed both qualitatively and quantitatively. Qualitative image analysis was performed independently by two raters (M.I.G., with 7 years of experience in neurology, and D.S.R., with 10 years of experience in neuroradiology and neurology). T2-weighted FLAIR, T2*-weighted segEPI, and FLAIR* images for each patient were independently evaluated. Three qualitative evaluations were performed, as follows: image quality (defined as the overall visual quality of the image with regard to the level of noise, internal contrast, and artifacts), lesion conspicuity (defined as the ease of visibility of lesions), and parenchymal vein conspicuity (defined as the ease of visibility of veins). To evaluate these three criteria, the following ordinal grading system was used: score of 0, poor; 1, acceptable; 2, good; and 3, excellent.
Quantitative image analysis was performed by three authors (C.D.S., I.C.G., and P.S.) by using MIPAV and JIST. Whole-brain segmentation (skull stripping) was derived from the T1-weighted MP-RAGE images by using the SPECTRE (simple paradigm for extra-cerebral tissue removal) algorithm (18). The resulting brain mask was then applied to the T2-weighted FLAIR and T2*-weighted segEPI images. The skull-stripped T1-weighted MP-RAGE and T2-weighted FLAIR images were input into a first round of the LesionTOADS automated segmentation algorithm (19) to generate WM and gray matter segmentations that were used to refine the skull stripping by removing any remaining dura mater. The dura-stripped T1-weighted MP-RAGE and T2-weighted FLAIR images were then put through a second round of LesionTOADS to compute a final tissue classification including gray matter, NAWM, cerebrospinal fluid, and lesions. Finally, parenchymal veins visible on T2*-weighted segEPI images were segmented manually in NAWM regions and removed from NAWM and lesion masks. These masks were then used to calculate the mean signal intensity, SI, of NAWM, cerebrospinal fluid, lesions, and veins from a single section located in the middle of the brain. Finally, the contrast-to-noise ratio (CNR) was calculated for lesion-to-NAWM, NAWM-to–cerebrospinal fluid, and NAWM-to-vein by using the following equation: CNRa/b = (SIa −SIb)/(SIa+SIb), where a and b denote the tissues of interest.
Statistical Analysis
The interrater agreement for the qualitative grading was estimated by using a weighted κ test (κ < 0, poor agreement; 0 < κ < 0.2, slight agreement; 0.2 < κ < 0.4, fair agreement; 0.4 < κ < 0.6, moderate agreement; 0.6 < κ < 0.8, substantial agreement; and 0.8 < κ < 1, almost perfect agreement [20]). Because there was a substantial agreement between the grades given by the two raters (κ = 0.75), only the grades given by one rater (rater 1) were used to compare FLAIR* imaging against the two other image contrast techniques (FLAIR and T2*-weighted segEPI imaging) by using the Wilcoxon signed rank test. To evaluate the differences in CNRs between FLAIR* and the two other image contrast techniques, a bootstrap procedure (with replacement) clustered on the subjects was used to generate 1000 bootstrap samples of equal size (n = 10). For each bootstrap sample, mean CNRs for the different contrast sequences (T2-weighted FLAIR, T2*-weighted segEPI, and FLAIR*) were computed across the 10 selected subjects. A paired t test was then performed to evaluate the differences in mean CNRs between FLAIR* and the two other contrast techniques. To adjust for multiple comparisons, P < .01 was considered to indicate a statistically significant difference. All statistical analysis was performed by using MatLab (MathWorks, Natick, Mass) and R (R Foundation for Statistical Computing, Vienna, Austria) by three authors (D.S.R., I.C.G., and P.S.).
Results
Results of the qualitative evaluation for the different image contrast techniques are summarized in Table 2. Similar to FLAIR and T2*-weighted segEPI, FLAIR* received high grades for image quality from two independent raters. Regarding lesion conspicuity, FLAIR* images received high grades, superior to T2*-weighted segEPI images (P = .002) but equivalent to FLAIR images (P = .5). For vein conspicuity, FLAIR* images also received high grades, superior to FLAIR images (P = .002) but equivalent to T2*-weighted segEPI images (P = .031).
Table 2.
Image Grading and CNRs for Each Contrast Technique
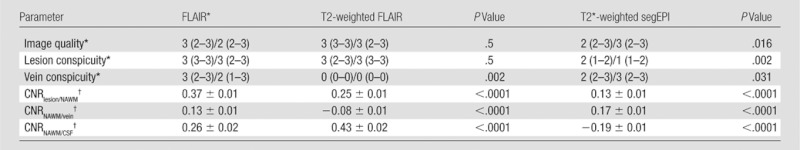
Note.—P values are for comparisons against FLAIR*. CSF = cerebrospinal fluid.
Grading data are listed for both raters as rater 1/rater 2, and correspond to the median (with range in parentheses) across the patients (n = 10).
CNR data are mean ± standard deviation computed across the 1000 bootstrap samples of size n = 10.
Quantitative evaluation of the different image contrast techniques is summarized in Table 2. Lesion-to-NAWM CNR for FLAIR* imaging was significantly higher than for both T2-weighted FLAIR imaging (P < .0001) and T2*-weighted segEPI (P < .0001), supporting qualitative results on lesion conspicuity. NAWM-to-vein CNR for FLAIR* images was significantly higher than for T2-weighted FLAIR images (P < .0001), again supporting qualitative results on vein conspicuity. Finally, NAWM-to–cerebrospinal fluid CNR for FLAIR* imaging was significantly higher than for T2*-weighted segEPI (P < .0001) but lower than for T2-weighted FLAIR imaging (P < .0001), indicating that cerebrospinal fluid suppression was not as efficient for FLAIR* as it was for T2-weighted FLAIR imaging.
To illustrate these qualitative and quantitative features, FLAIR*, FLAIR, and T2*-weighted segEPI images are provided in Figure 1. Although initially acquired in the sagittal plane, multiplanar reformations were created in axial and coronal planes, which allow clinicians to view lesions relative to their central veins in any desired plane (Fig 2). As illustrated in Figure 2, FLAIR* images also covered the whole brain including cerebrum, brainstem, and cerebellum. This additional feature enabled FLAIR* images to depict venocentric lesions in the pons and cerebellum areas in several patients (Fig 3).
Figure 1:

A, Axial FLAIR* image (0.55 × 0.55 × 0.55 mm3 resolution), B, axial T2-weighted FLAIR image (1 × 1 × 1 mm3 resolution; repetition time, 4800 msec; echo time, 372 msec; inversion time, 1600 msec), and, C, axial T2*-weighted segEPI image (0.55 × 0.55 × 0.55 mm3 resolution; repetition time, 53 msec; echo time, 29 msec) in a 43-year-old man with relapsing-remitting MS (EDSS = 1.0, disease duration = 12 years).
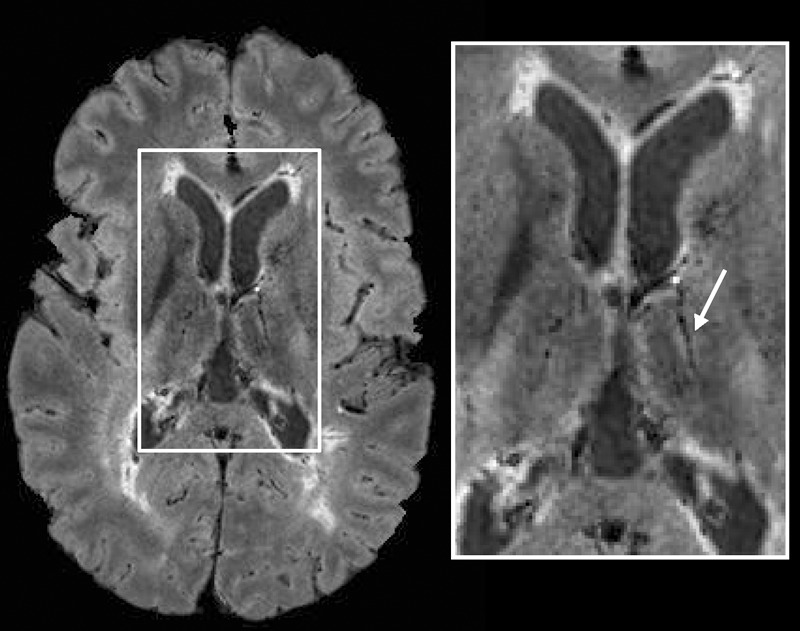
Figure 2:

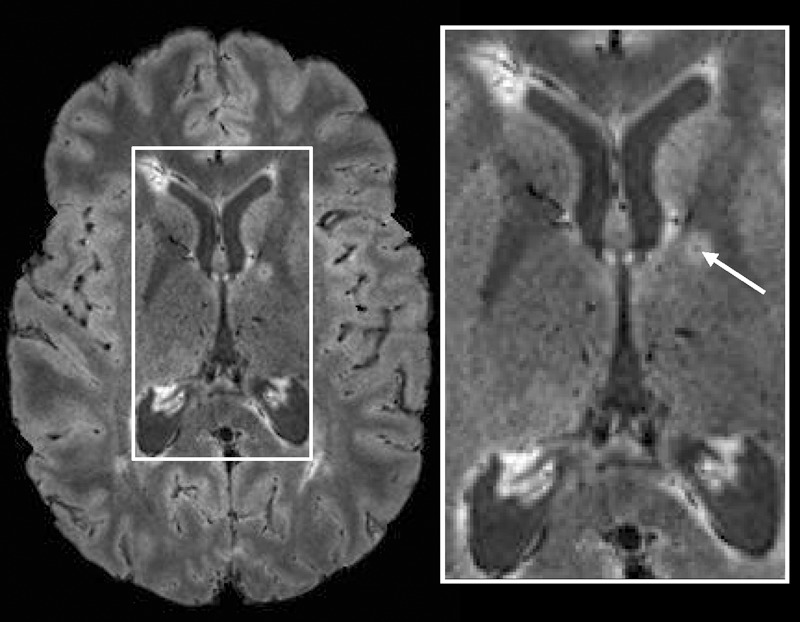
A, Axial, B, coronal, and, C, sagittal views of FLAIR* images (0.55 × 0.55 × 0.55 mm3 resolution) in a 41-year-old woman with relapsing-remitting MS (EDSS = 1.0, disease duration = 8 years). A lesion with its central vein (arrow) is visible in the three different planes.
Figure 3:
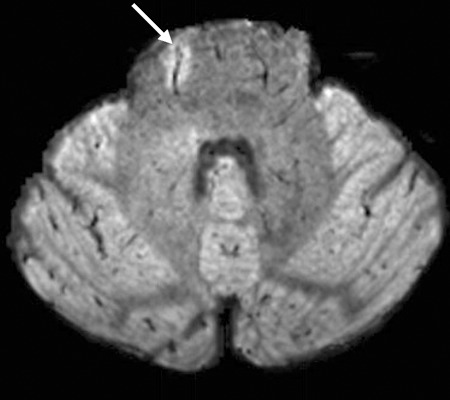
Axial FLAIR* image (0.55 × 0.55 × 0.55 mm3 resolution) from the infratentorial region in a 43-year-old man with relapsing-remitting MS (EDSS = 1.0, disease duration = 12 years). A vein running through a lesion (arrow) is clearly depicted in the pons.
In addition to the periventricular and deep WM lesions shown in Figures 1 and 2, lesions in the thalamus (Fig 4) and internal capsule (Fig 5), as well as juxtacortical lesions (Fig 6), were also detected together with their central hypointense veins on FLAIR* images. Finally, some WM lesions surrounded by a hypointense rim were also visible on FLAIR* images (Fig 6).
Figure 4:
Axial FLAIR* image (0.55 × 0.55 × 0.55 mm3 resolution) in a 26-year-old man with relapsing-remitting MS (EDSS = 1.5, disease duration = 11 years). A lesion and its central vein (arrow) are visible in the thalamus.
Figure 5:
Axial FLAIR* image (0.55 × 0.55 × 0.55 mm3 resolution) in a 26-year-old woman with relapsing-remitting MS (EDSS = 1.5, disease duration = 9 years). A lesion and its central vein (arrow) are visible in the internal capsule.
Figure 6:

Axial FLAIR* images (0.55 × 0.55 × 0.55 mm3 resolution) in a 42-year-old man with relapsing-remitting MS (EDSS = 2.5, disease duration = 3 years). A juxtacortical lesion with its central vein (arrow, A) and two lesions with hypointense rims (arrows, B) are clearly depicted. Note that these “rim” lesions also have central veins.
Discussion
The most important finding in this pilot study was that FLAIR* imaging at 3.0 T provided high-quality cerebrospinal fluid–suppressed brain images demonstrating conspicuous lesions and veins. Lesion-to-NAWM and NAWM-to-vein CNRs of FLAIR* imaging were both significantly higher than those of T2-weighted FLAIR imaging. Findings on FLAIR* images also included intralesional veins for lesions located throughout the WM, as well as a hypointense rim around some WM lesions.
Recently, Grabner and colleagues (21) introduced a method that combines FLAIR images with T2*-weighted images enhanced by susceptibility-weighted imaging, SWI, postprocessing (5) to create a FLAIR-SWI contrast technique. However, this method requires images acquired with both 3.0-T and 7.0-T MR platforms, whereas FLAIR* uses only 3.0-T images and is therefore more compatible with a clinical setting.
The MR imaging finding of central veins inside MS lesions was first reported in vivo by using T2*-based imaging at 1.5 T (22), and has recently been reinvestigated at 7.0 T (23) due to the higher signal-to-noise ratio and spatial resolution offered by higher-field-strength magnets. In our study, because FLAIR* covered the entire brain, the presence of veins was also detected in lesions located in the pons and cerebellum. Concerning the hypointense rim, the results of recent pathology and high-field-strength MR imaging studies suggest that it is due to iron-laden macrophages (9). However, this interpretation still needs to be confirmed, and the diagnostic and prognostic relevance of these findings awaits further investigation.
Our method had some limitations. First, we had no reference standard for either vein or lesion conspicuity, making it possible to overcall our qualitative findings. Second, T2* imaging at 3.0 T is less sensitive to susceptibility effects than at 7.0 T, rendering vessels in some small lesions difficult to detect (24). To compensate, we combined the T2*-weighted segEPI acquisition with an injection of gadolinium-based contrast agent. The paramagnetic nature of this agent increases contrast between the vein and its surrounding tissue on T2*-weighted images, due to the “blooming” effect, and limits the absence of a visible central vein to only a few small lesions. However, gadolinium is not strictly required to generate FLAIR* images. FLAIR* images were also affected by minor signal intensity losses in the inferior frontal and anterior temporal lobes, which could hide pathologic findings in these areas. Although not tested here, several postprocessing methods have been recently proposed to remove these artifacts (25). Finally, by requiring two separate acquisitions, FLAIR* imaging is vulnerable to motion that can occur between acquisitions. To produce FLAIR* images from a single acquisition, a modified version of the segEPI sequence with an inversion pulse tuned to generate T2*-weighted contrast with cerebrospinal fluid suppression is under investigation.
In summary, FLAIR* is an MR imaging contrast technique that combines the advantages of cerebrospinal fluid–suppressed T2-weighted and T2*-weighted contrast to yield images that provide high contrast for WM lesions and veins in the brain and that are well suited to routine imaging of WM diseases, such as MS, in a clinical setting.
Advances in Knowledge.
• High-isotropic-resolution whole-brain FLAIR* images can be obtained with a 3.0-T clinical MR imager, with or without use of contrast agents, in less than 10 minutes.
• FLAIR* imaging combines T2-weighted fluid-attenuated inversion recovery (FLAIR) contrast with T2*-weighted contrast on a single image.
• FLAIR* imaging can provide high-quality cerebrospinal fluid–suppressed images that highlight white matter lesions and veins.
Implication for Patient Care.
• The FLAIR* contrast technique may be a useful clinical tool for the study of the relationship between parenchymal veins and multiple sclerosis lesions.
Disclosures of Conflicts of Interest: P.S. No relevant conflicts of interest to disclose. I.C.G. No relevant conflicts of interest to disclose. C.D.S. No relevant conflicts of interest to disclose. M.I.G. No relevant conflicts of interest to disclose. D.S.R. No relevant conflicts of interest to disclose.
Acknowledgments
The authors acknowledge the Intramural Research Program of the National Institute of Neurological Disorders and Stroke and the NIH Clinical Center for support. The authors thank Dr John Butman and Dr David Thomasson for insightful discussions, Roger Stone and the NIH Clinical Center Radiology technologists for their work in acquiring the data, the Neuroimmunology Branch clinical group for coordinating recruitment and evaluation of patients, Dr John Ostuni from the NINDS image processing facility, and Dr Joseph Frank for access to a research imager for initial development of the technique. Finally, the authors thank Dr Tianxia Wu and Elizabeth Sweeney for their help and advice with the statistical methods.
Received January 25, 2012; revision requested March 1; revision received April 5; accepted May 11; final version accepted May 22.
Funding: The authors are employees of the National Institutes of Health.
Abbreviations:
- CNR
- contrast-to-noise ratio
- EDSS
- Expanded Disability Status Scale
- FLAIR
- fluid-attenuated inversion recovery
- MP-RAGE
- magnetization-prepared rapid gradient echo
- MS
- multiple sclerosis
- NAWM
- normal-appearing WM
- segEPI
- segmented echo-planar imaging
- WM
- white matter
References
- 1.Barkhof F, Scheltens P. Imaging of white matter lesions. Cerebrovasc Dis 2002;13(Suppl 2):21–30 [DOI] [PubMed] [Google Scholar]
- 2.Simon JH, Li D, Traboulsee A, et al. Standardized MR imaging protocol for multiple sclerosis: Consortium of MS Centers consensus guidelines. AJNR Am J Neuroradiol 2006;27(2):455–461 [PMC free article] [PubMed] [Google Scholar]
- 3.Filippi M, Rocca MA, De Stefano N, et al. Magnetic resonance techniques in multiple sclerosis: the present and the future. Arch Neurol 2011;68(12):1514–1520 [DOI] [PubMed] [Google Scholar]
- 4.Reichenbach JR, Venkatesan R, Schillinger DJ, Kido DK, Haacke EM. Small vessels in the human brain: MR venography with deoxyhemoglobin as an intrinsic contrast agent. Radiology 1997;204(1):272–277 [DOI] [PubMed] [Google Scholar]
- 5.Haacke EM, Mittal S, Wu Z, Neelavalli J, Cheng YC. Susceptibility-weighted imaging: technical aspects and clinical applications, part 1. AJNR Am J Neuroradiol 2009;30(1):19–30 [DOI] [PMC free article] [PubMed] [Google Scholar]
- 6.Scharf J, Bräuherr E, Forsting M, Sartor K. Significance of haemorrhagic lacunes on MRI in patients with hypertensive cerebrovascular disease and intracerebral haemorrhage. Neuroradiology 1994;36(7):504–508 [DOI] [PubMed] [Google Scholar]
- 7.Wu Z, Mittal S, Kish K, Yu Y, Hu J, Haacke EM. Identification of calcification with MRI using susceptibility-weighted imaging: a case study. J Magn Reson Imaging 2009;29(1):177–182 [DOI] [PMC free article] [PubMed] [Google Scholar]
- 8.Haacke EM, Cheng NY, House MJ, et al. Imaging iron stores in the brain using magnetic resonance imaging. Magn Reson Imaging 2005;23(1):1–25 [DOI] [PubMed] [Google Scholar]
- 9.Pitt D, Boster A, Pei W, et al. Imaging cortical lesions in multiple sclerosis with ultra-high-field magnetic resonance imaging. Arch Neurol 2010;67(7):812–818 [DOI] [PubMed] [Google Scholar]
- 10.Hammond KE, Metcalf M, Carvajal L, et al. Quantitative in vivo magnetic resonance imaging of multiple sclerosis at 7 Tesla with sensitivity to iron. Ann Neurol 2008;64(6):707–713 [DOI] [PubMed] [Google Scholar]
- 11.Yao B, Bagnato F, Matsuura E, et al. Chronic multiple sclerosis lesions: characterization with high-field-strength MR imaging. Radiology 2012;262(1):206–215 [DOI] [PMC free article] [PubMed] [Google Scholar]
- 12.Zwanenburg JJ, Versluis MJ, Luijten PR, Petridou N. Fast high resolution whole brain T2* weighted imaging using echo planar imaging at 7T. Neuroimage 2011;56(4):1902–1907 [DOI] [PubMed] [Google Scholar]
- 13.Sati P, Thomasson D, Biassou N, Reich DS, Butman JA. Ultra-fast acquisition of high-resolution susceptibility-weighted-imaging at 3T [abstr]. In: Proceedings of the Nineteenth Meeting of the International Society for Magnetic Resonance in Medicine. Berkeley, Calif: International Society for Magnetic Resonance in Medicine, 2011 [Google Scholar]
- 14.Polman CH, Reingold SC, Banwell B, et al. Diagnostic criteria for multiple sclerosis: 2010 revisions to the McDonald criteria. Ann Neurol 2011;69(2):292–302 [DOI] [PMC free article] [PubMed] [Google Scholar]
- 15.Kurtzke JF. A new scale for evaluating disability in multiple sclerosis. Neurology 1955;5(8):580–583 [DOI] [PubMed] [Google Scholar]
- 16.Lucas BC, Bogovic JA, Carass A, et al. The Java Image Science Toolkit (JIST) for rapid prototyping and publishing of neuroimaging software. Neuroinformatics 2010;8(1):5–17 [DOI] [PMC free article] [PubMed] [Google Scholar]
- 17.Sled JG, Zijdenbos AP, Evans AC. A nonparametric method for automatic correction of intensity nonuniformity in MRI data. IEEE Trans Med Imaging 1998;17(1):87–97 [DOI] [PubMed] [Google Scholar]
- 18.Carass A, Cuzzocreo J, Wheeler MB, Bazin PL, Resnick SM, Prince JL. Simple paradigm for extra-cerebral tissue removal: algorithm and analysis. Neuroimage 2011;56(4):1982–1992 [DOI] [PMC free article] [PubMed] [Google Scholar]
- 19.Shiee N, Bazin PL, Ozturk A, Reich DS, Calabresi PA, Pham DL. A topology-preserving approach to the segmentation of brain images with multiple sclerosis lesions. Neuroimage 2010;49(2):1524–1535 [DOI] [PMC free article] [PubMed] [Google Scholar]
- 20.Landis JR, Koch GG. The measurement of observer agreement for categorical data. Biometrics 1977;33(1):159–174 [PubMed] [Google Scholar]
- 21.Grabner G, Dal-Bianco A, Schernthaner M, Vass K, Lassmann H, Trattnig S. Analysis of multiple sclerosis lesions using a fusion of 3.0 T FLAIR and 7.0 T SWI phase: FLAIR SWI. J Magn Reson Imaging 2011;33(3):543–549 [DOI] [PubMed] [Google Scholar]
- 22.Tan IL, van Schijndel RA, Pouwels PJ, et al. MR venography of multiple sclerosis. AJNR Am J Neuroradiol 2000;21(6):1039–1042 [PMC free article] [PubMed] [Google Scholar]
- 23.Tallantyre EC, Brookes MJ, Dixon JE, Morgan PS, Evangelou N, Morris PG. Demonstrating the perivascular distribution of MS lesions in vivo with 7-Tesla MRI. Neurology 2008;70(22):2076–2078 [DOI] [PubMed] [Google Scholar]
- 24.Tallantyre EC, Morgan PS, Dixon JE, et al. A comparison of 3T and 7T in the detection of small parenchymal veins within MS lesions. Invest Radiol 2009;44(9):491–494 [DOI] [PubMed] [Google Scholar]
- 25.Volz S, Hattingen E, Preibisch C, Gasser T, Deichmann R. Reduction of susceptibility-induced signal losses in multi-gradient-echo images: application to improved visualization of the subthalamic nucleus. Neuroimage 2009;45(4):1135–1143 [DOI] [PubMed] [Google Scholar]