

Our results provide histologic validation for the use of postcontrast T1 mapping to noninvasively assess interstitial myocardial fibrosis in patients with clinically evident cardiomyopathy.
Abstract
Purpose:
To determine the utility of cardiac magnetic resonance (MR) T1 mapping for quantification of diffuse myocardial fibrosis compared with the standard of endomyocardial biopsy.
Materials and Methods:
This HIPAA-compliant study was approved by the institutional review board. Cardiomyopathy patients were retrospectively identified who had undergone endomyocardial biopsy and cardiac MR at one institution during a 5-year period. Forty-seven patients (53% male; mean age, 46.8 years) had undergone diagnostic cardiac MR and endomyocardial biopsy. Thirteen healthy volunteers (54% male; mean age, 38.1 years) underwent cardiac MR as a reference. Myocardial T1 mapping was performed 10.7 minutes ± 2.7 (standard deviation) after bolus injection of 0.2 mmol/kg gadolinium chelate by using an inversion-recovery Look-Locker sequence on a 1.5-T MR imager. Late gadolinium enhancement was assessed by using gradient-echo inversion-recovery sequences. Cardiac MR results were the consensus of two radiologists who were blinded to histopathologic findings. Endomyocardial biopsy fibrosis was quantitatively measured by using automated image analysis software with digital images of specimens stained with Masson trichrome. Histopathologic findings were reported by two pathologists blinded to cardiac MR findings. Statistical analyses included Mann-Whitney U test, analysis of variance, and linear regression.
Results:
Median myocardial fibrosis was 8.5% (interquartile range, 5.7–14.4). T1 times were greater in control subjects than in patients without and in patients with evident late gadolinium enhancement (466 msec ± 14, 406 msec ± 59, and 303 msec ± 53, respectively; P < .001). T1 time and histologic fibrosis were inversely correlated (r = −0.57; 95% confidence interval: −0.74, −0.34; P < .0001). The area under the curve for myocardial T1 time to detect fibrosis of greater than 5% was 0.84 at a cutoff of 383 msec.
Conclusion:
Cardiac MR with T1 mapping can provide noninvasive evidence of diffuse myocardial fibrosis in patients referred for evaluation of cardiomyopathy.
© RSNA, 2012
Introduction
The presence of myocardial fibrosis in the failing heart is associated with a wide range of adverse outcomes including ventricular arrhythmia, decompensated heart failure, and death (1–3). Its presence portends an adverse prognosis and may provide important therapeutic guidance with regard to revascularization (4), device implantation (5), and medical therapy.
Cardiac magnetic resonance (MR) with delayed imaging after administration of a gadolinium-based contrast agent (late gadolinium enhancement [LGE]) has become a reference standard for visualization of focal myocardial scar/fibrosis (6,7). In the setting of chronic myocardial infarction, a proposed mechanism for LGE cardiac MR hypothesizes increased distribution of gadolinium chelate in an expanded extracellular space associated with scar tissue (8,9). Increased gadolinium concentration causes T1 shortening and high signal intensity on T1-weighted images relative to areas of normal myocardium. Because of the relatively low resolution of MR imaging (voxel sizes for LGE are on the order of 1.5 × 1.5 × 6–8 mm), relatively dense myocardial scar is thought to be necessary for visual identification of myocardial scar with gadolinium-enhanced cardiac MR.
The inversion-recovery technique used for visualization of LGE cardiac MR relies on nulling signal from normal myocardium to greatly increase the contrast-to-noise ratio of the region of myocardial scar (10). In the setting of myocardial scar due to infarction, the inversion-recovery cardiac MR technique allows visual identification of the extent of myocardial scar compared with normal myocardium. In the setting of less severe or more diffuse fibrosis, the inversion-recovery cardiac MR technique is unlikely to reveal the presence of diffusely abnormal tissue given the lack of normal myocardium as a reference.
Direct measurement of myocardial T1 time (“T1 mapping”) may improve on these methodologic problems of LGE cardiac MR in the setting of diffuse retention of gadolinium-based contrast material. To date, to our knowledge, T1 mapping for diffuse fibrosis quantification has been validated relative to histologic findings only in small numbers of patients with hypertrophic cardiomyopathy, aortic valve disease (11,12), and in the postoperative cardiac transplantation setting (13).
The purpose of our study was therefore to determine the utility of cardiac MR T1 mapping for quantification of diffuse myocardial fibrosis compared with the reference standard of endomyocardial biopsy in patients referred for evaluation of cardiomyopathy.
Materials and Methods
Patient Selection
Our Health Insurance Portability and Accountability Act (HIPAA)-compliant study was approved by our institutional review boards. Retrospective data analysis was performed with a waiver of HIPAA authorization by using deidentified data sets. Healthy volunteers provided written informed consent. One author (R.J.v.d.G.) is a consultant for Medis Medical Imaging Systems (Leiden, the Netherlands). All other authors had no potential conflict of interest and retained full control of inclusion, data, and analysis. The study was wholly funded by the intramural research program of the National Institutes of Health. We retrospectively identified patients who had undergone both cardiac MR and endomyocardial biopsy as part of evaluation for cardiomyopathy at a single center between 2005 and 2010. Inclusion criteria were a cardiac MR examination that included inversion-recovery images obtained after contrast material administration (hereafter, “postcontrast”) permitting T1 mapping and a clinically indicated endomyocardial biopsy adequate for quantitative analysis of collagen as described below. Patients who underwent MR imaging and endomyocardial biopsy more than 120 days apart were excluded, as were patients undergoing biopsy for routine postoperative cardiac transplant surveillance.
Eighty-five patients met the study inclusion criteria of concurrent cardiac MR examination and endomyocardial biopsy. For 47 of these patients, both diagnostic biopsy specimens and postcontrast cardiac MR images were available. Twenty-two patients had no visual evidence of LGE and 25 had visually evident LGE. The median time between cardiac MR and endomyocardial biopsy was 5 days (interquartile range: 2–14 days).
The 47 heart failure patients (25 men [53%]) ranged in age from 14 to 83 years (mean age, 46.8 years) and were predominantly Caucasian. Thirteen healthy volunteers (seven men [54%]; mean age, 38.1 years) free of cardiovascular disease who had undergone cardiac MR but not biopsy were used as a reference population.
Endomyocardial Biopsy
Transvenous endomyocardial biopsy specimens were obtained by cardiologists subspecializing in heart failure and transplantation by using a disposable bioptome by means of fluoroscopic or echocardiographic guidance targeting the right ventricular septum. Specimens were fixed in 10% formalin, embedded in paraffin, and stained with Masson trichrome. Two to seven samples were analyzed for each individual. These samples were digitized by using a commercial high-resolution scanner (ScanScope; Aperio, Vista, Calif). The tissue images were analyzed (C.T.S., M.K.H.) by using automated open-source image analysis software (FrIDA; Johns Hopkins Medical Institutions, Baltimore, Md) (14) to measure the total area of fibrotic tissue and myocardium in each sample. Endocardial and perivascular regions were excluded from analysis as nonrepresentative to maintain consistency with prior reports (13). Fibrosis is reported as a percent of the total tissue sampled, averaged among all specimens from an individual. An initial clinical indication for biopsy was established by a cardiologist (C.T.S.). Final histologic diagnoses were reported by two specialists in cardiovascular pathology with 7 (M.K.H.) and 20 years of experience who were blinded to cardiac MR results.
Cardiac MR Imaging Protocol
Cardiac MR studies were performed with a 1.5-T MR imager (Avanto; Siemens, Erlangen Germany). Left ventricular (LV) structure and function were assessed by using a steady-state free-procession sequence (temporal resolution, ≤50 msec; section thickness, 8 mm; in-plane resolution, ≤1.5 × 2 mm). LGE was assessed by using gradient-echo inversion-recovery techniques. All patients received a total dose of 0.2 mmol/kg gadolinium chelate. Twenty-one patients received gadodiamide (GE Healthcare, Princeton, NJ) while 26 patients and all healthy volunteers received gadopentetate dimeglumine (Bayer Healthcare, Wayne, NJ). T1 measurements were obtained from a steady-state free procession Look-Locker inversion-recovery sequence in the four-chamber view obtained 10.7 min ± 2.7 (standard deviation) after contrast agent injection. Imaging parameters were as follows: repetition time msec/echo time msec, 2.5/1.2; flip angle, 50°; matrix size = 192 × 72; field of view, 306 × 290 mm; section thickness, 8 mm; and 30–45 phases with temporal resolution ≤ 30 msec. This sequence has been previously described in detail (15,16). All imaging was performed during suspended respiration. MR results derived from semiautomated analyses (mass, volume, and ventricular function) or qualitative analysis (presence of LGE) were reported as a single consensus reading of two radiologists blinded to histology with 5 (E.B.T.) and 3 (R.A.N.) years of experience in cardiac MR.
Evaluation of LV Structure and Function
Images were processed by using MASS research software (MASS V2010-EXP; Leiden University Medical Center, Leiden, the Netherlands). LV end-systolic and end-diastolic volumes were calculated based on the summation of disks method, with subsequent derivation of stroke volume and global ejection fraction. Ventricular mass was calculated by multiplying the myocardial volume at end-diastole by the specific gravity of myocardium (1.05 g/mL). These parameters were indexed to adjust for patient size by dividing by body surface area.
T1 Measurement
T1 values were derived from postcontrast Look-Locker inversion-recovery sequences by using a balanced steady-state free-precession sequence over two R-R intervals with 30–45 phases acquired. Endo- and epicardial borders of the LV excluding the papillary muscles were traced semiautomatically in four-chamber views in all phases of the Look-Locker sequence. T1 values for individual pixels within the myocardium were determined (E.B.T., R.A.N.) by means of an iterative curve fitting technique and corrected for contrast agent dose, contrast agent relaxivity, postcontrast delay time, heart rate, and renal function by using a previously described method (17,18). Unadjusted T1 time was normalized to a dose of 0.2 mmol/kg gadopentetate dimeglumine; postcontrast delay time was 15 minutes, heart rate was 60 beats per minute, and glomerular filtration rate was 90 mL/min/1.73 m2 based on semiempirical models by using a custom Matlab algorithm. The T1 values of pixels with χ2 goodness-of-fit with level of significance α ≤ 0.05 were averaged for a final mean postcontrast T1 value to reduce noise and to reduce partial volume effects at myocardial borders.
Use of this Look-Locker sequence and T1 measurement method in a four-chamber view has previously been demonstrated to have excellent intrasequence agreement with short-axis views and other cardiac MR T1 mapping sequences (18).
Statistical Analysis
Data are presented as mean ± standard deviation or median with interquartile range, as appropriate. Histologic fibrosis was not normally distributed and was log-transformed for all analyses. Log-transformed fibrosis values were normally distributed (P = .89, D’Agostino-Pearson). Paired comparisons were performed by using Student t test or the Mann-Whitney U test for nonnormally distributed data. All P values are two sided. Comparisons between multiple groups were performed by means of analysis of variance. Linear regression analysis was performed by using the Pearson correlation coefficient. Statistical significance was defined at P ≤ .05. Analysis was performed by using MedCalc v 12.1.1 (MedCalc Software, Mariakerke, Belgium).
Results
A description of the study population is provided in Table 1. Patients had normal renal function (mean estimated glomerular filtration rate, 92 mL/min/1.73 m2 ± 34). The clinical indications for biopsy and cardiac MR included 22 patients with suspected infiltrative disease or restrictive physiology, 13 with dilated cardiomyopathy, 11 with suspected myocarditis, and one with suspected arrhythmogenic right ventricular dysplasia.
Table 1.
Patient Demographics
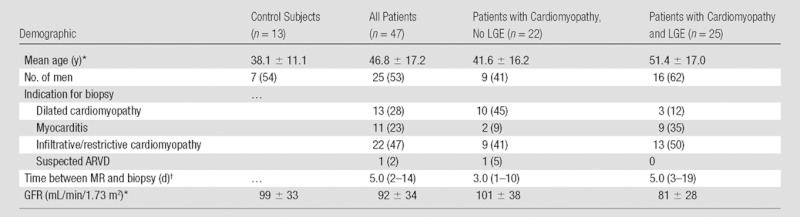
Note.—Except where indicated, data are numbers of patients and data in parentheses are percentages. ARVD = arrhythmogenic right ventricular dysplasia, GFR = glomerular filtration rate.
Data are mean ± standard deviation.
Data are the median, with interquartile range in parentheses.
Histologic Evaluation
The majority of patients (n = 34) demonstrated mild to moderate degrees of interstitial fibrosis and/or myocyte hypertrophy without specific histologic diagnosis. In the remaining patients, endomyocardial biopsy demonstrated findings consistent with chronic, borderline, or resolving myocarditis (six patients). Three patients with visually evident LGE had amyloidosis. One LGE patient had replacement fibrosis consistent with ischemic injury and one had small vessel disease consistent with diabetic vasculopathy. One patient had findings consistent with hypertrophic cardiomyopathy. One patient had normal myocardium. The median percent histologic fibrosis in all patients was 8.5% (interquartile range: 5.7–14.4). In patients without LGE, fibrosis ranged from 1.5% of myocardial volume to a maximum of 19.1% (median, 6.5%; interquartile range: 3.0–9.0) at endomyocardial biopsy. Patients with LGE had a range of 4.5%–55% fibrosis (median, 11.2%; interquartile range: 7.1–20.0) at endomyocardial biopsy.
T1 Time and Myocardial Fibrosis
Examples of paired T1 maps and biopsy results for two patients are provided in Figure 1. Postcontrast myocardial T1 time in heart failure patients ranged from 220 to 560 msec (mean, 351 msec ± 76). Biopsy specimens from patients with shorter myocardial postcontrast T1 times contained significantly greater amounts of histologic fibrosis (r = −0.57; 95% confidence interval [CI]: −0.74, −0.34; P < .0001) (Fig 2). There was no difference in the strength of this correlation between the subgroup imaged by using gadodiamide (n = 26; r = −0.54; P = .01) and the group imaged with gadopentetate dimeglumine (n = 21; r = −0.54; P < .01). We observed a significant and progressive shortening in T1 times from healthy control subjects to heart failure patients without LGE to patients with visible LGE (P < .001 for trend) (Fig 3).
Figure 1:

Representative paired T1 maps and endomyocardial biopsy samples demonstrate a heart with normal myocardium (top row) and one with significant fibrosis (bottom row). The patient with histologically normal myocardium had, A, a mean T1 time of 416 msec and, B, 1.5% fibrosis at biopsy. The second had, C, short T1 time (296 msec) and, D, 19.1% fibrosis at biopsy. Images in both patients were without LGE. T1 maps were derived from a postcontrast steady-state free procession Look-Locker inversion-recovery sequence in the four-chamber view. Pixels in color were included in the mean myocardial T1 time reported. Blue end of the color scale = shortest T1 time. Tissue is stained with Masson trichrome, rendering myocardium red and fibrotic tissue blue. Photomicrographs are ×4 magnification. Scale bar = 500 µm.
Figure 2:

Univariate correlation between mean myocardial T1 time and myocardial fibrosis (log transformed). Myocardial fibrosis was calculated as a percentage of total tissue in endomyocardial biopsy samples.
Figure 3:

Myocardial T1 time according to disease category. Boxes = interquartile range (25th–75th percentile), whiskers = maximum and minimum for each group. CM, no LGE = cardiomyopathy without visually evident LGE, CM, +LGE = cardiomyopathy with visually evident LGE.
The diagnostic performance of myocardial T1 time to detect mild (>5%) degrees of histologic fibrosis, expressed as an area under the curve (AUC), was 0.84 (95% CI: 0.70, 0.93; P < .0001) with a cutoff T1 time of 383 msec (Fig 4). The AUCs for increasing degrees of percent fibrosis were similar: 0.75 for greater than 10% fibrosis (95% CI: 0.60, 0.86; P < .01) with a cutoff time of 352 msec; 0.77 for greater than 15% fibrosis (95% CI: 0.63, 0.88; P = .0001) with a cutoff time of 312 msec; and 0.81 to detect greater than 20% fibrosis (95% CI: 0.67, 0.91; P < .001) with a cutoff time of 297 msec.
Figure 4:

Diagnostic performance of myocardial T1 time to detect fibrosis. Receiver operating characteristic curve demonstrates the diagnostic performance of postcontrast myocardial T1 time to identify histologic fibrosis greater than 5% of myocardial volume. The AUC is 0.84 (95% CI: 0.70, 0.93; P < .0001).
Exclusion of three patients with cardiac amyloidosis at biopsy did not meaningfully alter the overall correlation between percent fibrosis and T1 (r = −0.52; P < .01) or AUC (5% fibrosis, 0.83; 95% CI: 0.68, 0.92; P < .0001).
Cardiac Structure and Function
The results of quantitative LV structure and function analysis are summarized in Table 2. LV ejection fraction ranged from 11% to 78% (mean, 47.1% ± 15.4), consistent with a combination of myocarditis, dilated cardiomyopathy, and restrictive heart disease present in this population. LV mass index varied significantly between controls (57.0 gm/m2 ± 6.1) and patients with LGE (93.8 gm/m2 ± 55.8) and patients without LGE (67 0.2 gm/m2 ± 24.2; P < .001). The stroke volume index of patients was significantly lower (43.2 mL/m2 ± 5.2 for controls, 29.0 mL/m2 ± 12.1 for patients with LGE present, 37.8 mL/m2 ± 11.7 for patients without LGE; P = .001).
Table 2.
Cardiac MR and Endomyocardial Biopsy Results
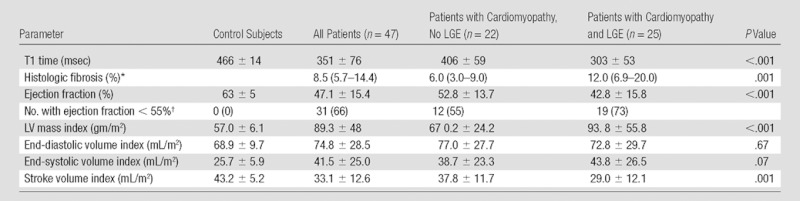
Note.—Except where indicated, data are mean ± standard deviation. Where specified, results are indexed to body surface area (square meters). P values are across the categories of control subjects, patients with cardiomyopathy but no LGE, and patients with cardiomyopathy and LGE present. Myocardial fibrosis was calculated as a percentage of total tissue in endomyocardial biopsy samples. Results for histologic fibrosis were analyzed as log-transformed values. Raw values have been reported here for ease of interpretability.
Data are the median, with interquartile range in parentheses.
Data are numbers of patients, with percentages in parentheses.
Relationship of Myocardial Fibrosis with Cardiac Structure and Function
There were significant correlations between percentage fibrosis and LV mass (r = 0.47; P = .001), stroke volume index (r = 0.36; P = .01), and ejection fraction (r = 0.40; P < .01). T1 time correlated inversely with LV mass (r = −0.29; P = .05), end-systolic volume (r = −0.31; P = .04), stroke volume (r = −0.44; P < .01), and ejection fraction (r = −0.52; P < .001) (Table 3). The inverse correlation between T1 time and fibrosis remained significant after adjusting for LV mass, stroke volume, and ejection fraction.
Table 3.
Correlation between Myocardial Fibrosis, T1 Time, and Cardiac Structure and Function

Note.—Values for fibrosis are log transformed.
Discussion
Our results provide histologic validation for the use of postcontrast T1 mapping to noninvasively assess interstitial myocardial fibrosis in patients with clinically evident cardiomyopathy. Our report is the first to our knowledge to confirm the association between short T1 time and increased fibrosis in a population with a broad range of cardiomyopathies, reflective of the spectrum of disease seen in patients referred for endomyocardial biopsy. Even when LGE cardiac MR myocardial scar was absent, lower T1 time was associated with a greater degree of histologically defined interstitial fibrosis. Thus, T1 mapping provided an independent and noninvasive correlate of histologic fibrosis in this patient population.
There has been limited foregoing data comparing quantitative T1 measurement methods with histopathologically demonstrated fibrosis, to our knowledge. Previous reports have included patients with severe aortic regurgitation (n = 8) or stenosis (n = 18), hypertrophic cardiomyopathy (n = 8), and cardiac transplant recipients (n = 9) (11–13). Our results suggest that even more subtle degrees of diffuse fibrosis may be identified by means of cardiac MR T1 mapping in a diverse population with cardiomyopathy.
Different causes of myocardial injury can result in different patterns, distributions, and degree of myocardial fibrosis, ranging from distinct segmental and replacement fibrosis after coronary occlusion to diffuse interstitial fibrosis in the settings of dilated cardiomyopathy or severe valvular disease (19). Approximately one-third of patients with nonischemic cardiomyopathy have evidence of overt myocardial scarring by LGE, the presence of which is associated with a higher risk of sudden death and clinical decompensation (20). Among other negative effects, intramyocardial scar provides the substrate for the re-entrant arrhythmias representing the most common mode of death in these patients (5). Similar associations between myocardial scar and adverse outcomes have been confirmed in patients both with known strong cardiovascular risk factors, such as diabetes (21), as well as groups without such strong risk factors, where finding of myocardial scar is unexpected, such as marathon runners (22). The observation that intermediate-intensity LGE predicts ventricular arrhythmia in hypertrophic cardiomyopathy better than high-intensity LGE lends further support to the hypothesis that detection of diffuse fibrosis may improve risk stratification in cardiomyopathies (23). Of particular interest is the application of quantitative T1 mapping techniques in the assessment of such patients with cardiomyopathy and without LGE. The subset of patients in this study without LGE included individuals with collagen fractions as high as 19%. Heart failure patients without overt scar but with abnormally short T1 times may represent a distinct category with regard to future clinical events. While it is clear that the presence of LGE-defined myocardial scar designates a high-risk group, it remains to be demonstrated whether intermediate degrees of fibrosis detectable with T1 mapping portend an adverse prognosis.
An advantage of a noninvasive method for the assessment of fibrosis is the potential to follow changes in the myocardium over time. The risks of endomyocardial biopsy preclude its general use in the serial monitoring of myocardial disease (24). Modification of extracellular matrix remodeling appears to be one of the beneficial effects of medical therapy for heart failure (25). Longitudinal imaging of such changes could be applied to individualization of therapy by assessing treatment response in a given patient, and to the evaluation of prospective therapies for heart failure.
We observed significant relationships of similar magnitude between both myocardial fibrosis and T1 time with cardiac structure and function. As would be expected, increased fibrosis–and therefore decreased T1 time–correlated with LV hypertrophy and worsened LV systolic function. These relationships held in a population consisting of a spectrum of etiologies resulting in cardiomyopathy.
The area of myocardium accessible by means of transvenous biopsy techniques is limited to the right ventricular septum, resulting in sampling error and inconclusive biopsies in some cases. Our analysis averaged the postcontrast T1 time across the myocardium, presuming that the degree of collagen present along the right ventricular septum is representative of the remainder of the heart.
Whole-heart autopsy studies (26) and paired left and right ventricular biopsies (27) have yielded consistent results at various sampling sites indicating that alterations in the extracellular matrix are diffuse, thus supporting our approach. However, other reports vary as to the consistency of association between focal injury and interstitial fibrosis in remote areas of myocardium (27–30). Indeed, we observed some inconsistencies likely related to sampling error: Some biopsy specimens with a maximum of 19% fibrosis had no visually evident LGE at MR imaging. On the other hand, patients with low amounts of fibrosis (approximately 5%) in the biopsy specimen showed remote areas of focal LGE at MR imaging. Our methods provided a global measure of fibrosis and did not correlate T1 measurements to biopsy site. Taken as a whole, the problem of biopsy sampling error probably leads to significant scatter in the plot comparing degree of histologic fibrosis versus T1 time. Yet despite this sampling error, a relatively good correlation between degree of fibrosis and T1 value was observed. Ultimately, the T1 mapping approach could potentially offer advantages over biopsy, in that noninvasive imaging allows sampling of the entire myocardium.
The majority of patients in this analysis (72%) did not have pathognomonic findings for a specific cause of cardiomyopathy at biopsy. This expected result is consistent with a previous large series of similar individuals (n = 1230) undergoing endomyocardial biopsy during evaluation of unexplained cardiomyopathy, in which 63% were classified as idiopathic (31).
Amyloid deposition was present in the biopsy specimens of three patients. These patients were included in the analysis because amyloid protein and fibrosis coexist and amyloid deposition is often unexpected (32). This most often occurs in older patients, as was the case in our study. As such, the presence or absence of amyloid cannot be reliably determined a priori in T1 mapping without the benefit of biopsy, as earlier degrees of amyloid deposition do not result in classic subendocardial LGE. Inclusion of these individuals is therefore germane to potential future application of this technique.
There were several limitations of our study. While the sample size is comparable to or larger than other human studies evaluating both cardiac MR and endomyocardial biopsy, some referral bias based on this institution’s population is unavoidable. While most biopsies were performed close in time to cardiac MR, greater time gaps for some patients may have resulted in histologic fibrosis leading or lagging noninvasive measures. Our results may not be generalizable to patients with cardiomyopathies that result in rapid progression of myocardial injury, such as fulminant myocarditis, that were not represented in this population. The retrospective, cross-sectional nature of this analysis precludes assessment of test-retest reproducibility and measurement calibration. Inter- and intrareader reproducibility was not assessed. Gadolinium concentration in tissues is not the sole determinant of T1 time; T1 shortening can also be due to the presence of fat, amyloid protein, or iron, for example. These results may not be generalizable to patients with such disorders. Finally, a modified Look-Locker cardiac MR pulse sequence has been proposed to improve the reliability of T1 mapping (33). This method was not available over the duration of the study, although excellent agreement has been demonstrated with the standard Look-Locker sequence used here (18). Validation studies on phantoms and volunteers demonstrate linear correlation between T1 times measured between 5 and 25 minutes after administration of gadolinium-based contrast material (34). The histologic and cardiac MR methods used in this study assess collagen quantity but cannot be used to evaluate other aspects of extracellular matrix quality—such as collagen glycation and cross-linking—that may play an important role in alteration of cardiac function (35).
In conclusion, noninvasive assessment of myocardial T1 time correlates with interstitial fibrosis as assessed by means of invasive biopsy in patients with cardiomyopathy in our study, including those without focal LGE myocardial scar. Further investigation is required to determine whether this measure can effectively guide clinical intervention and improve morbidity and mortality of patients with heart failure.
Advances in Knowledge.
• Significant myocardial fibrosis can be present at endomyocardial biopsy even when cardiac MR images do not show focal late gadolinium enhancement.
• Postcontrast myocardial T1 time is inversely correlated with the presence of diffuse fibrosis at endomyocardial biopsy in a population with a broad spectrum of cardiomyopathies.
Implications for Patient Care.
• Quantification of myocardial T1 time may be useful for detection of interstitial myocardial fibrosis in cardiomyopathies.
• Further research is necessary to determine whether such interstitial fibrosis is of prognostic importance or may serve as a surrogate endpoint for evaluation of therapy.
Disclosures of Conflicts of Interest: C.T.S. No relevant conflicts of interest to disclose. R.A.N. No relevant conflicts of interest to disclose. N.G. No relevant conflicts of interest to disclose. M.S.N. No relevant conflicts of interest to disclose. S.L. No relevant conflicts of interest to disclose. E.B.T. No relevant conflicts of interest to disclose. J.O.M. No relevant conflicts of interest to disclose. R.J.v.d.G. Financial activities related to the present article: none to disclose. Financial activities not related to the present article: author is a consultant for Medis Medical Imaging Systems. Other relationships: none to disclose. J.A.C.L. No relevant conflicts of interest to disclose. M.K.H. Financial activities related to the present article: none to disclose. Financial activities not related to the present article: royalties from Ventana. Other relationships: none to disclose. D.A.B. No relevant conflicts of interest to disclose.
Acknowledgments
We gratefully acknowledge the contributions of Charles Steenbergen, MD, PhD, for his expertise in cardiovascular pathology. This study was wholly funded by the intramural research program of the National Institutes of Health Clinical Center.
Received December 21, 2011; revision requested January 30, 2012; revision received April 26; accepted June 1; final version accepted June 18.
Funding: This research was supported by the National Institutes of Health Intramural Research Program.
Abbreviations:
- AUC
- area under the curve
- CI
- confidence interval
- LGE
- late gadolinium enhancement
- LV
- left ventricle
References
- 1.Kwon DH, Halley CM, Carrigan TP, et al. Extent of left ventricular scar predicts outcomes in ischemic cardiomyopathy patients with significantly reduced systolic function: a delayed hyperenhancement cardiac magnetic resonance study. JACC Cardiovasc Imaging 2009;2(1):34–44 [DOI] [PubMed] [Google Scholar]
- 2.Bruder O, Wagner A, Jensen CJ, et al. Myocardial scar visualized by cardiovascular magnetic resonance imaging predicts major adverse events in patients with hypertrophic cardiomyopathy. J Am Coll Cardiol 2010;56(11):875–887 [DOI] [PubMed] [Google Scholar]
- 3.Kwong RY, Chan AK, Brown KA, et al. Impact of unrecognized myocardial scar detected by cardiac magnetic resonance imaging on event-free survival in patients presenting with signs or symptoms of coronary artery disease. Circulation 2006;113(23):2733–2743 [DOI] [PubMed] [Google Scholar]
- 4.Kim RJ, Wu E, Rafael A, et al. The use of contrast-enhanced magnetic resonance imaging to identify reversible myocardial dysfunction. N Engl J Med 2000;343(20):1445–1453 [DOI] [PubMed] [Google Scholar]
- 5.Nazarian S, Bluemke DA, Lardo AC, et al. Magnetic resonance assessment of the substrate for inducible ventricular tachycardia in nonischemic cardiomyopathy. Circulation 2005;112(18):2821–2825 [DOI] [PMC free article] [PubMed] [Google Scholar]
- 6.Simonetti OP, Kim RJ, Fieno DS, et al. An improved MR imaging technique for the visualization of myocardial infarction. Radiology 2001;218(1):215–223 [DOI] [PubMed] [Google Scholar]
- 7.Wu E, Judd RM, Vargas JD, Klocke FJ, Bonow RO, Kim RJ. Visualisation of presence, location, and transmural extent of healed Q-wave and non-Q-wave myocardial infarction. Lancet 2001;357(9249):21–28 [DOI] [PubMed] [Google Scholar]
- 8.Thomson LE, Kim RJ, Judd RM. Magnetic resonance imaging for the assessment of myocardial viability. J Magn Reson Imaging 2004;19(6):771–788 [DOI] [PubMed] [Google Scholar]
- 9.Rehwald WG, Fieno DS, Chen EL, Kim RJ, Judd RM. Myocardial magnetic resonance imaging contrast agent concentrations after reversible and irreversible ischemic injury. Circulation 2002;105(2):224–229 [DOI] [PubMed] [Google Scholar]
- 10.Wagner A, Mahrholdt H, Thomson L, et al. Effects of time, dose, and inversion time for acute myocardial infarct size measurements based on magnetic resonance imaging-delayed contrast enhancement. J Am Coll Cardiol 2006;47(10):2027–2033 [DOI] [PubMed] [Google Scholar]
- 11.Flett AS, Hayward MP, Ashworth MT, et al. Equilibrium contrast cardiovascular magnetic resonance for the measurement of diffuse myocardial fibrosis: preliminary validation in humans. Circulation 2010;122(2):138–144 [DOI] [PubMed] [Google Scholar]
- 12.Nigri M, Azevedo CF, Rochitte CE, et al. Contrast-enhanced magnetic resonance imaging identifies focal regions of intramyocardial fibrosis in patients with severe aortic valve disease: Correlation with quantitative histopathology. Am Heart J 2009;157(2):361–368 [DOI] [PubMed] [Google Scholar]
- 13.Iles L, Pfluger H, Phrommintikul A, et al. Evaluation of diffuse myocardial fibrosis in heart failure with cardiac magnetic resonance contrast-enhanced T1 mapping. J Am Coll Cardiol 2008;52(19):1574–1580 [DOI] [PubMed] [Google Scholar]
- 14.Selvin E, Najjar SS, Cornish TC, Halushka MK. A comprehensive histopathological evaluation of vascular medial fibrosis: insights into the pathophysiology of arterial stiffening. Atherosclerosis 2010;208(1):69–74 [DOI] [PMC free article] [PubMed] [Google Scholar]
- 15.Karlsson M, Nordell B. Analysis of the Look-Locker T(1) mapping sequence in dynamic contrast uptake studies: simulation and in vivo validation. Magn Reson Imaging 2000;18(8):947–954 [DOI] [PubMed] [Google Scholar]
- 16.Amano Y, Takayama M, Kumita S. Contrast-enhanced myocardial T1-weighted scout (Look-Locker) imaging for the detection of myocardial damages in hypertrophic cardiomyopathy. J Magn Reson Imaging 2009;30(4):778–784 [DOI] [PubMed] [Google Scholar]
- 17.Gai N, Turkbey EB, Nazarian S, et al. T1 mapping of the gadolinium-enhanced myocardium: adjustment for factors affecting interpatient comparison. Magn Reson Med 2011;65(5):1407–1415 [DOI] [PMC free article] [PubMed] [Google Scholar]
- 18.Nacif MS, Turkbey EB, Gai N, et al. Myocardial T1 mapping with MRI: comparison of look-locker and MOLLI sequences. J Magn Reson Imaging 2011;34(6):1367–1373 [DOI] [PMC free article] [PubMed] [Google Scholar]
- 19.Mahrholdt H, Wagner A, Judd RM, Sechtem U, Kim RJ. Delayed enhancement cardiovascular magnetic resonance assessment of non-ischaemic cardiomyopathies. Eur Heart J 2005;26(15):1461–1474 [DOI] [PubMed] [Google Scholar]
- 20.Assomull RG, Prasad SK, Lyne J, et al. Cardiovascular magnetic resonance, fibrosis, and prognosis in dilated cardiomyopathy. J Am Coll Cardiol 2006;48(10):1977–1985 [DOI] [PubMed] [Google Scholar]
- 21.Kwong RY, Sattar H, Wu H, et al. Incidence and prognostic implication of unrecognized myocardial scar characterized by cardiac magnetic resonance in diabetic patients without clinical evidence of myocardial infarction. Circulation 2008;118(10):1011–1020 [DOI] [PMC free article] [PubMed] [Google Scholar]
- 22.Breuckmann F, Möhlenkamp S, Nassenstein K, et al. Myocardial late gadolinium enhancement: prevalence, pattern, and prognostic relevance in marathon runners. Radiology 2009;251(1):50–57 [DOI] [PubMed] [Google Scholar]
- 23.Appelbaum E, Maron BJ, Adabag S, et al. Intermediate-signal-intensity late gadolinium enhancement predicts ventricular tachyarrhythmias in patients with hypertrophic cardiomyopathy. Circ Cardiovasc Imaging 2012;5(1):78–85 [DOI] [PubMed] [Google Scholar]
- 24.Cooper LT, Baughman KL, Feldman AM, et al. The role of endomyocardial biopsy in the management of cardiovascular disease: a scientific statement from the American Heart Association, the American College of Cardiology, and the European Society of Cardiology. Circulation 2007;116(19):2216–2233 [DOI] [PubMed] [Google Scholar]
- 25.Zannad F, Alla F, Dousset B, Perez A, Pitt B. Limitation of excessive extracellular matrix turnover may contribute to survival benefit of spironolactone therapy in patients with congestive heart failure: insights from the randomized aldactone evaluation study (RALES). Rales Investigators. Circulation 2000;102(22):2700–2706 [DOI] [PubMed] [Google Scholar]
- 26.Brooks A, Schinde V, Bateman AC, Gallagher PJ. Interstitial fibrosis in the dilated non-ischaemic myocardium. Heart 2003;89(10):1255–1256 [DOI] [PMC free article] [PubMed] [Google Scholar]
- 27.Schalla S, Bekkers SC, Dennert R, et al. Replacement and reactive myocardial fibrosis in idiopathic dilated cardiomyopathy: comparison of magnetic resonance imaging with right ventricular biopsy. Eur J Heart Fail 2010;12(3):227–231 [DOI] [PubMed] [Google Scholar]
- 28.Beltrami CA, Finato N, Rocco M, et al. Structural basis of end-stage failure in ischemic cardiomyopathy in humans. Circulation 1994;89(1):151–163 [DOI] [PubMed] [Google Scholar]
- 29.Marijianowski MM, Teeling P, Becker AE. Remodeling after myocardial infarction in humans is not associated with interstitial fibrosis of noninfarcted myocardium. J Am Coll Cardiol 1997;30(1):76–82 [DOI] [PubMed] [Google Scholar]
- 30.Volders PGA, Willems IEMG, Cleutjens JPM, Arends JW, Havenith MG, Daemen MJAP. Interstitial collagen is increased in the non-infarcted human myocardium after myocardial infarction. J Mol Cell Cardiol 1993;25(11):1317–1323 [DOI] [PubMed] [Google Scholar]
- 31.Ardehali H, Qasim A, Cappola T, et al. Endomyocardial biopsy plays a role in diagnosing patients with unexplained cardiomyopathy. Am Heart J 2004;147(5):919–923 [DOI] [PubMed] [Google Scholar]
- 32.Lamke GT, Allen RD, Edwards WD, Tazelaar HD, Danielson GK. Surgical pathology of subaortic septal myectomy associated with hypertrophic cardiomyopathy. A study of 204 cases (1996-2000). Cardiovasc Pathol 2003;12(3):149–158 [DOI] [PubMed] [Google Scholar]
- 33.Messroghli DR, Greiser A, Fröhlich M, Dietz R, Schulz-Menger J. Optimization and validation of a fully-integrated pulse sequence for modified look-locker inversion-recovery (MOLLI) T1 mapping of the heart. J Magn Reson Imaging 2007;26(4):1081–1086 [DOI] [PubMed] [Google Scholar]
- 34.Lee JJ, Liu S, Nacif MS, et al. Myocardial T1 and extracellular volume fraction mapping at 3 tesla. J Cardiovasc Magn Reson 2011;13(1):75. [DOI] [PMC free article] [PubMed] [Google Scholar]
- 35.Kass DA, Bronzwaer JGF, Paulus WJ. What mechanisms underlie diastolic dysfunction in heart failure? Circ Res 2004;94(12):1533–1542 [DOI] [PubMed] [Google Scholar]