

Abstract
Asthma is a chronic inflammatory disease that exhibits airway remodeling with changes in the extracellular matrix (ECM). The role of the ECM in mediating these changes is poorly understood. Hyaluronan (HA), a major component of the ECM, has been implicated in many biological processes in diseases. This study investigates the processes involved in HA synthesis, deposition and localization during the propagation of cockroach-induced asthma. Mice were sensitized and challenged with cockroach antigen, and sacrificed at various time points during an 8-week challenge protocol. Analysis of bronchoalveolar lavage (BAL) fluid revealed an increase in total nucleated cells as early as 6 h, which peaked at 6 days. Histopathologic analysis of the lung tissue revealed an influx of inflammatory cells at the peribronchial and perivascular regions starting at 12 h, which peaked at 6 days and persisted to 8 weeks. Eosinophils predominated in the early time points while lymphocytes predominated during the late time points. Quantitative polymerase chain reaction (PCR) data showed that hyaluronan synthase 1 (HAS1) mRNA peaked within 6 h and then declined. HAS2 mRNA also peaked within 6 h but remained elevated throughout the 8-week exposure course. HA levels in lung tissue and BAL increased at 12 h and peaked by 6 and 8 days, respectively. Inflammatory cells and new collagen formation localized in areas of HA deposition. Taken together, these data support a role for HA in the pathogenesis in asthma.
Keywords: asthma, eosinophils, hyaluronan, lymphocytes, remodeling
Introduction
Asthma is a chronic inflammatory disease that is often linked to allergen exposure and involves multiple mechanisms, including physiological, pathological, and immunological changes in the airways (Murphy and O'Byrne 2010). Characteristic pathological changes include an abnormal accumulation of inflammatory cells (eosinophils, lymphocytes, macrophages, and mast cells), and airway remodeling, which involves an abnormal accumulation of extracellular matrix (ECM) (Huang et al. 1999). Alterations in the ECM have an important role in the pathogenesis of asthma. The reorganization of the ECM induced by chronic inflammation can lead to alterations in airway structure and function, a process that has been referred to as “remodeling” in humans (Elias et al. 2003; Bosse et al. 2008). Mouse models of asthma mimic and replicate many features of human asthma, especially in the cockroach antigen-induced asthma model, which includes cytokine changes from the T-helper 1 (Th1) and Th2 cells as well as ECM remodeling, eosinophil infiltration and airway hyperresponsiveness (AHR) (Warner et al. 2004; Lindell et al. 2008). There are two phases of asthma, acute and chronic stages, that proceed through different physiological, pathological, and immunological changes in the airways. Selective eosinophil infiltration is a central event in the pathogenesis of asthma and remodeling (Janson 2010; Venge 2010); and hyaluronan (HA) matrix deposition may also have an important role (Tran and Halayko 2007). These processes are thought to be mediated by a number of cytokines and chemokines (Chiappara et al. 2001), but it is not clear if and how HA and eosinophil accumulation are related.
HA, a major component and important constituent of the ECM, is synthesized by hyaluronan synthases (HASs) at the inner face of the plasma membrane of the cell and translocated directly into the extracellular space. HAS1 and HAS2 appear to be most important for initiating HA-mediated effects during lung inflammation, and HAS2 in particular has been implicated in many biological processes in diseases and development (Camenisch et al. 2000; Fischer and Schror 2007). Additional evidence suggests that HA may play an active role in immune regulation and wound healing, as well as in a variety of disease states such as inflammatory bowel disease and cancer progression (Alaniz et al. 2009; de la Motte 2011; Jiang et al. 2011; Mack et al. 2012). In asthma, studies have linked HA levels in bronchoalveolar lavage (BAL) fluid with inflammation and asthma severity (Sahu and Lynn 1978; Soderberg et al. 1989; Bousquet et al. 1991). The role of HA in the airway is multi-faceted. HA is a component of normal airway that contributes to proper mucociliary secretions, and also contributes to the physical properties of airway ECM (Jiang et al. 2007). HA can be induced by a variety of cytokines and mediators, and dysregulation of enzymes that degrade HA has been shown to occur in human asthmatics (Soderberg et al. 1989; Monzon et al. 2008). However, how changes in HA and the ECM are related to asthma are still poorly understood, and little is known about the factors that regulate HA synthesis and degradation by the lung during the asthmatic response.
The present study was undertaken to investigate ECM changes, eosinophil and lymphocyte infiltration, and the relative contributions of Thl/Th2 cytokines during the acute and chronic phases of a cockroach antigen-induced murine asthma model. The histopathologic changes in the lungs were observed at 6 and 12 h; 1, 2, 4, 6, and 8 days; 2, 4, 6, and 8 weeks for acute and chronic phases of asthma following antigen challenge in mice previously sensitized with cockroach antigens. Our study also measured changes in the accumulation and localization of HA, eosinophils, and lymphocytes. Finally, we examined the mRNA expression profiles of genes involved in the synthesis and degradation of HA, including HAS1, HAS2, and HAS3; hyaluronidase (HYAL)1 and HYAL2; and of asthmatic inflammation-related transcripts, including cytokines and chemokines.
Results
Rapid increase in hyaluronan in the lung during antigen challenge
Several methods were utilized to quantitate the HA changes in the lung during acute and chronic antigen challenge. An ELISA-like hyaluronan-binding protein (HABP) assay was used for the determination of HA levels present in BAL fluid. There was a statistically insignificant trend toward higher HA levels as early as 6 h after the initial challenge and maintained through day 2 with statistically significant increases seen at day 4 (Figure 1A). The value peaked at day 8 (∼4-fold higher than control) and declined to control level by 6 weeks.
Fig. 1.

Quantitation of HA in BAL and in lung tissue during acute and chronic antigen exposure. (A) HA in BAL was measured by the HABP ELISA-like method. (B) HA in lung tissue was measured by the FACE method and normalized to dry weight. Data represent mean values ± SEM derived from four individual mice for the amount of HA in the lung (µg/g d.w.) and HA in the BAL (ng/mL). *P < 0.05 compared with naïve mice. **P < 0.01 compared with naïve mice.
HA levels in the lung tissue were quantified by the fluorophore-assisted carbohydrate electrophoresis (FACE) method. HA increased significantly by 12 h and peaked at day 6 (7–8-fold higher than control) (Figure 1B). HA decreased gradually through week 8, but remained ∼3-fold higher at that time. HA-sizing data also showed predominately high-molecular-weight HA expressed in the naïve mice lungs with a shift toward an admixture of both high and lower molecular weight HA in the asthmatic lung tissue (Figure 2A). In Supplementary data, Figure S1, an 8× higher concentration of the naïve sample was added to enhance the intensity and make it more comparable with the later time point samples. The trend and pattern of HA sizing were similar to the HA quantitation and to the HA staining, which peaked at 6 days during the time course of antigen exposure. Additionally, time course control mice, which received alum intraperitoneal (IP) and saline exposure, did not have significant increases in HA levels (Supplementary data, Figure S2B).
Fig. 2.
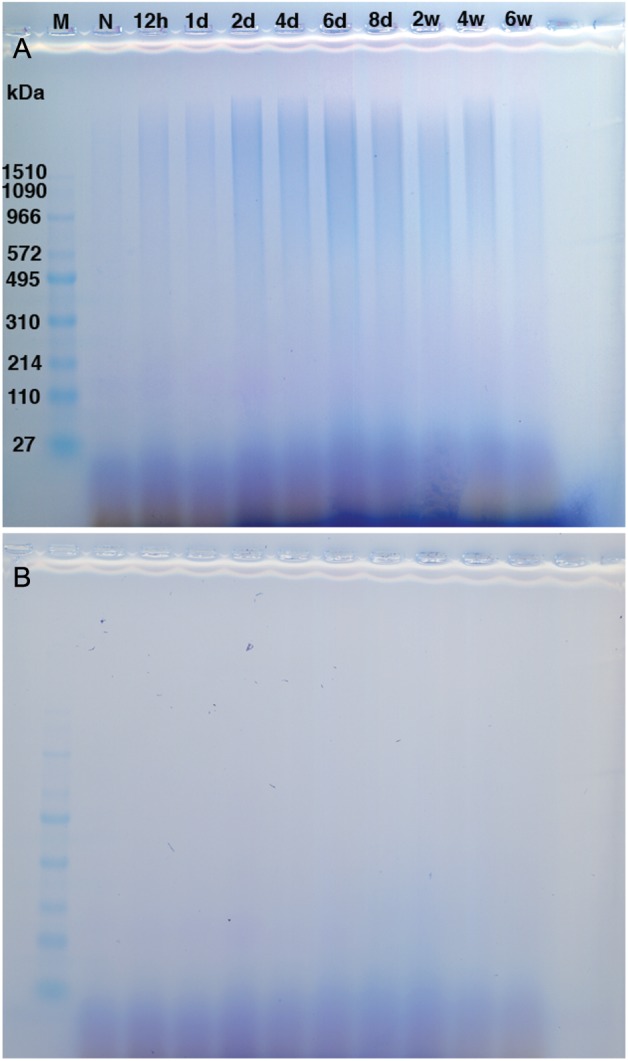
HA sizing distribution from lungs isolated during acute and chronic antigen exposure. (A) HA samples not treated with Streptomyces hyaluronidase. (B) HA samples treated with Streptomyces hyaluronidase. M indicates marker. N represents naïve mice. Data are shown from four pooled samples for the following time points, 12 h (12 h), 1 day (1d), 2 days (2d), 4 days (4d), 6 days (6d), 8 days (8d), 2 weeks (2w), 4 weeks (4w), and 6 weeks (6w).
To provide a corollary to the FACE data and to determine distribution of HA in the lung, fluorescence immunohistochemistry was performed. In the naïve mouse lung, small amounts of HA localize at the basement membrane under epithelial cells (Figure 3). During acute and chronic antigen exposure in the asthma model, HA begins to localize at the basement membrane at 6 h with increasing intensity and deposition occurring in the peribronchial and perivascular areas through day 8. These changes were sustained through the chronic phase to week 8. There was also an increase in HA in the alveolar interstitium visible from day 2 and also sustained through week 8, with a peak response seen at day 6–8 (Figure 3). The visual changes in HA were quantified and a graphical representation is provided in Supplementary data, Figure S3A. Immunohistochemistry staining for HA with an H&E counterstain demonstrates the localization of HA in relation to the lung architecture (Supplementary data, Figure S4A). Time course control mice, which received alum IP and saline exposure, did not have significant increases in HA deposition visualized with immunohistochemistry or when quantified by FACE (Supplementary data, Figures S4B and S2B).
Fig. 3.

Increased HA accumulation in the lungs during acute antigen exposure. Sections were stained with HABP, as described in Methods (magnification bar 100 μm) and reveal increased HA deposition throughout the acute phase, 6 h through 8 days, with gradual clearing during the chronic phase, 2–8 weeks, of antigen challenge. Representative lung sections are shown. The symbol => indicates the airway of lung section. Δ indicates the blood vessel of lung section. Greater than symbol indicates the alveolar interstitium of lung section.
To determine whether the changes in HA were associated with alterations in the known hyaluronan synthases (HAS) or hyaluronidases (HYAL), qPCR was performed. During the acute challenge phase, 6 h through day 8, qPCR data revealed that hyaluronan synthase 1 (HAS1) mRNA was the major HAS mRNA in the lung tissue of naïve mice (HAS1:HAS2:HAS3 mRNAs = 11:1.4:1.0). HAS1 mRNA increased substantially by 6 h but quickly returned to baseline by 1 day and was down-regulated and maintained at a lower level than baseline level through 8 weeks (Figure 4A). Compared with naïve mice, the fold change of HAS1 was statistically significant for all time points except day 1 [all threshold cycle (CT) standard errors of qPCR were <0.17]. HAS2 mRNA also peaked at 6 h, but unlike HAS1 mRNA, remained elevated throughout the 8-week challenge (Figure 4A). Compared with naïve mice, the fold change of HAS2 was statistically significant for all time points except week 8 (all CT standard errors of qPCR were <0.28). HAS3 mRNA levels did not change during the time course of the antigen challenge (data not shown). The HAS2 protein level was detected by HAS2 antibody on western blots (Figure 4C) and also plotted using relative density (Figure 4B). HAS2 remained elevated throughout the 6-week challenge (Figure 4B) compared with naïve mice. The HAS2 protein level and mRNA expression revealed a similar trend (Figure 4A and B). qPCR data also showed the presence of hyaluronidase (HYAL) mRNAs in the naïve lung (HYAL1:HYAL2:HYAL3 mRNAs = 24:82:1). Both HYAL1 and HYAL2 mRNA levels were down-regulated during acute and chronic antigen exposure and lower than the baseline level (Figure 4D). Compared with naïve mice, the fold changes of HYAL1 and HYAL2 were statistically significant at each time point (all CT standard errors of qPCR were <0.13). HYAL3 remained low and unchanged throughout (data not shown). The HYAL1 protein level was detected by HYAL1 antibody on western blots (Figure 4F) and also plotted using relative density (Figure 4E). HYAL1 levels were down-regulated during acute and chronic antigen exposure and lower than the baseline level compared with naïve mice. The HYAL1 protein level and mRNA expression revealed a similar trend (Figure 4D and E).
Fig. 4.

HA synthases (HAS) and hyaluronidases (HYAL) expression at mRNA and protein levels in the lung tissue. (A) Changes in HAS1 and HAS2 mRNA levels by qPCR analyses relative to values from the naïve lung are shown. Data represent the mean values of fold change on the y-axis. (B) Changes in HAS2 protein levels in relative density to values from the naïve lung through 6 weeks are shown. The relative density was normalized against β-actin and plotted. (C) Immunoblotting for HAS2 (63.5 kDa) protein (arrowhead for HAS2) and β-actin from the naïve lung through 6 weeks during the antigen challenge are shown. (D) Changes in HYAL1 and HYAL2 mRNA levels by qPCR analyses relative to values from the naïve lung are shown. Data represent the mean values of fold change on the y-axis. (E) Changes in HYAL1 protein levels in relative density to values from the naïve lung through 8 weeks are shown. The relative density was normalized against β-actin and plotted. (F) Immunoblotting for HYAL1 (67 kDa) protein levels (arrowhead for HYAL1) and β-actin from the naïve lung through 8 weeks during the chronic phase of antigen challenge are shown. qPCR data derived from three per time point, CT standard errors were minimal and provided in text. Western blot is a representative blot from three separate blots of n = 1 per time point.
Inflammatory cell recruitment
To determine the correlation between inflammation and HA deposition, lung sections isolated during the acute and chronic phases of asthma induced by cockroach antigen exposure were initially stained with H&E (Figure 5, Supplementary data, Figure S5). Histopathologic analysis revealed that inflammatory cells began to localize to the peribronchial and perivascular areas as early as 12 h after the first antigen exposure. The infiltration of inflammatory cells increased significantly, reaching a peak at day 6 and persisted through the 8-week protocol. Progressive thickening of airway and alveolar interstitium was also observed (Figure 5). The accumulation of HA in the peribronchial and perivascular regions was similar to the accumulation of inflammatory cells in these regions (Figures 3 and 5).
Fig. 5.

Histopathologic changes in lung tissue during acute and chronic antigen exposure. Hematoxylin and eosin (H&E) staining of lung tissue, demonstrating increased inflammatory cell infiltrates during the acute phase, 6 h through 8 days, and persistent inflammation during the chronic phase, 2–8 weeks, of antigen exposure. A section from a control lung (naïve) is also shown. Additional low magnification fields are shown in Supplementary data, Figure S5. Representative lung sections are shown. The symbol => indicates the airway of lung section. Triangle indicates the blood vessel of lung section.
Analyses of blood cells revealed a rapid increase in the percentage of eosinophils as early as 6 h after first antigen exposure (Figure 6A) with 9.4 ± 2.2% (mean ± SEM) of total white blood cells compared with 2.2 ± 0.6% for naïve mice. The percentage of eosinophils greatly increased to 16.2 ± 2.8% at day 1, remained elevated during the 8-day acute exposure, and declined to near control level by 6–8 weeks. Compared with naïve mice, the percentage of eosinophils was statistically significant at 6 h, and from day 1 to day 8. Analysis of BAL fluid also revealed an increase in total nucleated cells as early as 6 h after the first antigen exposure (Figure 6B), with a steady increase through day 6 and sustained high levels through 8 weeks. The total nucleated cells in BAL fluid were statistically significant from 6 h to 8 days and from 4 to 8 weeks compared with naïve mice. Eosinophils were the highest percentage of the cells recovered in BAL fluid during the acute antigen exposure and up through 8 days during the early time of the chronic phase (Figure 6C). The absolute numbers of eosinophils were statistically significant at 1 day, greatly increased through 6 days, but then decreased significantly during the chronic phase at 6–8 weeks. The eosinophils in BAL fluid were statistically significant from 1 day to 8 days compared with naïve mice. Time course control mice, which received alum IP and saline exposure, did not have significant increases in total cell count in the BAL fluid (Supplementary data, Figure S2A).
Fig. 6.

Eosinophils in blood and BAL, and total nucleated cells in BAL during acute and chronic antigen exposure. (A) Percentage of eosinophils in blood. (B) Total nucleated cells in BAL. (C) Eosinophils in BAL. Mice were sacrificed at the time points indicated during the course of antigen exposure. Data represent mean values ± SEM, derived from four individual mice. *P < 0.05 compared with naïve mice. **P < 0.01 compared with naïve mice.
Eosinophil major basic protein (EMBP) is a constituent of the crystalline core of the eosinophil granule and is a marker for eosinophils. EMBP staining of lung sections revealed eosinophil infiltrates as early as 6 h after first antigen exposure (Figure 7). The eosinophils tended to cluster together and accumulate in the peribronchial and perivascular areas by 1 day. This phenomenon continued to increase with large eosinophil infiltrates that reached a peak at 6–8 days. The clustering infiltrates were diminished, but still detectable by 2 weeks. Through 8 days, the pattern and distribution of eosinophil infiltration appeared similar to inflammatory cell infiltration of the lung histopathology data shown in Figure 5 and Supplementary data, Figure S5. Despite continued intermittent antigen exposure and persistent inflammation infiltrates during weeks 2–8 (Figure 5, Supplementary data, Figure S5), eosinophils diminished progressively during 2–4 weeks and were markedly reduced by 8 weeks (Figure 7). The visual changes in EMBP were quantified, and graphical representation is provided in Supplementary data, Figure S3B.
Fig. 7.

Eosinophils distribution in lung tissue during acute and chronic antigen exposure. Lung sections from naïve and challenged mice were stained with anti-EMBP [red (full colour versions of figures are available online)], which demonstrates the distribution and increase in eosinophils during the acute phase, 6 h through 8 days, and resolution during the chronic phase, 2–8 weeks. Representative lung sections are shown.
Despite the decrease in eosinophils during the chronic phase, particularly weeks 6–8, the H&E staining suggested a persistent inflammatory infiltrate at these late time points (Figure 5). To determine the cellular makeup of these inflammatory cells, we utilized CD45R/B220 antibody and CD3 antibody as markers for B and T cells, respectively. A few B cells (red) and T cells (green) were scattered in the lung of naïve mice (Figure 8). CD45R/B220 and CD3 double staining showed that B and T cells began to accumulate at 2 days after the first antigen exposure, with greatly increased accumulation at days 6–8, that persisted through week 8. During the acute phase, the peak inflammatory response for eosinophils (Figure 7), B cells, and T cells (Figure 8) appeared to occur around days 6–8. While during the chronic phase, the peribronchial and perivascular inflammation was predominately composed of B cells and to a lesser extent T cells. Supplementary data, Figure S6 shows the distribution of B cells and T cells at higher magnification.
Fig. 8.

B- and T-lymphocyte distribution in lung tissue during acute and chronic antigen exposure. Lungs from naïve and challenged mice were stained with anti-CD45R/B220 [red (full colour versions of figures are available online)] for B cells and anti-CD3 (green) for T cells. Additional high magnification fields are shown in Supplementary data, Figure S6. Mice were sacrificed at the time points indicated during the course of antigen exposure. Representative lung sections are shown.
Finally, to determine the distribution of macrophages and monocytes, we utilized the ER-HR3 antibody. There is no staining for macrophages and monocytes in the lung of naïve mice (Figure 9). ER-HR3 staining showed scattered staining 1 day after the first antigen exposure, increased staining for macrophages and monocytes at day 2, and greatly increased accumulation through days 4–8 in the peribronchial and perivascular areas (Figure 9). During the chronic phase, from 2 to 8 weeks, the distribution pattern of macrophages persisted and was similar to the lung distribution of B and T cells (Figure 8).
Fig. 9.

Monocyte and macrophage distribution in lung tissue during acute and chronic antigen exposure. Lung sections were stained for macrophages and monocytes using anti-ER-HR3 [red (full colour versions of figures are available online)] and counterstained with hematoxylin (magnification bar 100 μm). Mice were sacrificed at the time points indicated during the course of antigen exposure. Representative lung sections are shown. The symbol => indicates the airway of lung section. Triangle indicates the blood vessel of lung section.
HA receptors
CD44 is the prototypic HA receptor and has been shown to be important in lymphocyte adherence and trafficking. To determine the pattern of CD44 expression, we utilized the CD44 IM7 antibody, which recognizes all isoforms of CD44. A few CD44+ cells (red) were scattered in the lung of naïve mice (Supplementary data, Figure S7). CD44+ cells began to accumulate at 1 day after the first antigen exposure, with a peak around day 6–8 that was maintained throughout the chronic phase. The staining pattern was similar to the pattern seen with T and B cell staining (Figure 8, Supplementary data, Figure S6). The same pattern was seen using the CD44 KM201 antibody (data not shown). CD44 knockout lung tissue was used as a negative control and did not reveal any staining (data not shown).
Cytokine and chemokine mRNA expression
IL-4 is a Th2 cytokine that enhances both secretion and cell surface expression of IgE and IgG1, and it also regulates the expression of the low-affinity Fc receptor for IgE on both lymphocytes and monocytes (Kuperman and Schleimer 2008). IL-4 mRNA in the lung is at a relatively low level in the naïve mice (Figure 10A, circles). The expression of IL-4 mRNA in the lung tissue rapidly increased within 6 h and peaked at 12 h (∼280-fold higher than the naïve control level) after the first antigen challenge. IL-4 subsequently decreased gradually from day 1 through week 8, but was still 30-fold higher than control at week 8. Compared with naïve mice, the fold change of IL-4 was statistically significant at each time point, (all CT standard errors of qPCR were <0.25). CCL7 (MCP-3) is a chemoattractant for eosinophils and a chemotactic factor that attracts both monocytes and lymphocytes (Romagnani 2002). The expression of CCL7 mRNA (Figure 10A, squares) showed a similar pattern as IL-4 mRNA, rapidly peaking at 6 h (30-fold higher than the naïve control level) after the first antigen challenge, followed by a gradual decrease from day 1 through week 8, but was still 1.4-fold higher than control at week 8. Compared with naïve mice, the fold change of CCL7 was statistically significant at each time point (all CT standard errors of qPCR were <0.26).
Fig. 10.

QPCR analyses of mRNA expression levels for chemokines related to asthma inflammation in lung tissue isolated at different times of antigen exposure. (A) Cytokine IL-4 (left y-axis) and chemokine CCL7 (right y-axis) levels are shown. (B) Cytokine IL-5 and IL-6 levels are shown. (C) Eotaxin-1 (CCL11) levels are shown. (D) Cytokine IL-13 and chemokine CCL8 levels are shown. Data represent mean values derived from n = 3 of fold change on the y-axis. CT standard errors were minimal and provided in text.
IL-5 and IL-6 are also Th2 cytokines. IL-5 stimulates eosinophil function, regulates the production and function of B cells, eosinophils and basophils, and has also been implicated in airway remodeling in asthma (Broide 2008). The expression of IL-5 mRNA in the lung tissue increased gradually and was sustained for 8 days, then IL-5 mRNA decreased gradually from week 2 through week 8 (Figure 10B, circles). Compared with naïve mice, the fold change of IL-5 was statistically significant from 6 h to 2 weeks (all CT standard errors of qPCR were <0.28). IL-6 is an important mediator of acute inflammatory responses and can induce the expansion of Th2 effector cells (Doganci et al. 2005). The expression of IL-6 mRNA (Figure 10B, squares) showed a pattern similar to IL-4 and CCL7 mRNAs, rapidly peaking 6 h (16-fold higher than the naïve control level) after the first antigen challenge, and subsequently decreasing gradually from day 1 through week 6, with return to baseline by week 8. Compared with naïve mice, the fold change of IL-6 was statistically significant at each time point except 8 weeks (all CT standard errors of qPCR were <0.16).
Eotaxin-1 (CCL11) is chemotactic for eosinophils, basophils, and Th2 cells and is involved in the recruitment of eosinophils to tissues (Bisset and Schmid-Grendelmeier 2005). qPCR data of lung tissue showed that CCL11 mRNA was seen as early as 6 h after the antigen challenge and increased gradually from 6 h to a peak at 6 days (Figure 10C). CCL11 then decreased but remained elevated at ∼6-fold higher than the naïve control level at week 8. Compared with naïve mice, the fold change of CCL11 was statistically significant at each time point (all CT standard errors of qPCR were <0.22). The pattern of expression was similar to the eosinophil counts in BAL fluid (Figure 6C) and eosinophil staining in lung sections (Figure 7).
IL-13 is also an important mediator of inflammation in asthma and shares some functions with IL-4 as well as being linked to the development of AHR (Kuperman and Schleimer 2008). The expression level of IL-13 mRNA in the lung tissue was increased at 6 h to 1 day (Figure 10D, circles), then gradually increased to a maximal level at day 8 (220-fold higher than naïve control level) of the antigen challenge. It was significantly decreased during the chronic phase weeks 2–8, but still maintained an 18-fold higher level at week 8. Compared with naïve mice, the fold change of IL-13 was statistically significant at each time point (all CT standard errors of qPCR were <0.37). CCL8 (MCP-2) is a chemotactic factor that attracts lymphocytes, monocytes, eosinophils, and basophils (Romagnani 2002). The expression level of CCL8 mRNA in the lung tissue began to increase at day 1 (9-fold higher) and quickly reached a peak level on day 8 (∼300-fold higher) (Figure 10D, squares). CCL8 then decreased at week 2 but was sustained through week 8 (34-fold higher). Compared with naïve mice, the fold change of CCL8 was statistically significant at each time point (all CT standard errors of qPCR were <0.12).
Hyaluronan co-localizes with inflammatory cells
The similar distribution of HA (Figure 3) and eosinophils (Figure 7) in lung tissue suggested that they would co-localize in peribronchial and perivascular areas. Double staining of HA with HABP and eosinophils with EMBP on lung sections addressed this issue directly and demonstrated many regions with accumulated eosinophils embedded in extensive peribronchial and perivascular HA matrices most notably at days 6 and 8 (Figure 11A, higher magnification in B). At these times, eosinophils were also frequently associated with the HA in alveolar interstitium. As expected from the decrease in eosinophils during the chronic phase of weeks 2–8, the regions of accumulated HA at these times revealed sparse numbers of eosinophils.
Fig. 11.

Co-localization of HA and eosinophils in the lung during acute and chronic stages of antigen exposure. Lung sections were stained with HABP [green (full colour versions of figures are available online)] and anti-EMBP (red). (A) Distribution of HA (green) and eosinophils (red) are shown at the indicated time points. (B) Enlargements (four times) of lung sections show extensive HA matrix (green) with embedded clusters of eosinophils (red) from 6 days detailing the perivascular area, and 8 days detailing the peribronchial area (magnification bar 25 μm).
The distribution of HA (Figure 3) and lymphocytes (Figure 8 and Supplementary data, Figure S6) also suggested that they would co-localize in peribronchial and perivascular areas. B and T cell infiltrations revealed a similar location but B cells dominated, thus double staining was performed for HA and B cells (Figure 12 and Supplementary data, Figure S8). There was strong staining for HA with small amounts of B cells from 2 to 4 days. There were many regions that demonstrated accumulation of B cells embedded in HA matrices around peribronchial and perivascular areas most notably from day 6 to 8 weeks (Figure 12 and Supplementary data, Figure S8). Even when there was less HA staining in the peribronchial and perivascular areas from 2 to 8 weeks, there were still extensive numbers of B cells embedded in HA matrices (Figure 12 and Supplementary data, Figure S8).
Fig. 12.

Co-localization of HA and B-lymphocytes in the lung during acute and chronic stage of antigen exposure. Lung sections were stained with HABP [green (full colour versions of figures are available online)] and B-lymphocytes (red), which demonstrate B cells embedded in the HA matrix (magnification bar 50 μm). Selected time points were used in this figure, and additional low magnification fields are shown in Supplementary data, Figure S8.
Hyaluronan co-localizes with new collagen synthesis
Collagen staining for lung sections revealed that collagen deposition started to increase during days 1–4, and remained at a high level from day 6 through week 4 (Figure 13). During this time course, both HA and collagen deposition occurred in similar areas from 12 h through week 8 (Figure 13 and Supplementary data, Figure S9) with some degree of overlap as noted by the yellow color. Although HA and collagen showed similar patterns of distribution, HA was more prominent during the acute phase (12 h to 8 days), while new collagen formation was more pronounced in the chronic phase (2–8 weeks) (Figure 13 and Supplementary data, Figure S9).
Fig. 13.
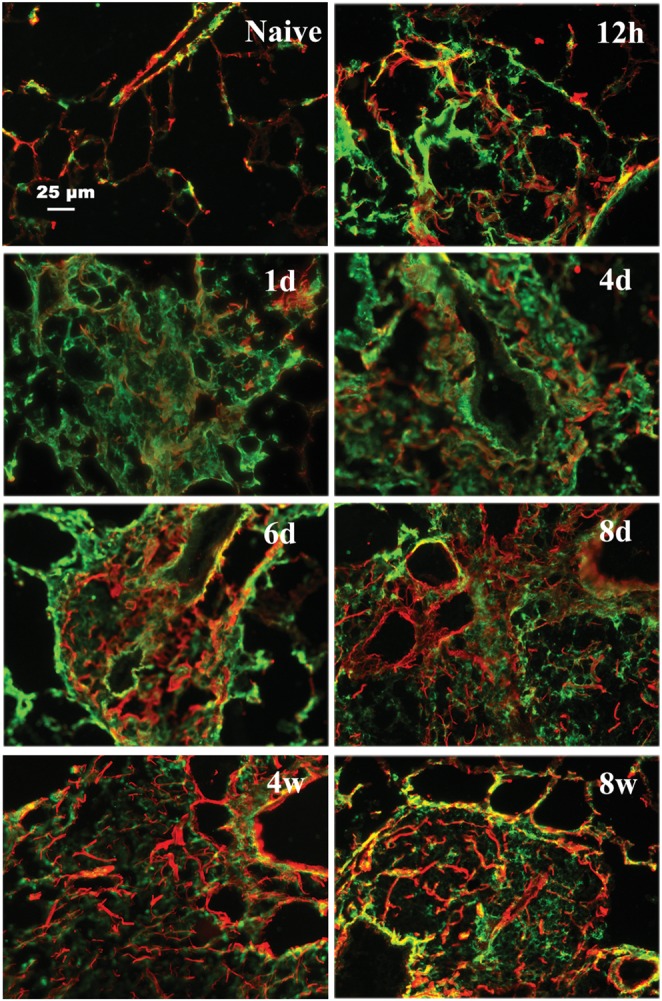
Co-localization of HA and collagen in the lung during the acute and chronic stages of antigen exposure. Lung sections were stained with HABP [green (full colour versions of figures are available online)] and anti-col III (red) for collagen. Images demonstrate an increase in collagen deposition in areas of HA during the acute phase with clearing of HA but persistence of collagen during the chronic phase. Additional low magnification fields are shown in Supplementary data, Figure S9. Mice were sacrificed at the time points during the course of antigen exposure as in Figure 2. Representative lung sections are shown.
Discussion
The ECM has an important role in the lung, both in normal homeostasis and in disease (Souza-Fernandes et al. 2006). HA, a major component of the ECM, has been implicated in many biological processes and diseases including asthma, where it seems to serve a role in mucosal defense (Forteza et al. 2001) but also may be a marker of inflammation (Soderberg et al. 1989; Bousquet et al. 1991). Our study describes the synthesis, deposition, and removal of HA in the cockroach-induced murine model of asthma. We have also investigated the correlation of HA deposition with leukocyte infiltration and cytokine/chemokine expression. The early increase of HA content in the BAL and lung at 6 and 12 h (Figure 1) no doubt comes from constitutively expressed HASs, but it is interesting to note the rapid rise and fall in HAS1 mRNA (Figure 4), and the equally rapid rise and sustained expression of HAS2 mRNA (Figure 4) suggests that HAS2 may be the predominate contributor of HA deposition in the lung during antigen challenge. Meanwhile, HA degradation may be reduced as HYAL1 and HYAL2 are down-regulated (Figure 4). At nearly the same time point, 12 h, eosinophils are detected in the lung parenchyma and then subsequently co-localize in areas of HA deposition. Interestingly, HA has been shown to interact with eosinophils to promote survival and to stabilize cytokine mRNA leading to enhanced secretion of both granulocyte-macrophage colony stimulating factor and transforming growth factor beta (Ohkawara et al. 2000; Esnault and Malter 2003). Eosinophils are thought to have a pivotal role in the pathophysiology of asthma due to the tissue damage and alterations in airway function in asthma through their cytotoxic capacity and may provide some of the necessary mediators linked to airway remodeling (Broide 2008; Venge 2010). Thus, the interaction between HA and eosinophils may be a crucial link in the signaling pathways leading to lung pathology and remodeling associated with asthma.
It is also clear that lymphocytes participate in many aspects of asthma pathophysiology. T lymphocytes modulate B-cell function, mediate several types of cellular toxicity, and release cytokines. T lymphocytes are therefore recognized as being the principle regulatory cell in the development of allergic inflammation while B cells are responsible for immunoglobulin synthesis. The CD44-HA interaction has been shown to be important for lymphocyte recruitment in a similar murine model of asthma (Katoh et al. 2007). In our study, both T and B cells enter the lung during the early phase of challenge. During days 6–8 and during the chronic phase, B cells seem to be the predominant lymphocyte. The role of B cells is not clearly defined in asthma. However, a study utilizing a similar model of chronic cockroach antigen exposure also found a large number of B cells infiltrating the lung (Lindell et al. 2008). This study provided evidence that B cells were participating in antigen presentation to T cells as well as in the preferential production of Th2 cytokines. In addition, the B cell-driven Th2 responses and mucus hyper secretion in the lungs were dependent on major histocompatibility complex II expression by the B cells (Lindell et al. 2008).
The HA content in the BAL correlated well with increasing eosinophils in the acute inflammatory phase of asthma and early chronic phase of asthma. HA peaks in the BAL and lung also correlated well with influx of lymphocytes and macrophages in our model. Determining whether HA precedes inflammation or is a result of inflammation is somewhat difficult in our model as increased HA synthesis and inflammatory cell recruitment occur very rapidly. However, in a model of intestinal inflammation, it was shown that HA precedes and promotes leukocyte recruitment (Kessler et al. 2008).
Additionally, determining the source of HA in this model is difficult as almost every cell has the capacity to produce HA. It is clear from previous work by members of our group that both airway epithelia cells and airway smooth muscle cells are capable of producing HA (Lauer et al. 2008; Lauer, Fulop, et al. 2009; Lauer, Mukhopadhyay, et al. 2009). The exact stimulus for HA production is also difficult to determine, as a variety of factors have been linked to increased HA synthesis including prostaglandins and a multitude of cytokines, many of which have roles in asthma (Wilkinson et al. 2004; Fischer and Schror 2007; Jiang et al. 2007).
There are several possible pathways involved in the degradation or removal of HA from the lung. One possibility is resetting the balance of the HASs and HYALs. During the acute antigen challenge, when HA synthesis is increasing, there is an increase in HAS mRNA with a subsequent decrease in HYAL mRNA. Conversely, during the late stages of the chronic antigen challenge, both HAS2 and the HYALs are returning to their baseline levels. Other possibilities include the degradation of HA due to oxidative stress generated by epithelial cells during the asthmatic response (Monzon et al. 2010) or by removal via the CD44 receptor on macrophages as was shown by Teder et al. (2002). Certainly, none of these possibilities are mutually exclusive, and it is possible that all or more than one may have a role in HA clearance.
It is clear that HA participates in many aspects of asthma pathophysiology. Our data support published data linking HA to lymphocyte recruitment (Katoh et al. 2007). In addition, the early deposition of HA may act as a reservoir for cytokines, chemokines, and growth factors produced by the structural cells close by as well as the cells recruited to areas of HA deposition (Vaday and Lider 2000). Finally, new collagen synthesis occurred in the same areas as HA was initially deposited, suggesting that HA may be providing the scaffolding for changes associated with airway remodeling. Recently published data linking increased HAS2 expression in fibroblasts of asthmatics also support this conclusion (Liang et al. 2011).
In summary, this is the first paper to investigate HA deposition and correlation with inflammatory cell types, cytokine, and chemokine expression in a time course utilizing the cockroach-induced murine model of asthma. The accumulation of HA in the peribronchial and perivascular regions was a very early event in the acute phase, and the distribution was similar to the accumulation of inflammatory cells in these same regions. Eosinophil and lymphocyte infiltration correlate with HA accumulation, and appear to have different roles during the asthma phases. HA precedes the ECM changes in the chronic phase during which it co-localizes with collagen and may mediate or provide a scaffold for new collagen synthesis. Our lab currently has ongoing experiments with the various HAS knockout mice to better investigate the roles of the three HASs in HA production as well as to determine the possible mechanisms and functions of HA deposition within the lung in this model of allergic pulmonary inflammation. These data will be useful as these further investigations proceed in determining underlying mechanisms and the potential for HA–leukocyte interactions.
Materials and methods
Animals and animal care
Immunocompetent, non-irradiated, 6–8-week-old female BALB/c mice were obtained from the Jackson Laboratory (Bar Harbor, ME). All mice were maintained at the Cleveland Clinic animal care facility under specific pathogen-free conditions using microisolator cages and were used in accordance with applicable regulations after institutional approval. Food and water were available ad libitum.
Cockroach antigen sensitization protocol
Eight-week-old mice were sensitized by IP injection of 5 μg of cockroach antigen adsorbed to 20 mg of aluminum hydroxide (Al(OH)3). Two weeks later, mice were challenged with 5 μg of cockroach antigen in 50 μl of saline by intranasal delivery once a day for 8 days starting on day 0, and then twice a week until 8 weeks. Mice were sacrificed during the course of antigen exposure at 6 and 12 h; 1, 2, 4, 6, and 8 days; 2, 4, 6, and 8 weeks. Mice without antigen sensitization and challenge were used as control, and four mice were used in each time point of the study.
Collection of bronchoalveolar lavage fluid and blood
At each time point, mice were euthanized with an IP injection of sodium pentobarbital. Blood was collected in EDTA syringes by cardiac puncture and run on an ADVIA 120 Hematology System (Siemens Healthcare Diagnostics, IL) to obtain total blood leukocyte cell count and percentage of cells. BAL was obtained by cannulating the trachea with a 24 gauge-feeding needle, and the lungs were lavaged with 700 µL of HL-1 medium with gentle suction via syringe. Typically, 400–600 µL BAL fluid was recovered from each mouse. Total nucleated cells in BAL were counted on a hemocytometer by light microscopy after ethidium bromide and acridine orange staining of nucleated cells. Cytospins of 100 µL of BAL were prepared by using Shandon EZ single Cytofunnel (Thermo Scientific, Kalamazoo, MI) and used to determine differential counts of 200 cells after staining with HEMA 3 (Fisher Diagnostics, Middletown, VA) using standard morphologic criteria to classify the cells as eosinophils, lymphocytes, neutrophils, or other mononuclear leukocytes (alveolar macrophages and monocytes). The absolute eosinophil numbers were calculated by multiplying total nucleated cell counts with the percentage of eosinophils in BAL cells for each time point. The remainder of each BAL sample was centrifuged at 145 × g for 5 min at 4°C. Supernatants were transferred to a new tube and analyzed for HA with an HA-binding protein (HABP) ELISA-like assay as described below.
Lung collection and histological analysis
The superior and middle lobes of the right lung were collected for RNA preparation, and the inferior lobes of right and left lungs were collected for either HA quantitation or for protein preparation. The upper left lobe of each lung was collected either for histology by fixation in 10% formalin overnight and then paraffin embedded, or fresh frozen for immunohistochemistry by inflating with an optimal cutting temperature (OCT) compound (Sakura Finetek, Torrance, CA) and then embedding in OCT for storage at −80°C.
Paraffin-embedded lung tissue was sectioned at 5 μm, and sections were stained with hematoxylin and eosin (H&E) to determine morphology and infiltration of inflammatory cells. OCT-embedded fresh frozen lung tissue was sectioned at 8–10 μm using a cryostat, and sections were used for immunohistochemistry analyses.
Quantitation of HA by a specific ELISA-like assay
Quantitation of HA was determined by using the HA test kit (Corgenix, Inc., Broomfield, CO) according to the manufacturer's instructions. The HA test kit is an enzyme-linked-binding protein assay that uses a capture molecule known as the ‘hyaluronic acid binding protein’ (HABP). Diluted BAL samples were incubated in HABP-coated microwells, allowing the HA present in samples to react with the immobilized HABP. After the removal of unbound BAL molecules by washing with PBS, a solution of HABP conjugated with horseradish peroxidase (HRP) was added to the microwells to form complexes with bound HA. Following another washing with PBS, a chromogenic substrate of tetramethylbenzidine and hydrogen peroxide were added to develop a colored reaction. The intensity of the color was measured at 450 nm with a spectrophotometer. HA levels in BAL and control samples were determined using a reference curve prepared from the reagent blank and the HA reference solution provided with the kit.
Preparation of HA for fluorescent derivatization with 2-aminoacridone
FACE was done as previously described (Lauer et al. 2009). Briefly, the lower lobes of the right and left lungs were digested with proteinase K (Invitrogen, Carlsbad, CA) at 1 mg/mL in 100 mM ammonium acetate, pH 7.0 with 0.01% lauryl sulfate at 60°C for 4 h, and the HA was recovered by ethanol precipitation (Lauer et al. 2009). The HA was digested to disaccharides at 37°C overnight with hyaluronidase SD at 2.5 mU/µL (Seikagaku) and chondroitinase ABC at 25 mU/µL (Seikagaku) followed by labeling with 2-aminoacridone (AMAC) (Invitrogen). The samples were electrophoresed on a polyacrylamide gel, and the gel was washed with distilled water. After electrophoresis, the gels (in their glass plates) were placed on a UV transilluminator (Ultra Lum, Claremont, CA) and illuminated at 365 nm. Images were captured on a Quantix CCD camera (Photometrics, Tucson, AZ), and the HA disaccharide band was quantified using Gel-Pro Analyzer® version 3.0 (Media Cybernetics, Silver Spring, MD). All statistics (Student's t-tests) were done using KaleidaGraph v3.6 (Synergy Software, Reading, PA).
The lower lobes of the right and left lungs from six mice were also collected and lyophilized to obtain the dry weight of the lung tissue. The total amount (in µg) of HA from each lower lobe of right and left lungs was calculated per dry weight.
Hyaluronan sizing analysis
Portions of the ethanol precipitates from the proteinase K digests described in the previous section were dissolved in 20 µL of the sample buffer (100 mM ammonium acetate, pH 7.0), and then digested with 3 µL of 2 U/µL DNase (Ambion, Austin, TX) and 3 µL of 1.28 µg/µL RNase (Roche, Indianapolis, IN) as described (Lauer et al. 2009). Streptomyces hyaluronidase (1 µL at 0.2 TRU/µL) was added to 10 µL of each sample (containing the purified HA) for 4 h at 37°C, and then inactivated in a boiling water bath for 5 min. The digested sample and a 10 μl untreated aliquot with intact HA were lyophilized and redissolved in 10 μl of tris-acetate–EDTA (TAE; 4 mM tris, 50 mM EDTA, pH 8.26). The samples were then analyzed by electrophoresis on 1% agarose gels (SeaKem HGT, Cambrex, Walkersville, MD), which had been pre-run at 80 volts (constant) for 6 h to remove impurities, using TAE as the electrophoresis buffer. HA molecular weight standards (Select-HA™ LoLadder, HiLadder and Mega-HA™ Ladder; Hyalose, Oklahoma City, OK) were run on the same gel for comparison. The gels were electrophoresed for 1 h and 11 min at 100 volts (0.5 cm thick, 11 × 8 cm gel) at 4°C and then stained with Stains-All (200 mL at 6.25 µg/mL in 30% ethanol; E-9379, Sigma-Aldrich) for overnight in darkness. The gels were then washed with distilled water and exposed to light for ∼25 min until background was minimal. The gels were imaged on a light box with a color digital camera.
Immunohistochemistry
Fresh frozen OCT sections were fixed in cold acetone/methanol 50/50% solution for 10 min. Sections were then blocked with 3% BSA/PBS for all antibodies used. In addition, following 3% BSA/PBS blocking, sections were blocked with avidin, biotin, and streptavidin (Vector Laboratories, Burlingame, CA) for all sections stained with HABP or for double staining with HABP. Sections were incubated with HABP (biotinylated HA-binding protein, Seikagaku, 5 μg/mL) or the primary antibodies for 1 h at room temperature or overnight at 4°C. Primary antibodies were goat polyclonal antibody eosinophil major basic protein (EMBP) (Santa Cruz Biotechnology, Santa Cruz, CA, at 4 μg/mL), rabbit polyclonal anti-mouse CD3 (Abcam, at 2 μg/mL, pan-T cell marker), rat anti-mouse CD45R/B220 (BD Pharmingen, at 2.5 μg/mL, pan-B cell marker), rat anti-mouse CD44 IM7 (550538, BD Pharmingen, at 0.625 μg/mL, standard CD44 marker), rat anti-mouse CD44 KM201 (1500-01, Southern Biotechnology, at 1.25 μg/mL, standard CD44 marker), and polyclonal goat anti-human collagen III (Southern Biotechnology Associates, Inc., Birmingham, AL, 8 μg/mL). Polyclonal goat anti-human collagen III reacts with type III collagen and exhibits <10% cross-reactivity with collagen type I, II, IV, V, and VI. After washing, secondary antibody was added and incubated for 1 h at room temperature in the dark. Streptavidin conjugated 488 (for HABP), or goat anti-rabbit 488 (for CD3), or donkey anti-rat 594 (for CD45R/B220), or donkey anti-goat 594 (for EMBP or collagen III) were used as secondary antibodies. All secondary antibodies were used at a concentration of 1.5 μg/mL.
Paraffin lung sections were stained with rat monoclonal anti-mouse ER-HR3 (Abcam, at 2 μg/mL, macrophages + monocytes marker). Sections were deparaffinized with Clear-Rite 3 (Richard-Allen Scientific, Kalamazoo, MI) and hydrated with graded alcohol series. Sections were treated with antigen retrieval by citrate-based solution (pH 6.0, Vector Laboratories) and then were fixed in cold acetone/methanol 50/50% solution for 10 min. Sections were then blocked with 3% BSA/PBS. In addition, sections were blocked with avidin and biotin (Vector Laboratories) following the 3% BSA/PBS blocking. Sections were incubated with rat anti-mouse ER-HR3 for 1 h at room temperature, and following washing, were incubated with biotinylated anti-rat IgG (mouse adsorbed) made in rabbit (Vector Laboratories) for 30 min. Sections were incubated with VECTASTAIN ABC-AP and alkaline phosphatase RED (Vector Laboratories) for 30 min each and counterstained. For HA staining, sections were deparaffinized in xylene and hydrated with graded alcohol series. Sections were incubated in 3.0% hydrogen peroxide in water for 30 min at room temperature. Sections were blocked as above and then incubated with HABP (biotinylated HA-binding protein, Calbiochem, 5 μg/mL) for overnight at 4°C and following washing, applying ABC (Vectastain Elite Peroxidase, #PK-6100, Vector Laboratories) reagent for 30 min. Sections were incubated with ImmPACT DAB Substrate (#SK-4105, Vector Laboratories) for 10 min and counterstained in hematoxylin (#H-3401, Vector Laboratories) for 1 min.
The control of only secondary antibodies was used for all immunohistochemistry and each was negative. Sections were examined with a Leica fluorescence microscope, and images were captured with a Retiga 2000R camera and QCapture pro6 software. HABP for HA staining and EMBP for eosinophils staining in lung tissues were quantified by Image-Pro plus 7.0 software.
Immunoblotting
Mouse lung tissue was homogenized in radio immunoprecipitation assay Buffer (Cell Signaling, Danvers, MA) on ice by adding 1 mM phenylmethylsulfonyl fluoride immediately before the use for protein extraction. NuPAGE® Novex® 4–12% Bis–Tris Gel (Invitrogen, Carlsbad, CA) and morpholinopropanesulfonic acid-{3-(N-Morpholino)propanesulfonic acid, or, 4-Morpholinepropanesulfonic acid} buffer were used to separate proteins on gel electrophoresis. For western blots, membrane was blocked in blocking buffer [either 5% w/v BSA or nonfat dry milk in PBST (1× PBS, 0.1% Tween-20)] with gentle agitation for 1 h at room temperature and then was incubated with diluted primary antibody in blocking buffer at 4°C with gentle shaking for overnight. The membrane was washed three times for 10 min each with PBST. The membrane was then incubated with the species appropriate HRP-conjugated secondary antibody (at 1:5000 dilution) in blocking buffer with gentle agitation for 1 h at room temperature. The membrane was washed three times for 10 min each with PBST. Enhanced chemiluminescence (ECL) (Amersham ECL Western Blotting Detection Reagents, GE Healthcare, Little Chalfont, Buckinghamshire, UK) was used for protein detection in western blots. ImageJ software (NIH) was used for western blots quantification. Primary antibodies were goat polyclonal HAS2 (sc-34068, Santa Cruz Biotechnology, at 0.5 μg/mL), rabbit polyclonal HYAL1, a kind gift from Carol De La Motte, was used at a dilution of 1:5000. Monoclonal Anti-β-Actin (A5441, Sigma, St. Louis, MO, dilution of 1:6000) was used for internal control.
Quantitative real-time PCR (qRT-PCR)
Total RNA was extracted from lung tissue using a standardized TRIzol method of phenol extraction (Invitrogen, Carlsbad, CA) and then cleaned with RNA cleanup kit (Qiagen, Valencia, CA). Total RNA was measured by NanoDrop (Wilmington, DE). The A260/A280 ratio was between 1.9 and 2.2 for all samples. Total RNA samples from four mice for each time point were pooled together for qRT-PCR analysis. Transcripts were studied by qRT-PCR in triplicate. Transcript-specific primers were generated based on mouse sequences from GenBank and were designed using Primer Express software (Applied Biosystems, Inc., ABI, Foster City, CA). NCBI BLAST was used to ensure the specificity of each primer pair for each transcript. All primers were checked for their dissociation curve and melting temperature. Each transcript of the qRT-PCR product was around 100 bp. Primer sequences are listed in Supplementary data, Table S1. The primer for eotaxin-1 (CCL11) was obtained from Applied Biosystems. Briefly, reverse transcription was done using Superscript™ First-Strand Synthesis System for RT-PCR (Invitrogen) to generate first-strand cDNA according to the manufacturer's instruction. qRT-PCR was done with SYBR green PCR Master mix (Applied Biosystems) using an ABI 7300 sequence detection instrument (Applied Biosystems). Mouse glyceraldehyde phosphate dehydrogenase (GAPDH) was used as an internal control, and relative transcript abundance was normalized to the amount of GAPDH for the qRT-PCR data by using the relative qPCR study software (Applied Biosystems). The mean fold change was calculated by averaging the triplicate measurements for each gene. The relative fold difference calculation used the 2−ΔΔCT method.
Statistical analysis
Data were analyzed, graphed, and tested by Graph Pad Prism software 5 (GraphPad Software). Statistical significance was defined as P < 0.05 using unpaired t-tests by each time point comparing with naïve. Values for all figures are presented as the mean ± standard error of the mean (SEM).
Supplementary data
Supplementary data for this article is available online at http://glycob.oxfordjournals.org/.
Funding
Authors gratefully receive support from the National Institute of Allergy and Infectious Disease and the National Heart Lung and Blood Institute AI067816 (M.A.A) and HL081064 (V.C.H. and M.A.A). The content is solely the responsibility of the authors and does not necessarily represent the official views of the National Heart, Lung and Blood Institute or the National Institutes of Health.
Abbreviations
AHR, airway hyperresponsiveness; BAL, bronchoalveolar lavage; ECL, enhanced chemiluminescence; ECM, extracellular matrix; EMBP, eosinophil major basic protein; EMBP, eosinophil major basic protein; FACE, fluorophore-assisted carbohydrate electrophoresis; GAPDH, glyceraldehyde phosphate dehydrogenase; H&E, hematoxylin and eosin; HA, hyaluronan; HABP, hyaluronan-binding protein; HAS1, hyaluronan synthase 1; HRP, horseradish peroxidise; HYAL, hyaluronidase; IgE, immunoglobulin E; IgG1, immunoglobulin G 1; OCT, optimal cutting temperature; PBST, 1× PBS, 0.1% Tween-20; PCR, polymerase chain reaction; Th1, T-helper 1.
Supplementary Material
Acknowledgements
The authors would also like to thank Carol de la Motte for generously providing HYAL1 antibody.
References
- Alaniz L, Garcia M, Rizzo M, Piccioni F, Mazzolini G. Altered hyaluronan biosynthesis and cancer progression: an immunological perspective. Mini Rev Med Chem. 2009;9:1538–1546. doi: 10.2174/138955709790361485. [DOI] [PubMed] [Google Scholar]
- Bisset LR, Schmid-Grendelmeier P. Chemokines and their receptors in the pathogenesis of allergic asthma: progress and perspective. Curr Opin Pulm Med. 2005;11:35–42. doi: 10.1097/01.mcp.0000144502.50149.e0. [DOI] [PubMed] [Google Scholar]
- Bosse Y, Pare PD, Seow CY. Airway wall remodeling in asthma: from the epithelial layer to the adventitia. Curr Allergy Asthma Rep. 2008;8:357–366. doi: 10.1007/s11882-008-0056-0. [DOI] [PubMed] [Google Scholar]
- Bousquet J, Chanez P, Lacoste JY, Enander I, Venge P, Peterson C, Ahlstedt S, Michel FB, Godard P. Indirect evidence of bronchial inflammation assessed by titration of inflammatory mediators in BAL fluid of patients with asthma. J Allergy Clin Immunol. 1991;88:649660. doi: 10.1016/0091-6749(91)90159-l. [DOI] [PubMed] [Google Scholar]
- Broide DH. Immunologic and inflammatory mechanisms that drive asthma progression to remodeling. J Allergy Clin Immunol. 2008;121:560–570. doi: 10.1016/j.jaci.2008.01.031. quiz 571-562. [DOI] [PMC free article] [PubMed] [Google Scholar]
- Camenisch TD, Spicer AP, Brehm-Gibson T, Biesterfeldt J, Augustine ML, Calabro A., Jr, Kubalak S, Klewer SE, McDonald JA. Disruption of hyaluronan synthase-2 abrogates normal cardiac morphogenesis and hyaluronan-mediated transformation of epithelium to mesenchyme. J Clin Invest. 2000;106:349–360. doi: 10.1172/JCI10272. [DOI] [PMC free article] [PubMed] [Google Scholar]
- Chiappara G, Gagliardo R, Siena A, Bonsignore MR, Bousquet J, Bonsignore G, Vignola AM. Airway remodelling in the pathogenesis of asthma. Curr Opin Allergy Clin Immunol. 2001;1:85–93. doi: 10.1097/01.all.0000010990.97765.a1. [DOI] [PubMed] [Google Scholar]
- de la Motte CA. Hyaluronan in intestinal homeostasis and inflammation: implications for fibrosis. Am J Physiol Gastrointest Liver Physiol. 2011;301:G945–949. doi: 10.1152/ajpgi.00063.2011. [DOI] [PMC free article] [PubMed] [Google Scholar]
- Doganci A, Sauer K, Karwot R, Finotto S. Pathological role of IL-6 in the experimental allergic bronchial asthma in mice. Clin Rev Allergy Immunol. 2005;28:257–270. doi: 10.1385/CRIAI:28:3:257. [DOI] [PubMed] [Google Scholar]
- Elias JA, Lee CG, Zheng T, Ma B, Homer RJ, Zhu Z. New insights into the pathogenesis of asthma. J Clin Invest. 2003;111:291–297. doi: 10.1172/JCI17748. [DOI] [PMC free article] [PubMed] [Google Scholar]
- Esnault S, Malter JS. Hyaluronic acid or TNF-alpha plus fibronectin triggers granulocyte macrophage-colony-stimulating factor mRNA stabilization in eosinophils yet engages differential intracellular pathways and mRNA binding proteins. J Immunol. 2003;171:67806787. doi: 10.4049/jimmunol.171.12.6780. [DOI] [PubMed] [Google Scholar]
- Fischer JW, Schror K. Regulation of hyaluronan synthesis by vasodilatory prostaglandins. Implications for atherosclerosis. Thromb Haemost. 2007;98:287–295. [PubMed] [Google Scholar]
- Forteza R, Lieb T, Aoki T, Savani RC, Conner GE, Salathe M. Hyaluronan serves a novel role in airway mucosal host defense. FASEB J. 2001;15:2179–2186. doi: 10.1096/fj.01-0036com. [DOI] [PubMed] [Google Scholar]
- Huang J, Olivenstein R, Taha R, Hamid Q, Ludwig M. Enhanced proteoglycan deposition in the airway wall of atopic asthmatics. Am J Respir Crit Care Med. 1999;160:725–729. doi: 10.1164/ajrccm.160.2.9809040. [DOI] [PubMed] [Google Scholar]
- Janson C. The importance of airway remodelling in the natural course of asthma. Clin Respir J, 4 Suppl. 2010;1:28–34. doi: 10.1111/j.1752-699X.2010.00194.x. [DOI] [PubMed] [Google Scholar]
- Jiang D, Liang J, Noble PW. Hyaluronan in tissue injury and repair. Annu Rev Cell Dev Biol. 2007;23:435–461. doi: 10.1146/annurev.cellbio.23.090506.123337. [DOI] [PubMed] [Google Scholar]
- Jiang D, Liang J, Noble PW. Hyaluronan as an immune regulator in human diseases. Physiol Rev. 2011;91:221–264. doi: 10.1152/physrev.00052.2009. [DOI] [PMC free article] [PubMed] [Google Scholar]
- Katoh S, Ishii N, Nobumoto A, Takeshita K, Dai SY, Shinonaga R, Niki T, Nishi N, Tominaga A, Yamauchi A, et al. Galectin-9 inhibits CD44-hyaluronan interaction and suppresses a murine model of allergic asthma. Am J Respir Crit Care Med. 2007;176:27–35. doi: 10.1164/rccm.200608-1243OC. [DOI] [PubMed] [Google Scholar]
- Kessler S, Rho H, West G, Fiocchi C, Drazba J, de la Motte C. Hyaluronan (HA) deposition precedes and promotes leukocyte recruitment in intestinal inflammation. Clin Transl Sci. 2008;1:57–61. doi: 10.1111/j.1752-8062.2008.00025.x. [DOI] [PMC free article] [PubMed] [Google Scholar]
- Kuperman DA, Schleimer RP. Interleukin-4, interleukin-13, signal transducer and activator of transcription factor 6, and allergic asthma. Curr Mol Med. 2008;8:384–392. doi: 10.2174/156652408785161032. [DOI] [PMC free article] [PubMed] [Google Scholar]
- Lauer ME, Erzurum SC, Mukhopadhyay D, Vasanji A, Drazba J, Wang A, Fulop C, Hascall VC. Differentiated murine airway epithelial cells synthesize a leukocyte- adhesive hyaluronan matrix in response to endoplasmic reticulum stress. J Biol Chem. 2008;283:26283–26296. doi: 10.1074/jbc.M803350200. [DOI] [PMC free article] [PubMed] [Google Scholar]
- Lauer ME, Fulop C, Mukhopadhyay D, Comhair S, Erzurum SC, Hascall VC. Airway smooth muscle cells synthesize hyaluronan cable structures independent of inter- alpha-inhibitor heavy chain attachment. J Biol Chem. 2009;284:5313–5323. doi: 10.1074/jbc.M807979200. [DOI] [PMC free article] [PubMed] [Google Scholar]
- Lauer ME, Mukhopadhyay D, Fulop C, de la Motte CA, Majors AK, Hascall VC. Primary murine airway smooth muscle cells exposed to poly(I,C) or tunicamycin synthesize a leukocyte-adhesive hyaluronan matrix. J Biol Chem. 2009;284:5299–5312. doi: 10.1074/jbc.M807965200. [DOI] [PMC free article] [PubMed] [Google Scholar]
- Liang J, Jiang D, Jung Y, Xie T, Ingram J, Church T, Degan S, Leonard M, Kraft M, Noble PW. Role of hyaluronan and hyaluronan-binding proteins in human asthma. J Allergy Clin Immunol. 2011;128:403–411. doi: 10.1016/j.jaci.2011.04.006. e403. [DOI] [PMC free article] [PubMed] [Google Scholar]
- Lindell DM, Berlin AA, Schaller MA, Lukacs NW. B cell antigen presentation promotes Th2 responses and immunopathology during chronic allergic lung disease. PLoS One. 2008;3:pe3129. doi: 10.1371/journal.pone.0003129. [DOI] [PMC free article] [PubMed] [Google Scholar]
- Mack JA, Feldman RJ, Itano N, Kimata K, Lauer M, Hascall VC, Maytin EV. Enhanced inflammation and accelerated wound closure following tetraphorbol ester application or full-thickness wounding in mice lacking hyaluronan synthases Has1 and Has3. J Invest Dermatol. 2012;132:198–207. doi: 10.1038/jid.2011.248. [DOI] [PMC free article] [PubMed] [Google Scholar]
- Monzon ME, Fregien N, Schmid N, Falcon NS, Campos M, Casalino-Matsuda SM, Forteza RM. Reactive oxygen species and hyaluronidase 2 regulate airway epithelial hyaluronan fragmentation. J Biol Chem. 2010;285:26126–26134. doi: 10.1074/jbc.M110.135194. [DOI] [PMC free article] [PubMed] [Google Scholar]
- Monzon ME, Manzanares D, Schmid N, Casalino-Matsuda SM, Forteza RM. Hyaluronidase expression and activity is regulated by pro-inflammatory cytokines in human airway epithelial cells. Am J Respir Cell Mol Biol. 2008;39:289–295. doi: 10.1165/rcmb.2007-0361OC. [DOI] [PMC free article] [PubMed] [Google Scholar]
- Murphy DM, O'Byrne PM. Recent advances in the pathophysiology of asthma. Chest. 2010;137:1417–1426. doi: 10.1378/chest.09-1895. [DOI] [PubMed] [Google Scholar]
- Ohkawara Y, Tamura G, Iwasaki T, Tanaka A, Kikuchi T, Shirato K. Activation and transforming growth factor-beta production in eosinophils by hyaluronan. Am J Respir Cell Mol Biol. 2000;23:444–451. doi: 10.1165/ajrcmb.23.4.3875. [DOI] [PubMed] [Google Scholar]
- Romagnani S. Cytokines and chemoattractants in allergic inflammation. Mol Immunol. 2002;38:881–885. doi: 10.1016/s0161-5890(02)00013-5. [DOI] [PubMed] [Google Scholar]
- Sahu S, Lynn WS. Hyaluronic acid in the pulmonary secretions of patients with asthma. Biochem J. 1978;173:565–568. doi: 10.1042/bj1730565. [DOI] [PMC free article] [PubMed] [Google Scholar]
- Soderberg M, Bjermer L, Hallgren R, Lundgren R. Increased hyaluronan (hyaluronic acid) levels in bronchoalveolar lavage fluid after histamine inhalation. Int Arch Allergy Appl Immunol. 1989;88:373–376. doi: 10.1159/000234719. [DOI] [PubMed] [Google Scholar]
- Souza-Fernandes AB, Pelosi P, Rocco PR. Bench-to-bedside review: the role of glycosaminoglycans in respiratory disease. Crit Care. 2006;10:237. doi: 10.1186/cc5069. [DOI] [PMC free article] [PubMed] [Google Scholar]
- Teder P, Vandivier RW, Jiang D, Liang J, Cohn L, Pure E, Henson PM, Noble PW. Resolution of lung inflammation by CD44. Science. 2002;296:155–158. doi: 10.1126/science.1069659. [DOI] [PubMed] [Google Scholar]
- Tran T, Halayko AJ. Extracellular matrix and airway smooth muscle interactions: a target for modulating airway wall remodelling and hyperresponsiveness? Can J Physiol Pharmacol. 2007;85:666–671. doi: 10.1139/Y07-050. [DOI] [PubMed] [Google Scholar]
- Vaday GG, Lider O. Extracellular matrix moieties, cytokines, and enzymes: dynamic effects on immune cell behavior and inflammation. J Leukoc Biol. 2000;67:149–159. doi: 10.1002/jlb.67.2.149. [DOI] [PubMed] [Google Scholar]
- Venge P. The eosinophil and airway remodelling in asthma. Clin Respir J. 2010;4(Suppl 1):1519. doi: 10.1111/j.1752-699X.2010.00192.x. [DOI] [PubMed] [Google Scholar]
- Warner RL, Lukacs NW, Shapiro SD, Bhagarvathula N, Nerusu KC, Varani J, Johnson KJ. Role of metalloelastase in a model of allergic lung responses induced by cockroach allergen. Am J Pathol. 2004;165:1921–1930. doi: 10.1016/S0002-9440(10)63244-0. [DOI] [PMC free article] [PubMed] [Google Scholar]
- Wilkinson TS, Potter-Perigo S, Tsoi C, Altman LC, Wight TN. Pro- and anti- inflammatory factors cooperate to control hyaluronan synthesis in lung fibroblasts. Am J Respir Cell Mol Biol. 2004;31:92–99. doi: 10.1165/rcmb.2003-0380OC. [DOI] [PubMed] [Google Scholar]
Associated Data
This section collects any data citations, data availability statements, or supplementary materials included in this article.