

Abstract
Segmenting the thyroid gland in head and neck CT images is of vital clinical significance in designing intensity-modulated radiation therapy (IMRT) treatment plans. In this work, we evaluate and compare several multiple-atlas-based methods to segment this structure. Using the most robust method, we generate automatic segmentations for the thyroid gland and study their clinical applicability. The various methods we evaluate range from selecting one single atlas based on one of three similarity measures, to combining the segmentation results obtained with several atlases and weighting their contribution using techniques including a simple majority vote rule, a technique called STAPLE that is widely used in the medical imaging literature, and the similarity between the atlas and the volume to be segmented. We show that the best results are obtained when several atlases are combined and their contributions are weighted with a measure of similarity between each atlas and the volume to be segmented. We also show that with our data set, STAPLE does not always lead to the best results. Automatic segmentations generated by the combination method using the correlation coefficient (CC) between the deformed atlas and the patient volume, which is the most accurate and robust method we evaluated, are presented to a physician as 2D contours and modified to meet clinical requirements. It is shown that about 40% of the contours of the left thyroid and about 42% of the right thyroid can be used directly. An additional 21% on the left and 24% on the right require only minimal modification. The amount and the location of the modifications are qualitatively and quantitatively assessed. We demonstrate that, although challenged by large inter-subject anatomical discrepancy, atlas-based segmentation of the thyroid gland in IMRT CT images is feasible by involving multiple atlases. The results show that a weighted combination of segmentations by atlases using the CC as the similarity measure slightly outperforms standard combination methods, e.g., the majority vote rule and STAPLE, as well as methods selecting one single most similar atlas. Results we have obtained suggest that using our contours as initial contours to be edited has clinical value.
Keywords: atlas-based segmentation, nonrigid registration, head and neck IMRT, thyroid gland
1. Introduction
Intensity modulated radiation therapy (IMRT) requires a precise delineation of structures to be treated and of organs to be spared on the pre-treatment planning CT images. For head and neck cancer IMRT, the thyroid gland is one of the most important organs to be spared. Irradiating the thyroid gland may result in thyroid dysfunction, which is an important clinical complication of radiation treatment that may be manifest as either chronic hypothyroidism requiring long-term daily hormone replacement therapy or, less commonly, the potentially fatal acute thyroid storm clinical syndrome. The reported incidence of thyroid dysfunction in patients undergoing conventional methods of radiation treatment ranges from 6 to 48% in retrospective studies (Bethge et al 2000, Colevas et al 2001, Garcia-Serra et al 2005, Grande et al 1992, Lo Galbo et al 2007, Liening et al 1990, Mercado et al 2001, Nishiyama et al 1996, Tell et al 1997, 2004).
Although most external beam radiation treatment plans require entry or exit beams to pass directly through the thyroid gland to reach the primary tumor region and/or the region of surrounding cervical lymph node regions which are at risk for cancer involvement, damage to the gland still needs to be controlled to avoid severe complications. Since the risk for “collateral damage” to the thyroid gland appears to be related to the volume exposed to radiation (Alterio et al 2007, Grande et al 1992, Tell et al 1997) as well as the overall intensity of radiation passing through the gland (Bhandare et al 2007, Constine et al 1984, Grande et al 1992, Norris et al 2006), precise delineation serves as the basis for constraining the radiation fluence resulting from the inverse treatment planning process.
Developing automatic or semi-automatic methods for the segmentation of the thyroid is important because precise manual delineation of this structure is time-consuming, even for experienced radiation oncologists. Because the thyroid is inhomogeneous, and because it is surrounded by structures that have similar intensity, its segmentation using standard intensity-based methods such as level-set (Sethian 1999) or graph-cut techniques (Boykov et al 2001) is challenging. In the recent past we have used model-based methods to segment the lymph node regions (Chen et al 2010) but the anatomical variability we have observed for the thyroid makes the creation of reliable statistical shape models difficult for this structure. Atlas-based methods have been proposed as an alternative for the segmentation of head and neck structures but not for the thyroid. These methods require the selection or construction of one or multiple atlas images, with the structures of interest delineated precisely on the atlas(es). Image registration is then used to compute the transformations required to propagate the segmentations onto the patient image. Chao et al (2007a) delineated the clinical target volume (CTV), left and right parotid glands, spinal cord, brainstem and optical track using one atlas. The automatically generated contours were modified and then compared with manual delineations. Commowick et al (2008) used an average atlas to segment the mandible, parotid glands, submandibular glands, spinal cord, brainstem, and lymph node regions with good precision (sensitivity and specificity higher than 0.8). However, over-segmentations of lymph node regions were observed, and a limitation of the method was revealed when the patient had large anatomical discrepancy compared with the atlas. To overcome these problems, Commowick et al (2009) proposed a scheme to select the locally most similar images from the set of atlases to construct a piecewise most similar atlas. This reduced the over-segmentation problem, which resulted in an improvement in specificity, but the sensitivity was reduced. Gorthi et al (2009) used a single-atlas-based method to segment the lymph node regions, but the accuracy of the segmentations was limited (average Dice similarity coefficient (DSC) (Dice 1945) <0.5 and average Hausdorff distance (HD) (Huttenlocher et al 1993) >17mm). Han et al (2008) segmented several muscle groups in addition to the same set of structures as those segmented by Chao et al (2007); these did not include the thyroid. The median DSC for five out of seven structures to be spared were 0.8 or above using a method combining segmentations from multiple atlases. It was also shown that the method outperformed the method using the most similar atlas selected based on mutual information (MI) (Wells et al 1996). In the later approach only three out of seven structures reached the 0.8 mark. Both methods had a median DSC above 0.55 for all structures.
Compared with the conventional technique that uses a single atlas, the major advantage of using a multiple-atlas-based approach as we do in this study is its ability to reduce the possibly large discrepancy between a single atlas and the patient image. In general, atlases are registered to the patient image, and the segmentations are propagated from each atlas to the patient image using the transformations obtained. The final segmentation on the patient image is then established through either combining or selecting among these propagated segmentations. Wu et al (2007) proposed to select the single optimal atlas for each region of interest (ROI) based on the measure of local normalized mutual information (NMI) (Studholme et al 1999). Heckermann et al (2006) applied the majority vote rule to fuse segmentations from up to 29 atlases, and found that using about 15 to 20 atlases was sufficient. Further increasing the number of atlases did not improve segmentation accuracy very much. The method was later improved (Heckermann et al 2010) by enhancing the robustness of the nonrigid registration algorithm with an approximate tissue classification at the coarse levels of the multi-resolution implementation. Rohlfing et al (2004a) compared three techniques: selecting the most similar atlas, using an average shape atlas, and using multiple atlases and determining the final segmentation by the majority vote rule. In their study, the last method showed the best performance. Instead of using the majority vote rule, which assigns equal weight to each atlas, Warfield et al (2004) weighted the segmentations through an expectation maximization (EM) algorithm known as the simultaneous truth and performance level estimation (STAPLE) algorithm. This algorithm has been used as a standard technique for combining automatic or manual segmentations from multiple raters. Rohlfing et al (2004b) expanded the original STAPLE algorithm such that it could be used to simultaneously combine labels for multiple classes. Experiments they performed on bee brain confocal microscopy images showed that the proposed method performed better than majority vote. Klein et al (2008) combined segmentations from a set of atlases using both STAPLE and an altered version of the vote rule, which weighted the contribution of each atlas with the value of the NMI between the atlas and the volume to be segmented. In their study, they showed that STAPLE did not perform better than the vote rule. They also found that using multiple atlases outperformed selecting one single optimal atlas. Aljabar et al (2009) studied the effect of increasing the number of atlases that were ranked by the value of the NMI between the registered atlases and the volume to be segmented. This study showed that using 20 atlases from a set of 275 was optimal. Artaechevarria et al (2009) compared strategies for combining segmentations by multiple atlases including STAPLE, majority vote, and weighted voting methods based on global or local similarity between patient and atlas images after affine and nonrigid registrations. The experiment on a set of 18 brain MR images showed that, among the methods that were evaluated, local weighted voting based on measuring similarity in the neighborhood of the structure of interest performed the best. In addition to the typical local weighted voting which assigns the weights only once, Sabuncu et al (2010) proposed an iterative method to optimize the weights through EM. Different from STAPLE, which calculates the weights based only on the segmentations, the method also takes the intensity information of the registered images into consideration. Langerak et al (2010) proposed a selective and iterative method for performance level estimation (SIMPLE) to combine segmentations without EM, and the experimental results on a set of 100 prostate MR volumes showed that SIMPLE outperformed STAPLE in both accuracy (statistically significant improvements on volume-wise similarity with manual segmentations) and computation time (reduction to about 1/4 to 1/3 of STAPLE).
In our experience, inter-subject variations are large in head and neck CT images, especially for the areas near the thyroid gland, where differences can be caused by the existence of tumors, surgical procedures, or simply normal tissue variation. These problems challenge conventional single-atlas-based approaches and may be a very good application for multiple-atlas-based approaches. Because there is no consensus on the best atlas combination method to use, we investigate the use of several approaches involving multiple atlases to segment the thyroid gland in a set of clinical scans. In the study discussed herein, different methods for selecting or combining segmentations were compared. Results obtained with these various methods were evaluated quantitatively and qualitatively. The method that generated the most accurate results was then employed, and its resulting contours were presented to a practicing radiation oncologist. The subsequent amount of contour-editing was then assessed to measure the clinical usefulness of the automatic contouring method.
2. Methods and materials
2.1. Description of data
The 20 CT images used in this study with institution review board (IRB) approval are de-identified images from patients undergoing IMRT treatment for larynx and base of tongue cancers. Sixteen of them show normal anatomy in the area of the thyroid gland. The four remaining ones had a tracheotomy, which involves inserting a plastic tube into the larynx to help breathing. One of these four (patient 11) also had the trachea filled by a large tumor that substantially altered the anatomy around the thyroid gland. These images have a voxel size of approximately 1 mm in the x and y directions and a slice thickness of 3 mm. For all 20 volumes, the thyroid glands were manually delineated by the first author and reviewed by a radiation oncologist (KN). Changes were made carefully to meet the anatomical and clinical requirements (this was done with greater care than what is done for routine clinical cases), and the final manual delineations were saved in the form of contours and binary masks.
2.2. Registration programs
The affine registration program used in this study has been developed in-house. It is a standard algorithm that is intensity-based and uses NMI as the similarity measure (Maes et al 1997). The nonrigid registrations are performed using the adaptive bases algorithm (ABA) (Rohde et al 2003) also developed in-house. This algorithm also uses NMI defined below as the similarity measure,
| (1) |
where H(A) is the marginal entropy of the source image, H(B’) is the marginal entropy of the transformed target image, and H(A, B’) is their joint entropy. This similarity measure is used to optimize a deformation field modeled as a linear combination of radial basis functions with local support,
| (2) |
where Φ is one of Wu’s compactly supported positive radial basis functions (Wu 1995), is a vector of coefficients to be optimized, and N is the number of basis functions. Three major parameters are used in this algorithm: (1) The density of basis functions, which determines the scale of the transformation. Few basis functions with large support lead to transformations that are more global than transformations obtained with many basis functions with small support. (2) One parameter that constrains the difference between the coefficients of the adjacent basis functions, which we call the elasticity parameter. This parameter is used to control the regularity of the transformation. A small value for this parameter leads to transformations that are more regularized than transformations obtained with large values. (3) The range of intensities, which is used to compute the intensity histograms from which the NMI between images is estimated. It is used, for instance, to specify whether the deformations are driven by soft tissue regions or bony structures, or both. The algorithm produces forward (from the source image, i.e., the atlas, to the target image, i.e., the patient image volume) and backward (from the target image to the source image) transformations that are inverses of each other.
2.3. Registration and segmentation procedure
Instead of directly performing registrations between each atlas and the patient image at full resolution, which can be a very time-consuming process given the size of the CT image volumes, we define a common space in which all the volumes are registered with affine and heavily regularized nonrigid transformations. Nonrigid registration can then be obtained in smaller bounding boxes, thus speeding up the calculations. To create this common space we first compute an average volume to which all the other volumes are registered.
2.3.1. Construction of an average image volume
We follow the procedure proposed by Guimond et al (2000) for the construction of the average image volume. In this method, one image in the set of images is selected randomly as the initial target. All the other volumes are then registered affinely to this first target. This compensates for large differences in pose or shape between the volumes. Nonrigid registrations are then computed between each of the affinely registered volume and the initial target, producing forward and backward deformation fields. The images are deformed using the forward fields and the resulting images intensity-averaged. This produces an intensity-average volume. The backward deformation fields are averaged and this average field is used to deform the intensity-average volume. At the end of this step a shape- and intensity-average volume representing the population as a whole has been produced. The process is repeated, taking the current shape- and intensity-average volume as the target, until convergence is reached. In our experience, convergence is typically reached in 3 to 4 iterations. The nonrigid registrations are computed with a parameter setting that is suitable for aligning all classes of tissues (an isotropic density of basis functions at 16 mm per basis function, a moderate value for the elasticity parameter of 0.3, and the entire intensity range was used to compute 32-bin histograms that were used to estimate the entropy of the images). We have observed that because anatomical variations in the region of the thyroid are large, the accurate registration of CT images in this area is difficult. As a consequence, the average volume we obtain is very blurry in this area, which undermines its potential to be used as the atlas. The average volume is thus only used as a common space where all atlas images are globally aligned.
2.3.2. Segmentation of patient images
To segment a new patient image volume, this volume is first registered to the average image volume using affine and nonrigid transformations following the procedure shown in the top row of figure 1. The parameters for the nonrigid registration (an isotropic density of basis functions at 16 mm per basis function, a smaller value for the elasticity parameter of 0.2, and the full intensity range for histogram computation) are set to produce a transformation Tn that is highly regularized. These two registrations result in the alignment of the bony structures and the outside body contours between the patient image and the atlas.
Figure 1.

Flow charts illustrating the registration process. Top panel: Registration of patient image with the average image volume at full scale. Bottom panel: Registration in the bounding box containing the thyroid between the patient image and the atlases.
A bounding box surrounding the thyroid gland is defined on the average image volume and copied onto the patient and atlases. As shown in the bottom row of figure 1, nonrigid registrations are then performed between each atlas and the patient image inside the bounding box using parameters (an isotropic density of basis functions at 6.25 mm per basis function, a moderate value for the elasticity parameter of 0.3, and intensity range to compute the intensity histograms limited to the soft tissue range) permitting more flexible transformations Tnbk’s for aligning the soft tissue regions. With these transformations, segmentations of the thyroid gland are propagated from each atlas to the patient image. These segmentations are then combined using various methods described below.
The first category of approaches proposed to take advantage of multiple segmentations selects the atlas volume that is most similar to the patient image according to some similarity criterion. The criteria we use are similar to those proposed by Rohlfing et al (2004a), i.e., the correlation coefficient (CC) between the volumes after nonrigid registrations, the average magnitude of the deformation field (AVG_df), and the maximum magnitude of the deformation field (MAX_df). The first criterion is a measure of the similarity between the volume to be segmented and the deformed atlas, i.e., it can be viewed as a measure of the registration quality. The other two criteria measure how much “work” the registration algorithm has to do to register the image volumes. It is thus a measure of similarity between volumes before registration. We note that Rohlfing et al (2004a) and Klein et al (2008) used NMI as a measure of similarity after registration. Here we have preferred to use the CC because NMI is the quantity being optimized by our registration algorithm. The CC is defined as follows (Lewis 1995, Fitzpatrick et al 2000):
| (3) |
where is the mean intensity value of the voxels in the source image and is the mean intensity value of the voxels in the transformed target image.
To avoid measurements of CC and deformation fields in irrelevant areas, a region that contains the thyroid gland is created by dilating the union of segmentations propagated from all the atlases using a 3×3×3 structuring element such that only the CC and deformation fields that are close to the thyroid gland are considered in the computation. The atlas with the highest CC is selected as the most similar atlas. In the other two methods the atlas with the lowest average or maximum deformation field magnitude is selected. Segmented structures propagated from this volume are used to segment the patient image.
The second category of approaches uses the entire set of atlases, but their contributions are weighted using the same three similarity measures introduced above. To be used as weights in the combination, the similarity measures are normalized. For CC, the weights are calculated as
| (4) |
where cci is the average CC over the region of interest for the ith atlas, and k is the number of atlases. For AVG_df and MAX_df, the weights are determined as
| (5) |
in which for AVG_df, di is the average deformation field magnitude in the region defined above, while for MAX_df it is the maximum field magnitude in this box. The combined segmentation L is calculated as
| (6) |
where Li is the segmentation produced by the ith atlas and wi is its weight calculated using either Eq. (4) or (5). The segmentation L is then rescaled into the intensity range of [0, 255], and the final segmentation is obtained by thresholding the rescaled image at intensity I > 127 and saving it as a binary image in which 0 is the background and 255 is the structure.
2.4. Running time
The affine and nonrigid registration algorithms used in this study are implemented in C and C++. When segmenting a new patient image, the typical running time on a computer with a 2.93 GHz Intel Xeon quad-core PC with the 64-bit Windows OS and 16 GB of memory is 2 min for the global affine component and 10 min for the global nonrigid component used for registering the image to the average image volume. After the bounding box is defined, each of the k (k=20 for segmentation of new patient with all 20 atlases, and k=19 for leave-one-out experiments) local nonrigid registrations between one atlas and the patient image takes around 1 min, but the process can be parallelized.
3. Results
A leave-one-out strategy is used to compare the various atlas-based segmentation methods introduced above. For each run, one image is eliminated from the set of atlas images, and the segmentations of the thyroid gland are obtained using the remaining 19 volumes. The results are evaluated on the 20th image by comparing the atlas-based and manual segmentations. For each patient the thyroid gland on the left and right sides are segmented separately, because for patients undergoing tracheotomy the thyroid gland is fully transected in the midline to facilitate installation of tracheotomy tube, resulting in two totally separated sections (one left and one right) of the thyroid gland.
For patients with tracheotomy, combining or selecting segmentations propagated from patients with normal anatomy may result in over-segmentation of the thyroid into the area of the air tube. Segmentations for these patients were post-processed by excluding areas with Hounsfield units (HU) > 270 on the corresponding CT images, since the plastic tracheotomy tube in general have intensity of 300 HU and above, while the soft tissues are lower than 250 HU.
The DSC, which is defined as the overlap of two segmentation volumes normalized to their mean volume, is the primary measure used to assess the accuracy of the segmentations. It ranges from zero to one with zero indicating no overlap and one complete agreement. Statistics of DSCs obtained between the automatic and manual segmentation volumes using the various atlas-based methods are summarized in figure 2. In this figure, the range between the minimum and the maximum whiskers show the data range, the bottom and top of the box shows the 25th and 75th percentile, the line in the middle shows the median, and the “+” signs show the outliers. High DSC values indicate high similarity between manual and automatic contours. The left panel shows the results for the left thyroid and the right panel for the right thyroid. For each panel, results obtained when using a single atlas selected with one of the three metrics discussed above (these are labeled CC_max, MAX_df_min, and AVG_df_min) are shown on the three first left columns. The next three columns show results obtained with methods combining segmentations weighted using the three metrics (these are called CC_weighted, MAX_df_weighted, and AVG_df_weighted). The last two columns show the average of all segmentations (avg_all) which is equivalent to the majority vote rule and the results obtained using STAPLE. When calculating the combined segmentation using STAPLE, a bounding box of minimum size containing the dilated union of all propagated segmentations is defined for each thyroid. The method is thus evaluated in regions that are similar to those used for evaluating the other methods. The STAPLE implementation provided by the Computational Radiology Laboratory of Warfield et al (2007) was used, with the stationary priors of the background and thyroid set to 0.9 and 0.1 according to the approximate ratio of each class in the bounding box. The average DSC values for the various approaches are presented in numerical form in table 1. Since the anatomy of patient 11 is substantially different from the anatomy of the other patients due to pathology, the DSCs obtained for this patient are generally much lower than those for other patients. Therefore the average DSCs were also calculated without the results for patient 11 and shown in table 1. Since CC_weighted showed the highest volume DSC among all the eight methods, we statistically compared the DSCs of CC_weighted with all the other seven methods by performing a one sided paired t-test. The p-values that were obtained are shown in table 2.
Figure 2.

Boxplots showing the sample minimum, Q1, Q2, Q3, and the sample maximum of volume DSC’s obtained using the most similar atlas selected by maximum CC (CC_max), minimum MAX_df (MAX_df_min) , and minimum AVG_df (AVG_df_min), the combination of all segmentation weighted by CC (CC_weighted), MAX_df (MAX_df_weighted), AVG_df (AVG_df_weighted), the average of all segmentations (avg_all), and the combination of all segmentations by STAPLE. Left panel: Left thyroids. Right panel: Right thyroids.
Table 1.
The average DSCs for volumes calculated with various methods with and without patient 11.
| CC_ max |
MAX_ df_min |
AVG_ df_min |
CC_w eighted |
MAX_ df_wei ghted |
AVG_ df_wei ghted |
avg_all | STAP LE |
||
|---|---|---|---|---|---|---|---|---|---|
| Left | Avg. | 0.747 | 0.698 | 0.703 | 0.768 | 0.767 | 0.765 | 0.761 | 0.756 |
| Thyroid | Avg. w/o 11 | 0.783 | 0.705 | 0.730 | 0.793 | 0.792 | 0.790 | 0.786 | 0.771 |
| Right | Avg. | 0.737 | 0.726 | 0.719 | 0.784 | 0.783 | 0.781 | 0.779 | 0.765 |
| Thyroid | Avg. w/o 11 | 0.743 | 0.737 | 0.737 | 0.808 | 0.806 | 0.805 | 0.803 | 0.779 |
Table 2.
The p-values for t-tests on DSCs of CC_weighted compared with the other seven methods, with and without DSCs for patient 11. p-values greater than 0.05 are italic, indicating statistical insignificance.
| CC_ max |
MAX_ df_min |
AVG_ df_min |
MAX_ df_wei ghted |
AVG_ df_wei ghted |
avg_all | STAP LE |
||
|---|---|---|---|---|---|---|---|---|
| Left | Avg. | 0.180 | 0.021 | 0.001 | 0.087 | 0.002 | 0.001 | 0.312 |
| Thyroid | Avg. w/o 11 | 0.317 | 0.003 | 0.001 | 0.059 | 0.005 | 0.002 | 0.178 |
| Right | Avg. | 0.061 | 0.002 | 0.002 | 0.026 | 0.004 | 0.005 | 0.215 |
| Thyroid | Avg. w/o 11 | 0.007 | 0.000 | 0.001 | 0.043 | 0.008 | 0.008 | 0.114 |
As shown in table 1, among the three methods we evaluated for selecting the most similar atlas, CC_max has the highest mean DSC. Among the three combination methods we evaluated, CC_weighted has the highest mean DSCs albeit the boxplot shows that the three combination methods perform quite similarly. Although the difference is small, the p-values in table 2 show that the results for CC_weighted are significantly better than those for AVG_df_weighted. The difference between the results obtained with CC_weighted and MAX_df_weighted are statistically insignificant. Comparing DSCs of CC_weighted with CC_max, avg_all, and STAPLE, CC_weighted outperforms avg_all with significant difference, while the difference between CC_weighted and CC_max, as well as the difference between CC_weighted and STAPLE, are statistically insignificant. Note that although STAPLE has the highest median DSC for the left thyroid, as shown in figure 2, its mean DSC is lower than CC_weighted, AVG_df_weighted, MAX_df_weighted, and avg_all because of lower DSCs for cases in the lower range. Based on these results, we selected CC_max as the representative method for the three methods relying on the most similar atlas and CC_weighted as the representative method for the three methods relying on a weighted combination of segmentations along with avg_all and STAPLE that are the two standard methods for combining segmentations. We then analyzed further the performance of these methods. Since in clinical applications structures are delineated as contours on axial slices, and the accuracy of automatic segmentations on axial slices may not be directly reflected by volume-wise comparisons, we refined our analysis of these methods by comparing automatic and manual segmentations on a slice-by-slice basis.
In this analysis, we first calculate the DSC on each image slice. Then we compute the average among all slices for each method and for each patient, thus generating 20 averages for each method. Figure 3 shows the range, the 25th percentile, the 75th percentile, the median, and the outliers for each technique. It can be seen that when compared on a slice-by-slice basis all methods perform comparably on the left thyroid. Although STAPLE has the highest median value, it also has a lower minimum. On the right thyroid the leading methods are CC_weighted and avg_all.
Figure 3.
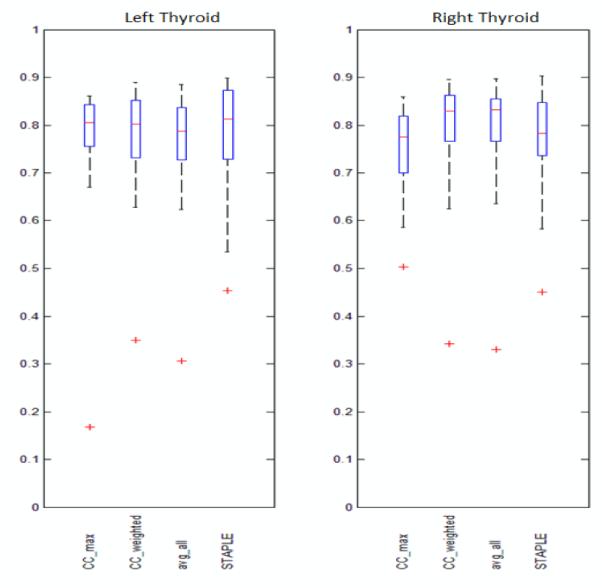
Boxplots showing the sample minimum, Q1, Q2, Q3, and the sample maximum of the averages of slice DSC’s obtained using CC_max, CC_weighted, avg_all, and STAPLE. Left panel: Left thyroids. Right panel: Right thyroids.
The Hausdorff distance (HD) which is defined as
| (7) |
where vA represents voxels belonging to the automatic segmentation, vM represents voxels belonging to the manual segmentation, and ∥·∥ is the Euclidian distance, is also calculated on the 2D slices for these four representative methods. The range, 25th percentile, 75th percentile, median, and the outliers of the averages for each method are shown in figure 4. It can be seen that CC_max, CC_weighted, and avg_all show similar Hausdorff distances which are generally lower than STAPLE on the left side, while on the right side CC_weighted and avg_all are comparable and show more cases toward the lower end of the Hausdorff distance measure than the other two methods.
Figure 4.
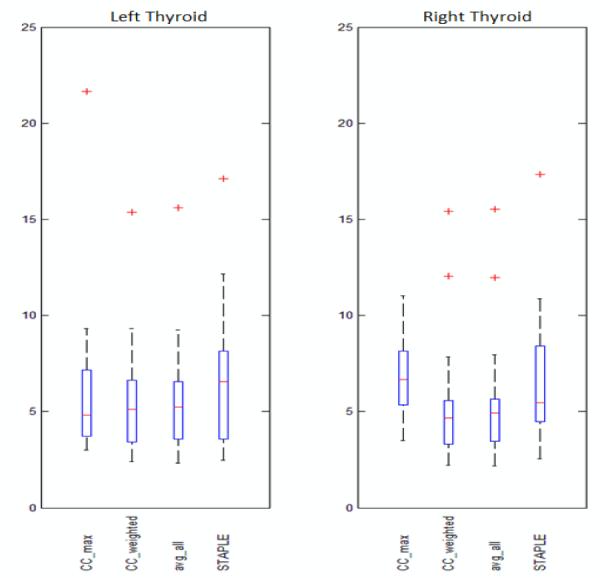
Boxplots showing the sample minimum, Q1, Q2, Q3, and the sample maximum of the averages of Hausdorff distance in mm on 2D slices obtained using CC_max, CC_weighted, avg_all, and STAPLE. Left panel: Left thyroids. Right panel: Right thyroids.
Because a Hausdorff distance of 3 mm on a slice generally indicates that the automatic contour is clinically acceptable, we also counted, for each method, the number of slices on which the contours are at a Hausdorff distance of 3 mm or less from the manual contours. CC_weighted had 108 out of 267 slices on the left side and 122 out of 292 slices on the right side falling in this range. These numbers were 103, 82, and 98 out of 267 on the left side and 119, 51 and 74 out of 292 on the right side for the avg_all, CC_max, and STAPLE methods, respectively. Thus, 41.1% of the contours produced by CC_weighted were in this range when only 39.7%, 23.8%, and 30.8% were in the same range with the avg_all, CC_max, and STAPLE methods, respectively.
The slice-wise comparisons, together with the volume-wise comparison show that CC_weighted and avg_all are more consistent than CC_max and STAPLE which perform more poorly on the right side. CC_weighted is slightly better than avg_all in all comparisons.
Figure 5 shows qualitative results for six representative cases. From top to bottom, segmentation results are shown for the left thyroid obtained on one slice in the data set of patients 3, 8, and 16 using the four representative methods discussed above, as well as results for the right thyroid of patients 3, 5, and 11. It can be observed that for patients with normal anatomy, e.g., the left thyroid of patient 8 and the right thyroid of patient 3 and 5, CC_weighted and avg_all showed more consistent agreement with the manual delineations than CC_max and STAPLE. Using all methods, over-segmentations into the blood vessel are observed for the left thyroid of patient 3, while under-segmentations are seen for the left thyroid of patient 16. A substantial segmentation error is observed for patient 11, in which the anatomy is altered by a large tumor.
Figure 5.

Segmentations obtained using the four representative methods shown in contours with dotted lines compared with the manual segmentation shown in solid lines. For each row, from the left to the right: The original patient image, images with contours obtained using CC_max, CC_weighted, avg_all, and STAPLE compared with the manual contours. Rows from top to bottom: Left thyroids for patients 3, 8, and 16, right thyroids for patients 3, 5, and 11.
To further study the clinical usefulness of the automatically generated contours, we presented the segmentation results of CC_weighted to a physician (KN) and instructed him to modify the contours to make them clinically useable. In this experiment, the contours are shown superimposed to the patient images presented along the axial direction and modified using a tool which removes/adds a part from/to the contour by brushing over the target area. The modified contours, which are denoted CC_weighted_mod, are saved as binary masks and compared with the original automatic segmentations to measure the amount of modifications made by the physician.
Table 3 shows the volume-wise DSC between the original automatic segmentations (CC_weighted) and the modified segmentations (CC_weighted_mod) for all 20 patients. It can be observed that for each side, 13 cases out of the 20 reached a volume-wise DSC of 0.9 or higher. We also compared the 2D axial contours of CC_weighted and the CC_weighted_mod. 112 out of 281 slices (40%) on the left side and 125 out of 297 (42%) on the right side were accepted without modification. For 173 slices on the left side and 196 slices on the right side, the DSC between the automatic and the modified contours was 0.9 or above, indicating that in about 61% of cases on the left side and 66% of cases on the right side, none or minimal changes were made.
Table 3.
The DSCs computed between volumes of CC_weighted and volumes of the modified segmentations CC_weighted_mod for all patients.
| Patient | 1 | 2 | 3 | 4 | 5 | 6 | 7 | 8 | 9 | 10 |
|---|---|---|---|---|---|---|---|---|---|---|
| Left Thyroid | 0.930 | 0.669 | 0.782 | 0.955 | 0.982 | 0.908 | 0.923 | 0.987 | 0.728 | 0.992 |
| Right Thyroid | 0.950 | 0.702 | 0.956 | 0.885 | 0.980 | 0.948 | 0.893 | 0.981 | 0.972 | 0.985 |
|
| ||||||||||
| Patient | 11 | 12 | 13 | 14 | 15 | 16 | 17 | 18 | 19 | 20 |
|
| ||||||||||
| Left Thyroid | 0.202 | 0.926 | 0.764 | 0.946 | 0.982 | 0.787 | 0.876 | 0.983 | 0.936 | 0.980 |
| Right Thyroid | 0.304 | 0.860 | 0.949 | 0.953 | 0.879 | 0.695 | 0.900 | 0.909 | 0.953 | 0.981 |
To illustrate qualitatively the amount and location of modifications made by the physician, we calculated the distance from the surfaces of the modified segmentations to the surfaces of the original automatic segmentations. Colored 3D surfaces of the modified segmentations are shown in figure 6, where the blue color represents zero or small distance, indicating none or minimum modification, while the red color represents large distances, indicating substantial modification. The patients shown are the same as those shown in figure 5. It can be seen that for the left thyroid of patient 8 and the right thyroid of patients 3 and 5, the automatic segmentations received little or none modification for most of the areas, except for several slices on the top and bottom. This is because there is some variability on the extent of the gland along the z-direction delineated on the atlases, which in turn causes disagreements in the combination. Also, large portions of the surface of the left thyroid for patients 3 and 16 and the right thyroid for patient 11 are red, indicating extensive modifications. These are also the cases for which CC_weighted showed inaccurate results when compared with the manual segmentations, as shown in figure 5.
Figure 6.

3D surfaces of the modified segmentations, with blue color representing zero or little distance to the surface of the original automatic segmentation obtained using CC_weighted, and red color representing large distance. Columns from left to right: Left thyroids for patients 3, 8, and 16, and right thyroids for patients 3, 5, and 11. For each column, the top and bottom rows show the same surface viewed from two different angles.
4. Discussion and conclusion
Although the conventional atlas-based segmentation of the thyroid gland in head and neck CT images is challenged by large anatomical differences, we demonstrated that the automatic segmentation of the gland may be achievable by using a multiple-atlas-based approach. We show that combining segmentations obtained from multiple atlases tends to perform better than methods selecting a single most similar atlas, especially for segmenting images that do not show drastic anatomical differences with the majority of the atlases. This is in agreement with the conclusions of the study conducted by Klein et al (2008), in which combining segmentations from atlases with large normalized similarity performed better than selecting the most similar atlas. Among the methods that combine segmentations, the method based on CC showed its stability by staying in the top-ranked methods when evaluated with all three criteria (volume DSC, slice DSC, slice Hausdorff distance). Its overall performance is substantially better than CC_max, which is the method on the lower end of the accuracy scale. It shows comparable performance with STAPLE when evaluated by volume and slice-wise DSCs, and a significantly better performance when evaluated with the Hausdorff distance. When compared with avg_all, the volume DSC shows that CC_weighted performs better than avg_all, and the difference is statistically significant. The slice-wise differences between the two methods with the DSC and the Hausdorff distance are statistically insignificant, but as it is shown in figure 3 and 4, CC_weighted is never outperformed by avg_all. These results suggest that when both methods are available, CC_weighted should be preferred to avg_all. The clinical acceptance of the method was further assessed in the modification study, in which the segmentations generated by CC_weighted were presented to a physician and modified to meet clinical requirements. A comparison between the original and modified automatic segmentations shows that a large portion of segmentations (about 61% of 2D contours on axial slices for the left thyroid, and 66% for the right thyroid) required zero or very little modification, which is an indication of the clinical usefulness of the approach.
Although CC_weighted is shown to be the best method overall in this study, its superiority over other methods is not always significant, which indicates that determining the optimal multiple-atlas-based strategy remains an open problem. This is in line with contradictory results that have been reported in the literature. Indeed, Rohlfing et al (2004b) report that majority vote was outperformed by STAPLE on their data. However, in the study of Artaechevarria et al (2010), STAPLE was shown to lead to results that are substantially worse than those obtained with a series of alternative methods including majority vote. These authors report that voting weighted by local similarity was found to be the most accurate, while the difference between the top two (weighted by local NMI or mean square distance (MSD)) was subtle. Sabuncu et al (2010) indicated that both STAPLE and majority vote were inferior when compared with the three weighted voting methods they used, with the majority vote being the clear worst. The best local weighted voting method using EM improved DSC by only 0.006 or less for most structures compared with a method similar to CC_weighted at the cost of multiplying the CPU time by about 17. On the other hand, Klein et al (2008) did not find STAPLE to be significantly different from the weighted voting method based on NMI, as well as majority vote. While there is converging evidence that multiple-atlas-based strategies lead to better results, there is clearly no agreement on the best way to achieve it. Comparison between methods also remains difficult due to many factors, e.g. image modalities, image quality, size of dataset, registration accuracy, size of the structure of interest, and parameter setting and implementation of standard algorithm (especially STAPLE). It would thus be useful to perform more comprehensive comparative study of all available methods on a series of openly accessible data sets for which a ground truth is known.
Although we have shown the potential clinical usefulness of the approach, i.e., CC_weighted is accurate for most of the 20 patients with normal anatomy included in this study and exemplified by the left side of patient 8 and the right side of patients 3 and 5 shown in figure 5, shortcomings still need to be addressed. We have observed three major categories of problems: First, as shown in figure 5, for the left thyroid of patient 3, over-segmentation into the blood vessel was observed by all automatic methods including CC_weighted. This is mainly because the thyroid gland on the left side of this patient is smaller than those in the atlases. In this patient, the vessel and thyroid together match the size and shape of a left thyroid in a regular volume. The large anatomical discrepancy between this particular patient and the other volumes in our atlases resulted in a systematic false segmentation. A similar problem is also observed on both the left and right sides of patient 2, the left side of patient 13, and the right side of patient 15. Second, anatomical discrepancies can also be caused by structures that are larger than usual, which is the case for patient 16 on the left side. This patient had a thyroid gland that was considerably larger than those in normal patients. Also, the gland extended into the chest cavity, while for a normal patient the gland does not extend lower than the clavicle level. Since none of the atlases could match the gland with similar size and extent, the results showed obvious under-segmentation. Both the left and right sides of patient 7 and patient 17 fall into the same category. Third, pathology is another major cause for anatomical differences, as shown in patient 11. The tumor filling the trachea pushed its surrounding tissues into the area that should normally be occupied by the thyroid, and subsequently caused completely false registrations.
Over-segmentations may be corrected by applying anatomical constraints, i.e. segmenting the falsely included structures individually and removing them from the original automatic segmentation. For the left thyroid of patient 3, an accurate segmentation of the blood vessel may be achievable (Noble et al 2008), and removing the vessel could drastically improve the accuracy of the segmentation of the thyroid. A more general solution to false segmentations caused by anatomical discrepancies in normal patients is to expand the set of atlases. Cases like patient 3 on the left side and patient 16 may benefit from using a subset of atlases with similar anatomy, which could be selected automatically via certain similarity measures. However, false segmentations caused by large anatomical discrepancies in patients with pathology, e.g., large tumors and tissue resections, may not be corrected by expanding the atlas set, since the structural alteration in each patient may be unique. In these cases, models of the tumors or resections may be needed to simulate the deformation, and practically manual delineations may be more suitable than automatic approaches.
Increasing the number of atlases may not only provide the anatomical variability required for segmenting patients with rare anatomy, but also optimize the number of atlases involved in the combination. Aljabar et al (2009) opted to use a fixed number of atlases (20 out of 275) ranked by their similarity to the patient image. This method may be confounded when there are too few atlases that are similar to the volume to segment. In this case, a number of very dissimilar atlases could be selected to reach the preset number of atlases and thus negatively affect the results. Klein et al (2008) also studied the impact of using a subset of atlases which was selected by thresholding their normalized similarity (the NMI of each atlas divided by the maximum NMI in all atlases) and found an optimum threshold value that corresponded to 23 out of 49 atlases in the experiments they performed. The advantage of the method can be limited when most atlases are similar. The SIMPLE approach by Langerak et al (2010) essentially reduced the number of atlases in an iterative process by eliminating the worst performers, i.e., those leading to segmentations that are different from the consensus at the current iteration. Ultimately around 35 atlases out of a set of 99 were used to compute the combined segmentation. The major obstacle to conducting studies with a very large set of atlases is to obtain a ground truth, i.e., volumes in which the thyroid has been segmented with an accuracy that exceeds the accuracy of delineation performed in the clinical setting under time constraints.
Even though automatic segmentations obtained with the CC_weighted combination approach may not be directly applicable for clinical application (i.e. they need to be modified by physicians), this study has shown its potential to reduce delineation efforts compared to a fully manual delineation of the structure. For most cases with normal anatomy the clinician who evaluated the results did not need to make changes for the majority of the contours generated automatically. In this study, modifications have been done by one physician using in-house developed software instead of the clinical radiation oncology planning station. What this study does not yet address is the accuracy of the results compared to intra- and inter-rater variability. In a recent study (Deeley et al 2011) performed with eight raters on twenty volumes, we have shown that a single-atlas-based method performs as well as a human rater for the segmentation of the eyes, optic nerves, optic chiasm, and brainstem. The anatomical variability we have observed in the thyroid led us to explore a multi-atlas procedure. Based on the encouraging results we have obtained with this approach for the thyroid and with a model-based approach for the lymph node regions (Chen et al 2010) we are planning a multi-rater validation study for the thyroid, the lymph node regions, and the parotid. Early results we have obtained with the parotid indicate that a model-based approach as the one we have used for the lymph node regions may be better than a multi-atlas-based approaches as proposed by Ramus et al (2010), Yang et al (2010), or Han et al (2010).
Finally, we note that this work is focused on the segmentation of structures of interest in the planning CT images. Adaptation of these contours to the on-board CT, e.g. Cone Beam CT (CBCT), when these are acquired during the course of therapy is required to take into account change in tumor and normal anatomy (e.g. shrinkage of tumor and body size) that may occur between acquisitions. Techniques have been proposed for this purpose (see for instance studies by Wang et al (2005), Lu et al (2006), Chao et al (2007b), Xie et al (2008), and Lee et al (2008)). The comparison of these techniques with the registration of the planning CT to the CBCT using an intensity-based non-rigid registration method as we have used herein will need to be done.
Acknowledgements
This project is supported, in parts, by NIH Grant R01EB006193 from the National Institute of Biomedical Imaging and Bioengineering. The content is solely the responsibility of the authors and does not necessarily represent the official views of these institutions. We acknowledge Jack H. Noble for providing the software for contour modification. We acknowledge Vanderbilt’s Department of Radiation Oncology for providing the CT images for the study.
References
- Aljabar P, Heckermann RA, Hammers A, Hajnal JV, Rueckert D. Multi-atlas based segmentation of brain images: Atlas selection and its effect on accuracy. NeuroImage. 2009;46:726–38. doi: 10.1016/j.neuroimage.2009.02.018. [DOI] [PubMed] [Google Scholar]
- Alterio D, Jereczek-Fossa BA, Franchi B, et al. Thyroid disorder in patients treated with radiotherapy for head-and-neck cancer: A retrospective analysis of seventy-three patients. Int J Radiat Oncol Biol Phys. 2007;67:144–50. doi: 10.1016/j.ijrobp.2006.08.051. [DOI] [PubMed] [Google Scholar]
- Artaechevarria X, Munoz-Barrutia A, Ortiz-de-Solorzano C. Combination strategies in multi-atlas image segmentation: application to brain MR data. IEEE Trans. on Med. Imag. 2009;28:1266–77. doi: 10.1109/TMI.2009.2014372. [DOI] [PubMed] [Google Scholar]
- Bethge W, Guggenberger D, Bamberg M, et al. Thyroid toxicity of treatment for Hodgkin’s disease. Ann Hematol. 2000;79:114–8. doi: 10.1007/s002770050565. [DOI] [PubMed] [Google Scholar]
- Bhandare N, Kennedy L, Malyapa RS, et al. Primary and central hypothyroidism after radiotherapy for head-and-neck tumors. Int J Radiat Oncol Biol Phys. 2007;68:1131–9. doi: 10.1016/j.ijrobp.2007.01.029. [DOI] [PubMed] [Google Scholar]
- Boykov Y, Veksler O, Zabih R. Fast approximate energy minimization via graph cuts. IEEE Trans. Pattern Anal. Mach. Intell. 2001;29:1222–39. [Google Scholar]
- Chao KS, Bhide S, Chen H, et al. Reduce in variation and improve efficiency of target volume delineation by a computer-assisted system using a deformable image registration approach. Int. J Radiat Oncol Biol Phys. 2007;68:1512–21. doi: 10.1016/j.ijrobp.2007.04.037. [DOI] [PubMed] [Google Scholar]
- Chao M, Li T, Schreibmann E, Koong A, Xing L. Automatic contour mapping with a regional deformable model. Int. J. Radiation Oncology Biol. Phys. 2007;70(2):599–608. doi: 10.1016/j.ijrobp.2007.09.057. [DOI] [PubMed] [Google Scholar]
- Chen A, Deeley MA, Niermann KJ, Moretti L, Dawant BM. Combining registration and active shape models for the automatic segmentation of the lymph node regions in head and neck CT images. Med Phys. 2010;37:6338–46. doi: 10.1118/1.3515459. [DOI] [PMC free article] [PubMed] [Google Scholar]
- Colevas AD, Read R, Thornhill J, et al. Hypothyroidism incidence after multimodality treatment for stage III and IV squamous cell carcinomas of the head and neck. Int J Radiat Oncol Biol Phys. 2001;51:599–604. doi: 10.1016/s0360-3016(01)01688-1. [DOI] [PubMed] [Google Scholar]
- Commowick O, Grégoire V, Malandain G. Atlas-based delineation of lymph node levels in head and neck computed tomography images. Radiother Oncol. 2008;87:281–9. doi: 10.1016/j.radonc.2008.01.018. [DOI] [PubMed] [Google Scholar]
- Commowick O, Warfield SK, Malandain G. Using Frankenstein’s creature paradigm to build a patient specific atlas. Proceedings of the 12th International Conference on Medical Image Computing and Computer Assisted Intervention (MICCAI’09), Part II, Lecture Notes in Computer Science; 2009. pp. 993–1000. [DOI] [PMC free article] [PubMed] [Google Scholar]
- Constine LS, Donaldson SS, McDougall IR, et al. Thyroid dysfunction after radiotherapy in children with Hodgkin’s disease. Cancer. 1984;53:878–83. doi: 10.1002/1097-0142(19840215)53:4<878::aid-cncr2820530411>3.0.co;2-j. [DOI] [PubMed] [Google Scholar]
- Deeley MA, Chen A, Datteri R, et al. Comparison of manual and automatic segmentation methods for brain structures in the presence of space-occupying lesions: a multi-expert study. Phys. Med. Biol. 2011;56:4557–77. doi: 10.1088/0031-9155/56/14/021. [DOI] [PMC free article] [PubMed] [Google Scholar]
- Dice LR. Measures of the amount of ecologic association between species. Ecology. 1945;26(3):297–302. [Google Scholar]
- Fitzpatrick JM, Hill DLG, Maurer CR., Jr. Medical Image Processing and Analysis. Monograph Vol. PM80/SC. SPIE Press; 2000. Chapter 8 Image Registration of the Handbook of Medical Imaging, 2. [Google Scholar]
- Garcia-Serra A, Amdur RJ, Morris CG, et al. Thyroid function should be monitored following radiotherapy to the low neck. Am J Clin Oncol. 2005;28:255–8. doi: 10.1097/01.coc.0000145985.64640.ac. [DOI] [PubMed] [Google Scholar]
- Gorthi S, Duay V, Houhou N, Bach Cuadra M, Schick U, Becker M, Allal AS, Thiran JP. Segmentation of head and neck lymph node regions for radiotherapy planning using active contour-based atlas registration. IEEE Journal of Selected Topics in Signal Processing. 2009;3(1):135–47. [Google Scholar]
- Grande C. Hypothyroidism following radiotherapy for head and neck cancer: Multivariate analysis of risk factors. Radiother Oncol. 1992;25:31–6. doi: 10.1016/0167-8140(92)90192-w. [DOI] [PubMed] [Google Scholar]
- Guimond AD, Meunier J, Thirion JP. Average Brain Models: A Convergence Study. Computer Vision and Image Understanding. 2000;77:197–201. [Google Scholar]
- Han X, Hoogeman M, Levendag P, et al. Atlas-based auto-segmentation of head and neck CT images. 11th Int. Conf. on Medical Image Computing and Computer-Assisted Intervention (MICCAI 2008), Lecture Notes in Computer Science; 2008. pp. 434–41. [DOI] [PubMed] [Google Scholar]
- Han X, Hibbard S, O’Connell P, Willcut V. Automatic segmentation of parotids in head and neck CT images using multi-atlas fusion. proc. MICCAI 2010 Workshop Head & Neck Autosegmentation Challenge.2010. pp. 297–304. [Google Scholar]
- Heckemann R, Hajnal J, Aljabar P, et al. Automatic anatomical brain MRI segmentation combining label propagation and decision fusion. Neuroimage. 2006;33:115–26. doi: 10.1016/j.neuroimage.2006.05.061. [DOI] [PubMed] [Google Scholar]
- Heckemann R, Keihaninejad S, Aljabar P, et al. Improving intersubject image registration using tissue-class information benefits robustness and accuracy of multi-atlas based anatomical segmentation. Neuroimage. 2010;51:221–7. doi: 10.1016/j.neuroimage.2010.01.072. [DOI] [PubMed] [Google Scholar]
- Huttenlocher D, Klanderman D, Rucklige A. Comparing images using the Hausdorff distance. IEEE Trans. Pattern Anal. Mach. Intell. 1993;23(7):850–63. [Google Scholar]
- Klein S, van der Heide UA, Lips IM, van Vulpen M, Staring M, Pluim JP. Automatic segmentation of the prostate in 3D MR images by atlas matching using localized mutual information. Med Phys. 2008;35(4):1407–17. doi: 10.1118/1.2842076. [DOI] [PubMed] [Google Scholar]
- Langerak TR, van der Heide UA, Kotte AN, Viergever MA, van Vulpen M, Pluim JP. Label fusion in atlas-based segmentation using a selective and iterative method for performance level estimation (SIMPLE) IEEE Transactions on Medical Imaging. 2010;29:2000–8. doi: 10.1109/TMI.2010.2057442. [DOI] [PubMed] [Google Scholar]
- Lee C, Langen KM, Lu W, et al. Evaluation of geometric changes of parotid glands during head and neck cancer radiotherapy using daily MVCT and automatic deformable registration. Radiother Oncol. 2008;89:81–8. doi: 10.1016/j.radonc.2008.07.006. [DOI] [PubMed] [Google Scholar]
- Lewis JP. Fast Normalized Cross-Correlation. Vision Interface. 1995.
- Liening DA, Duncan NO, Blakeslee DB, et al. Hypothyroidism following radiotherapy for head and neck cancer. Otolaryngol Head Neck Surg. 1990;103:10–3. doi: 10.1177/019459989010300102. [DOI] [PubMed] [Google Scholar]
- Lo Galbo AM, de Bree R, Kuik DJ, et al. The prevalence of hypothyroidism after treatment for laryngeal and hypopharyngeal carcinomas: Are autoantibodies of influence? Acta Otolaryngol. 2007;127:312–7. doi: 10.1080/00016480600818096. [DOI] [PubMed] [Google Scholar]
- Lu W, Olivera GH, Chen Q, et al. Deformable registration of the planning image (kVCT) and the daily images (MVCT) for adaptive radiation therapy. Phys. Med. Biol. 2006;51:4357–74. doi: 10.1088/0031-9155/51/17/015. [DOI] [PubMed] [Google Scholar]
- Maes F, Collignon A, Suetens P. Multimodality image registration by maximization of mutual information. IEEE Transaction on Medical Imaging. 1997;16(2):187–98. doi: 10.1109/42.563664. [DOI] [PubMed] [Google Scholar]
- Mercado G, Adelstein DJ, Saxton JP, et al. Hypothyroidism: A frequent event after radiotherapy and after radiotherapy with chemotherapy for patients with head and neck carcinoma. Cancer. 2001;92:2892–7. doi: 10.1002/1097-0142(20011201)92:11<2892::aid-cncr10134>3.0.co;2-t. [DOI] [PubMed] [Google Scholar]
- Nishiyama K, Tanaka E, Tarui Y, et al. A prospective analysis of subacute thyroid dysfunction after neck irradiation. Int J Radiat Oncol Biol Phys. 1996;34:439–44. doi: 10.1016/0360-3016(95)02079-9. [DOI] [PubMed] [Google Scholar]
- Noble JH, Warren FM, Labadie RF, Dawant BM. Automatic segmentation of the facial nerve and chorda tympani in CT images using spatially dependent feature values. Med Phys. 2008;35(12):5375–84. doi: 10.1118/1.3005479. [DOI] [PMC free article] [PubMed] [Google Scholar]
- Norris AA, Amdur RJ, Morris CG, et al. Hypothyroidism when the thyroid is included only in the low neck field during head and neck radiotherapy. Am J Clin Oncol. 2006;29:442–5. doi: 10.1097/01.coc.0000217831.23820.85. [DOI] [PubMed] [Google Scholar]
- Ramus L, Malandain G. Multi-atlas based segmentation: application to the head and neck region for radiotherapy planning. proc. MICCAI 2010 Workshop Head & Neck Autosegmentation Challenge.2010. pp. 281–8. [Google Scholar]
- Rohde GK, Aldroubi A, Dawant BM. The adaptive bases algorithm for intensity-based nonrigid image registration. IEEE Trans. on Medical Imaging. 2003;22(11):1470–9. doi: 10.1109/TMI.2003.819299. [DOI] [PubMed] [Google Scholar]
- Rohlfing T, Brandt R, Menzel R, et al. Evaluation of atlas selection strategies for atlas-based image segmentation with application to confocal microscopy images of bee brains. NeuroImage. 2004;21:1428–42. doi: 10.1016/j.neuroimage.2003.11.010. [DOI] [PubMed] [Google Scholar]
- Rohlfing T, Russakoff DB, Maurer CR. Performance-based classifier combination in atlas-based image segmentation using expectation-maximization parameter estimation. IEEE Transactions on Medical Imaging. 2004;23:983–94. doi: 10.1109/TMI.2004.830803. [DOI] [PubMed] [Google Scholar]
- Sabuncu MR, Tomas Yeo BT, van Leemput K, Fischl B, Golland P. A generative model for image segmentation based on label fusion. IEEE Transactions on Medical Imaging. 2010;29:1714–29. doi: 10.1109/TMI.2010.2050897. [DOI] [PMC free article] [PubMed] [Google Scholar]
- Sethian JA. Level set methods and fast marching methods: evolving interfaces in computational geometry, fluid mechanics, computer vision, and materials science. Cambridge University Press; 1999. [Google Scholar]
- Studholme C, Hill DLG, Hawkes DJ. An overlap invariant entropy measure of 3D medical image alignment. Pattern Recognition. 1999;32:71–86. [Google Scholar]
- Tell R, Lundell G, Nilsson B, et al. Long-term incidence of hypothyroidism after radiotherapy in patients with head-andneck cancer. Int J Radiat Oncol Biol Phys. 2004;60:395–400. doi: 10.1016/j.ijrobp.2004.03.020. [DOI] [PubMed] [Google Scholar]
- Tell R, Sjodin H, Lundell G, et al. Hypothyroidism after external radiotherapy for head and neck cancer. Int J Radiat Oncol Biol Phys. 1997;39:303–8. doi: 10.1016/s0360-3016(97)00117-x. [DOI] [PubMed] [Google Scholar]
- Wang H, Dong L, O’Daniel J, et al. Validation of an accelerated ‘demons’ algorithm for deformable image registration in radiation therapy. Phys. Med. Biol. 2005;50:2887–905. doi: 10.1088/0031-9155/50/12/011. [DOI] [PubMed] [Google Scholar]
- Warfield S, et al. 2007 http://crl.med.harvard.edu/software/STAPLE/index.php.
- Warfield S, Zou K, Wells W. Simultaneous truth and performance level estimation (STAPLE): an algorithm for the validation of image segmentation. IEEE Transactions on Medical Imaging. 2004;23:903–21. doi: 10.1109/TMI.2004.828354. [DOI] [PMC free article] [PubMed] [Google Scholar]
- Wells WM, Viola P, Atsumi H, Nakajima S, Kikinis R. Multi-modal volume registration by maximization of mutual information. Med. Image Anal. 1996;1:35–51. doi: 10.1016/s1361-8415(01)80004-9. [DOI] [PubMed] [Google Scholar]
- Wu M, Rosano C, Lopez-Garcia P, et al. Optimum template selection for atlas-based segmentation. NeuroImage. 2007;34:1612–8. doi: 10.1016/j.neuroimage.2006.07.050. [DOI] [PubMed] [Google Scholar]
- Wu Z. Compactly supported positive definite radial functions. Adv. Comput. Math. 1995;4:283–92. [Google Scholar]
- Xie Y, Chao M, Lee P, Xing L. Feature-based rectal contour propagation from planning CT to cone beam CT. Med. Phys. 2008;35:4450–9. doi: 10.1118/1.2975230. [DOI] [PMC free article] [PubMed] [Google Scholar]
- Yang J, Zhang Y, Zhang L, Dong L. Automatic segmentation of parotids from CT scans using multiple atlases. proc. MICCAI 2010 Workshop Head & Neck Autosegmentation Challenge.2010. pp. 323–30. [Google Scholar]