

Abstract
Although the therapeutic potential of mesenchymal stem cells (MSC) is widely accepted, loss of cell function due to donor aging or culture senescence are major limiting factors hampering their clinical application. Our laboratory recently showed that MSC originating from older donors suffer from limited proliferative capacity and significantly reduced myogenic differentiation potential. This is a major concern, as the patients most likely to suffer from cardiovascular disease are elderly. Here we tested the hypothesis that a single pluripotency associated transcription factor, namely Nanog, may reverse the proliferation and differentiation potential of BM-MSC from adult donors. Microarray analysis showed that adult (a)BM-MSC expressing Nanog clustered close to Nanog-expressing neonatal cells. Nanog markedly upregulated genes involved in cell cycle, DNA replication and DNA damage repair and enhanced the proliferation rate and clonogenic capacity of aBM-MSC. Notably, Nanog reversed the myogenic differentiation potential and restored the contractile function of aBM-MSC to a similar level as that of neonatal (n)BM-MSC. The effect of Nanog on contractility was mediated – at least in part - through activation of the TGF-β pathway by diffusible factors secreted in the conditioned medium of Nanog-expressing BM-MSC. Overall, our results suggest that Nanog may be used to overcome the effects of organismal aging on aBM-MSC, thereby increasing the potential of MSC from aged donors for cellular therapy and tissue regeneration.
Keywords: Mesenchymal stem cells, Aging, Nanog, Smooth Muscle, Contractility, Cardiovascular Regeneration
INTRODUCTION
Mesenchymal stem cells (MSCs) provide a promising cell source for tissue regeneration that is already under investigation in several clinical trials1–3. However, previous studies showed that MSC suffer from several drawbacks hampering clinical applications including: (i) decreased number and quality of cells with donor age4–6, and (ii) loss of proliferation and differentiation potential upon expansion in vitro7–9. Previously, we reported our findings on the effects of donor aging on bone marrow-derived smooth muscle cells (BM-SMCs) originating from ovine BM-MSCs10. Using cells from neonatal (n)BM-MSC and adult (a)BM-SMCs we found that aging affected not only proliferation and clonogenic potential but also the myogenic differentiation and contractile properties of aBM-MSC significantly. In addition, culture senescence limits the culture time of aBM-MSC to about 8–10 passages, thereby preventing their expansion to the numbers required for cellular therapies. These observations pose a significant challenge that must be overcome in order to enable cellular therapies for older patients, the population mostly in need for tissue replacement.
Nanog is a homeodomain transcription factor that inhibits differentiation and maintains pluripotency of embryonic stem cells (ESC) along with Oct4 and Sox211, 12. Nanog is expressed in ESC, embryonic germ (EG) and pluripotent cells from pre-implantation and early post-implantation embryos and disappears rapidly upon differentiation13. Nanog overexpression enabled ESCs to maintain pluripotency independent of feeder cells14 or LIF15, while down-regulation of Nanog induced ESC differentiation towards extra-embryonic lineages16. While some studies reported expression of pluripotency-related factors in MSC, the literature lacks consensus on this issue and the function of these factors in the context of adult stem cells has not been determined17–20.
Ectopic expression of Nanog was shown to accelerate the growth of somatic cells such as NIH3T321, 22 and BM-MSCs23, 24. The effects, however, of Nanog on differentiation potential varied depending on the cell type and the differentiation lineage. Forced expression of Nanog had no effect on terminal differentiation of myogenic progenitors into muscle fibers, but significantly impaired their transdifferentiation into the osteogenic lineage25. However, combined expression of Nanog with Oct4 inhibited terminal differentiation of myoblast progenitors26. On the other hand, ectopic expression of Nanog in human BM-MSC enhanced the differentiation potential along the chondrogenic and osteogenic lineages but abated adipogenic differentiation23, 24.
In the present study we examined the hypothesis that ectopic expression of Nanog might restore the function of BM-MSC from older donors. Using BM-MSC from neonatal and adult donors we discovered that Nanog reversed the aging-mediated loss of proliferation and myogenic differentiation potential of aBM-MSC to a similar level as those of nBM-MSC. In addition, we identified a signalling pathway that mediated - at least in part - the effects of Nanog on the contractile function of BM-MSC that were coaxed to differentiate along the myogenic lineage.
MATERIALS AND METHODS
Cultivation of BM-MSCs and lentivirus transduction
Pools of three neonatal (nBM-MSC) and three adult (aBM-MSC) mesenchymal stem cells were prepared. Isolation of individual cell derived from bone marrow of three neonatal lambs (< 3 days old) and three adult sheep (4–4.5 years old) were described previously27. Isolation of human hair follicle derived-MSCs (HF-MSCs) was performed as described previously28. Briefly human scalp of a 73 years old male containing hair follicles was obtained from the Cooperative Human Tissue Network (CHTN, Philadelphia, PA). The sample was washed extensively and subsequently cut into small pieces. To dissociate hair follicles from the surrounding matrix, the samples were treated with 0.5% collagenase Type I (Invitrogen,Carlsbad, CA) for 4 hours at 37°C. Next, single hair follicles were unplugged from the dermis and plated each in a well of a 24 well plate. Hair follicles were cultured in DMEM (Gibco, Grand Island, NY) supplemented with 10%FBS (Gibco). HF-MSCs migrated out of the follicle and were further expanded. Human adult BM-MSCs from two donors (22 years old female and 29 years old male) were obtained from Stem Cell Technologies (Vancouver, Canada). MSCs were cultured in DMEM containing 10% FBS supplemented with 2 ng/mL bFGF (BD Biosciences, Franklin Lakes, NJ). Nanog was expressed from a lentiviral vector, pSIN-EF2-Nanog-Puro (Addgene, Cambrige, MA) under the control of EF1α promoter. The internal ribosome entry site (IRES) was placed right after Nanog to allow expression of puromycin phosphotransferase under the same promoter. For lentivirus production 293T/17 cells (ATCC, Manassas, VA) were co-transfected with the following three plasmids as described recently29: Nanog lentiviral vector, psPAX2-gag/pol/tat/rev, and pMD2.G-VSVG. Neonatal and adult MSCs were transduced with viral supernatant and were selected with 0.5µg/mL puromycin until all non-infected cells were killed.
Proliferation and clonogenic assays
Neonatal and adult BM-MSCs were seeded at 1.0 × 10⁵ cells per well in 6-well plates and cultured in DMEM containing 10% FBS plus bFGF (2 ng/mL). After reaching near confluence, the cells were trypsinized, counted and the doubling time was calculated. Clonogenic assay was previously described in detail28. In short, nBM-MSC and aBM-MSC were seeded (500 cells/dish) in a 100 mm culture dish and cultured for 10–15 days. The cells were then fixed and stained with trypan blue. Each dish was photographed at a constant distance using a gel documentation imaging system (UVP, Upland, CA). Images were analyzed using the NIH software Image J (version 1.43u; National Institutes of Health, Bethesda, MD) to determine the area and effective diameter of each clone.
Senescence-associated-β-galactosidase (SA-β-gal) assay
The SA-β-gal activity was detected using β-Gal Staining Kit (Invitrogen, Carlsbad, CA) according to the manufacturer's recommendations except that citric acid/sodium phosphate buffered-staining solution (pH 6.0) was used as described before30. Cells were photographed using the EVOS phase-contrast microscope (Advanced Microscopy Group, Bothell, WA). SA-β-gal positive cells were counted in 5 randomly selected fields of view to determine the percentage of β-gal+ cells (total of >400 cells were counted).
Immunostaining and Western blots
Immunostaining for αSMA and Calponin was performed as described previously27.
Western blots were performed as described previously31, 32 using antibodies against Nanog (1:1000 in 5% milk, BD Biosciences, San Jose, CA, USA), αSMA (1:1000 in 5% milk, Sigma-Aldrich, St. Louis, MO), Calponin (1:1000 in 5% milk, Santa Cruz Biotechnology, Santa Cruz, CA), p-Smad2 (1:1000 dilution in 5% BSA, Cell Signaling, Danvers, MA), and Smad2 (1:1000 dilution in 5% BSA, Cell Signaling).
Vascular contractility of MSCs on tissue equivalents
Cylindrical vascular tissue equivalents containing MSC in fibrin hydrogels (106 cell/mL) were cultured around a 6.0 mm mandrel of poly(di-methyl siloxane) as described previously33, 34. The medium containing DMEM and 10% FBS supplemented with insulin (2 µg/mL; Sigma-Aldrich), TGF-β1 (2 ng/mL, BioLegend, San Diego, CA), ascorbic acid (300 µM; Sigma-Aldrich) and ε-amino-n-caproic acid (2 mg/mL; Sigma-Aldrich) was changed every two days. After two weeks in culture, the tissue constructs were photographed and the wall thickness and length were measured using ImageJ. Then the tissues were released from the mandrel and mounted on two stainless hooks through the lumen while one side was fixed, and the other side was connected to a force transducer. Each constructs resided in an isolated tissue bath filled with Krebs–Ringer solution. The tissues were continuously bubbled with 94% O2, 6% CO2 to obtain a pH of 7.4, a PCO2 of 38 mmHg, and a PO2 >500 mmHg at 37°C. Tissues were equilibrated at a basal tension of around 1.0 g and constant length for 30–60 min. After equilibration, endothelin-1 (20 nM; Sigma-Aldrich), the thromboxane A2 mimetic U46619 (1 µM; Sigma-Aldrich) or potassium chloride (KCl: 118 mM; Sigma-Aldrich) was added to the tissue bath and isometric contraction was recorded using a PowerLab data acquisition unit and analyzed with Chart5 software (ADInstruments, Colorado Springs, CO, USA). Contractility was normalized by the tissue area applying force and expressed in kPa.
Compaction of fibrin hydrogels
Fibrin gel compaction assay was previously described in detail28. Briefly, BM-MSCs were embedded in fibrin gels (106 cell/mL) that contained fibrinogen (2.5 mg/mL) and thrombin (2.5 U/mL). One hour after polymerization, gels were released from the plate walls and cells were allowed to compact the gels over time. To quantify gel compaction activity, gels were photographed at the indicated times and their area was measured using Image J software.
Total RNA preparation and GeneChip arrays
Total RNA was isolated from three replicates per group. Cells were seeded in 100 mm culture dishes under growth condition (DMEM + 10% FBS + 2 ng/mL bFGF). When they reached confluence total RNA was isolated using the RNeasy kit (Qiagen, Chatsworth, CA). The quality of purified RNA was analyzed on an Agilent Bioanalyzer 2100 (Agilent Technologies, Santa Clara, CA, USA). Intact whole RNA was labeled to obtain biotinylated cRNA for hybridization to Affymetrix GeneChip Bovine Genome Arrays according to the manufacturer’s protocol. This array contains 24,027 probe sets representing approximately 23,000 bovine transcripts and the ovine and bovine genomes have a higher than 90% genetic similarity. Scanned microarray images were imported into GeneChip Command Console Software (AGCC, Affymetrix, Santa Clara, CA) to generate raw signal values for each probe.
Microarray Analysis
Affymetrix Bovine GeneChip data files were processed using the MAS5.0 algorithm (implemented in the affy R library of Bioconductor package) to generate expression summary values for each probe set. MAS5.0 based “present calls” was used to keep the probe sets with “present” status across all three samples in at least one of the four groups for down streaming analysis. We then performed three separate comparisons based on the following samples characteristics: aBM.N vs. aBM.C; nBM.N vs. nBM.C; nBM.C vs. aBM.C. The Limma program in the Bioconductor package was used to calculate the level of differential gene expression. Briefly, a linear model was fit to the data with cell means corresponding to the different conditions and a random effect for array. For each comparison, we obtained the list of differentially expressed genes constrained by P-value < 0.01 and at least 2-fold change. Following single gene-based significance testing, we used the expression value of differentially expressed genes (DEGs) to cluster the samples for each comparison. Hierarchical clustering based on the average linkage of Pearson correlation was used. The list of DEGs was further analyzed for enriched KEGG pathway using the NCBI DAVID server with default setting. The statistical significance was calculated using the Fisher’s exact test in which the null hypothesis is that no difference exists between the number of genes falling into a given pathway in the target DEG list and the genome as a whole.
Quantitative real-time PCR
Total RNA was reverse transcribed using a cDNA synthesis kit (Qiagen) according to the manufacturer’s instructions. Quantitative PCR was performed using the iCycler (Bio-Rad Laboratories, Hercules, CA). The reaction was carried out in a volume of 25 µL containing 1 µL of cDNA, 0.4 µM of each primer (Sigma Genosys, Woodlands, TX) and 12.5 µL of 2X IQ TM SYBR Green Supermix (Bio-Rad Laboratories). The primer sequences for the genes used in this study were listed in Supplementary Table 5. Each reaction comprised of 40 cycles each with melting at 95°C for 10 sec, annealing and extension at 55°C for 30 sec. The fluorescence intensity was recorded during the extension step of each cycle. The specificity of the PCR products was verified using the melting curve generated by MyiQ software and by electrophoresis on 1% agarose gels. The PCR data analysis was performed as described before35. GAPDH served as a loading control.
Statistical analysis
Pair-wise statistical analysis of the data was performed using a two-tailed Student’s t-test using Microsoft Excel software. The data were considered statistically different when p < 0.05. Each experiment was repeated at least three times with triplicate samples each time unless indicated otherwise.
RESULTS
Generation of Nanog-expressing nBM-MSC and aBM-MSC
Previously we demonstrated that BM-MSC-derived SMC from aged donors showed dramatic loss of proliferative and differentiation potential when compared to their neonatal counterparts10. Here we attempted to overcome the aging-induced loss of cellular function by introducing the ESC pluripotency-related transcription factor, Nanog. We hypothesized that the negative effects of donor aging on BM-MSC proliferation and myogenic differentiation may be reversed by ectopic expression of a single pluripotency factor, Nanog. To test this hypothesis, we generated BM-MSCs overexpressing Nanog protein from neonatal (< 3days old) or adult (4–4.5 years old) ovine cells using lentiviral vectors encoding for human Nanog and puromycin phosphotransferase. Control cells were modified with the same construct lacking the Nanog coding sequence. After puromycin selection expression of Nanog protein in nBM-MSC and aBM-MSC was confirmed by western blot analysis (Fig. 1A). In addition, immunostaining showed that Nanog was absent from control cells but was highly expressed and localized exclusively in the nucleus of transduced aBM-MSC and nBM-MSC (Fig. 1B, Fig. S1). However, Nanog expression did not induce expression of other pluripotency factors neither at the mRNA (Fig. 1C) or the protein level (data not shown).
Figure 1. Ectopic expression of Nanog in neonatal and adult BM-MSC.
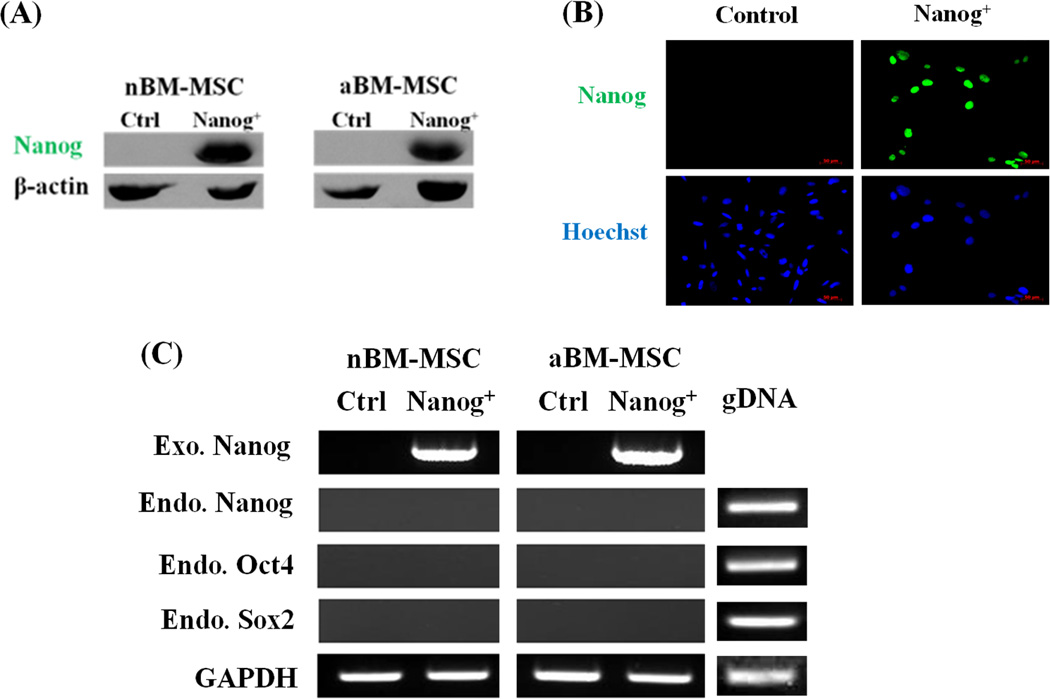
(A) The presence of Nanog in aBM-MSC and nBM-MSC was measured by Western blot; β-actin served as a loading control. (B) Immunostaining showed that Nanog was present in the nucleus of aBM-MSC (green). Cell nuclei were counterstained with Hoechst 33342 (blue). (C) Reverse transcription–polymerase chain reaction (RT–PCR) analysis of endogenous (endo) and exogenous (exo) Nanog as well as endogenous Oct4 or Sox2. Genomic DNA (gDNA) from BM-MSC was used as a positive control template for PCR of endogenous genes; GAPDH served as a loading control.
Nanog-induced changes in the global gene expression profile aBM-MSC and nBM-MSC
Next we employed Affymetrix GeneChip Bovine Genome microarrays to investigate the global molecular effects of Nanog expression on nBM-MSC and aBM-MSC. A total of 12 microarrays representing triplicates of control nBM-MSC (nBM.C), Nanog+ nBM-MSC (nBM.N), control aBM-MSC(aBM.C) or Nanog+ aBM-MSC (aBM.N) were performed. The data was analyzed using the following criteria: (i) a gene was included in the analysis when it was expressed in at least one of the four groups; (ii) a gene was differentially expressed if its expression changed by at least 2-fold (FC ≥ 2) and the change was statistically significant with p-value less than 0.01. Using the first criterion we obtained 11,818 transcripts for downstream analysis (Table S1). Among them, 1,671 transcripts were differentially expressed (p<0.01, FC ≥ 2) in at least one of the following three pairs of conditions: (1) nBM.C vs. aBM.C; (2) aBM.N vs. aBM.C; and (3) nBM.N vs. nBM.C (Table S2). Differentially expressed genes in the first group are likely to be affected by the donor age, while genes in the second and third groups are likely affected by Nanog expression in adult and neonatal cells, respectively.
Comparison between aBM-MSC and nBM-MSC showed that 5.3% of genes might be affected by organismal aging. Specifically, 623 transcripts were differentially expressed (P < 0.01, FC ≥ 2) between neonatal and adult BM-MSC; 243 of them were upregulated and 380 genes were down regulated in nBM-MSC. Nanog expression affected gene expression of aBM-MSC to a larger extent than that of nBM-MSC: 967 genes (8.2%) and 678 genes (5.7%) were affected by Nanog in aBM-MSC and nBM-MSC, respectively. Compared to their corresponding control, 387 genes were up-regulated and 580 genes were down-regulated in aBM.N, while 283 genes were up-regulated and 395 genes were down-regulated in nBM.N.
Hierarchical clustering showed that the Nanog expressing cells, nBM.N and aBM.N were clustered with each other instead of their control counterparts (Fig. 2A). Interestingly, as shown in the Venn diagrams (Fig. 2B) among 132 common DEGs between the first group (Donor age; nBM.C vs. aBM.C) and the second group (Nanog in adult; aBM.N vs. aBM.C), the vast majority (128 out of 132) changed in the same direction for both groups (35 were up- and 93 down-regulated). On the other hand, among 107 DEGs shared between the first and the third group (Nanog in neonate; nBM.N vs. nBM.C), only a small number of genes changed in the same direction (2 up and 11 down-regulated) and the remaining genes were regulated in opposite directions (Table S2). These results suggest that Nanog-induced gene expression changes might have driven aBM-MSC closer to nBM-MSC, thereby supporting the hypothesis that Nanog might have reversed the effects of aging in aBM-MSC.
Figure 2. Gene expression analysis by microarray.

Gene expression profiles of control and Nanog-expressing nBM-MSC and aBM-MSC using Affymetrix GeneChip Bovine Genome Arrays (n=3 each group). A total of 1,670 differentially expressed genes (DEGs) were obtained that were at least 2-fold up-regulated (p<0.01) or 2-fold down-regulated (p<0.01) in at least one of the three groups (aBM.N vs. aBM.C; nBM.N vs. nBM.C; nBM.C vs. aBM.C). (A) Heat map for hierarchical cluster analysis of the total DEGs. Red represents upregulation and green represents downregulation. (B) Venn diagrams for total DEGs or up- or down-regulated DEGs in the three comparisons. (C) KEGG pathway analysis of genes that are differentially regulated upon Nanog expression in aBM-MSC. The numbers in the parentheses denote the number of genes that were up- or down-regulated (up, down) in the corresponding pathway. (D) Verification of microarray results by real-time qRT-PCR for the cell cycle related genes that were differentially expressed upon Nanog overexpression in aBM-MSC. GAPDH served as a loading control. Triplicate independent mRNA samples were used in qRT-PCR experiments.
To identify direct targets of Nanog in BM-MSC we compared the DEGs from our analysis with the list of 1,687 genes whose promoters were found to contain Nanog binding sites in hESC12. Our analysis identified 75 genes in aBM-MSC and 56 genes in nBM-MSC that might be directly affected by Nanog (Table S3). The small number of genes that might be direct targets of Nanog may be caused by the limited accessibility of promoters in somatic vs. embryonic stem cells or potential differences in the regulatory targets of Nanog in ovine vs. human cells.
Pathway analysis
We also performed Pathway Analysis (Fig. 2C) to identify pathways that were significantly enriched with DEGs in each of the three sets that were compared (nBM.C vs. aBM.C, aBM.N vs. aBM.C and nBM.N vs. nBM.C). As shown in Table S4 a few pathways were found to be common between these groups. For example, the chemokine-signaling pathway was significantly changed in nBM-MSC as well as in aBM-MSC upon Nanog expression. Similarly, the PPAR signaling pathway was significantly changed in both nBM-MSC and aBM-MSC upon Nanog expression, in agreement with a previous study, which reported that Nanog inhibited the adipogenic potential of hBM-MSC24.
On the other hand, Nanog affected some pathways differentially in aBM-MSC compared to nBM-MSC. In particular, Nanog induced changes in cell cycle, DNA synthesis/replication and nucleotide mismatch/repair pathways in aBM-MSC and to a lesser extent in nBM-MSC. Only a small subset (4 out of 26) of cell cycle related genes were upregulated by Nanog in neonatal cells (nBM.N vs. nBM.C), possibly because nBM-MSC were proliferating fast even in the absence of Nanog. Instead, in nBM-MSC Nanog upregulated several genes in the TGF-beta and cancer signaling pathways including TGFB1, TGFB2, TGFB3, FGF2, FGF10, VEGFC, HGF and BMP2.
Validation of microarray results with quantitative RT-PCR
Next we performed qRT-PCR to validate the microarray data for a selected set of genes. To this end, we selected DEGs from cell cycle pathways including CCNA2, CDC2, CCNE2, CCNB1, CCNB2, CDKN1C, PCNA, and TP53. The expression level of each gene was normalized to GAPDH and the ratio of aBM.N to aBM.C was compared to the fold change obtained from microarray data. In all cases, qRT-PCR analysis showed similar trend as well as quantitatively similar results with microarray analysis (Fig. 2D).
Nanog increased proliferation in neonatal and adult BM-MSC
Upregulation of cell cycle related genes suggested that Nanog might enhance the proliferation potential of aBM-MSC. Indeed, experiments measuring the clonogenic potential and cell proliferation rate confirmed this hypothesis. To measure clonogenicity cells were seeded at clonal density (500 cells per 100 mm dish) and cultured for 9 days (nBM-MSC) or 18 days (aBM-MSC). Only colonies with diameter larger than 2mm were counted, as these were more likely to have originated from highly proliferative stem cells. Although control neonatal cells showed high colony forming potential, the number of colonies larger than 2mm in diameter was significantly higher in Nanog-expressing cells (Fig. 3A, B). In addition, proliferation assays showed that the doubling time of Nanog-expressing cells was about 12hr shorter than that of control cells (Fig. 3C). Interestingly, Nanog had a more profound effect on aBM-MSC. Specifically, the Nanog-expressing aBM-MSCs formed 4 times more colonies than their control counterparts and the cell density was significantly higher in Nanog+ colonies (Fig. 3A, B). Nanog expression also decreased the doubling time of aBM-MSCs from 70hr to about 50hr (Fig. 3C).
Figure 3. Ectopic expression of Nanog significantly improved clonogenic and proliferative potential in BM-MSC.
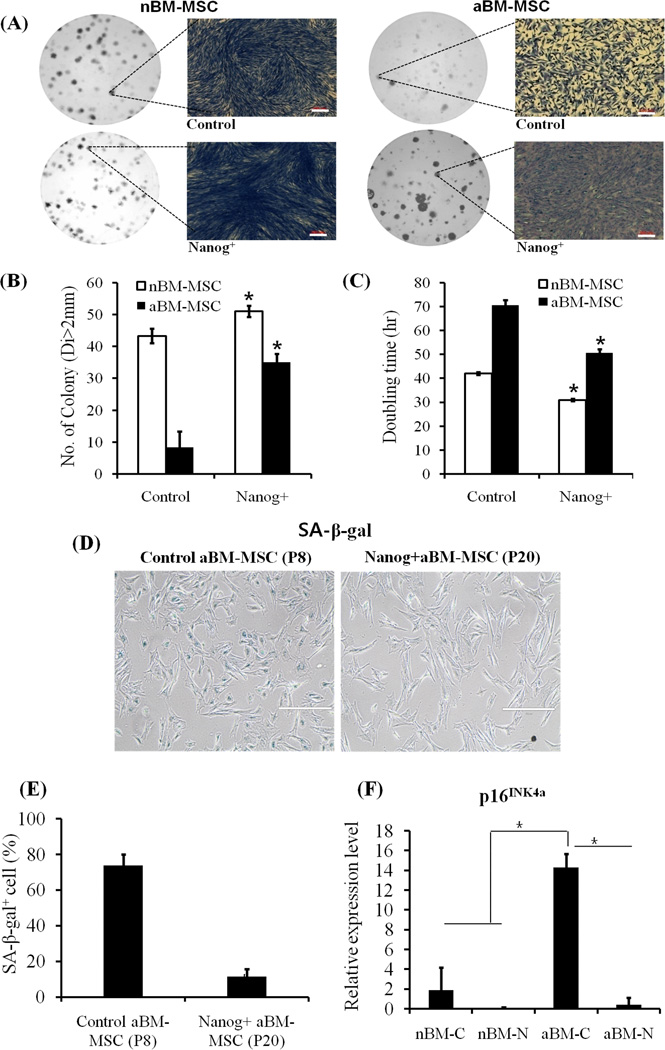
Cells were plated onto 10-cm dishes at clonal density (500 cells/dish) and cultured for 9 days (nBM-MSC, n=3) or 18 days (aBM-MSC, n=3). (A) Photographs of representative cell culture dishes and colonies. Bar=200 µm. (B) The number of colonies larger than 2mm in diameter was quantified for control and Nanog-expressing cells. The symbol (*) denotes p<0.05 between the indicated samples and their corresponding control. (C) To measure proliferation rate cells were seeded at 10,000 cells/cm2. After 6 days (nBM-MSC, n=3) or 9 days (aBM-MSC, n=3) the number of cells was counted and doubling time was calculated assuming exponential cell growth. (D) Representative images of SA-β-gal staining for control aBM-MSC (passage 8) or Nanog+ aBM-MSC (passage 20). Scale bar: 400 µm. (E) Quantitation of the percentage of SA-β-gal positive cells. (*) p<0.05 between the indicated sample and corresponding control. (F) Real-time qRT-PCR for p16INK4a. The results were normalized to GAPDH and plotted as average ± SE (n=3 independent experiments). (*) p<0.05 between the indicated samples.
Notably, serial passaging showed that expression of Nanog delayed culture senescence significantly. Specifically, aBM-MSC stopped dividing after 14 population doublings (estimated after passage 2) while Nanog-expressing aBM-MSC maintained their proliferation potential up to 39 population doublings. Indeed, while more than 70% of passage 8 control aBM-MSC stained positive for SA-β-gal, only 12% of Nanog expressing cells were SA-β-gal positive even at passage 20 (Fig. 3D, E). In addition, a gene that is strongly associated with cellular senescence, the cyclin-dependent kinase inhibitor 2A (CDKN2a) or p16INK4a was highly upregulated (> 7-fold) in aBM-MSC but decreased significantly in Nanog-expressing cells (> 30-fold) (Fig. 3F).
Consistently, the p16INK4a activator MEOX2 was significantly decreased in Nanog-expressing aBM-MSC and nBM-MSC (Fig. S2A), while the p16INK4a inhibitor EZH2 was significantly upregulated by Nanog in aBM-MSC (Fig. S2B). Finally, increased proliferation was not accompanied by chromosomal abnormalities as demonstrated by karyotype analysis showing that both Nanog-expressing nBM-MSC and aBM-MSC possessed 54 diploid chromosomes as expected for normal ovine cells with no signs of transformation (Fig. S3).
Nanog improved myogenic differentiation of aBM-MSC and nBM-MSC
When expressed in MSC, Nanog was found to promote differentiation towards osteogenic and chondrogenic lineages but prevented adipogenesis23–26. However, the effect of Nanog on myogenic differentiation and especially, in the context of organismal aging has not been investigated. To address this question, we first examined the expression of SMC specific markers such as αSMA and calponin after induction of myogenic differentiation for 5 days. Immunostaining showed that both nBM-MSC and aBM-MSC increased expression of both proteins, which also assumed fibrillar organization indicative of contractile SMC (Fig. 4A and B).
Figure 4. Effects of Nanog on myogenic differentiation of BM-MSC.

Control and Nanog expressing (A) nBM-MSC or (B) aBM-MSC were cultured under growth (DMEM/10% FBS, 2ng/mL bFGF) or myogenic differentiation medium (DMEM/10%FBS, 2ng/mL TGF-β1, 30µg/mL heparin). On day 3, the cells were fixed and immunostained for αSMA or calponin (red). Cell nuclei were counterstained with Hoechst 33342 (blue). Scale bar: 100µm. (C, D) Control and Nanog expressing nBM-MSCs or aBM-MSCs were cultured in the presence of TGF-β1 (2 ng/ml) and heparin (30 µg/ml) for 3 days. (C) Western blot for αSMA and calponin. (D) Real-time qRT-PCR for SM22, caldesmon and smoothelin; (*) p<0.05 (n=3).
Next, we compared the expression level of αSMA and calponin between control and Nanog+ BM-MSCs under myogenic differentiation conditions using WB. As shown in Fig. 4C, Nanog did not alter the protein level of αSMA or calponin in neonatal or adult BM-MSCs. We also performed real-time RT-PCR for other smooth muscle contractility-related genes including SM22, smoothelin and caldesmon for which ovine specific antibodies were not available (Fig. 4D). Although the expression levels of SM22 and caldesmon were similar between Nanog-expressing and control nBM-MSCs, SM22 increased slightly but significantly and caldesmon increased by 7.5-fold in Nanog-expressing aBM-MSCs as compared to their control counterparts. On the other hand, smoothelin expression was significantly increased by Nanog expression in both neonatal and adult BM-MSCs. These results prompted us to examine the ability of Nanog-expressing cells to generate force by measuring the compaction of three-dimensional fibrin hydrogels.
To this end, nBM-MSC and aBM-MSC were embedded in fibrin gels (106 cells/mL) and 1hr after polymerization the gels were released from the plate wall and allowed to compact in the presence of TGF-β1 (2ng/mL). At the indicated times the area of each gel was measured using Image J and normalized to its initial area. As shown in Fig. 5 control nBM-MSC showed significant contractility but the rate as well as the final extent of gel compaction was higher in Nanog expressing nBM-MSC (Fig. 5A, B). On the other hand, aBM-MSC showed limited gel compaction activity but similar to nBM-MSC, Nanog enhanced the force generation ability of aBM-MSC significantly. Specifically, Nanog-expressing aBM-MSC compacted gels to half of their original gel size within 50hr when compared to 70hr for control cells (Fig. 5A and B). These data suggested that Nanog enhanced the contractility of nBM-MSC and aBM-MSC that were coaxed to differentiate to SMC.
Figure 5. Nanog increased the ability of BM-MSC to generate force.

BM-MSCs were embedded in fibrin gels, which were allowed to polymerize for 1hr before they were released from the walls and allowed to compact. At the indicated times, the gels were photographed and their area was measured by using Image J software. The ratio of each gel area (A) at the indicated times over its initial area (A0) was plotted as a function of time. (A) Gel compaction profiles of control or Nanog expressing nBM-MSC and aBM-MSC in the presence of TGF-β1 (2ng/mL). (B) Representative gel pictures at the last time point (t = 67hr).
Nanog restored age-related loss of vascular contractility of aBM-MSC
Next, we evaluated the effect of Nanog on vasoreactivity of vascular constructs prepared from nBM-MSC or aBM-MSC. To this end, we prepared cylindrical tissue equivalents by embedding cells in fibrin hydrogels that were polymerized around cylindrical mandrels. After two weeks in culture in myogenic differentiation medium, the cells compacted the hydrogels down to ~5% of their original volume yielding cylindrical constructs with wall thickness of less than 500µm. At that time, vascular rings were placed in isolated tissue baths to measure isometric tension generated in response to receptor or non-receptor-mediated vasoagonists.
Although nBM-MSC based constructs showed high vasoreactivity in response to receptor (Endothelin-1, U46619) or non-receptor (KCl) mediated pathways, Nanog expression increased contractility significantly (Fig. 6A, B). On the other hand, constructs generated with aBM-MSC showed very low level of vascular reactivity. Notably, Nanog enhanced vascular contractility of aBM-MSC by more than 10-fold restoring it to similar level as that of Nanog+ nBM-MSC and higher than control nBM-MSC. There was no statistically significant difference in the response of Nanog+ aBM-MSC (n=10) vs. Nanog+ nBM-MSC (n=11) to any of the three agonists (p=0.8, 0.65 and 0.87 for Endothelin-1, U46619 and KCl, respectively). Collectively, our data show that forced expression of Nanog restored the aging-related loss of vascular function of aBM-MSC to a similar level as that of nBM-MSC.
Figure 6. Nanog increased receptor-dependent and independent contractility of nBM-MSC and aBM-MSC.
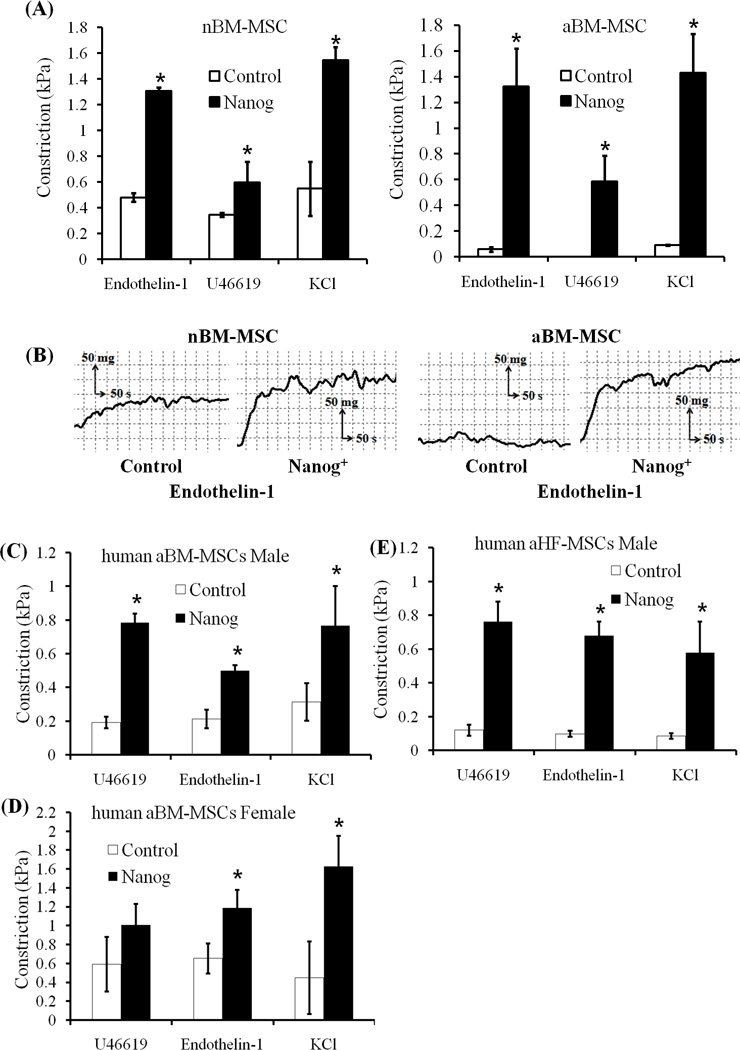
BM-MSCs were embedded in fibrin hydrogels and cultured around 6mm mandrels for two weeks in the presence of myogenic medium (2ng/mL TGF-β1, 2µg/mL insulin, and 300 µM vitamin C). Vascular reactivity was measured using an isolated tissue bath system. (A) Vascular reactivity (kPa) in response to Endothelin-1 (20 nM), U46619 (10−6 M) or KCl (118 mM). (B) Representative graph of isometric contraction of control or Nanog expressing nBM-MSC and aBM-MSC in response to Endothelin-1. (C–E) Vascular reactivity (kPa) of vascular tissue constructs prepared from human MSC. (C) Male aBM-MSC; (D) female aBM-MSC; (E) male aHF-MSCs. All values are the mean±SD of triplicate samples in a representative experiment. (*) p<0.05 between the indicated samples and corresponding control.
Nanog increased vascular contractility of human aMSCs
These results prompted us to hypothesize that Nanog may exert a similar effect on the contractile function of human aMSCs. To this end, we employed MSCs from three donors (two male and one female) and two different anatomic locations i.e. bone marrow and hair follicle (HF-MSCs). Cylindrical tissue equivalents were prepared with Nanog-expressing or control MSCs and the vascular reactivity was measured in response to the same vasoactive agonists. Our results clearly demonstrate that Nanog enhanced the contractility of all MSCs irrespective of gender, anatomic location or species (Fig. 6C–E).
Nanog-induced increase in fibrin compaction was mediated in part through the TGF-β/Smad signaling pathway
Microarray analysis showed that Nanog upregulated expression of TGF-β1 in nBM-MSC and to a lesser extent in aBM-MSC. Real time qRT-PCR verified this result and showed that TGF-β1 expression increased by ~5-fold in nBM-MSC and ~3-fold in aBM-MSC upon Nanog expression (Fig. S4). Since TGF-β1 is known to increase SMC contractility, we examined whether Nanog enhanced contractility through the TGF-β1 pathway. Indeed, Nanog induced Smad2 phosphorylation in both nBM-MSC and aBM-MSC in the absence of exogenous TGF-β1 (Fig. 7A, B), without affecting the expression level of total Smad2 (Fig. S5). In addition, Smad2 phosphorylation was diminished by treatment with the TGF-β type I receptor kinase inhibitor, SB431542, implicating the TGF-β pathway in this process.
Figure 7. Nanog induced gel compaction by activating the TGF-β/Smad signaling pathway.

(A) Cells were incubated in low serum medium (DMEM/2%FBS) and then next day they were treated with TGF-β1 (2ng/mL) or the TGF-β type I receptor inhibitor SB431542 (10µM) for 1 hr. The presence of p-Smad2 in cells was determined by Western blotting; GAPDH served as loading control. (B) The band intensity of p-Smad2 was determined using Image J software and normalized to GAPDH. All values are the mean±SE of three independent experiments (n=3). The symbol (*) denotes p<0.05 between the indicated samples. (C) Control and Nanog expressing neonatal or adult BM-MSCs were cultured in low serum medium (DMEM/2%FBS) and 24hr later the conditioned medium was harvested and filtered. Cells were incubated in low serum medium (DMEM/2%FBS) for 24hr and exposed to conditioned media from control or Nanog+ nBM-MSC or aBM-MSC in the presence or absence of SB431542 (10µM). After 1hr cells were lysed and the presence of p-Smad2 was measured by Western blot; GAPDH served as loading control. (D) Gel compaction assay was performed with conditioned media in the presence or absence of SB431542 (10µM). All values are the mean±SD of triplicate samples in a representative experiment (n=3). The symbol (*) denotes p<0.05 between the indicated samples, n=3.
Further, we examined whether increased Smad2 phosphorylation and contractility might be induced by soluble factors secreted by Nanog-expressing BM-MSC. To this end, we measured Smad2 phosphorylation in control aBM-MSC or nBM-MSC in the presence of medium that was conditioned (conditioned medium, CM) by Nanog+ aBM-MSC (aBM.N-CM) or Nanog+ nBM-MSC (aBM.N-CM). As control we used CM from control nBM-MSC (nBM.C-CM) or aBM-MSC (aBM.C-CM), respectively. As shown in Fig. 7C, both aBM.N-CM and nBM.N-CM induced Smad2 phosphorylation, which was completely abolished by SB431542 treatment. Interestingly, nBM-MSCs exhibited considerable compaction in the presence of nBM.N-CM and to a lesser extent aBM.N-CM but failed to contract fibrin gels in the presence of nBM.C-CM. Similar to Smad2 phosphorylation, the enhanced contractility was diminished by treatment with SB431542. In addition, a TGF-β1 neutralizing antibody inhibited nBM.N-CM-induced pSmad2 and hydrogel compaction partially (Fig. S6). Taken together, these results suggest that Nanog enhanced the myogenic differentiation potential of aBM-MSC and nBM-MSC by inducing expression of TGF-β1 and perhaps also other as yet unidentified factor(s) that activate the TGF-β signaling pathway.
DISCUSSION
Although the therapeutic potential of mesenchymal stem cells (MSC) is widely accepted, loss of cell function due to donor aging or culture senescence are major limiting factors hampering their clinical application. In a recent study we characterized the effects of donor aging on MSCs derived from neonatal or adult bone marrow10 and found that the BM-MSC proliferation and myogenic differentiation potential declined significantly with donor aging. The effects of organismal aging are also compounded by culture senescence limiting the culture time of MSC to about 8–10 passages, thereby preventing their expansion to the large cell numbers required for cellular therapies. This is a major concern, as the patients mostly in need for cellular therapies in general and for vascular grafts in particular are elderly. Here we attempted to address this challenge by ectopic expression of pluripotency-associated factors, Nanog or Oct4, into BM-MSC from neonatal and adult animals.
Some studies showed that MSCs express pluripotency-related factors such as Oct4 and Sox217 or Oct4 and Nanog36 but their expression decreased over time in culture. Nanog and Oct4 expression correlated inversely with organismal aging as human first-trimester fetal MSCs, which expressed Nanog and Oct4, had longer telomeres and grew faster as compared to adult BM-MSCs lacking both factors18. Other groups did not observe endogenous expression of pluripotency factors in MSC but showed that ectopic expression of Nanog, Oct4, or Sox2 increased the proliferation rate and improved osteogenesis and chondrogenesis. Interestingly, while Oct4 promoted Nanog inhibited adipogenesis23, 24. Similarly, our results show that ovine aBM-MSC or nBM-MSC did not express Nanog endogenously but ectopic expression had profound effects on proliferation and myogenic differentiation, especially for aBM-MSC.
Specifically, Nanog expression shortened the doubling time and delayed the senescence of adult MSCs, significantly. Previous studies demonstrated that cell cycle and DNA replication/mitosis genes were significantly reduced in senescent or late passage adult cells37–42. Interestingly, microarray analysis revealed that cell-cycle, DNA replication and DNA repair related genes were highly up-regulated by Nanog in aBM-MSC but not in nBM-MSC, which were already highly proliferative. On the other hand, p16INK4a and the p16INK4a activator MEOX2 (mesenchyme homeobox2, a suppressor of cell proliferation that is involved in senescence43) were significantly decreased in Nanog-expressing aBM-MSC and nBM-MSC. Conversely, the p16INK4a inhibitor EZH2, which was shown to restore proliferation of aged β-cells44 and hematopoietic stem cells45 was significantly upregulated by Nanog in aBM-MSC.
KEGG pathway analysis revealed that Nanog downregulated adipogenic genes such as CEBPα and PPARγ, in agreement with previous work showing that ectopic expression of Nanog suppressed adipogenic differentiation24. Remarkably, several studies reported that aging correlated with decreased MSC capacity for osteogenesis, chondrogenesis and myogenesis and increased propensity for adipogenesis10, 46, 47. Interestingly, the p53 level increased moderately but significantly in aBM-MSC upon Nanog expression. It is generally accepted that increased p53 results in cell cycle arrest through p21 but p53 was also shown to maintain genome stability and prevent oncogenic transformation48. Interestingly, the level of p53/p21 was significantly increased during reprograming leading to reduced efficiency of iPSC generation49, 50. Others reported that p53/p21 expression was considerably decreased in MSCs from old donors38 or late passage cells (>30 passages)37, possibly indicating an increased propensity for generating cancer stem cells. Therefore, the increase in p53 by Nanog might help to sustain genomic stability and prevent oncogenic transformation of BM-MSC.
Cellular senescence has been attributed to - among other factors - deficiencies in DNA damage repair or genome maintenance51–53. DNA damage has been associated with oxidative stress due to endogenous mitochondrial respiration or exogenous stressors such as UV irradiation. Replication-associated DNA damage also leads to replicative exhaustion and decreased proliferative capacity of aged cells53. During DNA synthesis, deficiencies in DNA replication machinery, introduction of errors, or slow base excision repair could increase susceptibility of DNA to recombination, eventually resulting in the onset of replication-arrest51. Besides cell cycle genes, our microarray analysis identified DNA replication, nucleotide (purine and pyrimidine) metabolism, base excision repair and mismatch repair related genes that were up-regulated by Nanog in aBM-MSC. These microarray findings suggest that Nanog expression might delay adult stem cell senescence and sustain the proliferation potential of aBM-MSC by facilitating DNA repair and stabilizing genome integrity.
We also observed that Nanog enhanced differentiation of ovine BM-MSC into SMC as demonstrated by the dramatically increased contractility, especially of aBM-MSC. In addition, we observed that Nanog significantly increased the contractile function of human adult MSCs, independent of anatomic location or gender. Increased myogenic function correlated with higher expression of SMC markers such as SM22, smoothelin, and caldesmon. Interestingly, Nanog-expressing cells exhibited sustained phosphorylation of Smad2 in the absence of exogenous TGF-β1, suggesting that the TGF-β signaling might be sustained through autocrine signals. Indeed, CM from Nanog-expressing cells induced Smad2 phosphorylation, which was inhibited by the TGFβ type I receptor inhibitor, SB431542, supporting this hypothesis. However, ELISA measurements showed only a small increase in the level of TGF-β1 protein in conditioned medium of Nanog cells (data not shown). In addition, TGF-β neutralizing antibody inhibited Smad2 phosphorylation and contractility induced by conditioned medium from Nanog-expressing cells only partially (Fig. S6), suggesting that in addition to TGF-β1 other TGF-β family ligands might also be responsible for increased myogenic function. Alternatively, part of the TGF-β1 activity might not be in soluble form but might be bound to extracellular matrix, which was recently shown to enhance its bioactivity54. Immobilized TGF-β1 might not be detected by ELISA and might not be neutralized by the anti-TGF-β1 antibody, although the TGF-β1 pathway would still be blocked by the TGFβ receptor inhibitor, SB431542. In other experiments, TGF-β1 was required for hydrogel compaction by control but not by Nanog-expressing BM-MSCs. Although addition of exogenous TGF-β1 increased Nanog-induced compaction even further, SB431542 inhibited compaction only partially (Fig. S7), suggesting that Nanog-induced contraction might be mediated by TGF-β1 independent pathways as well. More studies are required to uncover these Nanog-activated pathway(s).
Interestingly, another pluripotency associated transcription factor, Oct4 had different effects on BM-MSC. Although Oct4 also enhanced proliferation and clonogenic capacity of both neonatal and adult BM-MSCs significantly (Fig. S8), it had differential effects on the myogenic differentiation of adult and neonatal cells. Specifically, upon myogenic differentiation Oct4-expressing aBM-MSC exhibited increased vascular contractility albeit to a much lower extent than Nanog-expressing cells. On the other hand, Oct4 significantly decreased contractility of nBM-MSC, suggesting the Oct4 might inhibit differentiation of nBM-MSC into functional SMC. Previous studies showed that Oct4 promoted adipogenesis of human adult BM-MSC24 but failed to enhance osteogenesis23. Taken together these results may indicate that Oct4 and Nanog affect the transcription program of BM-MSC in different ways, despite recent findings showing that in ESC they co-occupy a substantial portion of their target genes and collaborate in regulating pluripotency and differentiation12. Finally, our data may also suggest that the effects of Nanog and Oct4 on BM-MSC depend strongly on donor age, possibly due to differences in target gene accessibility in neonatal vs. adult stem cells.
In summary, the current study demonstrated that Nanog expression enhanced the proliferation and myogenic differentiation potential of nBM-MSC and to a significantly greater extent aBM-MSC, suggesting that Nanog may reverse or prevent aging-induced loss of aBM-MSC function, with no need for reprogramming into a pluripotent state. This in turn may allow for expansion of aBM-MSC to the large cell numbers required for regenerative medicine, thereby facilitating development of cellular therapies for the elderly – the patients mostly in need for tissue replacement.
Supplementary Material
Figure S1: Immunostaining for Nanog in nBM-MSC (green). Cell nuclei were counterstained with Hoechst 33342 (blue).
Table S2: Venn diagram depicting DEG in each of the three group comparisons. Fold changes of up- and down-regulated genes (FC ≥ 2, p<0.05) are highlighted red and green, respectively and p-values of less than 0.05 are highlighted yellow.
A: All DEG in at least one of the three group comparisons
B: Common DEG between nBM.C vs. aBM.C and aBM.N vs. aBM.C groups
C: Common DEG between nBM.C vs. aBM.C and nBM.N vs. nBM.C groups
D: Common DEG among all three groups
Table S3: Estimated list of DEG promoters in nBM-MSC and aBM-MSC with Nanog binding sites.
Table S4: Gene ontology classification of DEG in each of the three group comparisons.
Table S5: Primer sequences used for RT-PCR.
Quantitative RT-PCR for (A) MEOX2 and (B) EZH2. Expression level of the indicated transcripts was normalized to GAPDH. The relative expression level was defined as the ratio of the normalized expression level of each gene in BM-MSCs to that in control nBM-MSCs. Real-time RT-PCR experiment was repeated with RNA from three independent experiments. (*) p< 0.05, n=3.
Figure S3: Karyotype analysis based on DAPI banding (nBM-MSC) or Giemsa banding (aBM-MSC) of Nanog expressing BM-MSC showed 54 diploid chromosomes as expected for normal ovine cells.
Real-time qRT-PCR for TGF-β1. GAPDH served as a loading control. Results from 3 independent experiments were plotted as average±SE. (*) p<0.05, n=3.
(A) Western blotting for total Smad2 in nBM-MSC and aBM-MSC; GAPDH served as loading control. (B) The band intensity of total Smad2 was determined using Image J software and normalized to GAPDH. Results from 3 independent experiments were plotted as average ± SE.
(A) Exogenous TGF-β1 (2ng/ml) was neutralized by different concentrations of anti-TGF-β neutralizing antibody (R&D systems, Minneapolis, MN) as indicated and the level of p-Smad2 in control nBM-MSCs was measured by WB. (B) Gel compaction profile and (C) p-Smad2 level of control nBM-MSCs in the presence of nBM.C-CM or nBM.N-CM with or without TGF-β neutralizing antibody (5µg/mL) as indicated. (*) p<0.05 between the indicated samples and corresponding control at the same time point; (#) p<0.05 between the indicated sample and nBM.N-CM treated sample at the same time point (n=3).
Gel compaction profiles of (A) control BM-MSCs and (B) Nanog+ BM-MSCs with or without TGF-β1 (2 ng/ml). The TGF-β receptor inhibitor SB431542 (10 µM) was added in some samples as indicated.
(A) Number of colonies larger than 2mm in diameter from the clonogenic assay. (B) Doubling time. (C) Vascular reactivity (kPa) of nBM-MSC and aBM-MSC-derived TEVs in response to Endothelin-1 (20 nM), U46619 (10−6 M) or KCl (118 mM). All values are the mean±SE of three independent experiments (n=3). The symbol (*) denotes p<0.05 between the indicated samples and their corresponding controls.
Table S1: Genes expressed in at least one of four cells: aBM.C, aBM.N, nBM.C, or nBM.N. Fold changes of up- and down-regulated genes (FC ≥ 2, p<0.05) are highlighted red and green, respectively and p-values of less than 0.05 are highlighted yellow.
ACKNOWLEDGMENTS
This work was supported by grants from the National Institutes of Health (R01 HL086582) and the New York State Stem Cell Science (NYSTEM Contract #C024316) to S.T. Andreadis.
Footnotes
Author Contributions
Juhee Han: Collection and/or assembly of data; Data analysis and interpretation; Manuscript writing
Panagiotis Mistriotis: Collection and/or assembly of data; Data analysis and interpretation; Manuscript writing
Pedro Lei: Data analysis and interpretation; Manuscript writing
Dan Wang: Statistical analysis of microarray data
Song Liu: Statistical analysis of microarray data
Stelios T. Andreadis: Conception and design; Data analysis and interpretation; Manuscript writing; Final approval of manuscript
References
- 1.Garcia-Gomez I, Elvira G, Zapata AG, et al. Mesenchymal stem cells: biological properties and clinical applications. Expert opinion on biological therapy. 2010;10:1453–1468. doi: 10.1517/14712598.2010.519333. [DOI] [PubMed] [Google Scholar]
- 2.Salem HK, Thiemermann C. Mesenchymal stromal cells: current understanding and clinical status. Stem cells (Dayton, Ohio) 28:585–596. doi: 10.1002/stem.269. [DOI] [PMC free article] [PubMed] [Google Scholar]
- 3.Spencer ND, Gimble JM, Lopez MJ. Mesenchymal stromal cells: past, present, and future. Vet Surg. 40:129–139. doi: 10.1111/j.1532-950X.2010.00776.x. [DOI] [PubMed] [Google Scholar]
- 4.Sethe S, Scutt A, Stolzing A. Aging of mesenchymal stem cells. Ageing research reviews. 2006;5:91–116. doi: 10.1016/j.arr.2005.10.001. [DOI] [PubMed] [Google Scholar]
- 5.Caplan AI. Adult mesenchymal stem cells for tissue engineering versus regenerative medicine. Journal of cellular physiology. 2007;213:341–347. doi: 10.1002/jcp.21200. [DOI] [PubMed] [Google Scholar]
- 6.Han J, Liu JY, Swartz DD, et al. Molecular and functional effects of organismal ageing on smooth muscle cells derived from bone marrow mesenchymal stem cells. Cardiovascular research. 87:147–155. doi: 10.1093/cvr/cvq024. [DOI] [PMC free article] [PubMed] [Google Scholar]
- 7.Banfi A, Muraglia A, Dozin B, et al. Proliferation kinetics and differentiation potential of ex vivo expanded human bone marrow stromal cells: Implications for their use in cell therapy. Experimental hematology. 2000;28:707–715. doi: 10.1016/s0301-472x(00)00160-0. [DOI] [PubMed] [Google Scholar]
- 8.Baxter MA, Wynn RF, Jowitt SN, et al. Study of telomere length reveals rapid aging of human marrow stromal cells following in vitro expansion. Stem cells (Dayton, Ohio) 2004;22:675–682. doi: 10.1634/stemcells.22-5-675. [DOI] [PubMed] [Google Scholar]
- 9.Bonab MM, Alimoghaddam K, Talebian F, et al. Aging of mesenchymal stem cell in vitro. BMC cell biology. 2006;7:14. doi: 10.1186/1471-2121-7-14. [DOI] [PMC free article] [PubMed] [Google Scholar]
- 10.Han J, Liu JY, Swartz DD, et al. Molecular and functional effects of organismal ageing on smooth muscle cells derived from bone marrow mesenchymal stem cells. Cardiovasc Res. 2010;87:147–155. doi: 10.1093/cvr/cvq024. [DOI] [PMC free article] [PubMed] [Google Scholar]
- 11.Do JT, Scholer HR. Regulatory circuits underlying pluripotency and reprogramming. Trends in pharmacological sciences. 2009;30:296–302. doi: 10.1016/j.tips.2009.03.003. [DOI] [PubMed] [Google Scholar]
- 12.Boyer LA, Lee TI, Cole MF, et al. Core transcriptional regulatory circuitry in human embryonic stem cells. Cell. 2005;122:947–956. doi: 10.1016/j.cell.2005.08.020. [DOI] [PMC free article] [PubMed] [Google Scholar]
- 13.Chambers I, Colby D, Robertson M, et al. Functional expression cloning of Nanog, a pluripotency sustaining factor in embryonic stem cells. Cell. 2003;113:643–655. doi: 10.1016/s0092-8674(03)00392-1. [DOI] [PubMed] [Google Scholar]
- 14.Darr H, Mayshar Y, Benvenisty N. Overexpression of NANOG in human ES cells enables feeder-free growth while inducing primitive ectoderm features. Development (Cambridge, England) 2006;133:1193–1201. doi: 10.1242/dev.02286. [DOI] [PubMed] [Google Scholar]
- 15.Mitsui K, Tokuzawa Y, Itoh H, et al. The homeoprotein Nanog is required for maintenance of pluripotency in mouse epiblast and ES cells. Cell. 2003;113:631–642. doi: 10.1016/s0092-8674(03)00393-3. [DOI] [PubMed] [Google Scholar]
- 16.Hyslop L, Stojkovic M, Armstrong L, et al. Downregulation of NANOG induces differentiation of human embryonic stem cells to extraembryonic lineages. Stem cells (Dayton, Ohio) 2005;23:1035–1043. doi: 10.1634/stemcells.2005-0080. [DOI] [PubMed] [Google Scholar]
- 17.Li Z, Liu C, Xie Z, et al. Epigenetic dysregulation in mesenchymal stem cell aging and spontaneous differentiation. PloS one. 2011;6:e20526. doi: 10.1371/journal.pone.0020526. [DOI] [PMC free article] [PubMed] [Google Scholar]
- 18.Guillot PV, Gotherstrom C, Chan J, et al. Human first-trimester fetal MSC express pluripotency markers and grow faster and have longer telomeres than adult MSC. Stem cells (Dayton, Ohio) 2007;25:646–654. doi: 10.1634/stemcells.2006-0208. [DOI] [PubMed] [Google Scholar]
- 19.Pacini S, Carnicelli V, Trombi L, et al. Constitutive expression of pluripotency-associated genes in mesodermal progenitor cells (MPCs) PloS one. 5:e9861. doi: 10.1371/journal.pone.0009861. [DOI] [PMC free article] [PubMed] [Google Scholar]
- 20.Jiang Y, Jahagirdar BN, Reinhardt RL, et al. Pluripotency of mesenchymal stem cells derived from adult marrow. Nature. 2002;418:41–49. doi: 10.1038/nature00870. [DOI] [PubMed] [Google Scholar]
- 21.Zhang J, Wang X, Chen B, et al. Expression of Nanog gene promotes NIH3T3 cell proliferation. Biochemical and biophysical research communications. 2005;338:1098–1102. doi: 10.1016/j.bbrc.2005.10.071. [DOI] [PubMed] [Google Scholar]
- 22.Piestun D, Kochupurakkal BS, Jacob-Hirsch J, et al. Nanog transforms NIH3T3 cells and targets cell-type restricted genes. Biochemical and biophysical research communications. 2006;343:279–285. doi: 10.1016/j.bbrc.2006.02.152. [DOI] [PubMed] [Google Scholar]
- 23.Go MJ, Takenaka C, Ohgushi H. Forced expression of Sox2 or Nanog in human bone marrow derived mesenchymal stem cells maintains their expansion and differentiation capabilities. Experimental cell research. 2008;314:1147–1154. doi: 10.1016/j.yexcr.2007.11.021. [DOI] [PubMed] [Google Scholar]
- 24.Liu TM, Wu YN, Guo XM, et al. Effects of ectopic Nanog and Oct4 overexpression on mesenchymal stem cells. Stem cells and development. 2009;18:1013–1022. doi: 10.1089/scd.2008.0335. [DOI] [PMC free article] [PubMed] [Google Scholar]
- 25.Kochupurakkal BS, Sarig R, Fuchs O, et al. Nanog inhibits the switch of myogenic cells towards the osteogenic lineage. Biochemical and biophysical research communications. 2008;365:846–850. doi: 10.1016/j.bbrc.2007.11.073. [DOI] [PubMed] [Google Scholar]
- 26.Lang KC, Lin IH, Teng HF, et al. Simultaneous overexpression of Oct4 and Nanog abrogates terminal myogenesis. American journal of physiology. 2009;297:C43–C54. doi: 10.1152/ajpcell.00468.2008. [DOI] [PubMed] [Google Scholar]
- 27.Liu JY, Swartz DD, Peng HF, et al. Functional tissue-engineered blood vessels from bone marrow progenitor cells. Cardiovasc Res. 2007;75:618–628. doi: 10.1016/j.cardiores.2007.04.018. [DOI] [PubMed] [Google Scholar]
- 28.Liu JY, Peng HF, Andreadis ST. Contractile smooth muscle cells derived from hair-follicle stem cells. Cardiovasc Res. 2008;79:24–33. doi: 10.1093/cvr/cvn059. [DOI] [PubMed] [Google Scholar]
- 29.Alimperti S, Lei P, Tian J, et al. A novel lentivirus for quantitative assessment of gene knockdown in stem cell differentiation. Gene Ther. 2012 doi: 10.1038/gt.2011.208. Epub ahead of print. [DOI] [PubMed] [Google Scholar]
- 30.Debacq-Chainiaux F, Erusalimsky JD, Campisi J, et al. Protocols to detect senescence-associated beta-galactosidase (SA-betagal) activity, a biomarker of senescent cells in culture and in vivo. Nat Protoc. 2009;4:1798–1806. doi: 10.1038/nprot.2009.191. [DOI] [PubMed] [Google Scholar]
- 31.Singh R, Andreadis ST. EGF receptor activation decreases retroviral gene transfer through protein kinase C-delta. Molecular therapy : the journal of the American Society of Gene Therapy. 2007;15:369–377. doi: 10.1038/sj.mt.6300050. [DOI] [PubMed] [Google Scholar]
- 32.Koria P, Andreadis ST. KGF promotes integrin alpha5 expression through CCAAT/enhancer-binding protein-beta. American journal of physiology. Cell physiology. 2007;293:C1020–C1031. doi: 10.1152/ajpcell.00169.2007. [DOI] [PubMed] [Google Scholar]
- 33.Yao L, Swartz DD, Gugino SF, et al. Fibrin-based tissue-engineered blood vessels: differential effects of biomaterial and culture parameters on mechanical strength and vascular reactivity. Tissue Eng. 2005;11:991–1003. doi: 10.1089/ten.2005.11.991. [DOI] [PubMed] [Google Scholar]
- 34.Swartz DD, Russell JA, Andreadis ST. Engineering of fibrin-based functional and implantable small-diameter blood vessels. Am J Physiol Heart Circ Physiol. 2005;288:H1451–H1460. doi: 10.1152/ajpheart.00479.2004. [DOI] [PubMed] [Google Scholar]
- 35.Koria P, Brazeau D, Kirkwood K, et al. Gene expression profile of tissue engineered skin subjected to acute barrier disruption. The Journal of investigative dermatology. 2003;121:368–382. doi: 10.1046/j.1523-1747.2003.12364.x. [DOI] [PubMed] [Google Scholar]
- 36.Yew TL, Chiu FY, Tsai CC, et al. Knockdown of p21(Cip1/Waf1) enhances proliferation, the expression of stemness markers, and osteogenic potential in human mesenchymal stem cells. Aging cell. 2011;10:349–361. doi: 10.1111/j.1474-9726.2011.00676.x. [DOI] [PubMed] [Google Scholar]
- 37.Izadpanah R, Kaushal D, Kriedt C, et al. Long-term in vitro expansion alters the biology of adult mesenchymal stem cells. Cancer research. 2008;68:4229–4238. doi: 10.1158/0008-5472.CAN-07-5272. [DOI] [PMC free article] [PubMed] [Google Scholar]
- 38.Wilson A, Shehadeh LA, Yu H, et al. Age-related molecular genetic changes of murine bone marrow mesenchymal stem cells. BMC genomics. 2010;11:229. doi: 10.1186/1471-2164-11-229. [DOI] [PMC free article] [PubMed] [Google Scholar]
- 39.Wagner W, Horn P, Castoldi M, et al. Replicative senescence of mesenchymal stem cells: a continuous and organized process. PloS one. 2008;3:e2213. doi: 10.1371/journal.pone.0002213. [DOI] [PMC free article] [PubMed] [Google Scholar]
- 40.Schallmoser K, Bartmann C, Rohde E, et al. Replicative senescence-associated gene expression changes in mesenchymal stromal cells are similar under different culture conditions. Haematologica. 2010;95:867–874. doi: 10.3324/haematol.2009.011692. [DOI] [PMC free article] [PubMed] [Google Scholar]
- 41.Wagner W, Bork S, Horn P, et al. Aging and replicative senescence have related effects on human stem and progenitor cells. PloS one. 2009;4:e5846. doi: 10.1371/journal.pone.0005846. [DOI] [PMC free article] [PubMed] [Google Scholar]
- 42.Hacia JG, Lee CC, Jimenez DF, et al. Age-related gene expression profiles of rhesus monkey bone marrow-derived mesenchymal stem cells. Journal of cellular biochemistry. 2008;103:1198–1210. doi: 10.1002/jcb.21498. [DOI] [PubMed] [Google Scholar]
- 43.Irelan JT, Gutierrez Del Arroyo A, Gutierrez A, et al. A functional screen for regulators of CKDN2A reveals MEOX2 as a transcriptional activator of INK4a. PloS one. 2009;4:e5067. doi: 10.1371/journal.pone.0005067. [DOI] [PMC free article] [PubMed] [Google Scholar]
- 44.Chen H, Gu X, Liu Y, et al. PDGF signalling controls age-dependent proliferation in pancreatic beta-cells. Nature. 2011;478:349–355. doi: 10.1038/nature10502. [DOI] [PMC free article] [PubMed] [Google Scholar]
- 45.De Haan G, Gerrits A. Epigenetic control of hematopoietic stem cell aging the case of Ezh2. Annals of the New York Academy of Sciences. 2007;1106:233–239. doi: 10.1196/annals.1392.008. [DOI] [PubMed] [Google Scholar]
- 46.Moerman EJ, Teng K, Lipschitz DA, et al. Aging activates adipogenic and suppresses osteogenic programs in mesenchymal marrow stroma/stem cells: the role of PPAR-gamma2 transcription factor and TGF-beta/BMP signaling pathways. Aging cell. 2004;3:379–389. doi: 10.1111/j.1474-9728.2004.00127.x. [DOI] [PMC free article] [PubMed] [Google Scholar]
- 47.Zheng H, Martin JA, Duwayri Y, et al. Impact of aging on rat bone marrow-derived stem cell chondrogenesis. The journals of gerontology. 2007;62:136–148. doi: 10.1093/gerona/62.2.136. [DOI] [PubMed] [Google Scholar]
- 48.Edwards MG, Anderson RM, Yuan M, et al. Gene expression profiling of aging reveals activation of a p53-mediated transcriptional program. BMC genomics. 2007;8:80. doi: 10.1186/1471-2164-8-80. [DOI] [PMC free article] [PubMed] [Google Scholar]
- 49.Hong H, Takahashi K, Ichisaka T, et al. Suppression of induced pluripotent stem cell generation by the p53-p21 pathway. Nature. 2009;460:1132–1135. doi: 10.1038/nature08235. [DOI] [PMC free article] [PubMed] [Google Scholar]
- 50.Kawamura T, Suzuki J, Wang YV, et al. Linking the p53 tumour suppressor pathway to somatic cell reprogramming. Nature. 2009;460:1140–1144. doi: 10.1038/nature08311. [DOI] [PMC free article] [PubMed] [Google Scholar]
- 51.Ruzankina Y, Asare A, Brown EJ. Replicative stress, stem cells and aging. Mechanisms of ageing and development. 2008;129:460–466. doi: 10.1016/j.mad.2008.03.009. [DOI] [PMC free article] [PubMed] [Google Scholar]
- 52.Sahin E, Depinho RA. Linking functional decline of telomeres, mitochondria and stem cells during ageing. Nature. 2010;464:520–528. doi: 10.1038/nature08982. [DOI] [PMC free article] [PubMed] [Google Scholar]
- 53.Campisi J. Senescent cells, tumor suppression, and organismal aging: good citizens, bad neighbors. Cell. 2005;120:513–522. doi: 10.1016/j.cell.2005.02.003. [DOI] [PubMed] [Google Scholar]
- 54.Liang MS, Andreadis ST. Engineering fibrin-binding TGF-beta1 for sustained signaling and contractile function of MSC based vascular constructs. Biomaterials. 2011;32:8684–8693. doi: 10.1016/j.biomaterials.2011.07.079. [DOI] [PMC free article] [PubMed] [Google Scholar]
Associated Data
This section collects any data citations, data availability statements, or supplementary materials included in this article.
Supplementary Materials
Figure S1: Immunostaining for Nanog in nBM-MSC (green). Cell nuclei were counterstained with Hoechst 33342 (blue).
Table S2: Venn diagram depicting DEG in each of the three group comparisons. Fold changes of up- and down-regulated genes (FC ≥ 2, p<0.05) are highlighted red and green, respectively and p-values of less than 0.05 are highlighted yellow.
A: All DEG in at least one of the three group comparisons
B: Common DEG between nBM.C vs. aBM.C and aBM.N vs. aBM.C groups
C: Common DEG between nBM.C vs. aBM.C and nBM.N vs. nBM.C groups
D: Common DEG among all three groups
Table S3: Estimated list of DEG promoters in nBM-MSC and aBM-MSC with Nanog binding sites.
Table S4: Gene ontology classification of DEG in each of the three group comparisons.
Table S5: Primer sequences used for RT-PCR.
Quantitative RT-PCR for (A) MEOX2 and (B) EZH2. Expression level of the indicated transcripts was normalized to GAPDH. The relative expression level was defined as the ratio of the normalized expression level of each gene in BM-MSCs to that in control nBM-MSCs. Real-time RT-PCR experiment was repeated with RNA from three independent experiments. (*) p< 0.05, n=3.
Figure S3: Karyotype analysis based on DAPI banding (nBM-MSC) or Giemsa banding (aBM-MSC) of Nanog expressing BM-MSC showed 54 diploid chromosomes as expected for normal ovine cells.
Real-time qRT-PCR for TGF-β1. GAPDH served as a loading control. Results from 3 independent experiments were plotted as average±SE. (*) p<0.05, n=3.
(A) Western blotting for total Smad2 in nBM-MSC and aBM-MSC; GAPDH served as loading control. (B) The band intensity of total Smad2 was determined using Image J software and normalized to GAPDH. Results from 3 independent experiments were plotted as average ± SE.
(A) Exogenous TGF-β1 (2ng/ml) was neutralized by different concentrations of anti-TGF-β neutralizing antibody (R&D systems, Minneapolis, MN) as indicated and the level of p-Smad2 in control nBM-MSCs was measured by WB. (B) Gel compaction profile and (C) p-Smad2 level of control nBM-MSCs in the presence of nBM.C-CM or nBM.N-CM with or without TGF-β neutralizing antibody (5µg/mL) as indicated. (*) p<0.05 between the indicated samples and corresponding control at the same time point; (#) p<0.05 between the indicated sample and nBM.N-CM treated sample at the same time point (n=3).
Gel compaction profiles of (A) control BM-MSCs and (B) Nanog+ BM-MSCs with or without TGF-β1 (2 ng/ml). The TGF-β receptor inhibitor SB431542 (10 µM) was added in some samples as indicated.
(A) Number of colonies larger than 2mm in diameter from the clonogenic assay. (B) Doubling time. (C) Vascular reactivity (kPa) of nBM-MSC and aBM-MSC-derived TEVs in response to Endothelin-1 (20 nM), U46619 (10−6 M) or KCl (118 mM). All values are the mean±SE of three independent experiments (n=3). The symbol (*) denotes p<0.05 between the indicated samples and their corresponding controls.
Table S1: Genes expressed in at least one of four cells: aBM.C, aBM.N, nBM.C, or nBM.N. Fold changes of up- and down-regulated genes (FC ≥ 2, p<0.05) are highlighted red and green, respectively and p-values of less than 0.05 are highlighted yellow.