

Summary
Here we extend the engineering descriptions of simple, single-electron-tunneling chains common in oxidoreductases to quantify sequential oxidation-reduction rates of two-or-more electron cofactors and substrates. We identify when nicotinamides may be vulnerable to radical mediated oxidation-reduction and merge electron-tunneling expressions with the chemical rate expressions of Eyring. The work provides guidelines for the construction of new artificial oxidoreductases inspired by Nature but adopting independent design and redox engineering.
Keywords: Electron tunneling, Hydride transfer, Marcus theory, Protein engineering
1. Introduction
To understand the engineering of oxidoreductases and so gain insight into the proper function and sources of malfunction of natural enzymes, as well as uncover guidelines for the construction of new oxidoreductase designs with desirable novel properties [1], we must consider the role of tunneling. In the natural oxidoreductases of photosynthesis, respiration and metabolism, electrons commonly get from one place to another by tunneling one at a time through the insulating protein medium that separates one redox center from another. These redox centers typically link up to form chains within the enzyme that connect sites for binding diffusible substrates or other redox proteins. Simple electron transfer theory applied to the photosynthetic reactions inspired the development of a practical semi-empirical set of electron tunneling rate expressions that predicted tunneling rates within an order of magnitude [2, 3]. The parameters of these expressions continue to be examined experimentally and theoretically [4-8]. There is considerable debate as to what theoretical descriptions are best or useful, and what level of molecular detail must be understood to appreciate how natural selection has shaped the design of oxidoreductases over the history of evolution. Despite the abundance of models and parameters used to describe intraprotein electron tunneling, and the intriguing suggestions that Nature might have finely tuned atomic level redox protein structure, dynamics and quantum interference effects [4, 5, 9-13], we find that the engineering of single electron transfer reactions can be largely understood in terms of natural selection of just two principle parameters: tunneling distances and driving forces.
We also describe the important interplay between distance and driving force in the design and engineering of natural oxidoreductases when an overall exergonic series of electron transfers includes one or more endergonic (uphill) steps. To some extent the increased height of an uphill step can be compensated for by shrinking the distance between donor and acceptor while still maintaining electron tunneling rates within the approximately millisecond physiologically acceptable threshold. In extended single-electron transfer chains, these uphill tunneling steps may play a regulatory role, so that overall electron transfer through the chain accelerates only after the chain has accumulated a threshold supply of electrons. In oxidoreductases with multi-electron redox cofactors or substrates, such as quinone, flavin, pterin or nicotinamide, oxidation and reduction may take place by sequential single-electron tunneling with a significantly uphill single electron transfer to a radical state. The balance between tunneling distance and uphill driving force sketches an unexpectedly broad engineering choice in distances and driving forces to achieve acceptable nanosecond to milliseconds electron transfer rates.
When electron-tunneling reactions are coupled to subsequent bond breaking/forming catalysis, the tunneling expressions can substitute for the transmission coefficient κe of Eyring's absolute reaction rate expressions using classic transition state theory [14, 15]. We describe how to use the empirical electron tunneling expressions to identify the boundaries where sequential electron-transfer mechanisms become impossibly slow for physiological purposes. When distances are already short and an initial uphill single-electron step is too high, as is often the case for common oxidoreductases using nicotinamides as substrates, a sequential two electron transfer mechanism must yield to proton mediated concerted two-electron, hydride transfer over van der Waals distances or less. The geometric constraints on these reactions and engineering challenges are much more severe so that significant protein mobility can become essential to achieve appropriate geometries. Because the proton is much more massive than an electron, proton tunneling, if it is to have a noticeable effect, must employ much shorter donor/acceptor distances than the natural 4 to 14Å range used for electron tunneling, namely around 1 to 2Å [16, 17].
2. Empirical electron tunneling rate expressions
By virtue of their experimentally facile light activation, photosynthetic reaction centers provided an early and accessible system for the study of electron tunneling in proteins. DeVault and Chance showed that the charge separation reactions of photosynthesis continued at cryogenic temperature and displayed the temperature independence that is a hallmark of electron tunneling [18]. These observations spurred a host of theoretical descriptions, including that of Hopfield [19]. Bacterial reaction centers not only provided access to a range of electron tunneling reactions at different temperatures, but also proved amenable to manipulation of driving force by cofactor replacement and mutagenesis [20, 21]. Hopfield's relatively simple quantum version of driving force dependent Marcus electron transfer theory provided a simple framework that could encompass these observations at different distances, driving forces and temperatures in a single set of semi-empirical expressions [2, 3]. For downhill, exergonic electron tunneling:
| (1) |
The corresponding expression for the reverse, endergonic electron transfer is a factor of ten smaller for every 0.06 eV uphill, maintaining a Boltzmann ratio between forward and reverse rates:
| (2) |
In each of these expressions, the tunneling rate, ket is given in units of s-1, the edge-to-edge distance between redox centers, R, in Å, 3.6 Å being van der Waals contact, the driving force, ΔG, and the reorganization energy, λ, in eV. Both equations express an exponential dependence of electron transfer rate on distance, the principle constraint on natural electron transfer protein design. Almost all productive electron transfer reactions in biology fall within the distance range of 4 to 14 Å (figure 1A) [2, 3], which places these reactions within the approximately millisecond threshold required to support the physiologically relevant catalytic rates found in majority of enzymatic reactions [22, 23]. For exergonic electron tunneling (equation 2), the rate is also exponentially dependent on the uphill driving force, which can easily slow a reaction so that it falls outside the physiological threshold. Distance can partly offset the penalty of uphill driving force. If the electron tunneling takes place at the short end of the distance range, then electron tunneling rates can be faster than milliseconds even when the driving force is several hundred meV uphill. This article explores how these two parameters, distance and driving force, are selected to shape the design of oxidoreductase proteins found in nature.
Figure 1.
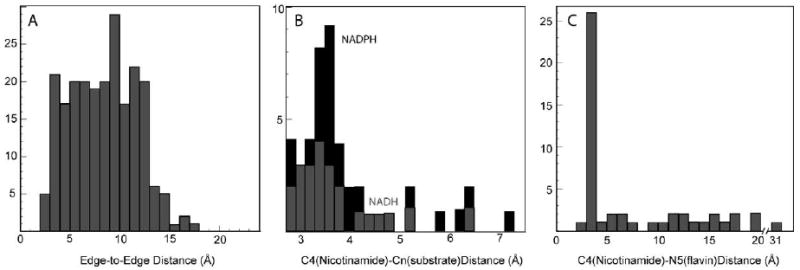
A) Edge-to-edge distances for natural single-electron transfers are nearly evenly distributed over 4 to 14Å B) Short distances dominate separations between NADH/NADPH and substrate. C) In protein crystal structures with both nicotinamide and flavin, most distances are equally short, but some flavins are more remote from the nicotinamide.
These rate expressions are intentionally simple and grounded in empirical observations with the intent of providing insight into the design and operation of a wide spectrum of natural proteins as well as engineering guidelines for the construction of novel electron transfer proteins. Nevertheless, the form of the expressions is related to electron tunneling theory. In our simplification of theory, we follow the advice of Hopfield: “From an experimental point of view, the essential thing about trying to do reasonable science in these [biological] systems is to know what facts to suppress. From the theoretical point of view, it is knowing what theoretical refinements to ignore.” [24] The following sections address the theoretical significance of the parameters and coefficients of equations 1 and 2.
2.1 The importance of proximity
Although it is commonly believed that over many millions of years natural selection will tend to speed and optimize electron transfers within a protein, we find that this is generally not the case. Electron transfer speeds are selected to be merely fast enough. There are many examples of entirely adequate electron transfer chains that do not have the smooth progression of redox midpoint potential that would support the fastest possible individual electron transfer steps. Instead they include a series of up and downhill reactions that are nevertheless faster than the overall turnover of the enzyme because chain elements are placed close enough together [3, 25]. This sort of design provides some robustness against random mutations and protein changes over time. Furthermore, because the electron can tunnel in all directions, and because the barrier to electron tunneling in natural proteins is more or less generic in all directions, the engineering of where a tunneling electron travels is primarily set by which acceptor is closest, provided that the driving force is favorable. Even with unfavorable driving force, if the acceptor is near and the driving force is subsequently favorable for stepwise electron transfer to some other center (i.e. uphill then downhill electron transfer) the tunneling electron can be drawn in this direction. This leads to the real engineering problem of avoiding disadvantageous electron transfer to unwanted acceptors, which diverts the reducing power of the electron, wastes energy in short-circuit reactions, or produces destructive chemically reactive radical states.
It appears that natural proteins deal with these dangers by burying most redox centers sufficiently far inside the electrically insulating protein medium that adventitious electron transfers to unwanted redox partners are distant and slow. This is especially important for clusters of multi-electron centers near catalytic sites, since there are many more potential two-electron reactants in the cell than one-electron reactants, and two-electron transfer can be fast even if the first single electron transfer is uphill. Burial of natural redox centers in insulating protein to keep them away from most substrates helps achieve redox selectivity. However, there are some proteins that by design include clusters of large numbers of redox centers, such as the periplasmic proteins that include 16 or more c type hemes [26]. We expect that these proteins can promiscuously catalyze the oxidation or reduction of a large range of reactants that can approach within an ∼10Å range of these centers. Perhaps these designs are tolerated in the periplasmic space, where unspecific electron transfer is less of a danger than in the interior of the cell.
The Qo quinone oxidation site of Complex III in respiration represents a special distance engineering challenge in that productive energy conservation requires the two electrons of the quinone to be delivered to two different and diverging redox chains. The nearest elements of the two chains must be close enough to the quinone substrate to allow sub-millisecond electron tunneling, but far enough apart to avoid direct short circuit electron transfer from the low to high potential chain. Natural selection has found a solution by placing the nearest components of the two chains about 23Å from one another, which slows the innate short-circuit time to many seconds. When the reduced quinone substrate arrives at the site nearly in line between these two centers, and binds in such a way that proton transfer can be appropriately managed, then two smaller electron-transfer gaps of less than ∼10Å are created. Electron transfer at these smaller distances can proceed faster than the millisecond physiological turnover window. Yet more engineering seems to be required, however, to avoid short-circuits that involves unproductive electron transfer that exploits a semiquinone intermediate state in between the two chains. It appears to be by design that the semiquinone at Qo exists at unusually low levels due to the protein environment conferring an unusually small quinone stability constant [27].
2.2. Meaning of distance “R”
Distance between redox cofactors is clearly the most important parameter that sets the order of magnitude for the rate of electron tunneling in proteins. There are two popular means to measure this distance: edge-to-edge or center-to-center. For redox centers containing metals, where the bulk of the change in electron density upon oxidation/reduction is frequently concentrated at the metal, the center-to-center distance may be the same as the metal-to-metal distance. For metal-free cofactors the edge can be estimated in terms of the volume that includes the large majority of the wave function associated with the tunneling electron. Beyond this perimeter, the wave function tails off roughly exponentially and of course forms the basis for the overall exponential decrease in electron tunneling rate with distance seen, for example, in Figure 2.
Figure 2.
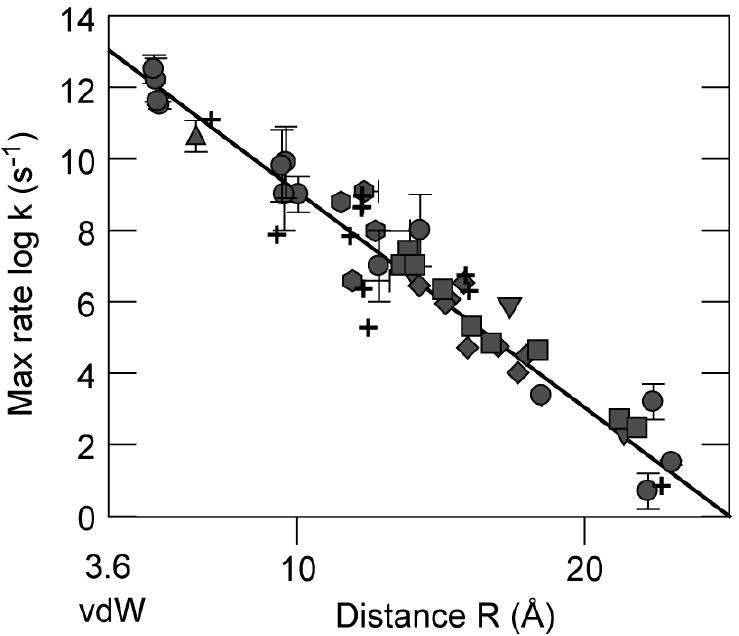
Log of free energy optimized rates as a function of edge-to-edge distance in natural and modified electron transfer proteins [2, 10, 32, 36-61]. Symbols and distance definitions are as described in text.
The empirical resolution of this edge is best achieved by comparing the electron transfer reactions between similar cofactors in many different proteins with different electron transfer distances and geometries. The conjugated macrocycle seems the appropriate edge for metal-free photosynthetic cofactors of pheophytins and bacteriopheophytins as well as the Mg containing chlorophylls and bacteriochlorophylls. Whether or not any substituent on the perimeter of the ring should be included within this edge is harder to resolve empirically because of the limited number of examples of different orientations between cofactors in resolved crystal structures for which electron tunneling rates and driving forces have been measured. In the absence of an extensive data set, our practical definition of the edge of a cofactor includes all atoms making up the aromatic/conjugated systems of porphyrins, chlorins, flavins, pterins, amino acid radicals and quinones, including oxygens attached to the quinone rings. With non-conjugated metal containing redox centers, we include within the definition of the cofactor edge both the metal atoms and the atoms directly ligated to two or more metal atoms.
Photosynthetic bacteria provide an example of how a relatively subtle and fine-scale empirical determination of the appropriate “edge” of a cofactor might be performed. Rb. sphaeroides has a type-a BChl where the outer carbons of ring II and IV are not conjugated, while the carbonyl of ring V appears to have some conjugated quality [28]. Blc. viridis has a type-b BChl with an ethylidene group on ring II that makes this ring conjugated. Support for the view that the conjugated atoms do appropriately define the cofactor edge comes from the observation that the rate of electron transfer is slower in BChl a containing Rb. Sphaeroides. While the distances between the non-conjugated atoms of heme c and BChl in Rb. sphaeroides and Blc. viridis photosynthetic reaction centers are the same, the conjugated rings are 1.9 Å further apart in the slower BChl a containing species [29].
Further support for this edge definition comes from employing equation 1 to estimate the electron tunneling rate of heme to BChl electron transfer using the crystal distance of the reaction center/cytochrome c2 complex and the reorganization energy of 500 meV derived by changing the driving force through a series of mutations in the BChl dimer environment [21]. The calculated rate is within a factor of 2 of that seen in crystals [30], supporting the edge estimate as appropriate.
A complication arises when the reorganization energy is estimated not from the direct driving force variation but from the experimentally easier temperature variation of the reaction rate [31]. It is often assumed that a classical, non-quantum Marcus theory description of the activation energy is appropriate. Under this assumption, the resulting almost two-fold larger reorganization energy leads to estimated optimal rates more than an order of magnitude slower, which would argue for an edge definition almost 2 Å smaller. However, as described below, the quantum theory behind equation 1 leads to a more modest temperature dependency than classical Marcus theory or a smaller reorganization energy. Using driving force estimates of reorganization energy rather than temperature dependence estimates avoids this classic/quantum mismatch problem.
There are two opinions as to the best distance metric for non-photosynthetic porphyrins such as hemes: either the conjugated ring extending around the macrocycle [2, 32] or the central iron at which the redox orbitals are concentrated [13, 33]. The direct electron tunneling distance measured from the conjugate heme macrocycle edge can be up to 4.8Å longer than that measured from the heme center. In a typical protein, this distance change amounts to nearly a thousand-fold change in the expected tunneling rate. Pathway calculations that estimate the decay of the wave function along a series of covalent, hydrogen bonded and through space connections between donor and acceptor have used both edge definitions, using either the iron [34] or the conjugated rings of the heme [35] as the pathway termini.
We find that for natural electron transfer reactions, the conjugated heme edge gives a distance metric consistent with observed rates using equation 1. In the photosynthetic cases the heme edge orients towards the BChls so there is a significant difference in distance estimates between the conjugated edge vs. central metal atom. The rather spare set of natural heme electron transfer reactions in which tunneling rates, crystal structure distances and estimates of reorganization energies are all available is enhanced by using heme proteins that have been chemically modified by attaching a light-activated ruthenium label. Here again it appears that equation 1 gives rates consistent with observation when using the ruthenium to heme conjugated edge distance, especially when taking into account the mobility of certain of these ruthenium labels [32, 36]. Figure 2 shows that the free energy optimized rates for electron tunneling for myoglobin (circles) [10, 37, 38], cytochrome c (diamonds) [36, 37, 39-45], cytochrome b5 (star) [46, 47] and cytochrome b562 (squares) [36] fall in line with analogous rates found in the photosynthetic reaction centers (open circles) [2] when using a heme conjugated edge definition. This is the case even when the ruthenium center geometry places it either in approximately in the same plane as the heme, where the metal to conjugated edge distance is much different from the metal to metal distance, or approximately normal to the plane, where there metal to metal and metal to conjugated edge distances are similar.
In contrast, in a pathway perspective using the center-to-center Ru to Fe metric, the same data set is interpreted to reveal that rates are faster or slower for a given metal-to-metal distance when approaching the heme edge on vs. face [13]. From the metal-centered point of view, coupling in the heme face direction appears better. A possible explanation is that face-on pathways have a single dominant pathway that has opportunity to contribute much better or much worse than average coupling, while the edge-on direction offers multiple interfering paths that average out the coupling [13]. It could be a coincidence that the face-on examples in Figure 2 each provide better than average coupling. It remains to be seen if the pathway interference explanation receives experimental support by the discovery of a face-on pathway with unusually poor coupling for the metal-to-metal distance. The simple edge-to-edge perspective suggests no such example will be found, as the tunneling distance will always be shorter and the rate faster for a given metal-to-metal distance when the heme edge turns towards the electron transfer partner.
Turning to other examples, Figure 2 includes natural heme reactions with more poorly defined reorganization energies and consequently larger uncertainties in the free energy optimized rate (crosses) [48-58]. Despite the larger uncertainty in tunneling parameters, once again the heme conjugated edge metric seems appropriate. Figure 2 also includes the modified non-heme proteins with copper centers (triangles) [10, 59, 60] and iron-sulfur centers (hexagons) [61] where the preferred distance metric includes only the metal centers and atoms between two or more metal centers. Rate estimates are better if metal ligands that are only bonded to a single metal are not included, although the issue is not yet entirely resolved as the differences between the distance metrics are relatively small compared to the experimental scatter.
2.3 Significance of 1013 s-1 at van der Waals contact
Using the edge-to-edge distances defined above, the collection of free energy optimized electron tunneling rates in natural proteins approaches 1013 s-1 at van der Waals contact, which matches the Eyring pre-exponential kBT/h value in absolute reaction rate theory [14, 15].
| (3) |
In this equation, κ is the transmission coefficient, the Boltzmann/Planck term kBT/h is about 1013 s-1, and ΔG† is the free energy of activation. This frequency corresponds to the time of a typical vibrational motion of nuclei that distort reactant geometries into product geometries and may be viewed as the frequency at which typical chemical systems approach the activation energy barrier. It is also close to a typical time in which two molecules approaching one another are in near contact of less than ∼0.5 Å and can be viewed as the approximate lifetime of a transition state activated complex. In an activationless system, when the electron transfer reaction has no activation energy due to electron tunneling (because the driving force matches the reorganization energy so that κ in equation 3 or κe in Eyring's notation is ∼1), and when there is also no chemical reaction barrier to be crossed, it seems plausible that the reaction would proceed at the 1013 s-1 vibrational rate as described by Eyring [14]. If a metal-to-metal distance metric is used instead [10, 13], the intercept at contact distance becomes orders of magnitude larger and this simple interpretation no longer applies. Some pathway analyses adjust down the large intercept, partly to compensate for the tendency of pathway methods to overestimate through space jump decays [35].
2.4 Significance of 0.6 coefficient of exponential distance dependence
The empirical electron tunneling rate expression of equations 1 and 2 follow the exponential decay of the tunneling rate with distance expected for a protein medium that presents a typical insulating barrier for electron tunneling. It does not appear that many, if any, physiologically relevant intraprotein electron transfers adjust the protein medium to modulate the height of the electron tunneling barrier, for example by significantly imposing gaps and spaces between amino acids to slow down electron tunneling, or by increasing the bonded quality of the amino acid medium to speed electron transfer. Non-biological synthetic media show these barrier modulations [2], but in both natural productive charge separating reactions and unproductive charge recombination or short-circuit reactions the intervening protein medium seems to have similar insulating properties. There are variations in the bonded quality and packing (ρ) of protein medium between natural redox cofactors (Figure 3)[3]. The average density within the united atom radius is about 0.76 with a standard deviation of about 0.10, which might be expected to contribute to lowering or raising the tunneling barrier. When atoms are omitted from published PDB x-ray crystal structures, large enough voids are filled with one or more water molecules for the sake of calculation. If the volume between cofactors within the atomic radius corresponds to a barrier similar to covalently linked redox centers with a β (base e exponential decay) of 0.9 Å-1 and the volume outside this radius to a vacuum-like barrier with a β of 2.8 Å-1, then at the risk of ignoring Hopfield's advice and introducing another parameter that complicates the analysis, the 0.6 average coefficient can be replaced with the term (1.2-0.8ρ):
Figure 3.
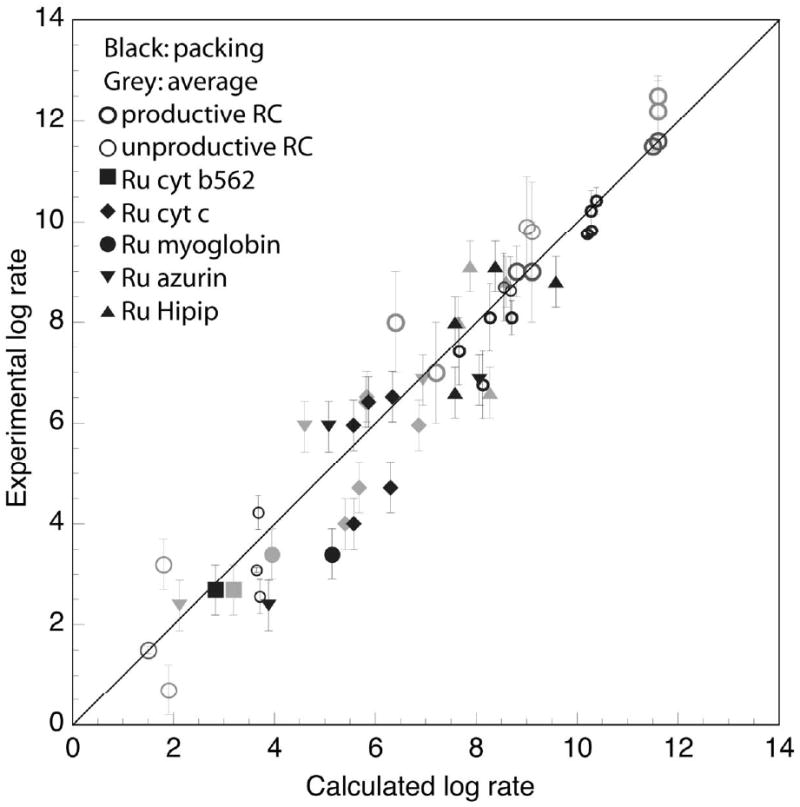
Experimental vs. calculated free energy optimized rates [2, 10, 32, 36-47, 59-61] for physiologically productive and unproductive electron transfer reactions in two species of bacterial photosynthetic reaction centers (thick and thin open circles, respectively) and a range of light activated ruthenium modified proteins (filled symbols) using equation 1 with an average protein insulating barrier (gray) or a variable barrier estimated from the packing density rho, (black). Error bars reflect estimates of uncertainties in distances, rates and reorganization energies in determining the free-energy optimized rates.
| (4) |
For the clear majority of proteins, it appears that the packing method makes similar adjustments in the expected rate of electron tunneling as alternate methods, such as the pathways method [4]; better or worse than average pathway connectivity correlates well with analogous deviations from average packing density. Figure 3 presents a detailed look at the effect of variable packing between redox centers in natural and modified proteins. In total, the effects of packing on natural electron transfer reactions are smaller than the uncertainties in the measurements of rates and tunneling parameters such as reorganization energy which often lead to an order of magnitude uncertainty in calculated vs. measured tunneling rates [62]. A rate estimate error of less than a factor of 8 is typically made by considering or ignoring packing density; packing density adjustments apparently slightly improve the accuracy of rate estimates in natural proteins and slightly decrease the accuracy in ruthenated proteins.
Rather than adjusting the insulating properties of the protein medium itself, it appears that natural selection controls the direction and speed of electron tunneling principally by adjusting the distance between redox cofactors. In principle, proteins composed of beta sheets have the ability to lower the electron tunneling barrier for a given distance compared to proteins composed of alpha helices, provided the cofactors are rather carefully positioned so that the region between cofactors falls right along the beta sheet backbone, leading to relatively high packing or pathway connectivity. They have been arranged this way by design in some ruthenated azurins [59, 63]. However, there are so far no known examples of this structure being exploited in unmodified natural proteins. In the volumes between >120 natural redox partners, we found roughly 70% have no protein backbone of any sort, often because the distance between cofactors is too short to accommodate one. Of the remaining volumes including backbones, most are part of loose, irregular coils. Beta sheets backbones intrude between cofactors only about 3% of the time and there does not appear to be any case in which the sheet aligns with the direction of electron transfer. In the absence of this special cofactor alignment, alpha helix and beta sheet proteins have unremarkably similar distribution of packing densities (Figure 4) [62]. Despite declarations that beta sheet proteins are best for long distance electron transfer [63], there is no evidence that nature actually favors beta sheet designs for this purpose.
Figure 4.
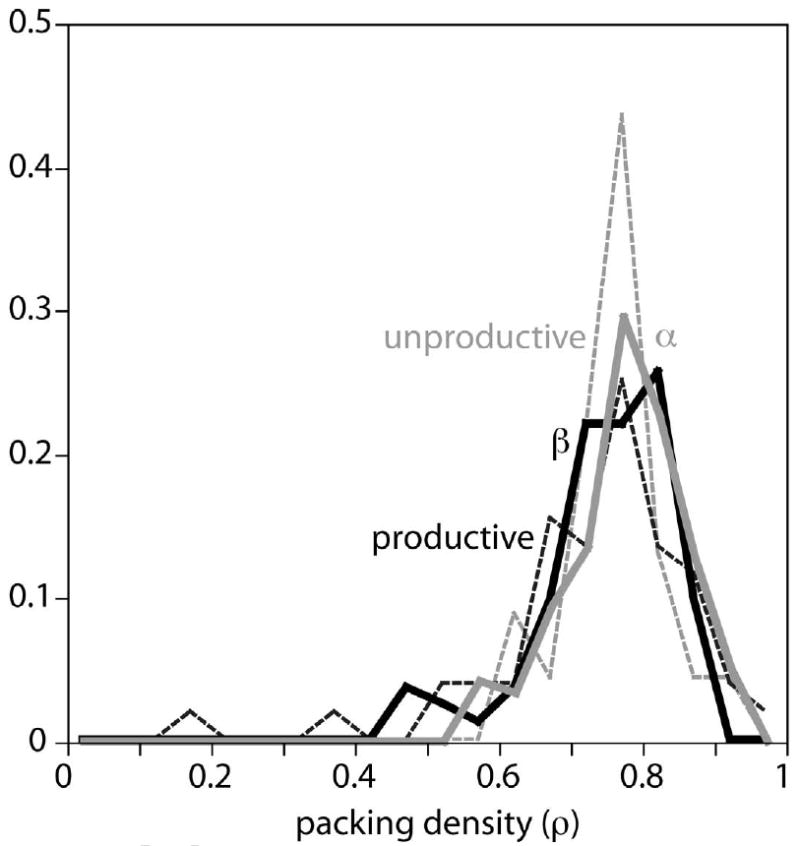
Packing densities in random regions of proteins that are predominantly alpha helical (gray) or beta sheet (black) compared to densities between cofactors in physiologically productive (black dashed) or unproductive (gray dashed) electron transfers. Mean packing densities for these four classes are similar: 0.78±0.08, 0.75±0.09, 0.74±0.14 and 0.76±0.06 respectively.
2.5 Measuring reorganization energy
Reorganization energies are defined as the driving force that leads to the maximal electron-tunneling rate in a roughly Gaussian dependence of rate as a function of driving force. Electron transfer rates typically speed up as the driving force increases, until the driving force matches the negative of the reorganization energy, and electron transfer rates are maximal for that given distance. Overdriving the reaction with larger driving forces causes the electron transfer rate to slow down once again. The most reliable way to measure the reorganization energy is to vary the driving force of a reaction while keeping the other parameters relatively constant. An experimentally much easier method measures the temperature dependence of the reaction and converts the apparent activation energy into a reorganization energy. This will lead to inappropriate values, especially if the reaction is not in fact limited by electron tunneling, or if parameters such as driving force or reorganization energy are themselves affected by temperature. Furthermore, the relationship between activation energy and reorganization energy will be different depending upon whether nuclear vibrational quantum effects are minor, so that classical Marcus theory applies (as is frequently assumed), or vibrational quantum effects are significant and a model including quantum effects is more appropriate.
Equation 1 is based on Hopfield theory, which has a Gaussian dependence of driving force on free energy and uses a relatively simple trigonometric function to approximate the progression between classical behavior matching Marcus theory at high temperatures and non-classical behavior at low temperatures involving a characteristic quantum frequency coupled to electron transfer. When this characteristic quantum frequency is larger than ambient temperature thermal energy, kBT, quantum effects become obvious and the electron-tunneling rate will have a smaller apparent activation energy and more modest temperature dependence than classical models using the same driving force and reorganization energy. While it is challenging to perform a genuine free energy dependence of the reaction rate to obtain the reorganization energy, and much more convenient to measure the temperature dependence of a reaction and assume classical Marcus theory, the activation energies and reorganization energies estimated by this classical temperature dependence will be higher, typically by about a factor of 50 to 60% near room temperature. There is the additional danger that the temperature dependence will be sensitive to activation energies not associated with the tunneling event itself and to changes in the molecular motions and geometries associated with the electron transfer reaction.
While reorganization energy is a significant factor in determining the electron transfer rate, it is usually not as important as the distance or driving force. When reorganization energies are entirely unknown, we prefer to fall back on rough estimates of small, medium and large values, around 0.7, 1.0 and 1.4 eV respectively, which correspond to typical protein environments and cofactors which are relatively non-polar, moderately polar or polar. Reorganization energies larger than these tend to be associated with adiabatic bond breaking systems, although Warshel and Parson have estimated the reorganization energy of hydride transfer as low as 1.4 eV in lactate dehydrogenase [64]. These small, medium and large estimates are useful in the design and construction of novel protein electron transfer systems where the polarity of the cofactor environment can be reasonably predicted.
2.6 Significance of 3.1 coefficient of free energy term
The free-energy dependent Franck-Condon factors in both classical Marcus theory [65] (equation 5) and Hopfield theory [19] (equation 6) both have a Gaussian dependence of the electron-tunneling rate on the driving force (ΔG).
| (5) |
| (6) |
Hopfield introduced the characteristic frequency coupled to electron transfer (ω) to capture the transition seen in early photosynthetic reaction center experiments by DeVault and Chance [18] from a quantum mechanical temperature insensitive rate of electron transfer at cryogenic temperatures, to increasingly classical temperature sensitive behavior at higher temperatures. The hyperbolic cotangent function (Coth) modulates the width of the Gaussian (variance) from a temperature insensitive quantum 2λhω at the low temperature limit to a temperature sensitive classical 2λkBT at the high temperature limit.
Extensive work in photosynthetic reaction centers over a wide range of driving force and temperatures shows rather clearly that a classical dependence is inappropriate [66], presumably because the atomic reorganization that takes place upon electron transfer in proteins is typically coupled to vibrations that are noticeably larger in energy than ambient temperature Boltzmann thermal energy kBT. The net effect of introducing quantum nuclear tunneling into the classic Marcus picture is to broaden the driving force dependence of the rate. In the common log rate expression of equation 1, the coefficient in front of the free energy term that seems to fit photosynthetic reaction centers and other protein systems is closer to 3.1 than the classic Marcus 4.2. This coefficient corresponds to a characteristic quantum of vibration coupled to electron transfer of about 60 meV.
Hopfield's expression is not the only way to introduce quantum terms into the free-energy dependence of the electron tunneling. An exact quantum mechanical oscillator description has a considerably more complex form than the simple Gaussian free energy dependence of equation 1 and uses modified Bessel functions (Im) [67].
| (7) |
where nk =1(exp[hω/kBT]−1)
Here ω is the same characteristic frequency of the vibration coupled to electron transfer used by Hopfield, H is the overlap of the donor and acceptor electronic wave function, Sk is the reorganization energy in units of hω, m is the change in the quantum number of the vibration ω, nk is an expression of the temperature dependent population of higher vibrational levels, kB is Boltzmann's constant and T the temperature. If the electron transfer were coupled only to a single high-energy vibration, then the electron transfer would take place only at discrete driving forces corresponding to multiples of the vibrational quantum energy. This is a precise but rather unrealistic description of natural electron transfer systems, because there will be many types of vibrations that can be coupled to different degrees to the reorganization upon electron transfer. This has the effect of softening out the free energy dependence of the rate. With more complex expressions that allow a single high energy vibration and a host of low energy vibrations, the free energy dependence of the tunneling rate is expected to have regular dips and wiggles [68, 69].
| (8) |
Here the symbols are the same as equation 7, but ΔE is an expression of the redox potential difference between the donor and acceptor, which allows the expression to be a continuous function of the driving force. This analysis has been applied to photosynthetic reaction centers [66].
We find that within the uncertainty of rate, distance and driving force measurements in biological systems, there is no evidence that a specific set of vibrations leads to dips and wiggles in the driving force dependence of the reaction rate. Indeed, given the experimental challenges in defining the parameters, it seems unlikely that any real biological system will clearly identify these vibrational subtleties. Overall, the broad Gaussian of equation 1 adequately describes driving force behavior.
Because of the typical uncertainties in studying the rates of electron tunneling in protein (uncertainties in measuring the rates themselves, and the challenge of varying driving force while maintaining other parameters such as distance and reorganization energy constant), it is even difficult to determine if the ∼60 meV characteristic frequency suggested by the broad, relatively temperature insensitive driving force dependence in photosynthetic reaction centers, is general for all natural protein electron tunneling reactions and reflects the typical electron-transfer-coupled vibrational spectrum of protein and organic cofactors as materials. On the other hand, there is as yet no evidence for dramatic variation in this characteristic frequency that would conspicuously broaden or narrow the width of the Gaussian free energy dependence of the reaction rate for any given reorganization energy.
2.7 Approximations for endergonic electron transfer
Although the driving force dependence of the electron-tunneling rate described by Hopfield is Gaussian-like for exergonic reactions, the Gaussian behavior does not simply extend into the endergonic region, as an examination of exact quantum mechanical harmonic oscillator descriptions makes clear. There is a noticeable transition in these more complex equations as the driving force becomes uphill, with an increasingly deep fall in the electron transfer rate as the reaction becomes more and more uphill. At cryogenic temperatures, the break between endergonic and exergonic behavior becomes even more conspicuous. A quite simple, and moderately accurate way to model this endergonic quantum behavior is to use equation 1 to calculate biological electron tunneling for exergonic conditions, and to calculate the endergonic rate of the reverse reaction by requiring that the ratio of the forward and reverse reaction rates obeys a Boltzmann equilibrium term (equation 2) [2, 3]. Figure 5 shows that this combination of equations for the exergonic and endergonic regions follows the general trend of the exact multi-vibration quantum harmonic oscillator equations rather well, and with considerably fewer parameters and a much simpler equation that can be evaluated in your head. Because this pair of equations by definition obeys a Boltzmann equilibrium expression, there is neither danger of circumventing the second law of thermodynamics nor any algebraic error, despite suggestions to the contrary [70]. Any attempt to single-mindedly use only equation 1 for both the endergonic and exergonic regions, or only equation 2 in both the exergonic and endergonic regions is doomed to paradox and failure.
Figure 5.
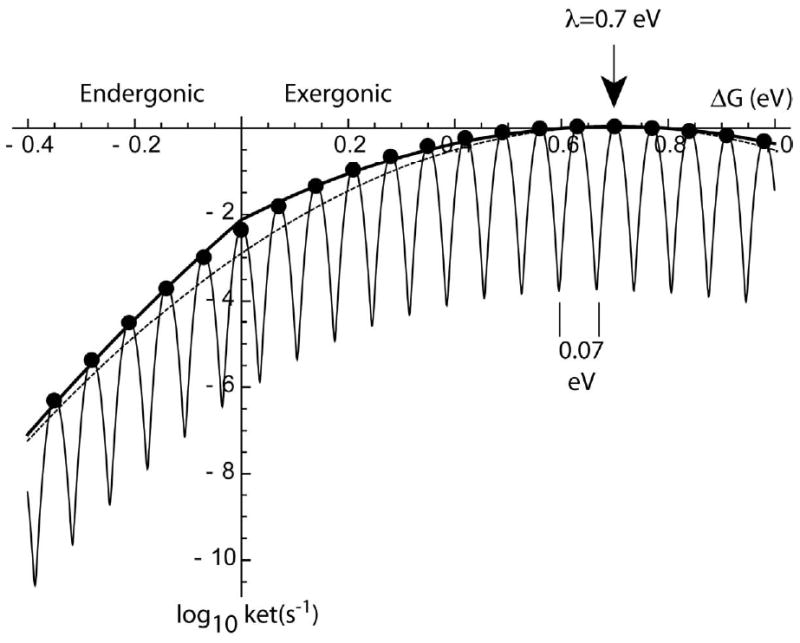
Electron tunneling rates vs. driving force for classical Marcus description (dashed line, equation 5) [65]; and exact quantum simple harmonic oscillator model with one frequency of 70 meV (black circles, equation 7) [67]; a harmonic oscillator model with multiple vibrations both quantum and classical (thin line, equation 8) [68, 69]; and the simple empirical approximation using equations 1 and 2 presented here (thick line).
Support for the use of equation 2 for endergonic electron transfer is provided by classic low temperature experiments on endergonic intraprotein electron tunneling [20]. Figure 6 is adapted from the thesis of M. R. Gunner [71] and shows the driving force dependent behavior of the uphill charge recombination reaction after light-induced charge separation in bacterial photosynthetic reaction centers in which the native ubiquinone at the QA site has been replaced with a variety of exotic quinones of different redox midpoint potentials. These midpoint potentials were measured in situ by examining the initial amplitude of the delayed fluorescence reaction as the excited bacteriochlorophyll dimer (P*) thermally repopulated from the charge-separated state P+QA-. As the redox midpoint potential of the exotic QA quinones became more negative, the recombination to the P ground state moved from a mostly temperature insensitive hundred millisecond timescale to a temperature sensitive and much faster millisecond to microsecond timescale (Figure 6 top). The rate of recombination accelerated by a factor of 10 for every approximately 60 mV drop in quinone redox midpoint potential. At the same time, the activation energy associated with this temperature sensitive reaction fell in direct proportion to the downward shift in midpoint potential and associated electron transfer driving force (Figure 6 bottom). This is powerful evidence that the charge recombination takes place via an uphill electron transfer, presumably returning the electron to bacteriopheophytin (which originally relayed the electron from the light excited bacteriochlorophyll dimer to the quinone) followed by downhill electron transfer from the bacteriopheophytin to the dimer ground state. The slopes of Figure 6 indicate that this uphill electron transfer is related to the reverse downhill electron transfer back to the quinone by a 60 mV per decade Boltzmann equilibrium. The driving force dependent rates of both the forward, downhill electron transfers and the reverse, uphill electron transfers in photosynthetic reaction centers and the presence or lack of temperature dependence are the original basis for the protein tunneling expressions of equations 1 and 2.
Figure 6.
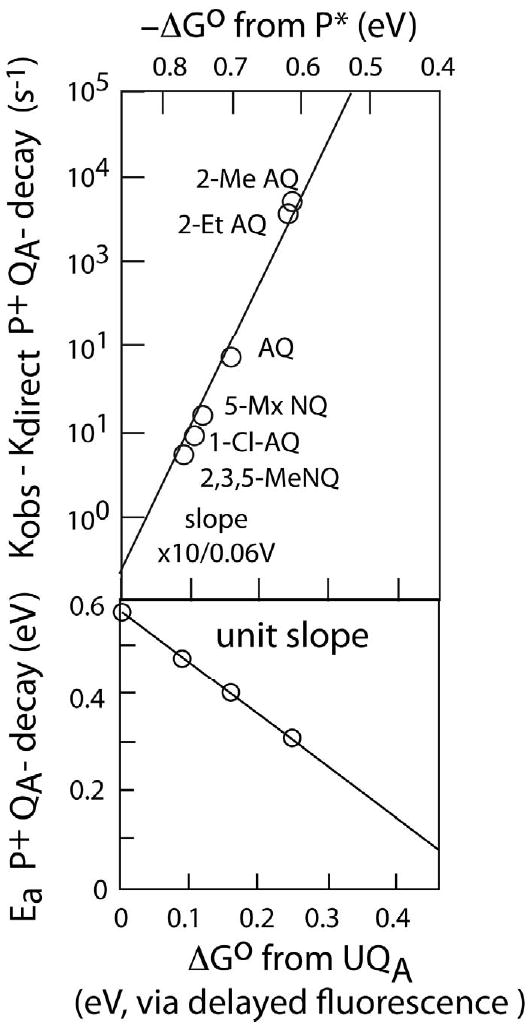
In bacterial photosynthetic reaction centers, quinone/bacteriochlorophyll dimer charge recombination takes place via thermally activated, uphill electron transfer when the native ubiquinone at the QA site is replaced with lower redox midpoint potential quinones [20, 71]. The activation energy for the reaction directly tracks the drop in the midpoint potential (lower panel) and the thermally activated rate increases by a factor of 10 for every 0.06 eV drop in potential (upper panel), the behavior expected for uphill electron tunneling according to equation 2.
2.8 What matters to biology
Of the various parameters that could be manipulated by natural selection to engineer and control electron transfer in proteins, it is clear that distance is the most important. Mutagenic selection of amino acids that allow or disallow redox cofactors to covalently or non-covalently bind at certain locations within an existing protein scaffold or to refold the protein to bring redox elements closer or further apart, is the principle element of natural design. This principle allows even a low-resolution structural view of a protein, with at least some discrimination of individual redox centers, to be highly useful in understanding its overall electron transfer design and operation. The influence of distance is magnified for electrons coupled to protons in hydride transfer, especially if the proton must tunnel.
The next most accessible handle upon which natural selection acts is the driving force of the electron transfers. Driving force is especially important in engineering uphill electron transfers and in suppressing physiologically unproductive electron transfers, where a relatively modest 0.06 eV change in driving force can slow electron transfer reactions by an order of magnitude, equivalent to an increase in electron tunneling distance of 1.7 Å. This principle is active in safe-guarding the reactivity of two-electron redox centers with intermediate semiquinone redox states, such as ubiquinone, because non-specific electron transfer with adventitious redox centers will often involve an initial electron transfer that is significantly uphill. Driving force is not as influential in controlling downhill electron transfers, because the quantum broadening of the free energy dependence of the tunneling rate means that relatively large changes in driving force of 0.2 to 0.5 eV are required to execute an order of magnitude change in tunneling rate. Driving force is an expensive and often inefficient way to engineer exergonic electron transfer rates.
Reorganization energy can be used to control electron transfer rates, as it appears that changes from 0.7 to 1.4 eV can take place by introducing polar amino acids and water molecules into an otherwise non-polar site. However, even such a dramatic manipulation of the reorganization energy will likely change the electron tunneling rate by less than two orders of magnitude, a change that can be effected through a 3.3 Å change in distance; this is about the effect of interposing or removing the width of one amino acid between cofactor binding sites. Nevertheless, some natural selection of reorganization energy has probably taken place; the unusually low reorganization energies associated with the initial charge separation in photosynthesis improve the quantum yield and provide a likely selection target.
Changes in the bonded quality or packing density of the protein medium could significantly influence electron tunneling rates, especially if the bonding or packing change is extensive along a relatively long distance between redox centers. At short distances however, changes in packing density will have relatively little effect, since the rate depends on the packing term multiplied by the distance. For example, at a distance of 5Å, a change in packing density of a full 4 standard deviations will only have about a 3-fold effect on the tunneling rate, equivalent to a distance change of less than an Angstrom. This does not mean that packing changes could not be selected in principle for some particular case, only that there is no clear evidence that the packing deviations seen in natural electron transfer reactions are not merely random.
One last parameter, the characteristic frequency of vibration coupled to electron transfer, could also be modified by natural selection to speed or slow any particular electron transfer. This is one of the hardest parameters to measure and the one with the most uncertain value; indeed, the range of natural variation of this parameter is not at all clear, let alone the influence of natural selection. However, as it is also one of the weakest parameters in terms of its effect on the electron-tunneling rate, it is one of the least likely parameters for continued natural selection.
The overall picture of what matters most to biological electron tunneling is location, location, location. Furthermore, proximity becomes even more important when there is a significant uphill electron transfer barrier to be surmounted, as is often the case in multi-electron transfer systems involving quinone, flavin, pterin, nicotinamides or bond-breaking catalysis.
3. Electron versus hydride transfer
Oxidoreductases represent nearly a third of named natural enzymes and within this group by far the most common substrates are the nicotinamides NADH and NADPH. Figure 1B shows the distribution of distances between the nicotinamides and bound substrate from a sampling of the PDB protein structure database. Unlike single electron transfer distances in Figure 1A, there is a clear clustering around 3.4 +/-0.2 Å, i.e. near van der Waals contact; outside this range distances trail out to 7 Å. At the closest distances, molecular motion can foster ∼2 Å close approaches required for tunneling of the hydrogen nucleus between donor and acceptor in biological systems [16, 17], just as in non-biological systems. Indeed, by studying light-activated steps of chlorophyll synthesis in protochlorophyllide oxidoreductase, it has been possible to trigger the conformational changes that enhance hydride transfer and follow their infrared vibrational signatures [72].
It is not immediately clear if motion in protein has been naturally selected to optimize tunneling effects. Warshel's thesis that nuclear tunneling does not contribute significantly to enzyme catalysis, as compared to the uncatalyzed reaction in water [73], is consistent with recent acknowledgments that enzymes have not evolved to accelerate tunneling per se [16, 74]. In any event, the hydrogen isotope effects often used to expose nuclear tunneling are expected to generally fade as catalysis becomes faster and more effective.
At the largest nicotinamide/substrate distances of figure 1B, proton tunneling would be impossibly slow. In such molecules we may expect either that hydrogen transfer distances shrink through large-scale rearrangement, or that electron and proton transfer occur over different distances to separate acceptors. Protein crystal structures including both nicotinamides and flavins show a similar clustering of distances between 3 and 4 Å (figure 1C) consistent with small scale motion leading to hydride transfer and proton tunneling. Beyond this cluster there is nearly flat distance distribution out to about 18 Å, where direct hydride transfer is highly unlikely. While in some cases electron transfer between NADH and flavin is simply mediated by other redox centers, in other cases, large-scale motion could facilitate close approach or electron and proton transfer could be managed with separate acceptors.
It should not be forgotten that significant motion is sometimes critical for simple single-electron tunneling. Although extensive molecular motion is not essential for electron transfer over distances of up to 14 Å, because the electron's wavelength is so much longer than proton's, molecular motion and diffusion can be an important to allow donors and acceptors to approach within this electron tunneling range [75]. For example, tethered diffusion of the FeS subunit of Complex III in the mitochondrial respiratory chain brings the FeS cluster alternately in and out of electron tunneling distance with its quinone or heme c1 redox partners [76]; motion in sulfite reductase greatly reduces the electron transfer 20 Å distance seen in the crystal structure [77]. Molecular motion can also modulate other parameters coupled to electron tunneling, such as driving force and reorganization energy [64, 78, 79] although these typically have less dramatic effects.
Next to distance, driving force has a principle influence of the kinetics of electron transfer in two-electron transfer. The energetics of the ubiquitous biological two electron redox centers nicotinamides, flavins and quinones can be described in terms of the redox midpoint potentials of the one electron redox couples (in the various protonated or deprotonated states, see Figure 7). For NADH, the average potential of the two redox couples is around -0.32 V. The extent of the split between the two redox couples gives a measure of how much of the half-reduced or semiquinone species can be seen under equilibrium conditions. To use NADH as an example, the stability constant (Kstab) near room temperature is
Figure 7.
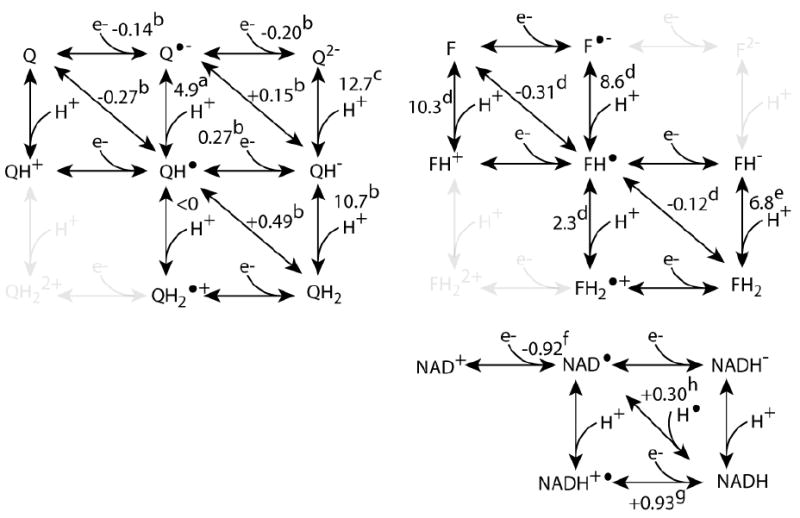
The common multi-electron redox substrates engage in a matrix of redox and protonation states. The values of redox midpoint potentials and pKs are those expected for cofactors in solution: a)[104] b) [105] c) [106] d) [107] e) [108] f) [80] g) [81] h) [109]
| (9) |
When the redox midpoint potential (Em) values of the two redox couples are the same, then the stability constant is 1 and an equilibrium redox titration will have a maximum concentration of the singly reduced species equal to 33% at the average redox midpoint potential. If the Em of the first reduction is more positive than the second reduction, as is the case sometimes with flavins and quinones, then the Kstab is greater than one (log Kstab is positive) and we say the semiquinone species is stable and observable, for example as an unpaired spin by EPR. This property allows flavin to act as a transducer between obligate two-electron redox centers and obligate one-electron redox centers in an electron transfer chain. If the Em of the first reduction is more negative than the second, the Kstab is less than one (log Kstab is negative) and the single reduced species is considered unstable and never reaches a high concentration at redox equilibrium. For NADH in neutral aqueous solution the redox midpoint of the NAD •/NAD+ couple has been reported to be a strongly reducing-0.92 V [80] with leads to a stability constant around 10-20. This means the equilibrium concentration of NAD• will be less than one part in 1010 at best. The Em of the NADH/NAD • couple is moderately oxidizing, at around +0.28 V. The Em of the protonated couple NADH/NADH + • in aqueous solution has also been estimated at +0.93 V [81].
Although it is commonly believed that NADH is exclusively a two-electron, hydride transfer agent, there are clear indications of electron and proton transfer with obligate one-electron redox centers that do not involve transfer of a hydride [82]. Excellent examples are provided by ferricyanide [83] and ferrocenium ions [81, 84]. There is even good evidence that two-electron redox centers such as quinones can also participate in single electron transfer with NADH [85, 86]. Indeed, it is often profitable to view many classical organic chemical reactions, traditionally regarded as obligatory two-electron transfer reactions, in terms of the passage of electrons one by one [87, 88]. Single-electron oxidation of NADH becomes more facile as the redox couple of the oxidant approaches or becomes more positive than the NADH/NAD • couple at 0.28 V if proton release is not rate limiting, or 0.93 V if proton release is rate limiting. Under these conditions it makes sense to test the extension of the electron-tunneling rate expressions developed for biological single-electron-transfer reactions [2], to a sequence of two one-electron-transfer reactions between a pair of two electron donors/acceptors, such as NADH, flavin or quinone (Figure 8 C-F) and compare these to observed rates.
Figure 8.
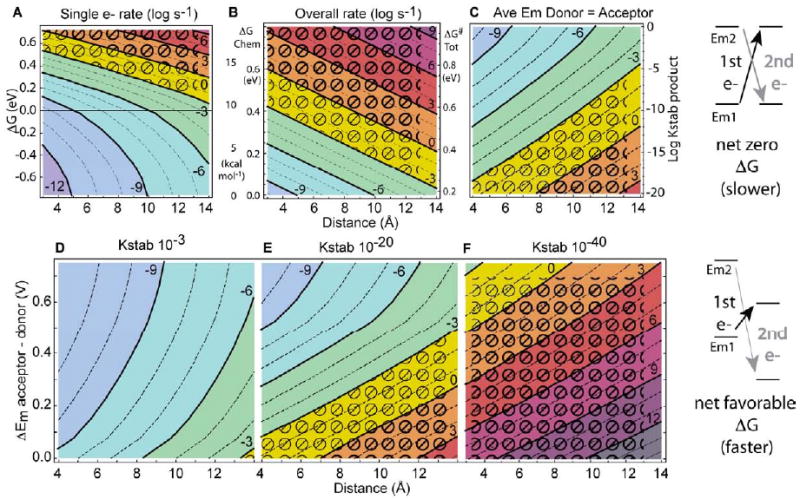
A) Expected single electron tunneling rates as a function of distance and driving force. Contour lines show log rate in seconds. 1 eV reorganization energy. B) The activation free energy barrier at a catalytic site that can be scaled on a physiological timescale depends C-F) Electron tunneling rates expected for two sequential electron transfers from a two-electron donor to acceptor as a function of distance, average driving force and the product of the stability constants of the two redox centers. Typically, the first electron transfer is uphill and slow while the second is down hill and faster. Physiologically acceptable rates are shown in greens and blues. The reorganization energy is a generic 1 eV.
Figure 8A shows that with a typical 1 eV reorganization energy, expected electron tunneling reactions exceed the typical 103 s-1 of many enzymes when the reaction is exergonic and the tunneling distance is 14 Å or less (green and blue regions in Figure 8A). This speed for endergonic electron tunneling means that if redox centers are relatively closely placed, then a sequence of two single-electron transfer reactions, one uphill (for example to a relatively unfavorable semiquinone state) and one down hill (for example to a favorable fully reduced state) can occur in a physiologically acceptable timescale. Panels B-F of Figure 8 show several examples.
Flavin FMN in aqueous solution has a stability constant of ∼10-3, so the maximum semiquinone at equilibrium reaches modest concentrations of a few percent. With a product of the stability constant of donor and acceptor of ∼10-3 (panel B), electron tunneling uphill for the first electron, followed by an equally downhill reaction for the second electron for an over all ΔG = 0 reaction, can easily take place within the 103 s-1 physiological window, even over distances of more than 14Å (rates along the x-axis of panel B). When the net driving force for the overall two-electron transfer reaction is favorable (moving up panel B), the reaction can proceed even faster.
With the much smaller stability constant of 10-20 typical of NADH or NADPH (panel C), where the equilibrium population of the half-reduced, radical form will be less than one in a billion, the distance between donor and acceptor must be significantly smaller, or the overall driving force significantly more exergonic, in order for a two step electron tunneling reaction to be within the typical physiological window of faster than 103 s-1. Yet with a net driving force of a few hundred meV, donor and acceptor need only to approach within 10 Å of each other in order to allow the pair of single electron tunneling reactions to proceed within a millisecond. This means that a large amount of flexibility of donor/acceptor binding site geometries could be tolerated, and that NADH oxidoreductase enzymes have the potential to proceed by non-adjacent, non-hydride, sequential electron transfer mechanisms with some robustness, provided that the environment provides sufficient resources for proton management. This is a promising prospect for engineering de novo, non-natural protein environments for multi-electron catalysis.
If both the donor and the acceptor have very low stability constants so that the stability constant product is around 10-40 (panel D), as in NADPH/NADH transhydrogenase [89], there are virtually no conditions in which a sequential electron tunneling reaction can proceed on the millisecond timescale, and it is certain that electron transfer proceeds by an alternate mechanism such as hydride transfer or, if conditions are sufficiently polar, simultaneous two-electron transfer [90]. Equation 1 and 2 will not be of much use in predicting the rate of this reaction.
4. Merging electron tunneling and chemical barrier expressions
The electron tunneling expressions of equations 1 and 2, and hence the rates shown in Figure 8, are based on non-adiabatic electron transfer theory, which presumes that electron donor and acceptor are clearly identifiable and separate. As donor and acceptor come in near contact, interactions between donor and acceptor strengthen and the simple common diabatic Marcus-like view of parabolic energy surfaces with occasional hops from donor to acceptor surface starts to fail. A reaction proceeding over a single adiabatic energy surface through transition state region becomes a better description. The latter adiabatic view is also more appropriate if there is significant bond making and breaking taking place during the electron transfer reaction. As with classical chemical reactions, a simple Eyring rate expression based on transition state theory (equation 3) is often used in these circumstances [14].
Besides a purely adiabatic description, it is also possible that electron transfer coupled to some other reaction can be both non-diabatic for long distance electron transfer and adiabatic for the coupled reaction. The overall progress from reactant to product may be sequential, with an electron transfer first and the bond changes second, or the bond changes first and the electron transfer second, or concerted, with both occurring at the same time.
Classical and well-described examples of this behavior are found in coupled proton and electron transfer [91, 92]. Figure 9 illustrates a simplified picture of coupled proton and electron transfer with parabolic potential energy surfaces along the reaction coordinates for electron and proton transfer. An analogous reaction surface may apply to any other reaction coupled to electron transfer, such as a protein conformational change that performs useful work. The arrows in Figure 9 show possible paths for each of the reaction sequences, sequential ETPT, PTET or concerted. Which mechanism is favored will depend on the activation energy barrier of the proton transfer before or after electron transfer, the activation energy of the electron transfer before or after proton transfer, and the κe or transmission coefficient for electron tunneling through the long distance between electron donor and acceptor.
Figure 9.
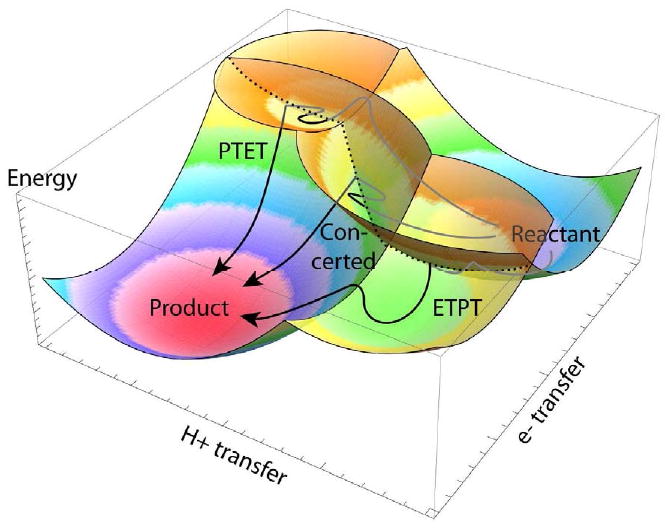
Schematic illustration of possible energy surfaces of an non-adiabatic electron tunneling reaction coupled to an adiabatic chemical reaction, here proton transfer. Coupled electron and proton transfer can take place sequentially in either order (ETPT for electron first, PTET for proton first) or concertedly, depending on reaction activation energies and transmission coefficients. Arrows show possible paths along the energy surfaces. In the direction of electron transfer, energy surfaces intersect, but because the transmission coefficient κ is much less than one, the reaction path moves repeatedly past the intersection and only rarely jumps to the new surface.
| (10) |
This κe, which is much less than one for long-distance electron transfer, is illustrated as a wiggling back on forth on a parabolic surface for the electron on the donor, passing many times through the intersection with the parabolic surface for the electron on the acceptor (dotted line), and then finally jumping onto this new surface (show as a sharp bend in the line). Proton transfer is shown as a smooth line with the thermally activated path reaching the low-lying pass of an adiabatic transition state between two parabolic surfaces and crossing over more or less directly.
The path marked “concerted” can be described by equation 1, although the proton transfer (or other chemical) component may lead to a reorganization energy that is larger than a typical intraprotein electron transfer, and the concerted reaction may be more likely to freeze out at lower temperatures compared to simpler electron tunneling reactions. Because the reorganization energy for a reaction of this sort can be difficult to estimate a priori; equation 1 may be useful only in providing an upper bound of the electron tunneling rate.
The path marked PTET could be rate limited by uphill proton transfer, followed by rapid electron transfer. In this case, the reaction will generally not be sensitive to the electron tunneling parameters, R, ΔG or λ and we are forced to fall back on the simple Eyring expression (equation 3) with a difficult to predict activation energy and little ability to predict rates a priori. However, when the electron transfer is not too short, κe can be small enough that electron tunneling can be slower than the proton transfer step. In this case, equation 1 applies, but a term needs to be added to reflect the unfavorable equilibrium constant between the forward and reverse proton transfer reaction, -ΔGchem/.06 (equation 11). Generally, there will also be an increase in the driving force for the electron transfer step compared to the difference in the redox potentials of donor and acceptor measured at equilibrium with protons. However, the effect of a change in driving force in the electron tunneling (ΔG+λ)2/λ term will usually be much smaller than the effect of the -ΔGchem/.06 term—uphill driving forces once again dominate rates. If the overall rate of the reaction, distance and driving force are moderately well known, then the energetic penalty of the uphill reaction ΔGchem can be estimated.
| (11) |
In Figure 9, the last path marked ETPT could also be rate limited by proton transfer, but if the electron transfer distance is long enough, it is likely to be rate limited by electron transfer. In this case, uphill electron transfer is followed by rapid downhill proton transfer, and the reaction path could be described by equation 2. Generally, the redox potential of this uphill electron transfer intermediate will be difficult to measure. However, if the overall rate of the reaction, and distance are moderately well known, then uphill driving force of the electron tunneling reaction might be estimated using this equation. From a redox protein design perspective, when it is difficult to influence the redox midpoint potentials of an uphill single-electron transfer intermediate in a reaction, placing redox centers as close as possible is a reasonable means to attempt to speed these reactions. Indeed, Figure 8A shows that close distances should permit submillisecond electron transfers several hundred meV uphill.
Figure 8B provides a graphic example of the size of unfavorable equilibrium-constant/energy-barrier surmountable in a given time at a given tunneling distance. These rates are provided for a tunneling ΔG° near 0 eV and an average λ of 1 eV. Figure 8B shows that at 4 Å such tunneling reactions can in principle thermally surmount barriers up to 10 to 15 kcal/mol in the millisecond to second timescale of many oxidoreductases. Thus, the observed catalytic rate, if rate limiting and set by the adiabatic chemical barrier established in the site [14], will be sensitive to any modulation of electronic and nuclear terms of electron tunneling at the interface [65].
It is rare that experimental situations fortuitously allow direct examination under similar conditions of both a tunneling rate between two centers and a catalytic rate coupled to the electron transfer. In an example from photosynthetic reaction centers, the relatively long distance, 13 Å reduction of QB site quinone by a single electron from the QA site of 4×10⁵ s-1 is quite close to tunneling rate of ∼106 s-1 expected from equation 1. However, reduction of the semiquinone QB by a second electron from QA is expected to be more complex with protonation and finally release of the fully reduced quinone. The rate for this reaction is a much slower ∼103 s-1. Equation 11 suggests a coupled, non-tunneling energetic barrier of about ∼ 4 kcal/mole, which matches the measured activation free energy for this reaction [93, 94].
Cytochrome c oxidase provides another example of how multi-electron tunneling and coupling of electron and proton transfer might work in practice, with a single step electron transfer coupled to an energetic barrier that does the work of proton pumping [92, 95]. X-ray crystal structures [96, 97] show that heme a is 7 Å away from heme a3 and that heme a3 and CuB centers are less than 5 Å away from the bound O2 substrate. The tight clustering of heme a3, CuB and O2 means that electron tunneling to deliver two electrons to O2 can be faster than the 5 × 10³ s-1 turnover of the enzyme [98] even if the first electron transfer were 0.6 eV uphill to a redox center as low as -0.3 V. The redox potential of the O2 bound to heme a3 is uncertain, but is not likely to be as hard to reduce as this. Even without the benefit of being bound to the heme iron, the redox potential of the oxygen/superoxide anion couple in solution is only -0.14 V [99].
It appears the electron transfer that sets up the reduction of oxygen to water in cytochrome oxidase, namely electron transfer between heme a and a3, couples to the work of proton pumping by the enzyme [100]. CO photolysis experiments with the mixed-valence state of oxidase (starting with heme a3 reduced and CO bound, heme a oxidized) show an inherent time of electron tunneling between heme a3 and a of about 1 ns [101, 102]. This is the rate expected from equations 1 and 2 given the close distance between these heme groups and typical reorganization energies [95]. Yet the physiological electron transfer between heme a and a3 is measured at 30 μs. While this reaction may be rate limited by proton transfer, Equation 11 suggests this 30,000 fold slowing of the electron transfer could be correlated with an uphill step coupled to the electron transfer. Just how far uphill depends on the reorganization energy of the electron tunneling reaction, which is not known. With a 1 eV reorganization energy, a 0.3 eV uphill step would be required. If water molecules in this region contributed to a larger reorganization energy of around 1.6 eV, a 0.15 eV uphill step could be involved. The temperature dependence of the Hopfield relation underlying equation 11 gives a temperature dependent rate which is not far from that which is observed for the rate of electron transfer between between the O2 bound state and the heterolytically cleaved Pr state [103]. Equation 11 leads to an apparent activation energy of 0.39 eV, in between the experimentally estimated activation energy is 0.2 eV and the estimated activation free energy of 0.45 eV [103], and indicates that an uphill free energy step connected to the work of proton pumping coupled to the electron tunneling reaction is plausible.
5. Natural design
Distance and driving force control of electron transfer reactivity is critical for life, which is essentially the management of many quasi-stable compounds, with pairs of electron locked up in chemical bonds that must be teased into rearrangement during catalysis or energy conversion. A rush of rapid electron transfers leading to equilibrium would mean death for any organism. To forbid unproductive electron transfers, single electron donors and acceptors must be excluded from within the approximately 14 Å boundary, while appropriate single electron donors and acceptors must be brought within this range in order to achieve physiologically acceptable speeds. The principal role played by protein structure is to secure redox cofactors and binding sites within this distance and to provide bulk insulation to exclude unproductive electron transfer partners. Specificity is gained by natural selection of amino acids that modulate binding affinity at substrate binding pockets and hence the time spent at closer distances. Multi-electron donors and acceptors without readily accessible singly oxidized or reduced states are much less reactive, even at closer distances; thus two-electron species, such as quinone or substrates such as succinate, can exist as reductive pools amongst nearby oxidized centers. For physiologically productive electron transfer, multi-electron species must be brought closer still so that electron tunneling can overcome the typical endergonic barrier to the initial electron transfer. Just how close depends on the one-electron redox midpoint potential of the multi-electron substrate. In the extreme, even van der Waals contact may not bring a high barrier electron transfer reaction into the physiological acceptable rate range, and proteins will be forced to search protein space for nearby residues that will interact with substrates by lowering the activation energy barrier for sequential single electron transfers or concerted two-electron transfer. Eventually the relatively simple engineering of electron tunneling must be supplemented with specific orientation of reactants for direct contact, adiabatic bond breaking and making reactions, as in hydride or other chemical group transfer and conventional chemical catalysis. Employing these guidelines during construction of artificial catalytic sites in synthetic proteins will be a great challenge, but will reveal much about the natural engineering principles of biocatalysis.
Acknowledgments
Supported by GM 41048 and, in part, NSF DMR05-20020 to PLD.
Footnotes
Publisher's Disclaimer: This is a PDF file of an unedited manuscript that has been accepted for publication. As a service to our customers we are providing this early version of the manuscript. The manuscript will undergo copyediting, typesetting, and review of the resulting proof before it is published in its final citable form. Please note that during the production process errors may be discovered which could affect the content, and all legal disclaimers that apply to the journal pertain.
References
- 1.Saab-Rincon G, Valderrama B. Protein Engineering of Redox-Active Enzymes. Antioxidants & Redox Signaling. 2009;11:167–192. doi: 10.1089/ars.2008.2098. [DOI] [PubMed] [Google Scholar]
- 2.Moser CC, Keske JM, Warncke K, Farid RS, Dutton PL. Nature. Vol. 355. Macmillan Magazines Ltd.; 1992. Nature of Biological Electron-Transfer; pp. 796–802. [DOI] [PubMed] [Google Scholar]
- 3.Page CC, Moser CC, Chen XX, Dutton PL. Natural engineering principles of electron tunnelling in biological oxidation-reduction. Nature. 1999;402:47–52. doi: 10.1038/46972. 274. [DOI] [PubMed] [Google Scholar]
- 4.Jones ML, Kurnikov IV, Beratan DN. The nature of tunneling pathway and average packing density models for protein-mediated electron transfer. Journal of Physical Chemistry A. 2002;106:2002–2006. [Google Scholar]
- 5.Stuchebrukhov AA. Long-distance electron tunneling in proteins. Theoretical Chemistry Accounts. 2003;110:291–306. [Google Scholar]
- 6.Nishioka H, Kakitani T. Average electron tunneling route of the electron transfer in protein media. Journal of Physical Chemistry B. 2008;112:9948–9958. doi: 10.1021/jp710689s. [DOI] [PubMed] [Google Scholar]
- 7.Balabin IA, Beratan DN, Skourtis SS. Persistence of Structure Over Fluctuations in Biological Electron-Transfer Reactions. Physical Review Letters. 2008;101 doi: 10.1103/PhysRevLett.101.158102. [DOI] [PMC free article] [PubMed] [Google Scholar]
- 8.Gray HB, Winkler JR. Electron flow through proteins. Chemical Physics Letters. 2009;483:1–9. doi: 10.1016/j.cplett.2009.10.051. [DOI] [PMC free article] [PubMed] [Google Scholar]
- 9.Langen R, Chang IJ, Germanas JP, Richards JH, Winkler JR, Gray HB. Electron-Tunneling in Proteins - Coupling through a Beta-Strand. Science. 1995;268:1733–1735. doi: 10.1126/science.7792598. [DOI] [PubMed] [Google Scholar]
- 10.Gray HB, Winkler JR. Electron transfer in proteins. Annu Rev Biochem. 1996;65:537–561. doi: 10.1146/annurev.bi.65.070196.002541. [DOI] [PubMed] [Google Scholar]
- 11.Balabin IA, Onuchic JN. Dynamically controlled protein tunneling paths in photosynthetic reaction centers. Science. 2000;290:114–117. doi: 10.1126/science.290.5489.114. [DOI] [PubMed] [Google Scholar]
- 12.Skourtis SS, Waldeck DH, Beratan DN. Inelastic electron tunneling erases coupling-pathway interferences. Journal of Physical Chemistry B. 2004;108:15511–15518. [Google Scholar]
- 13.Prytkova TR, Kurnikov IV, Beratan DN. Coupling coherence distinguishes structure sensitivity in protein electron transfer. Science. 2007;315:622–625. doi: 10.1126/science.1134862. [DOI] [PMC free article] [PubMed] [Google Scholar]
- 14.Zwolinski BJ, Marcus RJ, Eyring H. Inorganic oxidation-reduction reactions in solution-electron transfers. Chemical Reviews. 1955;55:157–180. [Google Scholar]
- 15.Eyring H. The activated complex in chemical reactions. J Chem Phys. 1935;3:107–115. [Google Scholar]
- 16.Nagel ZD, Klinman JP. A 21(st) century revisionist's view at a turning point in enzymology. Nature Chemical Biology. 2009;5:543–550. doi: 10.1038/nchembio.204. [DOI] [PubMed] [Google Scholar]
- 17.Hammes-Schiffer S, Benkovic SJ. Relating protein motion to catalysis. Annual Review of Biochemistry. 2006;75:519–541. doi: 10.1146/annurev.biochem.75.103004.142800. [DOI] [PubMed] [Google Scholar]
- 18.Devault D, Chance B. Studies of photosynthesis using a pulsed laser. I. Temperature dependence of cytochrome oxidation rate in Chromatium. Evidence for tunneling. Biophysical Journal. 1966;6:825–847. doi: 10.1016/s0006-3495(66)86698-5. [DOI] [PMC free article] [PubMed] [Google Scholar]
- 19.Hopfield JJ. Electron-transfer between biological molecules by thermally activated tunneling. Proceedings of the National Academy of Sciences of the United States of America. 1974;71:3640–3644. doi: 10.1073/pnas.71.9.3640. [DOI] [PMC free article] [PubMed] [Google Scholar]
- 20.Woodbury NW, Parson WW, Gunner MR, Prince RC, Dutton PL. Radical-Pair Energetics and Decay Mechanisms in Reaction Centers Containing Anthraquinones Naphthoquinones or Benzoquinones in Place of Ubiquinone. Biochimica Et Biophysica Acta. 1986;851:6–22. doi: 10.1016/0005-2728(86)90243-4. 151. [DOI] [PubMed] [Google Scholar]
- 21.Lin X, Williams JC, Allen JP, Mathis P. Relationship between rate and free-energy difference for electron-transfer from cytochrome c2 to the reaction-center in Rhodobacter-sphaeroides. Biochemistry-Us. 1994;33:13517–13523. doi: 10.1021/bi00250a002. [DOI] [PubMed] [Google Scholar]
- 22.Gao JL, Ma SH, Major DT, Nam K, Pu JZ, Truhlar DG. Mechanisms and free energies of enzymatic reactions. Chemical Reviews. 2006;106:3188–3209. doi: 10.1021/cr050293k. [DOI] [PMC free article] [PubMed] [Google Scholar]
- 23.Frey PA, Hegeman AD. Enzymatic Reaction Mechanisms. Oxford University Press; Oxford: 2007. [Google Scholar]
- 24.Hopfield JJ. Nonadiabatic electron tunneling: implications for bacterial photosynthesis and for critical physical tests of the mechanism. In: Chance B, Devault D, Frauenfelder H, Marcus RA, Schrieffer JR, Sutin N, editors. Tunneling in biological systems. Academic Press; New York: 1979. pp. 417–432. [Google Scholar]
- 25.Alric J, Lavergne J, Rappaport F, Vermeglio A, Matsuura K, Shimada K, Nagashima KVP. Kinetic performance and energy profile in a roller coaster electron transfer chain: A study of modified tetraheme-reaction center constructs. Journal of the American Chemical Society. 2006;128:4136–4145. doi: 10.1021/ja058131t. [DOI] [PubMed] [Google Scholar]
- 26.Mowat CG, Chapman SK. Multi-heme cytochromes -new structures, new chemistry. Dalton Transactions. 2005:3381–3389. doi: 10.1039/b505184c. [DOI] [PubMed] [Google Scholar]
- 27.Zhang HB, Osyczka A, Dutton PL, Moser CC. Exposing the complex III Qo semiquinone radical. Biochimica Et Biophysica Acta-Bioenergetics. 2007;1767:883–887. doi: 10.1016/j.bbabio.2007.04.004. 338. [DOI] [PMC free article] [PubMed] [Google Scholar]
- 28.Plato M, Krauss N, Fromme P, Lubitz W. Molecular orbital study of the primary electron donor P700 of photosystem I based on a recent X-ray single crystal structure analysis. Chemical Physics. 2003;294:483–499. [Google Scholar]
- 29.Axelrod HL, Okamura MY. The structure and function of the cytochrome c(2): reaction center electron transfer complex from Rhodobacter sphaeroides. Photosynthesis Research. 2005;85:101–114. doi: 10.1007/s11120-005-1368-8. [DOI] [PubMed] [Google Scholar]
- 30.Axelrod HL, Abresch EC, Okamura MY, Yeh AP, Rees DC, Feher G. X-ray structure determination of the cytochrome c(2): Reaction center electron transfer complex from Rhodobacter sphaeroides. Journal of Molecular Biology. 2002;319:501–515. doi: 10.1016/S0022-2836(02)00168-7. [DOI] [PubMed] [Google Scholar]
- 31.Venturoli G, Drepper F, Williams JC, Allen JP, Lin X, Mathis P. Effects of temperature and Delta G degrees on electron transfer from cytochrome c(2) to the photosynthetic reaction center of the purple bacterium Rhodobacter sphaeroides. Biophysical Journal. 1998;74:3226–3240. doi: 10.1016/s0006-3495(98)78029-4. [DOI] [PMC free article] [PubMed] [Google Scholar]
- 32.Moser CC, Chobot SE, Page CC, Dutton PL. Distance metrics for heme protein electron tunneling. Biochimica Et Biophysica Acta-Bioenergetics. 2008;1777:1032–1037. doi: 10.1016/j.bbabio.2008.04.021. 342. [DOI] [PMC free article] [PubMed] [Google Scholar]
- 33.Tezcan FA, Crane BR, Winkler JR, Gray HB. Electron tunneling in protein crystals. Proc Natl Acad Sci USA. 2001;98:5002–5006. doi: 10.1073/pnas.081072898. [DOI] [PMC free article] [PubMed] [Google Scholar]
- 34.Beratan DN, Betts JN, Onuchic JN. Protein electron-transfer rates set by the bridging secondary and tertiary structure. Science. 1991;252:1285–1288. doi: 10.1126/science.1656523. [DOI] [PubMed] [Google Scholar]
- 35.Miyashita O, Okamura MY, Onuchic JN. Interprotein electron transfer from cytochrome c(2) to photosynthetic reaction center: Tunneling across an aqueous interface. Proceedings of the National Academy of Sciences of the United States of America. 2005;102:3558–3563. doi: 10.1073/pnas.0409600102. [DOI] [PMC free article] [PubMed] [Google Scholar]
- 36.Winkler JR, Di Bilio AJ, Farrow NA, Richards JH, Gray HB. Electron tunneling in biological molecules. Pure Appl Chem. 1999;71:17531764. [Google Scholar]
- 37.Gray HB, Winkler JR. Electron tunneling through proteins. Q Rev Biophys. 2003;36:341–372. doi: 10.1017/s0033583503003913. [DOI] [PubMed] [Google Scholar]
- 38.Casimiro DR, Beratan DN, Onuchic JN, Winkler JR, Gray HB. Donor-acceptor electronic coupling in ruthenium-modified heme proteins. Adv Chem Ser. 1995;246:471–485. [Google Scholar]
- 39.Bowler BE, Meade TJ, Mayo SL, Richards JH, Gray HB. Long-range electron transfer in structurally engineered pentaammineruthenium (histidine-62) cytochrome c. J Am Chem Soc. 1989;111:8757–8759. [Google Scholar]
- 40.Therien MJ, Selman M, Gray HB, Chang IJ, Winkler JR. Long-range electron transfer in ruthenium-modified cytochrome c: evaluation of prophyrin-ruthenium electronic couplings in the Candida krusei and horse heart proteins. J Amer Chem Soc. 1990;112:2420–2422. [Google Scholar]
- 41.Therien MJ, Chang J, Raphael AL, Bowler BE, Gray HB. Long-range electron-transfer in metalloproteins. Structure and Bonding. 1991;75:109–129. [Google Scholar]
- 42.Wuttke DS, Gray HB, Fisher SL, Imperiali B. Semisynthesis of bipyridyl-alanine cytochrome c mutants: novel proteins with enhanced electron transfer properties. J Amer Chem Soc. 1993;115:8455–8456. [Google Scholar]
- 43.Casimiro DR, Richards JH, Winkler JR, Gray HB. Electron-transfer in ruthenium-modified cytochromes-c-sigma-tunneling pathways through aromatic residues. J Phys Chem. 1993;97:13073–13077. [Google Scholar]
- 44.Chang IJ, Gray HB, Winkler JR. High-driving force electron-transfer in metalloproteins --intramolecular oxidation of ferrocytochrome-c by Ru(2,2′-Bpy)2(Im)(His33)3+ J Amer Chem Soc. 1991;113:7056–7057. [Google Scholar]
- 45.Karpishin TB, Grinstaff MW, Komarpanicucci S. Electron-transfer in cytochrome-c depends upon the structure of the intervening medium. Structure. 1994;2:415–422. doi: 10.1016/s0969-2126(00)00043-5. [DOI] [PubMed] [Google Scholar]
- 46.Scott JR, Willie A, McLean M, Stayton PS, Sligar SG, Durham B, Millett F. Intramolecular electron-transfer in cytochrome-b(5) labeled with ruthenium(II) polypyridine complexes-rte measurements in the Marcus inverted region. J Amer Chem Soc. 1993;115:6820–6824. [Google Scholar]
- 47.Willie A, Stayton PS, Sligar SG, Durham B, Millett F. Genetic engineering of redox donor sites: measurement of intracomplex electron transfer between ruthenium-65-cytochrome b5 and cytochrome c. Biochemistry-Us. 1992;31:7237–7242. doi: 10.1021/bi00147a005. [DOI] [PubMed] [Google Scholar]
- 48.Shopes RJ, Levine LMA, Holten D, Wraight CA. Kinetics of Oxidation of the Bound Cytochromes in Reaction Centers from Rhodopseudomonas-Viridis. Photosyn Res. 1987;12:165–180. doi: 10.1007/BF00047946. [DOI] [PubMed] [Google Scholar]
- 49.Dohse B, Mathis P, Wachtveitl J, Laussermair E, Iwata S, Michel H, Oesterhelt D. Electron-Transfer from the Tetraheme Cytochrome to the Special Pair in the Rhodopseudomonas-Viridis Reaction-Center -Effect of Mutations of Tyrosine L162. Biochemistry-Us. 1995;34:11335–11343. doi: 10.1021/bi00036a006. [DOI] [PubMed] [Google Scholar]
- 50.Verkhovsky MI, Jasaitis A, Wikstrom M. Ultrafast haem-haem electron transfer in cytochrome c oxidase. Biochim Biophys Acta. 2001;1506:143–146. doi: 10.1016/s0005-2728(01)00220-1. [DOI] [PubMed] [Google Scholar]
- 51.Zaslavsky D, Sadoski RC, Wang KF, Durham B, Gennis RB, Millett F. Single electron reduction of cytochrome c oxidase compound F: Resolution of partial steps by transient spectroscopy. Biochemistry-Us. 1998;37:14910–14916. doi: 10.1021/bi981490z. [DOI] [PubMed] [Google Scholar]
- 52.Shinkarev VP, Crofts AR, Wraight CA. The electric field generated by photosynthetic reaction center induces rapid reversed electron transfer in the bc(1) complex. Biochemistry-Us. 2001;40:12584–12590. doi: 10.1021/bi011334j. [DOI] [PubMed] [Google Scholar]
- 53.Tian H, Sadoski R, Zhang L, Yu CA, Yu L, Durham B, Millett F. Definition of the interaction domain for cytochrome c on the cytochrome bc(1) complex - Steady-state and rapid kinetic analysis of electron transfer between cytochrome c and Rhodobacter sphaeroides cytochrome bc1 surface mutants. J Biol Chem. 2000;275:9587–9595. doi: 10.1074/jbc.275.13.9587. [DOI] [PubMed] [Google Scholar]
- 54.Lange C, Hunte C. Crystal structure of the yeast cytochrome bc(1) complex with its bound substrate cytochrome c. Proc Natl Acad Sci USA. 2002;99:2800–2805. doi: 10.1073/pnas.052704699. [DOI] [PMC free article] [PubMed] [Google Scholar]
- 55.Mei HK, Wang KF, Peffer N, Weatherly G, Cohen DS, Miller M, Pielak G, Durham B, Millett F. Role of configurational gating in intracomplex electron transfer from cytochrome c to the radical cation in cytochrome c peroxidase. Biochemistry-Us. 1999;38:6846–6854. doi: 10.1021/bi983002t. [DOI] [PubMed] [Google Scholar]
- 56.Davidson VL, Jones LH. Electron transfer from copper to heme within the methylamine dehydrogenase-amicyanin-cytochrome c-551i complex. Biochemistry-Us. 1996;35:8120–8125. doi: 10.1021/bi952854f. [DOI] [PubMed] [Google Scholar]
- 57.Lancaster CRD. Wolinella succinogenes quinol: fumarate reductase - 2.2-A resolution crystal structure and the E-pathway hypothesis of coupled transmembrane proton and electron transfer. Biochim Biophys Acta. 2002;1565:215–231. doi: 10.1016/s0005-2736(02)00571-0. [DOI] [PubMed] [Google Scholar]
- 58.Kroger A, Biel S, Simon J, Gross R, Unden G, Lancaster CRD. Fumarate respiration of Wolinella succinogenes: enzymology, energetics and coupling mechanism. Biochim Biophys Acta. 2002;1553:23–38. doi: 10.1016/s0005-2728(01)00234-1. [DOI] [PubMed] [Google Scholar]
- 59.Langen R, Chang IJ, Germanas JP, Richards JH, Winkler JR, Gray HB. Electron tunneling in proteins: coupling through a beta strand. Science. 1995;268:1733–1735. doi: 10.1126/science.7792598. [DOI] [PubMed] [Google Scholar]
- 60.DiBilio AJ, Hill MG, Bonander N, Karlsson BG, Villahermosa RM, Malmstrom BG, Winkler JR, Gray HB. Reorganization energy of blue copper: Effects of temperature and driving force on the rates of electron transfer in ruthenium- and osmium-modified azurins. J Amer Chem Soc. 1997;119:9921–9922. [Google Scholar]
- 61.Babini E, Bertini I, Borsari M, Capozzi F, Luchinat C, Zhang XY, Moura GLC, Kurnikov IV, Beratan DN, Ponce A, Di Bilio AJ, Winkler JR, Gray HB. Bond-mediated electron tunneling in ruthenium-modified high-potential iron-sulfur protein. J Amer Chem Soc. 2000;122:4532–4533. [Google Scholar]
- 62.Page CC. Physics, vol Ph D. University of Pennsylvania; Philadelphia: 2001. A simple effective model for calculating electron transfer rates in proteins, and an analysis of the evolutionary engineering principles used to create biological electron transfer systems; p. 267. [Google Scholar]
- 63.Langen R, Colon JL, Casimiro DR, Karpishin TB, Winkler JR, Gray HB. Electron tunneling in proteins: Role of the intervening medium. Journal of Biological Inorganic Chemistry. 1996;1:221–225. [Google Scholar]
- 64.Warshel A, Parson WW. Dynamics of biochemical and biophysical reactions: insight from computer simulations. Quarterly Reviews of Biophysics. 2001;34:563–679. doi: 10.1017/s0033583501003730. [DOI] [PubMed] [Google Scholar]
- 65.Marcus RA, Sutin N. Electron Transfers In Chemistry And Biology. Biochim Biophys Acta. 1985;811:265–322. [Google Scholar]
- 66.Gunner MR, Dutton PL. Temperature and -Delta-G-Degrees Dependence of the Electron-Transfer from Bph.- to Qa in Reaction Center Protein from Rhodobacter-Sphaeroides with Different Quinones As Qa. J Amer Chem Soc. 1989;111:3400–3412. [Google Scholar]
- 67.Jortner J. Temperature-Dependent Activation-Energy for Electron-Transfer between Biological Molecules. Journal of Chemical Physics. 1976;64:4860–4867. [Google Scholar]
- 68.Devault D. Quantum-Mechanical Tunnelling in Biological-Systems. Quarterly Reviews of Biophysics. 1980;13:387–564. doi: 10.1017/s003358350000175x. [DOI] [PubMed] [Google Scholar]
- 69.Levich VG, Dogonadze RR. Teoriya bezizluchatelnikh electronnikh perekhodov mezhdu ionami v rastvorakh. Dokl Acad Nauk SSSR. 1959;124:123–126. [Google Scholar]
- 70.Crofts AR, Rose S. Marcus treatment of endergonic reactions: A commentary. Biochimica Et Biophysica Acta-Bioenergetics. 2007;1767:1228–1232. doi: 10.1016/j.bbabio.2007.06.006. [DOI] [PMC free article] [PubMed] [Google Scholar]
- 71.Gunner MR. Biophysics, vol Ph D. University of Pennsylvania; Philadelphia: 1988. The temperature and -DGo dependence on long range electron transfer in reaction center protein from Rhodobacter sphaeroides; p. 163. [Google Scholar]
- 72.Sytina OA, Heyes DJ, Hunter CN, Alexandre MT, van Stokkum IHM, van Grondelle R, Groot ML. Conformational changes in an ultrafast light-driven enzyme determine catalytic activity. Nature. 2008;456:1001–U1089. doi: 10.1038/nature07354. [DOI] [PubMed] [Google Scholar]
- 73.Liu H, Warshel A. Tunnelling does not Contribute Significantly to Enyzme Catalysis, but Studying Temperature Dependence of Isotope Effects is Useful. In: Alleman RK, Scrutton NS, editors. Quantum Tunnelling in Enzyme-Catalysed Reactions. Royal Society of Chemistry; Cambridge: 2009. pp. 242–267. [Google Scholar]
- 74.Meyer MP, Tomchick DR, Klinman JP. Enzyme structure and dynamics affect hydrogen tunneling: The impact of a remote side chain (1553) in soybean lipoxygenase-1. Proceedings of the National Academy of Sciences of the United States of America. 2008;105:1146–1151. doi: 10.1073/pnas.0710643105. [DOI] [PMC free article] [PubMed] [Google Scholar]
- 75.Leys D, Basran J, Talfournier F, Sutcliffe MJ, Scrutton NS. Extensive conformational sampling in a ternary electron transfer complex. Nature Structural Biology. 2003;10:219–225. doi: 10.1038/nsb894. [DOI] [PubMed] [Google Scholar]
- 76.Darrouzet E, Valkova-Valchanova M, Moser CC, Dutton PL, Daldal F. Uncovering the [2Fe2S] domain movement in cytochrome bc(1) and its implications for energy conversion. Proceedings of the National Academy of Sciences of the United States of America. 2000;97:4567–4572. doi: 10.1073/pnas.97.9.4567. 278. [DOI] [PMC free article] [PubMed] [Google Scholar]
- 77.Feng CJ, Kedia RV, Hazzard JT, Hurley JK, Tollin G, Enemark JH. Effect of solution viscosity on intramolecular electron transfer in sulfite oxidase. Biochemistry-Us. 2002;41:5816–5821. doi: 10.1021/bi016059f. [DOI] [PubMed] [Google Scholar]
- 78.Wang HY, Lin S, Allen JP, Williams JC, Blankert S, Laser C, Woodbury NW. Protein dynamics control the kinetics of initial electron transfer in photosynthesis. Science. 2007;316:747–750. doi: 10.1126/science.1140030. [DOI] [PubMed] [Google Scholar]
- 79.Warshel A, Chu ZT, Parson WW. Dispersed Polaron Simulations of Electron-Transfer in Photosynthetic Reaction Centers. Science. 1989;246:112–116. doi: 10.1126/science.2675313. [DOI] [PubMed] [Google Scholar]
- 80.Farrington JA, Land EJ, Swallow AJ. The One-Electron Reduction Potentials of Nad. Biochimica Et Biophysica Acta. 1980;590:273–276. doi: 10.1016/0005-2728(80)90031-6. [DOI] [PubMed] [Google Scholar]
- 81.Carlson BW, Miller LL, Neta P, Grodkowski J. Oxidation of Nadh Involving Rate-Limiting One-Electron Transfer. Journal of the American Chemical Society. 1984;106:7233–7239. [Google Scholar]
- 82.Lu Y, Zhao YX, Handoo KL, Parker VD. Hydride-exchange reactions between NADH and NAD(+) model, compounds under non-steady-state conditions. Apparent and real kinetic isotope effects. Organic & Biomolecular Chemistry. 2003;1:173–181. doi: 10.1039/b208186e. [DOI] [PubMed] [Google Scholar]
- 83.Sinha A, Bruice TC. Rate-Determining General-Base Catalysis in an Obligate Le-Oxidation of a Dihydropyridine. Journal of the American Chemical Society. 1984;106:7291–7292. [Google Scholar]
- 84.Fukuzumi S, Koumitsu S, Hironaka K, Tanaka T. Energetic Comparison between Photoinduced Electron-Transfer Reactions from Nadh Model Compounds to Organic and Inorganic Oxidants and Hydride-Transfer Reactions from Nadh Model Compounds to Para-Benzoquinone Derivatives. Journal of the American Chemical Society. 1987;109:305–316. [Google Scholar]
- 85.Fukuzumi S, Ishikawa M, Tanaka T. Acid-Catalyzed Reduction of Para-Benzoquinone Derivatives by an Nadh Analog, 9,10-Dihydro-10-Methylacridine - the Energetic Comparison of One-Electron Vs 2-Electron Pathways. Journal of the Chemical Society-Perkin Transactions. 1989;2:1811–1816. [Google Scholar]
- 86.Fukuzumi S, Ohkubo K, Tokuda Y, Suenobu T. Hydride transfer from 9-substituted 10-methyl-9,10-dihydroacridines to hydride accepters via charge-transfer complexes and sequential electron-proton-electron transfer. A negative temperature dependence of the rates. Journal of the American Chemical Society. 2000;122:4286–4294. [Google Scholar]
- 87.Pross A. The single electron shift as a fundamental process in organic chemistry: the relationship between polar and electron-transfer pathways. Acc Chem Res. 1985;18:212–219. [Google Scholar]
- 88.Eberson L. Electron transfer reactions in organic chemistry. Springer-Verlag; New York: 1987. [Google Scholar]
- 89.Pinheiro TJT, Venning JD, Jackson JB. Fast hydride transfer in proton-translocating transhydrogenase revealed in a rapid mixing continuous flow device. Journal of Biological Chemistry. 2001;276:44757–44761. doi: 10.1074/jbc.M109227200. [DOI] [PubMed] [Google Scholar]
- 90.Zusman LD, Beratan DN. Two-electron transfer reactions in polar solvents. Journal of Chemical Physics. 1996;105:165–176. [Google Scholar]
- 91.Hammes-Schiffer S, Soudackov AV. Proton-Coupled Electron Transfer in Solution, Proteins, and Electrochemistry. Journal of Physical Chemistry B. 2008;112:14108–14123. doi: 10.1021/jp805876e. [DOI] [PMC free article] [PubMed] [Google Scholar]
- 92.Stuchebrukhov AA. Electron transfer reactions coupled to proton translocation. Cytochrome oxidase, proton pumps, and biological energy transduction. Journal of Theoretical & Computational Chemistry. 2003;2:91–118. [Google Scholar]
- 93.Graige MS, Paddock ML, Bruce JM, Feher G, Okamura MY. Mechanism of proton-coupled electron transfer for quinone (Q(B)) reduction in reaction centers of Rb-sphaeroides. Journal of the American Chemical Society. 1996;118:9005–9016. [Google Scholar]
- 94.Graige MS, Paddock ML, Feher G, Okamura MY. Observation of the protonated semiquinone intermediate in isolated reaction centers from Rhodobacter sphaeroides: Implications for the mechanism of electron and proton transfer in proteins. Biochemistry-Us. 1999;38:11465–11473. doi: 10.1021/bi990708u. [DOI] [PubMed] [Google Scholar]
- 95.Moser CC, Page CC, Dutton PL. Darwin at the molecular scale: selection and variance in electron tunneling proteins including cytochrome c oxidase. Phil Trans Roy Soc B. 2006;361:1295–1305. doi: 10.1098/rstb.2006.1868. [DOI] [PMC free article] [PubMed] [Google Scholar]
- 96.Yoshikawa S, Shinzawa-Itoh K, Nakashima R, Yaono R, Yamashita E, Inoue N, Yao M, Fei MJ, Libeu CP, Mizushima T, Yamaguchi H, Tomizaki T, Tsukihara T. Redox-coupled crystal structural changes in bovine heart cytochrome c oxidase. Science. 1998;280:1723–1729. doi: 10.1126/science.280.5370.1723. [DOI] [PubMed] [Google Scholar]
- 97.Ostermeier C, Harrenga A, Ermler U, Michel H. Structure at 2.7 angstrom resolution of the Paracoccus denitrificans two-subunit cytochrome c oxidase complexed with an antibody F-V fragment. Proceedings of the National Academy of Sciences of the United States of America. 1997;94:10547–10553. doi: 10.1073/pnas.94.20.10547. [DOI] [PMC free article] [PubMed] [Google Scholar]
- 98.Proshlyakov DA, Pressler MA, Babcock GT. Dioxygen activation and bond cleavage by mixed-valence cytochrome c oxidase. Proceedings of the National Academy of Sciences of the United States of America. 1998;95:8020–8025. doi: 10.1073/pnas.95.14.8020. [DOI] [PMC free article] [PubMed] [Google Scholar]
- 99.Petlicki J, van de Ven TGM. The equilibrium between the oxidation of hydrogen peroxide by oxygen and the dismutation of peroxyl or superoxide radicals in aqueous solutions in contact with oxygen. Journal of the Chemical Society-Faraday Transactions. 1998;94:2763–2767. [Google Scholar]
- 100.Verkhovsky MI, Morgan JE, Wikstrom M. Control of Electron Delivery to the Oxygen Reduction Site of Cytochrome-C-Oxidase -a Role for Protons. Biochemistry-Us. 1995;34:7483–7491. doi: 10.1021/bi00022a023. [DOI] [PubMed] [Google Scholar]
- 101.Pilet E, Jasaitis A, Liebl U, Vos MH. Electron transfer between hemes in mammalian cytochrome c oxidase. Proceedings of the National Academy of Sciences of the United States of America. 2004;101:16198–16203. doi: 10.1073/pnas.0405032101. [DOI] [PMC free article] [PubMed] [Google Scholar]
- 102.Adelroth P, Brzezinski P, Malmstrom BG. Internal electron-transfer in cytochrome-c-oxidase from Rhodobacter-sphaeroides. Biochemistry-Us. 1995;34:2844–2849. doi: 10.1021/bi00009a014. [DOI] [PubMed] [Google Scholar]
- 103.Karpefors M, Adelroth P, Namslauer A, Zhen YJ, Brzezinski P. Formation of the “peroxy” intermediate in cytochrome c oxidase is associated with internal proton/hydrogen transfer. Biochemistry-Us. 2000;39:14664–14669. doi: 10.1021/bi0013748. [DOI] [PubMed] [Google Scholar]
- 104.Swallow AJ. Physical chemistry of semiquinones. In: Trumpower BL, editor. Function of Quinones in Energy conserving systems. Chapter 3. Academic Press, Inc.; New York: 1982. pp. 59–72. [Google Scholar]
- 105.Zhu ZY, Gunner MR. Energetics of quinone-dependent electron and proton transfers in Rhodobacter sphaeroides photosynthetic reaction centers. Biochemistry-Us. 2005;44:82–96. doi: 10.1021/bi048348k. [DOI] [PubMed] [Google Scholar]
- 106.Wraight CA. Functional Linkage Between the QA and QB sites of Photosynthetic Reaction Centers. In: Garab G, editor. Proceedings of the 11th International Photosynthesis Conference; Dordrecht, The Netherlands: Kluwer; 1998. pp. 693–698. [Google Scholar]
- 107.Anderson RF. Energetics of the One-Electron Reduction Steps of Riboflavin, Fmn and Fad to Their Fully Reduced Forms. Biochimica Et Biophysica Acta. 1983;722:158–162. doi: 10.1016/0005-2728(83)90169-x. [DOI] [PubMed] [Google Scholar]
- 108.Draper RD, Ingraham LL. A Potentiometric Study of Flavin Semiquinone Equilibrium. Archives of Biochemistry and Biophysics. 1968;125:802–808. doi: 10.1016/0003-9861(68)90517-1. [DOI] [PubMed] [Google Scholar]
- 109.Grodkowski J, Neta P, Carlson BW, Miller L. One-Electron Transfer-Reactions of the Couple Nad./Nadh. Journal of Physical Chemistry. 1983;87:3135–3138. [Google Scholar]