Abstract
Ca2+ flux across the mitochondrial inner membrane regulates bioenergetics, cytoplasmic Ca2+ signals and activation of cell death pathways1–11. Mitochondrial Ca2+ uptake occurs at regions of close apposition with intracellular Ca2+ release sites 12–14, driven by the inner membrane voltage generated by oxidative phosphorylation and mediated by a Ca2+ selective ion channel (MiCa15) called the uniporter16–18 whose complete molecular identity remains unknown. Mitochondrial calcium uniporter (MCU) was recently identified as the likely ion-conducting pore19, 20. In addition, MICU1 was identified as a mitochondrial regulator of uniporter-mediated Ca2+ uptake in HeLa cells 21. Here we identified CCDC90A, hereafter referred to as MCUR1 (Mitochondrial Calcium Uniporter Regulator 1), an integral membrane protein required for MCU-dependent mitochondrial Ca2+ uptake. MCUR1 binds to MCU and regulates ruthenium red-sensitive MCU-dependent Ca2+ uptake. MCUR1 knockdown does not alter MCU localization, but abrogates Ca2+ uptake by energized mitochondria in intact and permeabilized cells. Ablation of MCUR1 disrupts oxidative phosphorylation, lowers cellular ATP, and activates AMP kinase-dependent pro-survival autophagy. Thus, MCUR1 is a critical component of a mitochondrial uniporter channel complex required for mitochondrial Ca2+ uptake and maintenance of normal cellular bioenergetics.
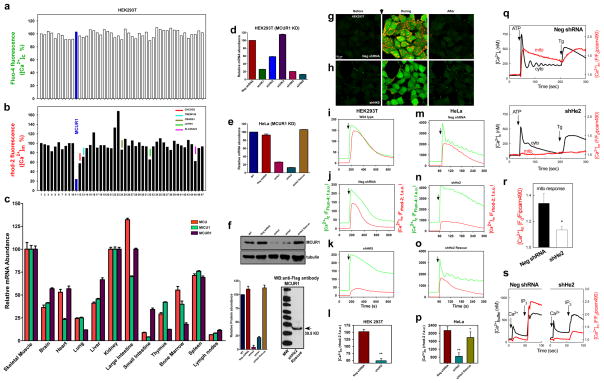
To identify genes important for mitochondrial Ca2+ uptake, we performed a directed human RNAi screen of 45 mitochondrial membrane proteins in HEK293T cells predicted or reported to be integral mitochondrial inner membrane proteins, or with previously-proposed roles in mitochondrial Ca2+ regulation (Supplementary Tables S1 – S3). 96 hr after transfection with pools of 3 siRNAs targeting each gene, cytoplasmic (Fluo-4) and mitochondrial (rhod-2) [Ca2+] were simultaneously imaged by confocal microscopy 22–24. To rapidly elevate cytoplasmic Ca2+ ([Ca2+]c) (Fig. 1a) to trigger mitochondrial Ca2+ uptake, either a Ca2+ ionophore, ionomycin, was employed at a concentration that enhanced plasma membrane Ca2+ permeability while leaving mitochondrial membranes intact, or stimulation by an InsP3-linked agonist was used (Supplementary Fig. S1a-c and Movie S1). siRNA against most genes had no effect on mitochondrial Ca2+ uptake (Fig. 1b). Some siRNAs caused a modest reduction, including those targeted to MICU1 21, CHCHD3, TMEM186, LETM1 25 and SL25A23. Although MCU was not included in the original screen, we validated the screening methodology by demonstrating that MCU knockdown abrogated mitochondrial Ca2+ uptake (Supplementary Fig. S1d). Of the 45 genes, RNAi against only one, coiled-coil domain containing 90A (CCDC90A), a previously undescribed protein that we hereafter call Mitochondrial Calcium Uniporter Regulator 1 (MCUR1), was found to markedly inhibit mitochondrial Ca2+ uptake (Fig. 1a,b). Similar results were observed in human primary fibroblasts treated with MCUR1 siRNA (Supplementary Fig. S2a–d). MCUR1 is ubiquitously expressed in mammalian tissues, similar to MCU and MICU1 (Fig. 1c).
Figure 1. RNAi screen identifies MCUR1 as a regulator of mitochondrial Ca2+ uptake.
Changes in 293T cell cytoplasmic (a) and mitochondrial (b) [Ca2+] in response to ionomycin (2.5 μM) were simultaneously measured by fluo-4 and rhod-2 imaging, respectively. Each bar represents one target gene silenced with pooled siRNA. (c) qRT-PCR of MCU, MCUR1 and MICU1 mRNA from mouse tissues (n=3; mean ± s.e.m). (d) qRT-PCR of MCUR1 mRNA from 293T cell clones (n=3; mean ± s.e.m). (e) qRT-PCR of MCUR1 mRNA from HeLa cell clones and of rescued MCUR1 mRNA levels in shHe2 clone (n=3; mean ± s.e.m). The same lentiviral shRNAs were used to generate shHK4 and shHe1 and shHK5 and shHe2, respectively. (f) (Top) MCUR1 protein expression levels and densitometric analysis (n=3; ± s.e.m.). (Bottom) Flag-tagged MCUR1 protein expression in clone shHe2 cells reconstituted with shRNA resistant MCUR1 cDNA plasmid. (g and h) Representative images from movies of HEK 293T NegshRNA or shHK5 cells showing cytosolic (green) and mitochondrial (red) [Ca2+] before (left), during (middle) and after (right) ionomycin exposure. Scale bar: 20 μm. (i–p) Cytoplasmic (green) and mitochondrial matrix (red) [Ca2+] responses in 293T (i–l) and HeLa (m–p) cells challenged with ionomycin or histamine (100 μM), respectively. (n=3) (i) Wild-type 293T cells. (j) Cells expressing negative shRNA. (k) Clone shHK5 (n=4). (l) Quantification of peak rhod-2 fluorescence. **P < 0.01 (mean ± s.e.m.). (m) HeLa cells expressing negative shRNA. (n) Clone shHe2. (o) Clone shHe2 re-expressing MCUR1 (n=3). (p) Quantification of peak rhod-2 fluorescence. *P < 0.05, **P < 0.01 (mean ± s.e.m.). (q) [Ca2+]c and [Ca2+]m signals evoked by ATP (100 μM) and thapsigargin (Tg, 2 μM) were monitored simultaneously using fura2/AM and mtipcam, respectively in control (upper) and MCUR1 KD (middle) HeLa cells. [Ca2+]c calibrated in nM (black), whereas mtipcam fluorescence is inversely normalized to baseline (F0/F) (red). (r) Summary mean [Ca2+]c and [Ca2+]m peaks during ATP stimulation (negShRNA n=29; MCUR1 KD n=36 cells,. *P < 0.05 (mean ± s.e.m.). (s) Increase in bath [Ca2+] (Rfura2) and [Ca2+]m (Rmipcam) signals in response to CaCl2 (1 μM) and IP3 (7.5 μM) addition in permeabilized cells.
To confirm this result, five lentiviral shRNA constructs that targeted different regions of the MCUR1 gene (Supplementary Table S2) were used to create stable HeLa and 293T cell lines with MCUR1 knocked down by 42 to 87 % among different clones by quantitative PCR (qRT-PCR) (Fig. 1d,e). Two HEK293T cell clones with 80% and 87% MCUR1 mRNA knockdown (shHK4 and shHK5, respectively) and two HeLa cell clones with 74% and 87% mRNA knockdown (shHe1 and shHe2, respectively, with >75% and 95% reduced protein expression, respectively (Fig. 1f) were used for more detailed analyses of mitochondrial Ca2+ uptake and cellular bioenergetics. Stable knockdown of MCUR1 in HEK293T cell clone shHK5 strongly abrogated the [Ca2+]m rise (Fig. 1h,k,l; see Supplementary Movie S1- negative shRNA, Supplementary Movie S2- shHK4 and Supplementary Movie S3- shHK5), in contrast to normal responses in wild-type cells (Fig. 1i) and cells expressing a negative shRNA (Fig. 1g,j,l). Histamine triggered similar inositol trisphosphate (InsP3)-mediated [Ca2+]c elevations in both negative shRNA (Fig. 1m) and MCUR1 knockdown (KD) HeLa cells (clone shHe2) (Fig. 1n), whereas mitochondrial Ca2+ uptake was significantly diminished in MCUR1 KD cells (Fig. 1n,p). Although compartmentalized rhod-2 has been widely used to measure [Ca2+]m in intact cells (e.g. 1, 8, 26), to assure specificity of the fluorescent signal [Ca2+]m was also recorded by a Ca2+ sensing fluorescent protein, inverse pericam, genetically targeted to the mitochondria (mitopericam). These studies showed that the ATP-induced [Ca2+]m signal was selectively suppressed in intact MCUR1 KD HeLa cells (Fig. 1q,r). Furthermore, the IP3-induced [Ca2+]m rise was also attenuated in MCUR1 KD permeabilized cells (Fig. 1s). To confirm the target specificity of MCUR1 shRNA, a rescue experiment was performed in HeLa shHe2 cells using a MCUR1 cDNA with four silent point mutations in the shRNA target region and a Flag epitope (DDK tag). Stable expression of the rescue cDNA construct in HeLa clone shHe2 restored MCUR1 mRNA levels (Fig. 1e) and enhanced MCUR1 protein expression (Fig. 1f). Importantly, normal mitochondrial Ca2+ uptake was restored in the MCUR1 rescue cells (Fig. 1o,p). These results indicate that MCUR1 plays an important role in mitochondrial Ca2+ uptake.
Mitochondrial Ca2+ uptake is driven primarily by the mitochondrial inner membrane voltage (Ψm), maintained by the electron transport chain and oxidative phosphorylation. Knockdown of MCUR1 did not alter ΔΨm in intact or permeabilized HeLa cells (Supplementary Fig. S2e–g), nor did it alter mitochondrial DNA copy number (Supplementary Fig. S2h). Importantly, knockdown of MCUR1 expression was without effect on the normal mitochondrial localization of MCU (Supplementary Fig. S2i). Notably, MCU mRNA and protein levels were upregulated in cells with MCUR1 knocked down (Supplementary Fig. S2j–l). Thus, MCUR1 is not required for MCU expression or localization. Collectively, these results suggest that MCUR1 plays a regulatory role in MCU-dependent mitochondrial Ca2+ uptake.
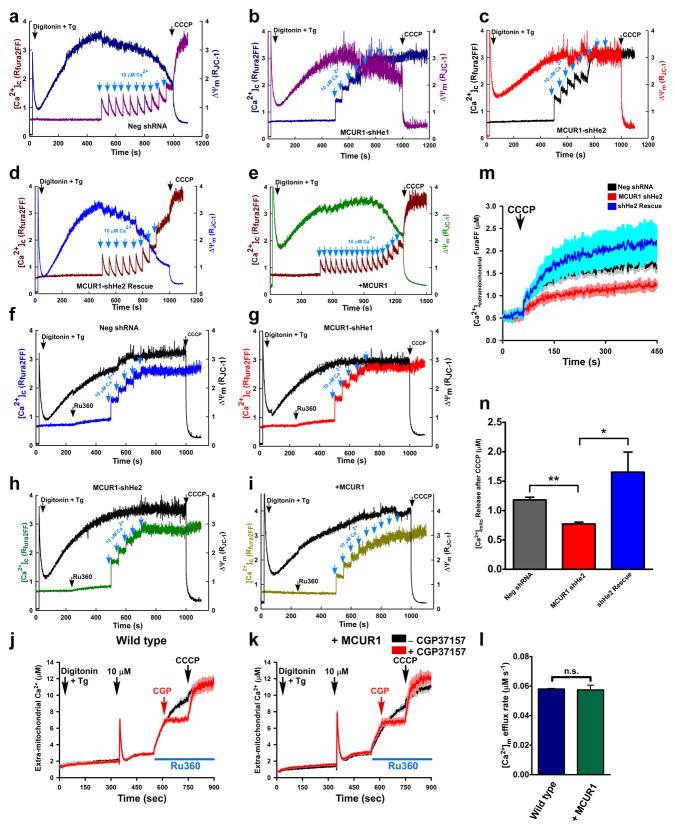
To explore this further, the effects of MCUR1 knockdown on mitochondrial Ca2+ uptake and ΔΨm were examined in digitonin-permeabilized cells that were bathed in intracellular-like medium containing thapsigargin (Tg) to prevent ER Ca2+ uptake, Fura2FF to monitor [Ca2+] in the medium and JC-1 to monitor ΔΨm. In response to Ca2+ added to the medium, energized mitochondria rapidly reduce medium [Ca2+] by Ru360- and CCCP-sensitive uptake that causes inner membrane depolarization (Fig. 2a,f). In permeabilized 293T cells expressing negative shRNA, mitochondria rapidly cleared multiple pulses of externally added 10 μM Ca2+ (Supplementary Fig. S3a). In contrast, both MCUR1 KD clones shHK4 and shHK5 demonstrated nearly complete inhibition of external Ca2+ clearance (Supplementary Fig. S3b). MCUR1 cloneshHK2 displayed intermediate ability to take up external Ca2+, correlated with the intermediate level of MCUR1 knockdown in these cells (Supplementary Fig. S3b). Addition of 10 μM Ca2+ boluses triggered rapid mitochondrial Ca2+ uptake that caused small inner membrane depolarization in negative shRNA HeLa cells (Fig. 2a). In contrast, cells with MCUR1 knocked down (Fig. 2b,c) demonstrated strong inhibition of mitochondrial Ca2+ uptake without depolarization. Reconstitution of MCUR1 in HeLa clone shHe2 cells restored mitochondrial Ca2+ uptake and consequent inner membrane depolarization (Fig. 2d). To establish further that MCUR1 facilitates mitochondrial Ca2+ uptake, HeLa cells stably over-expressing MCUR1were generated. MCUR1-overexpressing cells were able to clear more cytosolic Ca2+ pulses compared with negative shRNA HeLa cells (Fig. 2e), without altering CGP37157-sensitive Na+/Ca2+ exchanger mediated Ca2+ efflux rate (Fig. 2j–l). To determine if MCUR1-dependent mitochondrial Ca2+ uptake is mediated by MCU, we used the MCU blocker Ru360. Ru360 inhibited mitochondrial Ca2+ uptake in plasma membrane-permeabilized cells in response to bath addition of boluses of Ca2+ in cells over-expressing MCUR1 as well as in control cells and cells with MCUR1 knocked down (Fig. 2f–i). Furthermore, basal mitochondrial matrix Ca2+ was reduced in MCUR1 KD cells (Fig. 2m,n). Together, these data strongly implicate MCUR1 in the mechanism of uniporter-mediated mitochondrial Ca2+ uptake.
Figure 2. MCUR1 is required for Ru360 sensitive mitochondrial Ca2+ uptake but independent of mitochondrial Ca2+ efflux pathway.
Digitonin-permeabilized HeLa cells bathed in intracellular-like solution containing thapsigargin (Tg) were loaded with the ΔΨm indicator JC-1 and the Ca2+ indicator Fura2FF, to which pulses of 10 μM Ca2+ were added before addition of mitochondrial uncoupler CCCP (carbonyl cyanide m-chloro phenyl hydrazone). Representative traces from three independent experiments depict simultaneous changes of bath [Ca2+] and ΔΨm in (a) cells expressing negative shRNA, (b) clone shHe1(c) clone shHe2, (d) clone shHe2 re-expressing MCUR1, and (e) HeLa cells stably over-expressing MCUR1. Under similar conditions, 1 μM Ru360 was added before 10 μM Ca2+ pulses until addition of mitochondrial uncoupler CCCP. Representative traces from three independent experiments depict simultaneous changes of bath [Ca2+] and ΔΨm in (f) Negative shRNA cells, (g) MCUR1 knockdown clone shHe1 and (h) shHe2, and (i) in control cells over-expressing MCUR1. Neg shRNA (j) and MCUR1 overexpressing (k) HEK 293T cells were permeabilized with digitonin in intracellular-like medium containing thapsigargin (Tg) and bath [Ca2+] indicator Fura FF, and then pulsed with 10 μM Ca2+. After mitochondrial clearance of bath Ca2+, Ru360 caused elevation of bath [Ca2+], indicating that steady-state bath [Ca2+] after pulse was maintained by balance of MCU-mediated Ca2+ uptake and CGP37157 (10 μM)-sensitive Na+-Ca2+ exchanger-mediated extrusion. CCCP added as indicated. Solid line is mean; shaded areas are ± s.e.m. (n=3). (l) [Ca2+]m efflux rate derived from (j) and (k) during initial 60 s following Ru360 addition (n.s.; not significant, (n=3)). (m) HEK 293T cells stably expressing negative shRNA or MCUR1 shRNA (clone shHe2) and clone ShHe2 re-expressing MCUR1 cells were permeabilized with digitonin in intracellular-like medium containing bath [Ca2+] indicator Fura FF. CCCP added as indicated. Traces show bath [Ca2+] (μM). (solid lines are mean; shaded regions are ± s.e.m. (n= 3). (n) Quantification of total mitochondrial Ca2+ released after CCCP addition. *P < 0.05, **P < 0.01 (mean ± s.e.m).
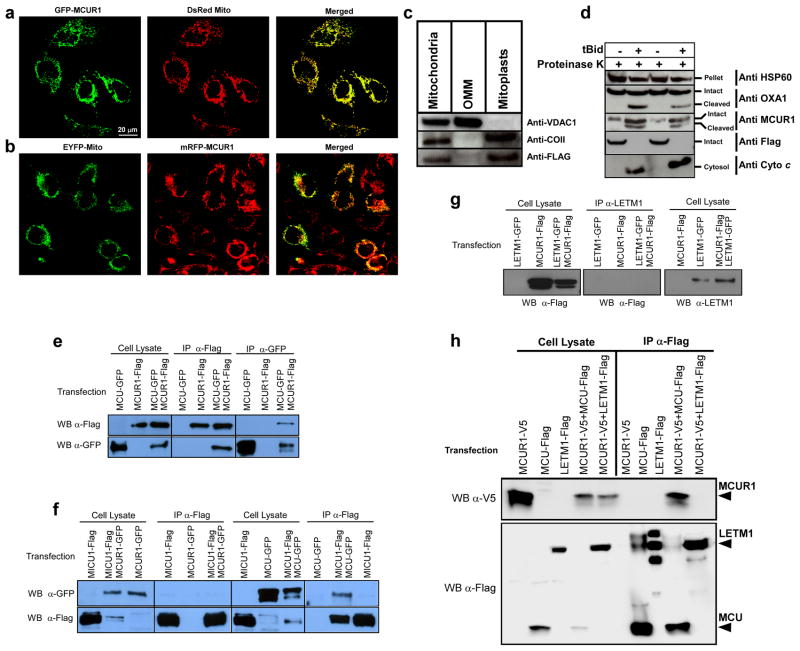
Co-expression of carboxyl-terminus GFP-tagged MCUR1 and DsRed Mito, or carboxyl-terminus mRFP-tagged MCUR1 and EYFP-Mito confirmed the mitochondrial localization of MCUR1 (Fig. 3a,b). The membrane localization of MCUR1 was evaluated by sub-cellular fractionation followed by mitochondrial sub-fractionation. In Western blots, anti-Flag antibody detected a band with the expected apparent molecular weight of MCUR1 (~40 kD) that was highly enriched in HeLa cell mitoplasts (Fig. 3c). Most hydropathy analyses suggest that MCUR1 contains two transmembrane helices, with a ~60-residue amino-terminus and a carboxyl terminus predicted to contain only a couple of amino acids projecting into the same compartment. The membrane topology of MCUR1 was investigated by Proteinase K treatment of plasma membrane permeabilized (digitonin) cells. Permeabilized cells were incubated with truncated Bid (tBid) to selectively permeabilize the outer mitochondrial membrane. After OMM permeabilization, samples were challenged with Proteinase K. Membrane fractions were solubilized and subjected to western blot analysis. A mitochondrial matrix protein, HSP60, was protected from Proteinase K digestion (Fig. 3d). In contrast, the inner mitochondrial integral membrane protein OXA1 as well as MCUR1 were cleaved (Fig. 3d). Proteinase K produced a truncated MCUR1 fragment ~ 6 kD smaller than the full-length protein, consistent with loss of the amino-terminal fragment proximal to the first transmembrane helix. Further, loss of the FLAG-tag by Proteinase K treatment suggests that the carboxyl-terminal end of MCUR1 also faces the cytosolic side. These results suggest that the amino-and the predicted short carboxyl-termini could be exposed to the inter-membrane space, consistent with the presence of two transmembrane spanning regions with most of the protein present in the matrix.
Figure 3. Mitochondrial inner membrane localization and topology of MCUR1 and its interaction with MCU.
Confocal images of HeLa cells transiently co-transfected for 48 hrs with (a) GFP-tagged MCUR1 and DsRed Mito plasmids or (b) mRFP-tagged MCUR1 and EYFP-Mito. Scale bar: 20 μm. (c) Immunoblot analysis of Flag-tagged MCUR1 in HeLa cell crude mitochondrial fraction, outer mitochondrial membrane (OMM) and mitoplasts, using antibodies against VDAC1 (OMM protein), COII (integral membrane marker) and Flag. (d) Immunoblot analyses of mitochondria-containing pellet and cytosolic fractions from plasma membrane-permeabilized HeLa cells. Permeabilized cells were treated with or without tBid (50 nM) for outer mitochondrial membrane (OMM) permeabilization and appearance of cytosolic cytochrome c was verified. Intact and OMM permeabilized samples were exposed to Proteinase K for 10 min. These samples were probed using antibodies against HSP60, OXA1, Flag and MCUR1. (e) Reciprocal co-immunoprecipitation of MCU-GFP and MCUR1-Flag transiently expressed in COS7 cells. Representative of four independent experiments. (f) Co-immunoprecipitation of MICU1-Flag with MCU-GFP but not with MCUR1-GFP transiently expressed in COS7 cells. Representative of four independent experiments. (g) Immunoprecipitation of LETM1-GFP with anti-LETM1 failed to pull down MCUR1-Flag in transiently-transfected COS7 cells. (h) Immunoprecipitation with Flag antibody pulled down LETM1-Flag or MCU-Flag transiently expressed in COS7 cells (IP lanes 2 and 3, lower panel), but only co-immunoprecipitated MCUR1-V5 in the MCU-Flag expressing cells (IP lanes 4 vs 5, upper panel), despite lower expression of MCU-Flag in MCUR1-cotransfected cells (compare MCU-Flag and LETM1-Flag expression in MCUR1-cotransfected cells in lysate lanes 4 and 5, bottom panel). Representative of three independent experiments.
MCU, MICU1 and MCUR1 are targeted to mitochondria and regulate mitochondrial Ca2+ uptake. MICU1 physically associates with MCU 19. To determine whether MCUR1 similarly interacts with MCU, Flag-tagged MCUR1 and GFP-tagged MCU were co-expressed and precipitated with Flag or GFP antibodies and immunoblotted with the reciprocal antibodies. MCUR1 was able to pull down MCU, and vice versa (Fig. 3e). In contrast MCUR1 and MICU1 did not interact, although we could confirm the interaction of MICU1 and MCU (Fig. 3f). Immunoprecipitation of ectopically expressed coiled-coil domain containing inner mitochondrial membrane protein LETM1 failed to pull down MCUR1-Flag (Fig. 3g) whereas anti-Flag immunoprecipitation of MCU-Flag but not LETM1-Flag co-immunoprecipitated MCUR1-V5 (Fig. 3h and Supplementary Fig. S4c). Further, immunoprecipitation of MCUR1, MCU or MICU1 did not pull down endogenous inner membrane proteins OXA1 or COXIV (Supplementary Fig. S4a). Of note, the results in Fig. 3e and f suggest that MCU exists in a complex with either MICU1 or MCUR1, but not both simultaneously. To examine this further, we transiently-expressed all three tagged proteins, and immunoprecipitated V5-tagged MCUR1. MCUR1 pull-down co-immunoprecipitated MCU but not MICU1 (Supplementary Fig. S4b), suggesting that the three proteins do not exist in one complex under the conditions of our experiments. Together, these results demonstrate thatMCUR1 physically associates with MCU and is necessary for MCU-mediated mitochondrial Ca2+ uptake.
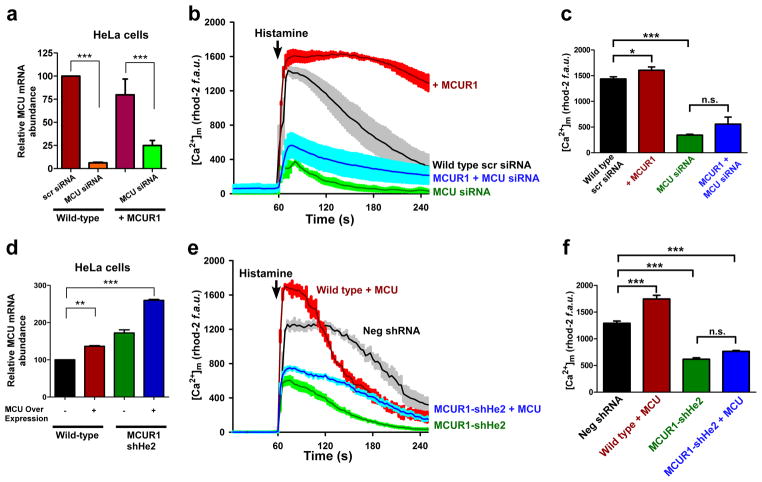
To confirm this further, we examined the dependence of MCUR1-mediated mitochondrial Ca2+ uptake on MCU. We first confirmed the requirement of MCU for histamine-induced mitochondrial Ca2+ uptake by examining cells with MCU knocked down (Fig. 4). Histamine-stimulated mitochondrial Ca2+ uptake was markedly enhanced in cells stably over-expressing MCUR1 (Fig. 4b,c). However, knockdown of MCU (Fig. 4a) strongly blunted this MCUR1-enhanced Ca2+ uptake (Fig. 4b, c). We next examined whether over-expression of MCU could restore mitochondrial Ca2+ uptake in cells with MCUR1 knocked down. MCU overexpression enhanced mitochondrial Ca2+ uptake in wild-type- but not in MCUR1-knockdown HeLa cells (Fig. 4d–f). Thus, both MCU and MCUR1 expression are required for efficient mitochondrial uniporter-mediated Ca2+ uptake.
Figure 4. MCUR1 is essential for MCU-dependent mitochondrial Ca2+ uptake.
(a) qRT-PCR of MCU mRNA from wild type and stable MCUR1 over-expressing HeLa cells that were transiently transfected with scrambled siRNA or siRNA against MCU. ***P < 0.001 (mean ± s.e.m). (b) [Ca2+]m responses to histamine (100 μM) in HeLa cells stably over-expressing MCUR1 and in cells transiently transfected with scrambled siRNA or MCU siRNA, and in stable MCUR1 over-expressing HeLa cells transfected with MCU siRNA. After 48 hr of siRNA transfection, cells were loaded with rhod-2 and [Ca2+]m responses were visualized by confocal microscopy. (solid lines are mean; shaded regions are ± s.e.m.; n= 3). (c) Quantification of peak rhod-2 fluorescence following histamine stimulation. *P < 0.05, ***P < 0.001 (mean ± s.e.m; n=3). (d) qRT-PCR of MCU mRNA from wild type and MCUR1 knockdown HeLa cells that were transiently transfected with MCU cDNA. **P < 0.01, ***P < 0.001 (mean ± s.e.m.; n=3). (e) [Ca2+]m responses to histamine (100μM) in wild-type and MCUR1 (shHe2) knockdown HeLa cells over-expressing MCU. Negative shRNA and MCUR1-shHe2 cells were used as controls. (solid lines are mean; shaded regions are ± s.e.m.; n= 3). (f) Quantification of peak rhod-2 fluorescence following histamine stimulation. ***P < 0.001 (mean ± s.e.m; n=3).
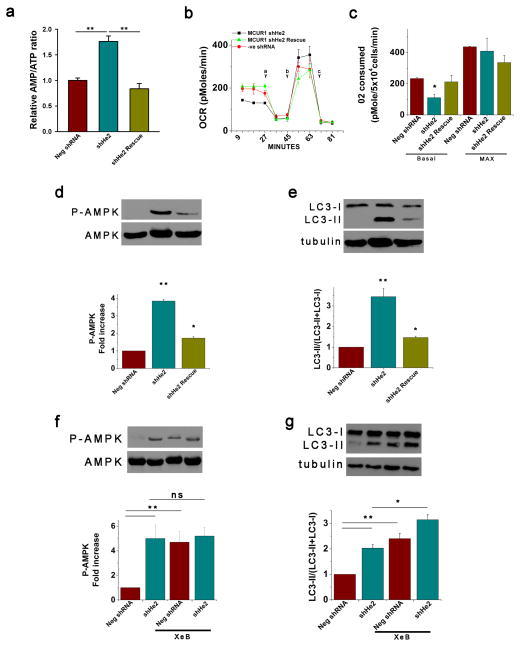
Mitochondrial uniporter uptake of constitutively released Ca2+ from the ER is essential for regulation of optimal cellular bioenergetics by providing sufficient reducing equivalents to support oxidative phosphorylation27. Absence of this Ca2+ transfer results in reduced O2 consumption and ATP levels and activation of AMP kinase (AMPK) that activates pro-survival macroautophagy27. As a distinct approach to evaluate the role of MCUR1 in mitochondrial Ca2+ uptake, we measured bioenergetic parameters in control and MCUR1 knockdown 293T and HeLa cells. The AMP/ATP ratio was enhanced by ~2-fold in stable MCUR1 knockdown cells compared with negative shRNA HeLa cells, which was rescued by re-expression of shRNA resistant MCUR1 (Fig. 5a). In both HeLa and 293T cells, stable (Fig. 5 and Supplementary Fig. S5a–d) or transient (Supplementary Fig. S5e–j) knockdown of MCUR1 reduced basal O2 consumption rates (Fig. 5b,c; Supplementary Fig. S5a,b,g,j), reflecting diminished oxidative phosphorylation; caused constitutive activation of AMPK (Fig. 5d,f; Supplementary Fig. S5c, f,i); and induced macroautophagy (Fig. 5e,g; Supplementary Fig. S5d,e,h). These phenotypes were not observed in negative shRNA cells. Importantly, they were reversed to control levels by re-expression of MCUR1 (Fig. 5a–e). Of note, they are similar to the effects elicited by stable knockdown of MCU in HeLa cells (Supplementary Fig. S5k). These bioenergetic abnormalities observed in cells with strongly reduced MCUR1 expression are highly reminiscent of those induced by inhibition of InsP3 receptor (InsP3R)- and uniporter-dependent ER Ca2+ transfer to mitochondria 27. The metabolic effects of InsP3R and uniporter inhibition were previously observed to be non-additive 27. Although autophagy activation observed in stable MCUR1 knockdown HeLa cells was slightly potentiated by xestospongin B (XeB) inhibition of InsP3R activity (Fig. 5g) (as was also the case in stable MCU knockdown cells; Supplementary Fig. S5k), activation of AMPK (HeLa: Fig. 5f and Supplementary Fig. S5i; 293T: Supplementary Fig. S5f) and autophagy (HeLa: Supplementary Fig. S5h; HEK293T, Supplementary Fig. S5e) by transient MCUR1 knockdown were not potentiated. These independent results also suggest that MCUR1 is an important component of the molecular machinery associated with the mitochondrial uniporter-mediated Ca2+ uptake mechanism.
Figure 5. MCUR1 is required for maintenance of cellular bioenergetics.
(a) AMP/ATP ratios in stable HeLa cell lines stably expressing negative shRNA, MCUR1 shRNA (clone shHe2) or ShHe2 with MCUR1 re-expressed. **P < 0.01 (mean ± s.e.m.; n=3). (b) O2 consumption rates (OCR) in stable HeLa cells expressing irrelevant shRNA, clone ShHe2, and clone ShHe2 re-expressing MCUR1, exposed sequentially to (a) oligomycin, (b) FCCP, and (c) rotenone plus myzothiazol. (c) Basal and maximal OCR in cells as described in (B). *P < 0.05 (mean ± s.e.m.; n=3). (d) Western blot of phosphorylated and total AMPK (top) and densitometric analysis (bottom) in stable HeLa lines expressing negative shRNA or MCUR1 shRNA (clone sheHe2) and clone shHe2 re-expressing MCUR1. *P < 0.05, **P < 0.01 (mean ± s.e.m.; n=3). (e) Western blot of LC3 or tubulin in stable HeLa lines expressing negative shRNA or MCUR1 shRNA (clone sheHe2) and clone ShHe2 re-expressing MCUR1 (top) and quantification of LC3-II/(LC3-I + LC3-II) (bottom) expressed as fold increase over levels in cells expressing irrelevant shRNA. *P < 0.05, **P < 0.01 (mean ± s.e.m.; n=3). (f and g), as in (d and e). Activation of AMPK (f) and autophagy (**P < 0.001; mean ± s.e.m.; n=3) (g) in absence and presence of InsP3R inhibitor Xestospongin B (XeB). *P < 0.05, **P < 0.001, ns = not significant (mean ± s.e.m.; n=3).
In summary, our results demonstrate that the previously unstudied MCUR1 is essential for mitochondrial uniporter-mediated Ca2+ uptake. In the absence of sufficient MCUR1 expression, mitochondrial Ca2+ uptake is strongly blunted in both stimulated and basal conditions. The latter results in compromised cellular bioenergetics as a consequence of diminished oxidative phosphorylation that results in the activation of pro-survival autophagy. The effects of MCUR1 knockdown on Ca2+ uptake and mitochondrial bioenergetics were observed here in two cell lines, suggesting that MCUR1 plays a general role in regulating mitochondrial Ca2+ uptake. Inhibition of mitochondrial Ca2+ uptake by MCUR1 knockdown did not cause mis-localization or lower expression of MCU, suggesting that MCUR1 plays a direct role in uniporter-mediated Ca2+ uptake, possibly by a direct interaction with MCU that is required for MCU to function as the uniporter channel pore. Identification of MICU1 and MCUR1 as regulators of Ca2+ uptake suggests that the mitochondrial Ca2+ channel may consist of a complex of proteins associated with a Ca2+ permeable pore subunit, likely MCU 19, 20. Enhanced total Ca2+ uptake in cells with MCUR1 over-expressed may be caused by increased MCU activity, although further studies are needed to understand the MCUR1 role in mitochondrial Ca2+ buffering. Reconstitution of purified MCU into planar lipid bilayers was associated with the appearance of small conductance Ca2+ channels20. However, the properties were not completely similar to those of the uniporter recorded in situ by patch clamp electrophysiology of mitoplasts15, nor were they recorded under physiological ionic conditions. Thus, although MCU was shown to form a Ca2+ channel in the absence of other proteins in vitro, our results suggest that it requires MCUR1 to function in mitochondrial membranes. The discovery of MCUR1 as an integral component of the mitochondrial Ca2+ uptake machinery provides a new target for regulation of Ca2+ signaling related to signal transduction, bioenergetics, and cell survival and death.
METHODS
Methods and any associated references are available in the online version of the paper at http://www.nature.com/naturecellbiology
Supplementary Material
Acknowledgments
This work was supported by the National Institutes of Health grants R01 HL086699, HL086699-01A2S1 and 1S10RR027327-01 to MM, and GM56328 to JKF. CC was supported by an award from the American Heart Association.
Footnotes
Note: Supplementary Information is available on the Nature Cell Biology website
Author Contributions
K.M., M.M. and J.K.F. designed the project. K.M., C.C., P.J.D., H.C.C., K.M.I., P.M., J.Y., M.M., T.G., G.C. and R.M. performed the experimental work. K.M., C.C., P.J.D, H.C.C., K.M.I. and M.M. analyzed the results. G.H. and G.C. designed the mitopericam experiments and interpreted the results. J.E.K. and B.K. performed mtDNA analysis. J.M. contributed reagents. K.M. M.M. and J.K.F. wrote the manuscript. All authors discussed the results and commented on the manuscript.
COMPETING FINANCIAL INTERESTS The authors declare no competing financial interests.
References
- 1.Hajnoczky G, Robb-Gaspers LD, Seitz MB, Thomas AP. Decoding of cytosolic calcium oscillations in the mitochondria. Cell. 1995;82:415–424. doi: 10.1016/0092-8674(95)90430-1. [DOI] [PubMed] [Google Scholar]
- 2.Orrenius S, Zhivotovsky B, Nicotera P. Regulation of cell death: the calcium-apoptosis link. Nat Rev Mol Cell Biol. 2003;4:552–565. doi: 10.1038/nrm1150. [DOI] [PubMed] [Google Scholar]
- 3.Denton RM, McCormack JG. The role of calcium in the regulation of mitochondrial metabolism. Biochem Soc Trans. 1980;8:266–268. doi: 10.1042/bst0080266. [DOI] [PubMed] [Google Scholar]
- 4.Balaban RS. The role of Ca(2+) signaling in the coordination of mitochondrial ATP production with cardiac work. Biochim Biophys Acta. 2009;1787:1334–1341. doi: 10.1016/j.bbabio.2009.05.011. [DOI] [PMC free article] [PubMed] [Google Scholar]
- 5.Gunter KK, Gunter TE. Transport of calcium by mitochondria. J Bioenerg Biomembr. 1994;26:471–485. doi: 10.1007/BF00762732. [DOI] [PubMed] [Google Scholar]
- 6.Duchen MR, Verkhratsky A, Muallem S. Mitochondria and calcium in health and disease. Cell Calcium. 2008;44:1–5. doi: 10.1016/j.ceca.2008.02.001. [DOI] [PubMed] [Google Scholar]
- 7.McCormack JG, Halestrap AP, Denton RM. Role of calcium ions in regulation of mammalian intramitochondrial metabolism. Physiol Rev. 1990;70:391–425. doi: 10.1152/physrev.1990.70.2.391. [DOI] [PubMed] [Google Scholar]
- 8.Lemasters JJ, Theruvath TP, Zhong Z, Nieminen AL. Mitochondrial calcium and the permeability transition in cell death. Biochim Biophys Acta. 2009;1787:1395–1401. doi: 10.1016/j.bbabio.2009.06.009. [DOI] [PMC free article] [PubMed] [Google Scholar]
- 9.Szalai G, Krishnamurthy R, Hajnoczky G. Apoptosis driven by IP(3)-linked mitochondrial calcium signals. EMBO J. 1999;18:6349–6361. doi: 10.1093/emboj/18.22.6349. [DOI] [PMC free article] [PubMed] [Google Scholar]
- 10.Hansford RG. Physiological role of mitochondrial Ca2+ transport. J Bioenerg Biomembr. 1994;26:495–508. doi: 10.1007/BF00762734. [DOI] [PubMed] [Google Scholar]
- 11.Herrington J, Park YB, Babcock DF, Hille B. Dominant role of mitochondria in clearance of large Ca2+ loads from rat adrenal chromaffin cells. Neuron. 1996;16:219–228. doi: 10.1016/s0896-6273(00)80038-0. [DOI] [PubMed] [Google Scholar]
- 12.Rizzuto R, et al. Close contacts with the endoplasmic reticulum as determinants of mitochondrial Ca2+ responses. Science. 1998;280:1763–1766. doi: 10.1126/science.280.5370.1763. [DOI] [PubMed] [Google Scholar]
- 13.Csordas G, et al. Imaging interorganelle contacts and local calcium dynamics at the ER-mitochondrial interface. Mol Cell. 2010;39:121–132. doi: 10.1016/j.molcel.2010.06.029. [DOI] [PMC free article] [PubMed] [Google Scholar]
- 14.Giacomello M, et al. Ca2+ hot spots on the mitochondrial surface are generated by Ca2+ mobilization from stores, but not by activation of store-operated Ca2+ channels. Mol Cell. 2010;38:280–290. doi: 10.1016/j.molcel.2010.04.003. [DOI] [PubMed] [Google Scholar]
- 15.Kirichok Y, Krapivinsky G, Clapham DE. The mitochondrial calcium uniporter is a highly selective ion channel. Nature. 2004;427:360–364. doi: 10.1038/nature02246. [DOI] [PubMed] [Google Scholar]
- 16.Santo-Domingo J, Demaurex N. Calcium uptake mechanisms of mitochondria. Biochim Biophys Acta. 2010;1797:907–912. doi: 10.1016/j.bbabio.2010.01.005. [DOI] [PubMed] [Google Scholar]
- 17.Igbavboa U, Pfeiffer DR. EGTA inhibits reverse uniport-dependent Ca2+ release from uncoupled mitochondria. Possible regulation of the Ca2+ uniporter by a Ca2+ binding site on the cytoplasmic side of the inner membrane. J Biol Chem. 1988;263:1405–1412. [PubMed] [Google Scholar]
- 18.Bernardi P. Mitochondrial transport of cations: channels, exchangers, and permeability transition. Physiol Rev. 1999;79:1127–1155. doi: 10.1152/physrev.1999.79.4.1127. [DOI] [PubMed] [Google Scholar]
- 19.Baughman JM, et al. Integrative genomics identifies MCU as an essential component of the mitochondrial calcium uniporter. Nature. 2011;476:341–345. doi: 10.1038/nature10234. [DOI] [PMC free article] [PubMed] [Google Scholar]
- 20.De Stefani D, Raffaello A, Teardo E, Szabo I, Rizzuto R. A forty-kilodalton protein of the inner membrane is the mitochondrial calcium uniporter. Nature. 2011;476:336–340. doi: 10.1038/nature10230. [DOI] [PMC free article] [PubMed] [Google Scholar]
- 21.Perocchi F, et al. MICU1 encodes a mitochondrial EF hand protein required for Ca2+ uptake. Nature. 2010;467:291–296. doi: 10.1038/nature09358. [DOI] [PMC free article] [PubMed] [Google Scholar]
- 22.Babcock DF, Herrington J, Goodwin PC, Park YB, Hille B. Mitochondrial participation in the intracellular Ca2+ network. J Cell Biol. 1997;136:833–844. doi: 10.1083/jcb.136.4.833. [DOI] [PMC free article] [PubMed] [Google Scholar]
- 23.Madesh M, et al. Selective role for superoxide in InsP3 receptor-mediated mitochondrial dysfunction and endothelial apoptosis. J Cell Biol. 2005;170:1079–1090. doi: 10.1083/jcb.200505022. [DOI] [PMC free article] [PubMed] [Google Scholar]
- 24.Moreau B, Nelson C, Parekh AB. Biphasic regulation of mitochondrial Ca2+ uptake by cytosolic Ca2+ concentration. Curr Biol. 2006;16:1672–1677. doi: 10.1016/j.cub.2006.06.059. [DOI] [PubMed] [Google Scholar]
- 25.Jiang D, Zhao L, Clapham DE. Genome-wide RNAi screen identifies Letm1 as a mitochondrial Ca2+/H+ antiporter. Science. 2009;326:144–147. doi: 10.1126/science.1175145. [DOI] [PMC free article] [PubMed] [Google Scholar]
- 26.Collins TJ, Lipp P, Berridge MJ, Bootman MD. Mitochondrial Ca2+ uptake depends on the spatial and temporal profile of cytosolic Ca2+ signals. J Biol Chem. 2001;276:26411–26420. doi: 10.1074/jbc.M101101200. [DOI] [PubMed] [Google Scholar]
- 27.Cardenas C, et al. Essential regulation of cell bioenergetics by constitutive InsP3 receptor Ca2+ transfer to mitochondria. Cell. 2010;142:270–283. doi: 10.1016/j.cell.2010.06.007. [DOI] [PMC free article] [PubMed] [Google Scholar]
Associated Data
This section collects any data citations, data availability statements, or supplementary materials included in this article.


