

Abstract
When viewing a human face, people often look toward the eyes. Maintaining good eye contact carries significant social value and allows for the extraction of information about gaze direction. When identifying faces, humans also look toward the eyes, but it is unclear whether this behavior is solely a byproduct of the socially important eye movement behavior or whether it has functional importance in basic perceptual tasks. Here, we propose that gaze behavior while determining a person’s identity, emotional state, or gender can be explained as an adaptive brain strategy to learn eye movement plans that optimize performance in these evolutionarily important perceptual tasks. We show that humans move their eyes to locations that maximize perceptual performance determining the identity, gender, and emotional state of a face. These optimal fixation points, which differ moderately across tasks, are predicted correctly by a Bayesian ideal observer that integrates information optimally across the face but is constrained by the decrease in resolution and sensitivity from the fovea toward the visual periphery (foveated ideal observer). Neither a model that disregards the foveated nature of the visual system and makes fixations on the local region with maximal information, nor a model that makes center-of-gravity fixations correctly predict human eye movements. Extension of the foveated ideal observer framework to a large database of real-world faces shows that the optimality of these strategies generalizes across the population. These results suggest that the human visual system optimizes face recognition performance through guidance of eye movements not only toward but, more precisely, just below the eyes.
Keywords: natural systems analysis, face processing, saccades
Determining a person’s identity, emotional state, and gender is an inherently complex computational problem that has represented a formidable challenge for computer vision systems (1). However, humans demonstrate an impressive ability to perform these tasks (2) accurately within one or two fixations (3) over a large range of spatial scales, head orientations, and lighting. Not surprisingly, the human brain contains areas specialized for the detection and identification of faces (4), as well as for processing their emotional valence (5). While recognizing faces, identifying emotions, or discriminating gender, humans also use a consistent selective sampling of visual information from the eye region and, to a lesser extent, the mouth region through both overt (eye movements) and covert attention mechanisms (6–10). For example, Schyns et al. (8) found that the visual information from the eye region is the main factor determining decisions about a face’s identity and gender, whereas Smith et al. (11) found that decisions about a face’s emotional valence are driven by both the eye and mouth regions. Furthermore, eye movements have been shown to target the upper face area predominantly. Several studies using long viewing conditions have shown that the eye region attracts the vast majority of fixation time (6, 12), at least for Western Caucasian observers. However, a study focusing on fast face recognition resulted in eye movements toward the upper center part of the face but displaced slightly downward from the eyes (3).
Why do humans look close to the eyes when encountering another person? For many cultures, this is a socially normative behavior (13–16). From a young age, infants progressively learn from the behavior of others to look at specific features when encountering other human faces, with the learned behavior imparting positive social value and gaining possibly important information, such as gaze and head direction (17–19). However, the functional role these viewing strategies may play in basic perceptual tasks, such as identification, remains unclear. Here, we propose the hypothesis that in addition to these social functions, directing the high-resolution fovea toward the eye region has functional importance for the sensory processing of the face and optimizes basic perceptual tasks that are relevant to survival, such as determining the identity, emotional state, and gender of the person. In this perspective, the behavior is a consequence of the distribution of task-relevant information in naturally occurring faces, the varying spatial resolution of visual processing across the retina, and the brain’s ability to learn eye movement plans with the aim of optimizing perceptual performance.
We first evaluated the functional importance for sensory processing of humans’ points of fixation during a suite of common important face-related tasks: identification, emotion recognition, and gender discrimination. We found that forcing humans to maintain gaze at points away from their preferred point of fixation (as determined by a free eye movement task) substantially degrades perceptual performance in each of the three face tasks. We then sought to explain the eye movement behavior of humans in terms of natural systems analysis (NSA) (20): the interaction between the distribution of task-related information in the faces, the foveated nature of the human visual system, and ideal observer analysis. We first considered a model that makes fixations to features with maximal discriminating information, but this could not explain the behavioral eye movement results. Similarly, models that target the center of the stimulus, computer display, or head could not predict the observed fixations. A model that simulates the effects of decreasing contrast sensitivity in the periphery combined with ideal spatial integration and a Bayesian decision rule that chooses the points of fixation that maximize perceptual performance accurately predicted eye movement behavior across the three tasks. These model results were found to generalize to a large set of 1,000, suggesting an optimization for the natural statistics of faces found in the population at large. Finally, humans were able to maximize performance by switching to a unique optimal fixation strategy for a separate task with a different spatial distribution of visual information.
Results
Preferred Points of Fixation During Person, Gender, and Emotion Identification.
We first measured the preferred points of fixation for our stimuli and perceptual tasks. Separate groups of 20 Western Caucasian observers participated in one of three face-related tasks: identification, emotion recognition, or gender discrimination. Observers were briefly shown frontal view, noisy grayscale images with background, hair, and clothing removed and scaled to represent the visual size of a face at normal conversational distance (6° visual angle measured vertically from the center of the eyes to the center of the mouth). In an identification task, observers were asked to identify 1 of 10 faces. An emotion task displayed 1 of 140 faces (20 per expression), and observers were asked to categorize the perceived emotion. In a gender task, observers were shown 1 of 80 faces (40 female) and responded with the perceived gender. To assess preferred points of fixation, we allowed observers 350 ms to move their eyes freely from one of eight randomly selected starting locations positioned, on average, 13.95° visual angle from the center of the face stimulus (Fig. 1). Peripheral starting locations were used to remove the confound introduced by the common practice of beginning trials with observers fixating the center of the stimulus, whereby task information can be accrued before the execution of any eye movement behavior.
Fig. 1.

Task time line. The free eye movement condition allowed observers to make a saccade from initial fixations surrounding the image into the centrally presented face image with time for one fixation. The forced fixation task was identical, except the possible initial fixations were situated along the vertical midline and eye movements were prohibited.
The short display time allowed for the execution of a single saccade into the face stimulus. Observers in the identification task showed some variability in the landing point of the first eye movement (Fig. 2 A and B), with the average end position ranging from the eyes to the tip of the nose (a spread of 4.32° visual angle with a mean landing point of 1.06° below the midpoint of the eyes and an SD of 1.03°). In the emotion task, observers showed a significant downward shift in saccadic behavior, along with greater individual variability compared with the identification task [1.94° ± 1.45° below the eyes; t(34.2) = 2.21, P = 0.034, two-tailed unequal variances; Fig. 2 A and B]. The gender condition resulted in a pattern of results reminiscent of the identification condition, with saccades closer to the eyes and reduced variability (1.09° ± 0.86° below the eyes; Fig. 2 A and B). Average perceptual performance, in proportion correct (PC), for the three tasks was 0.457 ± 0.030, 0.542 ± 0.015, and 0.714 ± 0.011 for identification, emotion recognition, and gender discrimination, respectively. Although difficult, performance was significantly above chance for each task [identification: PCchance = 0.10, t(19) = 11.47, P = 2.8e-10, one-tailed; emotion: PCchance = 0.14, t(19) = 25.74, P = 1.6e-16, one-tailed; gender: PCchance = 0.50, t(19) = 20.57, P = 9.5e-15, one-tailed].
Fig. 2.

Eye movement behavior. (A) Representative fixations from 3 observers for the free eye movement condition. Each red dot indicates a single saccade of the 500 total fixations per observer, whereas the black dot represents the mean landing point across all saccades. (B) Each green dot indicates the mean landing point for 1 observer, whereas the white dot is the mean landing point across the 20 observers. (C) Eye movement behavior for observers identifying full-color, noise-free images mirrors the results from the main identification task.
To determine whether the strategy varied with viewing time, we repeated the identification task with a 1,500-ms presentation and found no significant difference in the preferred location of the first saccade compared with the 350-ms viewing time [1.09° ± 1.13° below the eyes: t(19) = 0.25, P = 0.80, paired, two-tailed]. In addition, we assessed whether the eye movement strategy was altered by the presence of image noise or absence of color by measuring eye movements for a group of 50 additional participants identifying color images of famous people with no image noise. Again, patterns of fixation did not significantly differ from those observed with the noisy grayscale image set [1.12° ± 1.18° below the eyes: t(68) = 0.20, P = 0.84, two-tailed; Fig. 2C]. However, there still exists the possibility that the observed eye movement patterns do not reflect natural behavior but are a result of learning this specific, relatively small stimulus set through trial and error as well as feedback. Three pieces of evidence argue against this explanation. First, we compared each individual’s mean saccade landing point from the first 50 trials of the Short identification condition with the mean landing location from the last 50 trials. We found no significant difference between these distributions [t(19) = 0.61, P = 0.52, two-tailed; Fig. S1A]. Second, the famous faces condition did not involve feedback and used familiar people, yet the saccade distributions were extremely similar to those from the Short condition. Finally, we had six separate observers identify the same 10 grayscale faces; however, unlike our original study, feedback was not provided. After completing the no-feedback condition, the same observers also ran through the original study. The eye movement results show no significant difference in fixation behavior between the two conditions, indicating the use of preexisting strategy [mean distance between saccade distributions for the two conditions was 0.17° ± 0.12°: t(5) = 1.43, P = 0.21, two-tailed, paired; Fig. S1B]. Together, the results confirm that the strategy remains largely unaltered, and thus reflects natural behavior.
Functional Importance and Perceptual Performance of Preferred Points of Fixation.
To evaluate whether these preferred points of gaze had functional importance, we conducted a second condition that forced observers to maintain one of four fixation locations along the midline of the face (equally spaced 3° apart, same locations for all participants) while the stimulus was displayed for 200 ms (Fig. 1). For all tasks, fixating away from the preferred gaze location (e.g., forehead, mouth) led to appreciable performance degradation in terms of PC [identification: PC(eyes-forehead) = 0.143, t(19) = 11.05, P = 5.2e-10 and PC(nose-mouth) = 0.148, t(19) = 13.42, P = 1.9e-11; emotion: PC(eyes-forehead) = 0.057, t(19) = 4.52, P = 1.2e-4 and PC(nose-mouth) = 0.067, t(19) = 5.62, P = 1.0e-5; gender: PC(eyes-forehead) = 0.056, t(19) = 5.23, P = 2.4e-5 and PC(nose-mouth) = 0.055, t(19) = 4.55, P = 1.1e-4; all tests one-tailed; Fig. 3].
Fig. 3.

Forced fixation performance and foveated ideal face discriminator performance. Black dots are the average performance in the forced fixation condition across observers (error bars represent 1 SEM). The blue rectangles represent the saccade distribution at the group level, centered at the mean of the landing point of the first saccade with a width of 1 SD. Humans fixated between the eyes and nose but closer to the eyes. The red line indicates the model predictions of the FIO.
The behavioral results show that humans guide eye movements to locations on the face that lead to high perceptual accuracy. However, these results do not necessarily show that humans enact gaze patterns that are optimized for the statistical distribution of discriminating information present in the human face combined with the foveated nature of the human visual system [sensory optimization hypothesis (21)]. For example, the correspondence between saccade selection and task performance could be explained if we hypothesized the following: (i) Humans adopt a behavior of fixating near the eye region to maximize the value of social interactions, optimally evaluate gaze and head direction, fixate highly salient regions, or any number of unrelated tasks, and (ii) this long-term behavior has led to the adaptation of a fixation-specific sensory coding neural system that leads to a performance cost when humans fixate at a location different from the norm. In this framework, eye movements toward preferred points of fixation and their associated perceptual performance advantages would not arise due to the statistical visual properties of the human face and the foveated nature of the visual system but rather as a byproduct of the adoption of a long-term overpracticed behavior. However, if the sensory optimization hypothesis holds, we reasoned that it should be possible to predict the performance-maximizing locations of human fixations using a rational model of eye movements that takes into account the distribution of discriminating information across faces for the various perceptual tasks. We used constrained ideal observer methodology (22) and NSA (20) to test this second hypothesis.
NSA: Spatial Distribution of Discriminating Information.
To quantify and localize the amount of discriminating visual information available in an image of a human face, we systematically extracted small corresponding regions from each face in the current stimulus set and ran a traditional white noise ideal observer [region of interest (ROI) ideal observer; Fig. 4A and SI Text], which makes trial-to-trial decisions by calculating the posterior probabilities of each possible stimulus class, given the observed data, and choosing the maximum (23, 24). Here, each class,  , is equally likely to be present on any given trial (i.e., the prior probabilities are the same), which reduces the Bayesian decision rule to choosing the maximum class likelihood,
  , itself a sum of the within-class likelihoods for each exemplar,
  . When the additive noise is white and normally distributed, the sum of likelihoods,
  = ∑
= ∑ , is given by (derivation is provided in SI Text):
Fig. 4.

ROI ideal observer and FIO methodology. (A) ROI ideal observer, a technique for localizing and quantifying information content, is an adaptation of classic white noise ideal observer theory. Small regions of the stimulus are extracted and embedded in white Gaussian noise. The likelihoods for the presence of each possible stimulus are computed in a Bayesian manner, and the maximum likelihood is taken as the decision. A single signal contrast is chosen and held constant across regions. Thus, the performance of the ideal observer for each region is a measurement of the total task-relevant information content. (B) Flow chart for the FIO simulations. For any given fixation (here, center of the image), the image is divided into spatial bins, each with its own contrast sensitivity function (CSF) depending on retinal eccentricity and direction from fixation. The image is filtered in the frequency domain and then reassembled in the spatial domain, resulting in a spatially variant filtered image. FFT, fast Fourier transform; IFFT, inverse FFT.
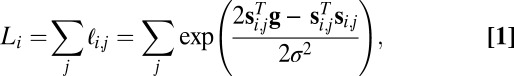 |
where  and
and  represent vectors of the 2D noiseless face images and noisy stimulus observation (face and additive noise), respectively,
  is the transpose operator, and
  is the SD of the spatially independent pixel noise.
Analyzing the same faces used in the human study resulted in a spatial map of the local concentration of task-relevant information in which higher ideal observer performance corresponds to greater discriminating information content (Fig. 5A). For all tasks, the eye region contained the most information, with the mouth also showing up as being informative, especially for emotion discrimination.
Fig. 5.

ROI and FIO predictions. (A) ROI ideal observer shows heavy concentrations of information in the eye region, with smaller peaks around the nose tip and mouth. Overlaid are the mean saccade landing points for each individual (in green) and the group (in white). Saccades were not directed toward the most information regions. (B) FIO predictions show a peak in the center of the face just below the eyes, where information is optimally integrated across the visual field. The overlaid saccade distributions show a strong tendency for observers to target regions of maximal information gain.
A remaining question is whether our results are specific to the chosen subset of faces. To assess whether the distribution of discriminating information generalizes to more natural situations, we adopted an NSA methodology (20) by evaluating the same ROI analysis for the identification task on a large, representative sample of 1,000 faces (100 groups of 10 faces each). Of these 1,000 faces, 150 were from our in-house database with standardized pose and lighting conditions. The remaining images were gathered from the Internet from many diverse sources. All faces were chosen to have a close to frontal view pose, close to neutral expression, Caucasian ethnicity, and no distinguishing marks (e.g., jewelry, glasses). Lighting was left uncontrolled. The results show that the information across faces is highly regular, with the ROI maps displaying a strong similarity to the results from the experimental stimuli (distance between the NSA and human study maximum performance locations was 0.17°; Fig. 6B; a comparison of results between datasets is provided in Fig. S2).
Fig. 6.

NSA. (A) FIO results along the vertical midline for 100 groups of 10 faces each are shown, with dark gray representing the mean performance across groups plus or minus 1 SEM. Light gray represents the SD. (B and C) ROI and FIO results, respectively, show a strong correspondence to the results using images from the human study.
Fixate the Most Informative Feature Strategy.
The first possible eye movement strategy we tested is one that fixates the most informative feature for each face task. This model posits that humans simply direct their eyes to the region with the most local information,  , as defined by the ROI ideal observer’s performance in terms of PC for each region,
  , calculated using Eq. 1:
The overlaid group saccade distributions show that this was not the case; instead, fixations were clustered closer to the vertical midline and displaced downward (Fig. 5A). Observers’ first fixations differed significantly from this model’s predictions for each task, with the average errors measuring 2.17° for the identification task [t(19) = 12.36, P = 1.6e-10, two-tailed], 2.05° for the gender task [t(19) = 19.02, P = 8.0e-14, two-tailed], and 2.54° for the emotion task [t(19) = 12.01, P = 2.6e-10, two-tailed].
Optimal Foveated Strategy.
The ROI ideal observer integrates information perfectly within the extracted region while ignoring the surrounding area. The human visual system, however, integrates information across the visual field, with the quality of information degrading toward the periphery. To take into account the foveated nature of visual processing, we implemented a foveated ideal observer (FIO) (25) (Fig. 4B). To simulate the effects of eccentricity on sensitivity to different spatial frequencies, we used a spatially variant contrast sensitivity function (SVCSF) linear filtering function (Eq. 3 and SI Text) that took points of fixation, eccentricity, and direction away from fixation as variables (26, 27):
where f is spatial frequency in cycles per degree of visual angle. The terms a0, b0, and c0 are constants set to 1.2, 0.3, and 0.625, respectively, to set the maximum contrast at 1 and the peak at four cycles per degree of visual angle at fixation. Distance in terms of visual angle and direction from fixation are specified in polar coordinates by r and θ, respectively, with d0 representing the eccentricity factor as a function of direction (i.e., how quickly information degrades with peripheral distance) and  representing a steep eccentricity roll-off factor.
For any given fixation point,  , the input image (with the same contrast and additive white noise as viewed by the humans) is filtered by the SVCSF. This filtered image is then corrupted by additive, zero-mean white Gaussian internal noise with SD,
  (alternative models that use signal contrast attenuation for human performance matching alongside or instead of internal noise are discussed in SI Text and Fig. S3). The FIO compares this filtered noisy input with similarly filtered noise-free templates of each possible face, resulting in a set of template responses,
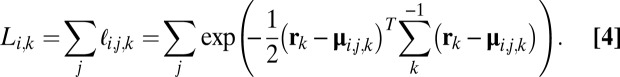
  , drawn from a multivariate normal distribution with mean vector
  and covariance
  . Multivariate normal likelihoods of all template responses for each possible face are calculated and summed within each class, resulting in a collection of summed likelihood terms,
  :
:
 |
The FIO then takes the maximum of these summed likelihoods as the decision [a full derivation is provided in SI Text; we also implemented an ideal observer in white noise, a common model in the vision literature, and incorporated simulated spatial uncertainty, a known property of the human visual system, with both models producing very similar results (28–30) (SI Text and Figs. S4 and S5)]. We kept the direction-dependent eccentricity terms [d0(θ) and n0] and internal noise SD ( ) as free parameters to fit the performance profile from the forced fixation condition of the identification task. We then used the same eccentricity parameters for the SVCSF while leaving the internal noise SD free to generate the FIO predictions for each possible fixation across the face for the three tasks (a discussion on differences between previously reported contrast sensitivity function parameters measured using isolated gratings and those used here is provided in SI Text).
Generally, an optimal eye movement model selects a fixation, kopt, from all possible fixations, such that task performance is maximized (31):
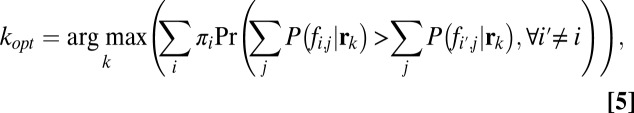 |
where  is the prior probability of each class and
  is the posterior probability of the hypothesis of face (i,j) being present, given the observed responses (a complete derivation is provided in SI Text). The FIO did not use peripheral information about the identity or class of the stimuli from the initial fixation as prior information to influence the location of the first saccade. The underlying assumption here is that any evidence about face identity or category gathered during the initial fixation will not alter the saccade strategy. In the present study, all initial fixations were outside the presented image at an average distance of 15.3° from the center of the face. Two findings support our assumption that peripheral processing at the initial point of fixation does not alter the eye movement strategy of the first saccade: (i) Human fixation points did not depend on which face was displayed, suggesting a similar strategy across identities, and (ii) the FIO predictions conditional on which face was present show a similar cluster of maximum performance fixation locations (Fig. S6).
Fig. 3 presents the FIO performance down the vertical midline for each task. Results show that the FIO predicts the preferred gaze for the emotion and gender tasks, even though the SVCSF eccentricity parameters were fit only to the identification condition. At the group level, observers fixated the area of the face that led to maximum predicted performance, with the mean saccade landing point not significantly deviating from the optimal prediction by 0.22° [t(19) = 0.048, P = 0.96, two-tailed], 0.23° [t(19) = 0.035, P = 0.97, two-tailed], and 0.14° [t(19) = 0.036, P = 0.97, two-tailed] for the identity, emotion, and gender tasks, respectively (Fig. 3). This can also be seen in the full 2D performance predictions (Fig. 5B). Although the FIO was able to account for observers’ location-dependent performance and preferred point of fixation, there was no relationship between the variance of observer fixations (taken across all saccades) for each individual task and the “flatness” of each task’s FIO performance map, defined here as the distance from the peak performance location and the point nearest the peak where performance fell by 0.10 in PC [r(3) = −0.11, P = 0.89]. Finally, we ran the same analysis on our 1,000-face database, resulting in consistent findings across different face image sources (Fig. 6 A and C).
Flexible or Fixed Optimal Strategies for Other Tasks?
If fixating the eye region is indeed a strategy that aims at maximizing perceptual performance, humans might adopt a different fixation strategy for a task in which the optimal strategy is to fixate away from the eye region. Alternatively, humans might adopt a general eye movement plan that directs saccades close to the eyes as a heuristic that renders quasioptimal performance for a large variety of tasks but that might be suboptimal for some specific situations. To test these two possibilities, we sought a task that did not contain most of the discriminating information in the eyes and for which the FIO strategy departed from the optimal strategy in the identification task. One such task is discriminating between happy and neutral expressions. We ran a separate group of 20 observers in the same paradigms, except they now had to discriminate between neutral and happy expressions (80 faces in each class). The ROI ideal observer shows that the bulk of the information for this task is now concentrated in the mouth, with a significant amount still present in the eyes (Fig. 7B). The FIO predictions show that the optimal strategy is to fixate the nose tip (Fig. 7 A and C), probably due to the high visibility of the mouth region in the periphery (a large white smile vs. a closed mouth). Consistent with this prediction, observers showed a shift downward in saccade behavior from the identification condition [2.72° ± 1.11° below the eyes; t(37) = 4.90, P = 9.5e-6, one-tailed; model fits are discussed in SI Text]. Thus, humans are able to adapt their eye movement strategies to changing task demands.
Fig. 7.

Happy vs. neutral behavioral and ideal observer results. (A) Humans move their saccades downward toward the nose tip. Human saccade distribution means for the identification and emotion tasks are indicated by the red and black arrows, respectively. (B) ROI ideal observer shows a heavy concentration of information in the mouth, where the smile is the most informative cue. However, humans do not fixate this area. (C) Two-dimensional FIO results show a peak toward the nose tip, where the (still heavy) concentration of information in the eyes can be optimally combined with the higher visibility information from the mouth.
Evaluation of Central Bias Strategies.
There is a well-documented tendency for observers to fixate the center of images (natural and synthetic) when they are displayed on a computer screen (32, 33). Could the eye movements reported here be explained simply by observers’ propensity to saccade toward the middle of the stimulus? The saccade distributions certainly cluster toward the horizontal center of the face images, although they are significantly displaced to the left [identification: 0.66° ± 0.10°, t(19) = 6.48, P = 1.6e-6, one-tailed; emotion: 0.48° ± 0.11°, t(19) = 4.50, P = 1.2e-4, one-tailed; gender: 0.45° ± 0.10°, t(19) = 4.25, P = 2.2e-4, one-tailed]. We consider three possible central bias strategies in the vertical dimension.
Center of visible face.
The geometric center of the visible portion of the face images (within the black cropping mask) corresponds to a point just below the nose tip (0.26°), a considerable and statistically significant distance from the center of the human saccade distributions for each task [identification: 2.15° ± 0.24°, t(19) = 8.92, P = 3.2e-8, two-tailed; emotion: 1.27° ± 0.30°, t(19) = 4.17, P = 5.2e-4, two-tailed; gender: 2.02° ± 0.22°, t(19) = 9.19, P = 2.0e-8, two-tailed; Fig. 8A], suggesting that humans are not using a simple strategy of targeting the middle of the image within the high-contrast frame.
Fig. 8.

Evaluation of central bias strategies and summary of results. (A) Strategy that targets the geometric centers for either the visible face area (purple), the cropping black box (orange), or the uncropped entire head region (cyan) cannot account for human eye movement results (blue, identification; red, emotion; green, gender). (B) New condition, which moves the center drastically downward on the face (orange), yields nearly identical results (black) to the original Short condition (white) while providing even poorer eye movement predictions. (C) Compilation of eye movement results and corresponding model predictions for all conditions. Inspection shows that the FIO is the only model that correctly predicts human fixation locations and tracks the systematic modulation of behavior with task.
Center of frame.
A second strategy observers might have adopted is to target the center of the black cropping box, which also corresponds to the center of the monitor. This point is located above the visible face center (1.04° above the nose tip), but results were still well below the eye movement results for the identification and gender tasks [identification: 0.86° ± 0.24°, t(19) = 3.55, P = 2.1e-3, two-tailed; gender: 0.73° ± 0.22°, t(19) =3.30, P = 3.7e-3, two-tailed; Fig. 8A]. The emotion condition yielded saccades that were not significantly displaced from this location [0.03° ± 0.30°, t(19) = 0.08, P = 0.93, two-tailed; Fig. 8A]. The ability of this center bias strategy to account for just one of the three tasks makes it an unlikely candidate to explain human behavior. Nevertheless, to rule out this possibility completely, we developed a task that moved the geometric center a large distance down the face by moving the face image upward and expanding the black cropping box and visible face area greatly downward (Extended Frame condition; Fig. 8B). If observers are targeting the center of the stimulus, we should see a large divergence in looking behavior between this task and the original Short condition. Six separate observers participated in these two conditions (counterbalanced so that three completed the Short task first followed by the Extended Frame condition, and vice versa; Fig. 8B). The new frame moved the center of both the visible area and the entire surrounding box downward to 1.84° below the nose tip. The results show that observers do not look toward the center of this new extended frame but rather much further up the face [mean saccade distance from center = 3.07° ± 0.38°, t(5) = 7.94, P = 5.1e-4, two-tailed; Fig. 8B]. Furthermore, observers looked at the same place on the face independent of the frame position [mean distance between saccade distributions for the two conditions = 0.10° ± 0.13°, t(5) = 0.78, P = 0.47, two-tailed, paired; Fig. 8B], suggesting that saccades are planned relative to the inner features of the face itself.
Center of entire head.
Finally, it is possible that observers fixate the center of the entire head region (i.e., from the tip of the chin to the top of the skull/hair). Although the entire head was never shown to observers, they could have applied a real-world strategy of fixating the center of peoples’ heads. We measured the average geometric center for all faces in our 150-image in-house database by taking the halfway point between the top of the hair and the bottom of the chin for the full, uncropped images. The head center coincides with a point directly between the eyes, which is significantly displaced upward from each task’s saccade distribution [identification: 1.07° ± 0.24°, t(19) = 4.41, P = 3.0e-4, two-tailed; emotion: 1.95° ± 0.30°, t(19) = 6.41, P = 3.8e-6, two-tailed; gender: 1.20° ± 0.22°, t(19) = 5.44, P = 3.0e-5, two-tailed]. Again, this strategy cannot account for the observed eye movements.
Summary of Results.
A summary of results for each task and model is presented in Fig. 8C. For all conditions tested, observers directed their saccades to locations significantly below the eyes. The ROI ideal observer, which predicts fixations on the eyes or mouth depending on the task, fails to capture human behavior. Simple alternatives, such as the center-of-mass models, are also poor predictors of behavior. Furthermore, it is clear that humans enact distinct eye movement plans depending on the task, with saccades directed significantly lower on the face for judgments about emotion compared with identity and gender, and lower still when determining happiness. The ROI and center-of-mass models do not predict these task-dependent differences. The FIO model, however, is able to account for both the guidance of saccades to just below the eye region and the sensitivity of eye movements to task due to the task’s specific layout of visual information and the simulated spatial inhomogeneity of the human visual system. Indeed, across the four tasks, the average error for the FIO (defined as the distance from the model’s peak performance location to the mean of the human saccade distribution,  ) was significantly less than for each other model [ROI:
  = 1.70° ± 0.13°, t(79) = 13.00, P = 1.3e-21, one-tailed; visible face center:
  = 0.71° ± 0.11°, t(79) = 6.34, P = 6.6e-9, one-tailed; frame center:
  = 0.16° ± 0.05°, t(79) = 3.50, P = 3.9e-4, one-tailed; head center:
  = 0.80° ± 0.12°, t(79) = 6.43, P = 4.4e-9, one-tailed; comparisons within a single task are provided in Table S1]. Finally, a condition that offered no feedback resulted in extremely similar eye movements, suggesting that these strategies are not learned for the unique sample of face images used in this study but are rather preexisting optimal adaptations for real-world face recognition tasks learned outside the laboratory.
Discussion
One notable aspect of our FIO model is that it not only predicts saccades toward the eyes but, more precisely, just below the eyes. This is a consequence of the model’s integration of visual information across the entire face stimulus. Although the eyes contain the highest concentration of task-relevant visual evidence of any single region or feature, spatially disjunct areas may also contribute valuable information. Other large features, such as the mouth and nose, show up as information concentration hot spots (Fig. 5A), whereas diffuse information is present across all areas of the face. Direct foveation of the eyes leaves the mouth and nose tip well into the periphery, where sensitivity is greatly attenuated, causing degradation in these features’ information. Foveating a more central region allows for greater amounts of diffuse information to fall in less peripheral regions of the visual field.
However, not every study has found that saccades are directed just below the eyes. Observers commonly follow a triangular pattern of eye movements with alternating saccadic transitions between the two eyes and the mouth [commonly referred to as the “T” pattern (9, 12, 34–36)]. Two potential differences across studies may help explain these discrepancies: stimulus display time and location of the initial fixation. In these previous studies, faces were shown for a relatively long time, on the order of 2 to 10 s. This allowed for a large number of saccades during any single stimulus presentation. Given that face identification performance saturates after two fixations (3), the vast majority of these saccades did not contribute to a final perceptual decision. The T pattern may thus reflect normal social behavior, a default mode that observers revert to after gathering and processing sufficient information for the task at hand. Additionally, these studies placed the initial fixation near the center of the face, making future saccades to this region unnecessary because that information had already been gathered, and possibly drastically altering saccade strategy (37). Indeed, a study by Hsiao and Cottrell (3) that found results similar to ours, with fixations clustering around the midline of the face and displaced down from the eyes, used a brief presentation time and an initial fixation outside the face image. Our current results suggest that saccades toward the region just below the eye are a consequence of observers optimizing their eye movement plans for rapid identification during the first fixation into the face. This would seem to be especially true after observers have developed a strong representation of the faces in memory, because previous studies have shown a migration of eye movements from a more distributed pattern during early familiarization toward concentrated gaze around the eyes during recall in a learned state (12, 38).
When and how might these optimal strategies arise? The gaze of newborns is attracted to eyes that are directed at them (18). Infant contrast sensitivity is lower than that of the adult, especially in the high spatial frequencies (39). If infant peripheral vision is not well-developed, the high-contrast eye region may provide the best source of information for the nascent infant visual system and fixating the eyes directly might be the optimal strategy. As the infant grows, the development of greater contrast sensitivity across the visual field may allow for more efficient integration of spatially diffuse information in the parafoveal and peripheral regions. This broadening of visibility would cause a change in the optimal fixation predictions from a targeting of regions with locally high information density, such as given by the ROI ideal observer (Fig. 5), to the FIO predictions driven by a mature visual system (Fig. 6). This migration of eye movements could mirror the development of the ability to recognize conspecifics over the first few years of life (17, 40).
Human fixations and the FIO performance peaks were both lower on the face for the emotion task than for the identification and gender tasks (Fig. 3). However, a simple strategy of fixating a small region just below the eyes would result in maximal or approximately maximal performance for each task. This leads to the possibility of a heuristic strategy that approaches optimality for the collection of common face-related tasks. Only when less common and more specific tasks are performed, where the spatial distribution of information is dramatically altered, does a change in strategy lead to appreciable performance advantages. In keeping with our sensory optimization hypothesis, this adaptation in behavior can be seen when observers are asked to ascertain whether somebody is smiling or not (Fig. 7), because the eyes are guided further down on the face for more efficient processing of the highly informative mouth region. This strategy adjustment to diverse, task-specific distributions of information can also be seen with other face-related tasks, such as speech recognition, especially under difficult, noisy conditions (41).
Many years of research have shown the propensity for Western observers to fixate near the eyes during face recognition. Here, we have shown that this behavior can be explained through an NSA, where fixations are chosen to maximize information gain, with this strategy attaining optimal or approximately optimal performance across face-related tasks. Deviations from this optimal behavior show a substantial detriment to performance, especially with identification. With that said, it should be noted that our methods minimize social effects on eye movements. In our study, observers identified briefly viewed static images of faces rather than interacting with actual people in a more natural, social setting. In real life, the complexity of social interaction requires the monitoring of many perceptual tasks. Furthermore, humans are acutely sensitive to the gaze direction of others, with social costs attached to the detection of nonstandard behavior (19, 42, 43). Therefore, eye movements to faces in the real world might be guided closer to the eyes through a strategy that aims to optimize a collection of functions (e.g., social normalcy, gaze recognition) while still preserving high perceptual performance for the important face-related tasks tested in this study.
Application of the developed tools to other ethnic populations [e.g., East Asian (44, 45)] may reveal whether observed differences in eye movement behavior across cultures are optimal adaptations to the spatial layout of visual information in the faces of those populations or cultural differences unrelated to sensory optimization. Furthermore, these techniques could be used to assess the functional underpinnings of face recognition deficits in certain clinical populations [e.g., autism spectrum disorder (46–48), prosopagnosia (49–51), schizophrenia (52, 53)] and could be a useful starting point for the development and continued assessment of rehabilitation efforts.
Methods
Subjects.
Each task in the main study was completed by a separate group of 20 undergraduate students for course credit. The famous faces study was completed by a separate group of 50 undergraduate students. Informed consent was obtained for all subjects, and guidelines provided by the Institutional Review Board at the University of California, Santa Barbara, were followed.
Eye Tracking.
The left eye of each participant was tracked using an SR Research Eyelink 1000 Tower Mount eye tracker sampling at 250 Hz. A nine-point calibration and validation were run before each 125-trial session, with a mean error of no more than 0.5° of visual angle. Saccades were classified as events in which eye velocity was greater than 22° per second and eye acceleration exceeded 4,000° per square second. If participants moved their eyes more than 1° from the center of the fixation cross before the stimulus was displayed or while the stimulus was present during the forced fixation condition, the trial would abort and restart with a new stimulus.
Stimuli, Psychophysics.
One hundred fifty face images were taken in-house with constant diffuse lighting, distance, and camera settings. Graduate and undergraduate students at the University of California, Santa Barbara, participated for course credit or pay. The images were normalized by scaling and cropping, such that the bottom of the hairline was 10 pixels below the top of the image and the bottom of the chin was 10 pixels above the bottom of the image.
Emotional Face Selection.
On hundred forty images (20 per emotion) were selected from the 1,050 in-house photographs (150 people demonstrating seven emotions each). Nineteen naive participants rated each photograph on the genuineness of the intended emotion on a scale from 1 to 7. Raters were instructed that a score of 4 or greater meant the expression was a believable, readily recognizable representation of the intended emotion and would not be mistaken for another expression. This was used as the threshold for categorizing the image as either correctly or incorrectly displaying the expression. A PC measure was calculated for each image, with values above 0.8 being taken as sufficient label agreement (54). Only images that achieved this threshold were considered for use in the study. We then selected the 10 males and 10 females from the viable images in each emotion group that scored the highest on the genuineness scale. The rating results are shown in Fig. S7.
NSA Images.
The 150-image in-house database was supplemented with 850 face images culled from the Internet using Google image search. For reasonable comparison between image sets, images were required to be approximately frontal view with a neutral expression, Caucasian ethnicity, and no obvious occlusions or marks (e.g., glasses, jewelry). Because the in-house database used constant lighting conditions, the Internet faces were selected to have diverse sources and intensities of lighting to mimic natural conditions. Slight rotation (less than 10°) from a frontal view was also allowed.
Famous Faces.
One hundred twenty high-resolution, full-color images of well-known celebrities were collected using Google image search and normalized in the same manner as the main study’s stimuli. Participants followed the same protocol as the free eye movement conditions of the main study, except they had to type in the name of the celebrity.
Supplementary Material
Acknowledgments
We thank J. Sy for assistance in collecting and normalizing images. A. Itkin, B. Bender, I. Cox, and S. Baker assisted with training participants. This work was supported by Grant EY-015925 from the National Institutes of Health (to M.P.E.).
Footnotes
The authors declare no conflict of interest.
This article is a PNAS Direct Submission.
See Author Summary on page 19525 (volume 109, number 48).
This article contains supporting information online at www.pnas.org/lookup/suppl/doi:10.1073/pnas.1214269109/-/DCSupplemental.
References
- 1.Zhao W, Chellappa R, Phillips PJ, Rosenfeld A. Face recognition: A literature survey. Association for Computing Machinery: Computer Surveys. 2003;35(4):399–458. [Google Scholar]
- 2.Diamond R, Carey S. Why faces are and are not special: An effect of expertise. J Exp Psychol Gen. 1986;115(2):107–117. doi: 10.1037//0096-3445.115.2.107. [DOI] [PubMed] [Google Scholar]
- 3.Hsiao JH, Cottrell G. Two fixations suffice in face recognition. Psychol Sci. 2008;19(10):998–1006. doi: 10.1111/j.1467-9280.2008.02191.x. [DOI] [PMC free article] [PubMed] [Google Scholar]
- 4.Kanwisher N, McDermott J, Chun MM. The fusiform face area: A module in human extrastriate cortex specialized for face perception. J Neurosci. 1997;17(11):4302–4311. doi: 10.1523/JNEUROSCI.17-11-04302.1997. [DOI] [PMC free article] [PubMed] [Google Scholar]
- 5.Haxby JV, Hoffman EA, Gobbini MI. The distributed human neural system for face perception. Trends Cogn Sci. 2000;4(6):223–233. doi: 10.1016/s1364-6613(00)01482-0. [DOI] [PubMed] [Google Scholar]
- 6.Barton JJS, Radcliffe N, Cherkasova MV, Edelman J, Intriligator JM. Information processing during face recognition: The effects of familiarity, inversion, and morphing on scanning fixations. Perception. 2006;35(8):1089–1105. doi: 10.1068/p5547. [DOI] [PubMed] [Google Scholar]
- 7.Sekuler AB, Gaspar CM, Gold JM, Bennett PJ. Inversion leads to quantitative, not qualitative, changes in face processing. Curr Biol. 2004;14(5):391–396. doi: 10.1016/j.cub.2004.02.028. [DOI] [PubMed] [Google Scholar]
- 8.Schyns PG, Bonnar L, Gosselin F. Show me the features! Understanding recognition from the use of visual information. Psychol Sci. 2002;13(5):402–409. doi: 10.1111/1467-9280.00472. [DOI] [PubMed] [Google Scholar]
- 9.Rizzo M, Hurtig R, Damasio AR. The role of scanpaths in facial recognition and learning. Ann Neurol. 1987;22(1):41–45. doi: 10.1002/ana.410220111. [DOI] [PubMed] [Google Scholar]
- 10.Yarbus A. Eye Movements and Vision. New York: Plenum; 1967. [Google Scholar]
- 11.Smith ML, Cottrell GW, Gosselin F, Schyns PG. Transmitting and decoding facial expressions. Psychol Sci. 2005;16(3):184–189. doi: 10.1111/j.0956-7976.2005.00801.x. [DOI] [PubMed] [Google Scholar]
- 12.Henderson JM, Williams CC, Falk RJ. Eye movements are functional during face learning. Mem Cognit. 2005;33(1):98–106. doi: 10.3758/bf03195300. [DOI] [PubMed] [Google Scholar]
- 13.Patterson ML. A sequential functional model of nonverbal exchange. Psychol Rev. 1982;89(3):231–249. [Google Scholar]
- 14.Argyle M, Dean J. Eye-contact, distance and affiliation. Sociometry. 1965;28(3):289–304. [PubMed] [Google Scholar]
- 15.Kleinke CL. Gaze and eye contact: A research review. Psychol Bull. 1986;100(1):78–100. [PubMed] [Google Scholar]
- 16.Emery NJ. The eyes have it: The neuroethology, function and evolution of social gaze. Neurosci Biobehav Rev. 2000;24(6):581–604. doi: 10.1016/s0149-7634(00)00025-7. [DOI] [PubMed] [Google Scholar]
- 17.Morton J, Johnson MH. CONSPEC and CONLERN: A two-process theory of infant face recognition. Psychol Rev. 1991;98(2):164–181. doi: 10.1037/0033-295x.98.2.164. [DOI] [PubMed] [Google Scholar]
- 18.Farroni T, Csibra G, Simion F, Johnson MH. Eye contact detection in humans from birth. Proc Natl Acad Sci USA. 2002;99(14):9602–9605. doi: 10.1073/pnas.152159999. [DOI] [PMC free article] [PubMed] [Google Scholar]
- 19.Loomis JM, Kelly JW, Pusch M, Bailenson JN, Beall AC. Psychophysics of perceiving eye-gaze and head direction with peripheral vision: Implications for the dynamics of eye-gaze behavior. Perception. 2008;37(9):1443–1457. doi: 10.1068/p5896. [DOI] [PubMed] [Google Scholar]
- 20.Geisler WS. Visual perception and the statistical properties of natural scenes. Annu Rev Psychol. 2008;59:167–192. doi: 10.1146/annurev.psych.58.110405.085632. [DOI] [PubMed] [Google Scholar]
- 21.Hayhoe M, Ballard D. Eye movements in natural behavior. Trends Cogn Sci. 2005;9(4):188–194. doi: 10.1016/j.tics.2005.02.009. [DOI] [PubMed] [Google Scholar]
- 22.Geisler WS. Sequential ideal-observer analysis of visual discriminations. Psychol Rev. 1989;96(2):267–314. doi: 10.1037/0033-295x.96.2.267. [DOI] [PubMed] [Google Scholar]
- 23.Peterson W, Birdsall T, Fox W. The theory of signal detectability. IRE Professional Group on Information Theory. 1954;4(4):171–212. [Google Scholar]
- 24.Gold J, Bennett PJ, Sekuler AB. Identification of band-pass filtered letters and faces by human and ideal observers. Vision Res. 1999;39(21):3537–3560. doi: 10.1016/s0042-6989(99)00080-2. [DOI] [PubMed] [Google Scholar]
- 25.Legge GE, Klitz TS, Tjan BS. Mr. Chips: An ideal-observer model of reading. Psychol Rev. 1997;104(3):524–553. doi: 10.1037/0033-295x.104.3.524. [DOI] [PubMed] [Google Scholar]
- 26.Carrasco M, Talgar CP, Cameron EL. Characterizing visual performance fields: Effects of transient covert attention, spatial frequency, eccentricity, task and set size. Spat Vis. 2001;15(1):61–75. doi: 10.1163/15685680152692015. [DOI] [PMC free article] [PubMed] [Google Scholar]
- 27.Peli E, Yang J, Goldstein RB. Image invariance with changes in size: The role of peripheral contrast thresholds. J Opt Soc Am A. 1991;8(11):1762–1774. doi: 10.1364/josaa.8.001762. [DOI] [PubMed] [Google Scholar]
- 28.Burgess AE. Statistically defined backgrounds: Performance of a modified nonprewhitening observer model. J Opt Soc Am A Opt Image Sci Vis. 1994;11(4):1237–1242. doi: 10.1364/josaa.11.001237. [DOI] [PubMed] [Google Scholar]
- 29.Solomon JA, Pelli DG. The visual filter mediating letter identification. Nature. 1994;369(6479):395–397. doi: 10.1038/369395a0. [DOI] [PubMed] [Google Scholar]
- 30.Chung STL, Legge GE, Tjan BS. Spatial-frequency characteristics of letter identification in central and peripheral vision. Vision Res. 2002;42(18):2137–2152. doi: 10.1016/s0042-6989(02)00092-5. [DOI] [PubMed] [Google Scholar]
- 31.Najemnik J, Geisler WS. Optimal eye movement strategies in visual search. Nature. 2005;434(7031):387–391. doi: 10.1038/nature03390. [DOI] [PubMed] [Google Scholar]
- 32.Parkhurst D, Law K, Niebur E. Modeling the role of salience in the allocation of overt visual attention. Vision Res. 2002;42(1):107–123. doi: 10.1016/s0042-6989(01)00250-4. [DOI] [PubMed] [Google Scholar]
- 33.Tatler BW. The central fixation bias in scene viewing: Selecting an optimal viewing position independently of motor biases and image feature distributions. J Vis. 2007;7(14):4.1–17. doi: 10.1167/7.14.4. [DOI] [PubMed] [Google Scholar]
- 34.Walker-Smith GJ, Gale AG, Findlay JM. Eye movement strategies involved in face perception. Perception. 1977;6(3):313–326. doi: 10.1068/p060313. [DOI] [PubMed] [Google Scholar]
- 35.Williams CC, Henderson JM. The face inversion effect is not a consequence of aberrant eye movements. Mem Cognit. 2007;35(8):1977–1985. doi: 10.3758/bf03192930. [DOI] [PubMed] [Google Scholar]
- 36.Althoff RR, Cohen NJ. Eye-movement-based memory effect: A reprocessing effect in face perception. J Exp Psychol Learn Mem Cogn. 1999;25(4):997–1010. doi: 10.1037//0278-7393.25.4.997. [DOI] [PubMed] [Google Scholar]
- 37.Arizpe J, Kravitz DJ, Yovel G, Baker CI. Start position strongly influences fixation patterns during face processing: Difficulties with eye movements as a measure of information use. PLoS ONE. 2012;7(2):e31106. doi: 10.1371/journal.pone.0031106. [DOI] [PMC free article] [PubMed] [Google Scholar]
- 38.Heisz JJ, Shore DI. More efficient scanning for familiar faces. J Vis. 2008;8(1):9.1–10. doi: 10.1167/8.1.9. [DOI] [PubMed] [Google Scholar]
- 39.Norcia AM, Tyler CW, Hamer RD. Development of contrast sensitivity in the human infant. Vision Res. 1990;30(10):1475–1486. doi: 10.1016/0042-6989(90)90028-j. [DOI] [PubMed] [Google Scholar]
- 40.Nelson CA. The development and neural bases of face recognition. Infant Child Dev. 2001;10(1–2):3–18. [Google Scholar]
- 41.Buchan JN, Paré M, Munhall KG. Spatial statistics of gaze fixations during dynamic face processing. Soc Neurosci. 2007;2(1):1–13. doi: 10.1080/17470910601043644. [DOI] [PubMed] [Google Scholar]
- 42.Allison T, Puce A, McCarthy G. Social perception from visual cues: Role of the STS region. Trends Cogn Sci. 2000;4(7):267–278. doi: 10.1016/s1364-6613(00)01501-1. [DOI] [PubMed] [Google Scholar]
- 43.Baron-Cohen S. Mindblindness: An Essay on Autism and Theory of Mind. Cambridge, MA: MIT Press; 2001. [Google Scholar]
- 44.Jack RE, Blais C, Scheepers C, Schyns PG, Caldara R. Cultural confusions show that facial expressions are not universal. Curr Biol. 2009;19(18):1543–1548. doi: 10.1016/j.cub.2009.07.051. [DOI] [PubMed] [Google Scholar]
- 45.Blais C, Jack RE, Scheepers C, Fiset D, Caldara R. Culture shapes how we look at faces. PLoS ONE. 2008;3(8):e3022. doi: 10.1371/journal.pone.0003022. [DOI] [PMC free article] [PubMed] [Google Scholar]
- 46.Dalton KM, et al. Gaze fixation and the neural circuitry of face processing in autism. Nat Neurosci. 2005;8(4):519–526. doi: 10.1038/nn1421. [DOI] [PMC free article] [PubMed] [Google Scholar]
- 47.Klin A, Jones W, Schultz R, Volkmar F, Cohen D. Visual fixation patterns during viewing of naturalistic social situations as predictors of social competence in individuals with autism. Arch Gen Psychiatry. 2002;59(9):809–816. doi: 10.1001/archpsyc.59.9.809. [DOI] [PubMed] [Google Scholar]
- 48.Pelphrey KA, et al. Visual scanning of faces in autism. J Autism Dev Disord. 2002;32(4):249–261. doi: 10.1023/a:1016374617369. [DOI] [PubMed] [Google Scholar]
- 49.Barton JJS, Radcliffe N, Cherkasova MV, Edelman JA. Scan patterns during the processing of facial identity in prosopagnosia. Exp Brain Res. 2007;181(2):199–211. doi: 10.1007/s00221-007-0923-2. [DOI] [PubMed] [Google Scholar]
- 50.Caldara R, et al. Does prosopagnosia take the eyes out of face representations? Evidence for a defect in representing diagnostic facial information following brain damage. J Cogn Neurosci. 2005;17(10):1652–1666. doi: 10.1162/089892905774597254. [DOI] [PubMed] [Google Scholar]
- 51.Orban de Xivry JJ, Ramon M, Lefèvre P, Rossion B. Reduced fixation on the upper area of personally familiar faces following acquired prosopagnosia. J Neuropsychol. 2008;2(Pt 1):245–268. doi: 10.1348/174866407x260199. [DOI] [PubMed] [Google Scholar]
- 52.Gordon E, et al. Eye movement response to a facial stimulus in schizophrenia. Biol Psychiatry. 1992;31(6):626–629. doi: 10.1016/0006-3223(92)90251-t. [DOI] [PubMed] [Google Scholar]
- 53.Manor BR, et al. Eye movements reflect impaired face processing in patients with schizophrenia. Biol Psychiatry. 1999;46(7):963–969. doi: 10.1016/s0006-3223(99)00038-4. [DOI] [PubMed] [Google Scholar]
- 54.Tottenham N, et al. The NimStim set of facial expressions: Judgments from untrained research participants. Psychiatry Res. 2009;168(3):242–249. doi: 10.1016/j.psychres.2008.05.006. [DOI] [PMC free article] [PubMed] [Google Scholar]
