

Abstract
To date, 68 loci have been associated with type 2 diabetes (T2D) or glucose homeostasis traits. We report here the results of experiments aimed at functionally characterizing the SNPs replicated for T2D and glucose traits. We sought to determine whether these loci were associated with transcript levels in adipose, muscle, liver, lymphocytes, and pancreatic β-cells. We found an excess of trans, rather than cis, associations among these SNPs in comparison to what was expected in adipose and muscle. Among transcripts differentially expressed (FDR < 0.05) between muscle or adipose cells of insulin-sensitive individuals and those of insulin-resistant individuals (matched on BMI), trans-regulated transcripts, in contrast to the cis-regulated ones, were enriched. The paucity of cis associations with transcripts was confirmed in a study of liver transcriptome and was further supported by an analysis of the most detailed transcriptome map of pancreatic β-cells. Relative to location- and allele-frequency-matched random SNPs, both the 68 loci and top T2D-associated SNPs from two large-scale genome-wide studies were enriched for trans eQTLs in adipose and muscle but not in lymphocytes. Our study suggests that T2D SNPs have broad-reaching and tissue-specific effects that often extend beyond local transcripts and raises the question of whether patterns of cis or trans transcript regulation are a key feature of the architecture of complex traits.
Introduction
To date, at least 68 regions have shown replicated association with type 2 diabetes (T2D; MIM 125853), fasting or post-challenge glucose levels, or insulin sensitivity.1–3 These variants are all common SNPs; with just a few exceptions, the disease-associated SNPs are themselves noncoding—they reside in either intronic or intergenic regions—and are not in linkage disequilibrium with known nonsynonymous SNPs. Hence, few of the T2D- and glucose-homeostasis-associated SNPs are likely to alter protein function; rather, they are expected to alter gene regulation and/or splicing.4,5 Because many of the T2D- and glucose-homeostasis-associated SNPs are also associated with measures of insulin secretion (such measures are often surrogate, as in HOMA-B or insulin response to oral glucose),6 most have been thought to act primarily to alter pancreatic β-cell function.7 Nonetheless, the specific transcripts reported to be implicated by GWAS findings are often at a considerable distance from the disease-associated SNP. In rare cases do functional data implicate any particular gene or transcript in the disease association. Furthermore, many of the transcripts near T2D-associated SNPs are widely expressed, including in the diabetes-relevant tissues liver, adipose, and muscle. Thus, a much broader impact on T2D susceptibility is plausible, and the actual molecular and physiological explanations for these well-replicated associations remain uncertain.
The use of expression quantitative trait (eQTL) mapping has recently elucidated and expanded on GWAS findings.8,9 For example, a recent eQTL study in liver showed that some implicated transcripts for type 1 diabetes (MIM 222100) were probably incorrect.8 A recent study of celiac disease (MIM 212750)10 reported that 52% of disease-associated SNPs were also associated with cis-regulated eQTLs in blood cells. Nicolae et al.11 reported that SNPs associated with traits from the Wellcome Trust Case Control Consortium were more likely to be eQTLs (e.g., particularly cis eQTLs in Crohn disease [MIM 266600]) in transformed lymphocytes, supporting the use of surrogate tissues to identify functional transcripts. Nica et al.12 reported similar findings. These studies did not specifically address the question of whether the SNPs reproducibly associated with T2D and related traits are more likely to be eQTLs than randomly selected SNPs of similar frequency.11 Hence, functional data explaining the association of SNPs with T2D and glucose homeostasis are lacking. Furthermore, the tacit assumption in suggesting that these disease-associated SNPs act through specific transcripts near T2D- and glucose-homeostasis2,3,13-associated SNPs is without supportive data.
Although our results provide some support for the regulation of transcripts near GWAS SNPs by cis-acting eQTLs and more generally support a role of these SNPs in tissues other than pancreatic β-cells, our analyses suggest a much broader role for GWAS SNPs in controlling distal transcripts than has been appreciated. We found that replicated T2D- and glucose-homeostasis-associated SNPs were enriched for trans eQTLs for transcripts differentially expressed between insulin-sensitive and insulin-resistant individuals. In contrast to recent studies using transformed lymphocytes,11,12 we further found that trans eQTLs (and not cis eQTLs) in adipose and muscle were enriched among the top associations from recently published T2D GWAS studies. Hence, eQTL mapping in tissues relevant to glucose homeostasis promises to provide insights into the mechanisms driving T2D susceptibility.
Methods
Ethics Statement
All study participants provided written, informed consent under protocols originally approved by the University of Arkansas for Medical Sciences Institutional Review Board.
Human Subjects and Tissues: Adipose and Muscle
Details of the study for transcript levels with insulin sensitivity in adipose and muscle tissue were previously described.14 In brief, individuals were chosen from previous studies for availability of both adipose and muscle biopsy samples and insulin sensitivity (SI) calculated from the insulin-modified, intravenous glucose-tolerance test. Participants were of age 20–55 years, their body mass index (BMI) was between 19 kg/m2 and 42 kg/m2, and all biopsies were obtained while participants were in the fasting state. Adipose biopsies were obtained under local anesthesia from abdominal subcutaneous fat by either needle biopsy (34 individuals) or incision (28 individuals), rinsed in saline, and frozen in liquid nitrogen. Muscle samples were obtained from the vastus lateralis by Bergstrom needle biopsy under local anesthesia and frozen in liquid nitrogen. Samples included in the study were obtained from 62 of 184 total study participants (136 European American, 48 African American) who were at the tails of the distribution of insulin sensitivity adjusted for age, gender, and natural logarithm of BMI for each ethnic group separately. Individuals in each tail were well matched for age, gender, BMI, and percent fat but were significantly different for SI (p < 10−5). The numbers of adipose and muscle samples were evenly divided between the extremes of the insulin-sensitivity distribution (i.e., 31 samples were insulin sensitive, and 31 were insulin resistant). RNA was extracted, and labeled cRNA was prepared by linear amplification of the poly(A)+ RNA population within the total-RNA sample. Total RNA (1 μg) was reverse transcribed after being primed with a DNA oligonucleotide containing the T7 RNA polymerase promoter 5′ to a d(T)24 sequence. After second-strand cDNA synthesis and purification of double-stranded cDNA, in vitro transcription was performed with T7 RNA polymerase. We fragmented 1 μg of purified cRNA to uniform size and hybridized to Human Whole Genome 4×44k arrays (Agilent Technologies, Santa Clara, CA, USA) at 37°C for 18 hr, after which arrays were washed and scanned with a G2565 Microarray Scanner (Agilent Technologies).
Arrays were processed and background corrected with default settings of the Agilent Feature Extraction software v.9.5.3.1 (Agilent Technologies), and raw intensity data from each gene were quantile normalized to the 75th percentile intensity of each array. Only transcripts with values greater than background intensity in all samples were included for analysis in the current study. For comparison of insulin-sensitive and insulin-resistant individuals, array intensities were processed with the nonparametric Wilcoxan statistic on normalized data in Statistical Analysis for Microarray (SAM) software15. We calculated false-discovery rates (q value) on the basis of >400 permutations.
Liver Samples and Expression Arrays
Details of the study on the identification, replication, and functional fine mapping of eQTLs in primary human liver tissue and demographic information on the samples were previously described.16 In brief, liver was obtained from normal, nondiseased specimens of 220 individuals from deceased unrelated donors of self-reported European and African descent. The liver tissue samples were derived from donor livers not used for organ transplants and from tissues that remained after a partial graft into a smaller patient (e.g., a pediatric patient). RNA was extracted by homogenization in TRIzol reagent followed by QIAGEN RNeasy column (QIAGEN, Germantown, MD, USA). From total RNA, labeled cRNA was prepared, hybridized to Agilent 4×44 arrays, washed, and scanned as described above.
Genome-wide Association
For the adipose and muscle sample, all 62 individuals underwent genotyping with the Illumina 1M platform. Genotyping was performed at the Pharmacogenomics Laboratory of the Central Arkansas Veterans Healthcare System according to standard Illumina protocols. The full marker set included 1,124,117 SNPs and had a genotyping rate of 0.999 and 8039 markers excluded for deviation from Hardy-Weinberg equilibrium (Fisher’s exact test, p ≤ 0.001). Of the 62 individuals, 45 were reported to be female, which was confirmed prior to genotyping via X and Y chromosome markers. Using Illumina X chromosome genotype data to assign gender based on heterozygosity rate, we determined three samples to be ambiguous.
DNA was extracted from liver samples, and genotyping was performed on the Illumina human 610 quad beadchip (Illumina, San Diego, CA, USA). Of the 620,901 SNPs in the full set, we excluded 8,300 markers for deviation from Hardy-Weinberg equilibrium (Fisher’s exact test, p ≤ 0.001). We excluded an additional 29,705 SNPs for more than 10% missing genotypes.
We used the probe genomic coordinates to map each probe by using Agilent probe annotation to NCBI Entrez database, build 36. Probes that could not be annotated to a RefSeq gene and Entrez identifier were excluded from further analysis. To avoid spurious eQTLs resulting from SNPs residing under probe sequences,17 we flagged all probes that mapped to a variant in dbSNP (v129),18 although 60-mers used in Agilent arrays are less likely to give spurious results than shorter probes.
Ancestry Estimation
We used the HapMap CEU, YRI, and ASN populations as reference panels and performed a principal-component analysis (PCA) of race on each study sample by using GWAS data. PCA was conducted with “smartpca” as implemented in the EIGENSTRAT program.19 For the 62 samples comprising 40 European American and 22 African American samples, the samples clustered as expected from self-identified ethnicity: European American samples clustered tightly with HapMap CEU individuals and African American samples showed the presence of European admixture.
Transcript Selection
We identified 68 well-replicated SNPs that were associated with T2D, fasting glucose levels,1–3,20–22 insulin sensitivity,23 and postchallenge glucose levels3 and that were in the public domain. For each region, we used SCAN24 to identify transcripts that overlapped the regions near the implicated SNPs (defined as the 1 Mb region centered at the SNP) and that contained variants in linkage disequilibrium with those SNPs (r2 > 0.3), resulting in 183 identified transcripts (Table S1 in the Supplemental Data available with this article online).
Transcript Association with Insulin Sensitivity
For transcripts near replicated SNPs associated with T2D and metabolic traits, we report t-test-based associations with insulin sensitivity. We examined all data (European American and African American) together, and given the primary association in European-ancestry populations, we tested European American samples separately. We report the n-fold difference, single-point p value, and Q value for each comparison. Where multiple probes were observed, we provide the best result and indicate alternative probes.
eQTL Mapping
We imputed untyped variation by using MACH25 to increase the number of SNPs for eQTL mapping. We used probe-level analysis of expression with two linear models to map expression-quantitative traits. First, we constructed a linear model involving the combined study samples:
where P is the normalized probe-level expression value, μ is the expected value of the probe expression intensity, R is the genetic ancestry covariate, and e is the residual error. A second model is a population-specific linear model (in the European Americans). According to the ancestry estimation we conducted with Eigenstrat,19 there was no need to include any of the population-specific eigenvectors as covariates in the second model.
For each model, we performed eQTL mapping by testing each marker for the additive effect of allele dosage on covariate-adjusted normalized probe-level expression intensity. Cis-regulatory elements were defined to be SNPs within 500 kb of the probe because a recent study has shown that most fall within that genomic segment upstream or downstream from the target gene.26 Trans-acting elements were defined as those more than 500 kb away from the probe on the same chromosome or as those on a different chromosome. We tested the evidence for each eQTL association under each of the two models: that in which the combined sample was adjusted for ancestry and the population-specific linear model for European Americans.
The presence of unmeasured or hidden factors such as batch effects, technical factors, and other global confounders might reduce the power to detect eQTLs. We thus utilized the probabilistic estimation of expression residuals (PEER) framework,27 which is related to surrogate variable analysis and infers hidden determinants of expression variation. We utilized the residual data set of expression values generated after regressing out the learned factors. The pairwise correlation between the normalized expression levels and the resulting residuals in adipose or muscle tissue for the probes for the transcripts included in our analysis had a mean of 0.99 and standard deviation of 0.01.
We used PLINK28 to calculate the MAF for each SNP in each population separately and in the combined sample set to identify rare SNPs (MAF < 5%), which were excluded from analysis on the basis of insufficient power to detect significant transcript associations. To test whether the replicated T2D and glucose-homeostasis-associated SNPs, as well as the top signals in two independent large-scale GWASs (WTCCC29 and a GWAS of T2D in Mexican Americans from Starr County, TX30), were enriched for eQTLs, in each case we generated 1,000 randomly selected sets of SNPs of the same size and matching MAF and location (with respect to the nearest gene) as those of the test set, as previously described.11 We empirically generated the null distribution by counting the number of expression-associated SNPs (at p < 10−3) in each random set for each tissue evaluated separately. We also evaluated enrichment at p < 10−4 for the SNP-transcript association in order to test the robustness of an enrichment result to the choice of p value threshold. We estimated the enrichment p value by comparing the observed expression-associated SNP count to the null distribution. Using a similar simulation procedure, we conducted a cis eQTL (within 500 kb) enrichment analysis for each tissue included in the study. We performed an extended cis eQTL enrichment analysis for SNPs within 4 Mb of a gene to test the robustness of our observation on the paucity of cis-regulatory signals. To investigate whether the observed enrichment in reproducibly associated T2D- and glucose-homeostasis-associated SNPs was driven by LD, we performed a simulation analysis with a stringent r2 threshold of less than 0.30, as previously described.11
Results
We sought functional data for each of the 68 regions implicated by replicated association with T2D and glucose-homeostasis traits (fasting or postchallenge glucose levels or insulin sensitivity) (See Table 1). We considered recent data that most cis-acting variants are within genes or are close to transcription start or stop sites.26 Thus, we chose all transcripts that overlap the regions near the implicated SNPs (defined as the 1 Mb region centered at the SNP) and that contained variants in linkage disequilibrium with those SNPs (r2 > 0.3). We identified 183 such transcripts, of which nearly 60% were expressed in at least one of three tissues important to T2D pathogenesis: liver, subcutaneous adipose, and muscle.
Table 1.
SNPs Replicated for Type 2 Diabetes and Glucose-Homeostasis Traits
| SNP | Chromosome | Position | Alleles | Gene | MIM ID |
|---|---|---|---|---|---|
| rs10010131 | 4 | 6,343,816 | A/G | WFS1 | 606201 |
| rs10423928 | 19 | 50,874,144 | A/T | GIPR | 137241 |
| rs10440833 | 6 | 20,796,100 | A/T | CDKAL1 | 611259 |
| rs10811661 | 9 | 22,124,094 | C/T | ||
| rs10830963 | 11 | 92,348,358 | C/G | MTNR1B | 600804 |
| rs10885122 | 10 | 113,032,083 | G/T | ||
| rs10923931 | 1 | 120,319,482 | G/T | NOTCH2 | 600275 |
| rs10965250 | 9 | 22,123,284 | A/G | ||
| rs11071657 | 15 | 60,221,254 | A/G | ||
| rs1111875 | 10 | 94,452,862 | A/G | ||
| rs11558471 | 8 | 118,254,914 | A/G | SLC30A8 | 611145 |
| rs11605924 | 11 | 45,829,667 | A/C | CRY2 | 603732 |
| rs11634397 | 15 | 78,219,277 | A/G | ||
| rs11642841 | 16 | 52,402,988 | A/C | FTO | 610966 |
| rs11708067 | 3 | 124,548,468 | A/G | ADCY5 | 600293 |
| rs11899863 | 2 | 43,472,323 | C/T | THADA | 611800 |
| rs11920090 | 3 | 172,200,215 | A/T | SLC2A2 | 138160 |
| rs12243326 | 10 | 114,778,805 | C/T | TCF7L2 | 602228 |
| rs1260326 | 2 | 27,584,444 | C/T | GCKR | 600842 |
| rs12779790 | 10 | 12,368,016 | A/G | ||
| rs13081389 | 3 | 12,264,800 | A/G | ||
| rs13266634 | 8 | 118,253,964 | C/T | SLC30A8 | 611145 |
| rs13292136 | 9 | 81,141,948 | C/T | ||
| rs1387153 | 11 | 92,313,476 | C/T | ||
| rs1470579 | 3 | 187,011,774 | A/C | IGF2BP2 | 608289 |
| rs1531343 | 12 | 64,461,161 | C/G | ||
| rs1552224 | 11 | 72,110,746 | G/T | ARAP1 | 606646 |
| rs163184 | 11 | 2,803,645 | G/T | KCNQ1 | 607542 |
| rs17271305 | 15 | 60,120,272 | A/G | VPS13C | 608879 |
| rs174550 | 11 | 61,328,054 | C/T | FADS1 | 606148 |
| rs1801214 | 4 | 6,353,923 | C/T | WFS1 | 606201 |
| rs1801282 | 3 | 12,368,125 | C/G | PPARG | 601487 |
| rs2191349 | 7 | 15,030,834 | G/T | ||
| rs2237892 | 11 | 2,796,327 | C/T | KCNQ1 | 607542 |
| rs231362 | 11 | 2,648,047 | C/T | KCNQ1 | 607542 |
| rs243021 | 2 | 60,438,323 | C/T | ||
| rs2877716 | 3 | 124,577,141 | C/T | ADCY5 | 600293 |
| rs2943641 | 2 | 226,801,989 | C/T | ||
| rs340874 | 1 | 212,225,879 | A/G | ||
| rs35767 | 12 | 101,399,699 | C/T | ||
| rs3802177 | 8 | 118,254,206 | C/T | SLC30A8 | 611145 |
| rs4430796 | 17 | 33,172,153 | A/G | HNF1B | 189907 |
| rs4457053 | 5 | 76,460,705 | A/G | ||
| rs4506565 | 10 | 114,746,031 | A/T | TCF7L2 | 602228 |
| rs4607103 | 3 | 64,686,944 | C/T | ||
| rs4607517 | 7 | 44,202,193 | A/G | ||
| rs4760790 | 12 | 69,921,061 | A/G | ||
| rs5015480 | 10 | 94,455,539 | C/T | ||
| rs5215 | 11 | 17,365,206 | C/T | KCNJ11 | 600937 |
| rs560887 | 2 | 169,471,394 | A/G | G6PC2 | 608058 |
| rs5945326 | X | ||||
| rs6795735 | 3 | 64,680,405 | C/T | ||
| rs7034200 | 9 | 4,279,050 | A/C | GLIS3 | 610192 |
| rs757210 | 17 | 33,170,628 | A/G | HNF1B | 189907 |
| rs7578326 | 2 | 226,728,897 | A/G | ||
| rs7578597 | 2 | 43,586,327 | C/T | THADA | 611800 |
| rs7754840 | 6 | 20,769,229 | C/G | CDKAL1 | 611259 |
| rs780094 | 2 | 27,594,741 | A/G | GCKR | 600842 |
| rs7903146 | 10 | 114,748,339 | C/T | TCF7L2 | 602228 |
| rs7944584 | 11 | 47,292,896 | A/T | MADD | 603584 |
| rs7957197 | 12 | 119,945,069 | A/T | OASL | 603281 |
| rs7961581 | 12 | 69,949,369 | C/T | ||
| rs8042680 | 15 | 89,322,341 | A/C | PRC1 | 603484 |
| rs849134 | 7 | 28,162,747 | A/G | JAZF1 | 606246 |
| rs864745 | 7 | 28,147,081 | A/G | JAZF1 | 606246 |
| rs896854 | 8 | 96,029,687 | A/G | TP53INP1 | 606185 |
| rs972283 | 7 | 130,117,394 | A/G | ||
| rs9939609 | 16 | 52,378,028 | A/T | FTO | 610966 |
Figure 1 is a schematic diagram of our approach. We report the results of three major analyses:
-
1.
Association analyses between the full set of SNPs (nearly 1 million) and a limited number of transcripts (n = 183) were aimed at identifying eQTLs for transcripts near T2D and glucose-trait-associated SNPs (Figure 1A). We also considered the subset of the 183 transcripts that were differentially expressed between insulin-sensitive and insulin-resistant individuals.
-
2.
Association analyses between a limited number of SNPs (n = 68) and the full set of transcripts (n = 13,024 in muscle and n = 15,507 in adipose tissue) to functionally characterize the T2D and glucose-trait-associated SNPs as eQTLs (Figure 1B). We also characterized target transcripts that were differentially expressed between insulin-sensitive and insulin-resistant individuals.
-
3.
Tissue-level enrichment analyses for expression-associated SNPs—first, among the T2D- and glucose-trait-associated SNPs, then among the top associations from T2D GWASs—for adipose and muscle transcripts associated with insulin sensitivity and for transcripts in additional tissues (Figure 1C).
Figure 1.
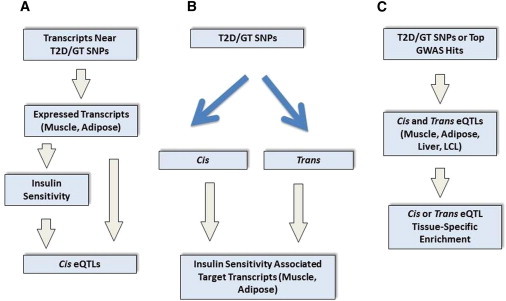
A Schematic Diagram of the Analyses
(A) We conducted association analyses between the full set of SNPs (nearly 1 million) and a limited number of transcripts (n = 183) to identify eQTLs for transcripts near T2D- and glucose-trait-associated SNPs. We also considered the subset of the 183 transcripts that were differentially expressed between insulin-sensitive and insulin-resistant individuals.
(B) We conducted association analyses between a limited number of SNPs (n = 68) and the full set of transcripts (n = 13,024 in muscle and n = 15,507 in adipose) to functionally characterize the T2D- and glucose-trait-associated SNPs as eQTLs. We also characterized target transcripts that were differentially expressed between insulin-sensitive and insulin-resistant individuals.
(C) We performed tissue-level enrichment analyses for expression-associated SNPs—first, among the T2D- and glucose-trait-associated SNPs, then among the top associations from T2D GWASs—for adipose and muscle transcripts associated with insulin sensitivity and for transcripts in additional tissues.
eQTLs for Transcripts near T2D and Glucose-Trait Associated SNPs
On the basis of the hypothesis that SNPs identified in GWASs are acting locally to alter transcript expression, we searched for cis eQTLs controlling these 183 transcripts (Figure 1A).
For simplicity, we refer to T2D- and glucose-trait-associated SNPs as “T2D/GT SNPs.” We refer to the transcripts that overlap the 1 Mb regions centered at the T2D/GT SNPs and that contain variants in LD (r2 > 0.3) with those SNPs as transcripts “near the T2D/GT SNPs.”
To test each expressed transcript near the T2D/GT SNPs in adipose for control by eQTLs, we conducted separate analyses for trans-acting and cis-acting (under 500 kb) eQTLs. Given the number of adipose-expressed (n = 106) transcripts near T2D/GT SNPs and the nearly 1 million SNPs tested, we used p < 5 × 10⁻¹⁰ (based on Bonferroni adjustment) to search for trans eQTLs. Notably, we identified genome-wide-significant trans eQTLs for nine of the transcripts located near T2D/GT SNPs, including MAPK8IP1 (MIM 604641) (e.g., rs2696490, p = 7.18 × 10⁻²⁴), TCF7L2 (MIM 602228) (e.g., rs11198893, p = 2.19 × 10⁻¹¹), SEC61A2 (e.g., rs12935562, p = 2.12 × 10⁻¹⁰), and PPP2R2C (MIM 605997) (rs3765618, p = 4.78 × 10⁻¹⁰). In adipose, we identified cis eQTLs for five of the 106 expressed transcripts after correction based on the actual number of cis tests for adipose-expressed transcripts near T2D/GT SNPs (p < 10−6). Cis eQTLs were found for two transcripts in the GCKR region on chromosome 2: KRTCAP3 (rs1647266, p = 1.71 × 10⁻⁷) and SUPT7L (MIM 612762) (rs2178197, p = 7.10 × 10⁻¹⁰). Additional cis eQTLs were for VPS33B (MIM 608552) (rs7403304, p = 9.86 × 10⁻⁷)); SYN2 (MIM 600755) (rs13089415, p = 3.8 × 10⁻⁸); and OASL (MIM 603281) (rs959398, p = 1.94 × 10⁻⁸). Interestingly, these cis-regulated transcripts near T2D/GT SNPs were also trans targets for other genome-wide-significant eQTLs (such transcripts included KRTCAP3 [rs35980734, p = 2.9 × 10⁻¹⁰]) or were implicated by strong trans associations (that were just short of having Bonferroni significance) (such transcripts included OASL [rs6854530, p = 6.55 × 10⁻¹⁰]). These results in adipose are summarized in Table S2.
Similarly, we evaluated each muscle-expressed transcript near the T2D/GT SNPs for eQTL regulation; again, we tested for trans-acting and cis-acting (under 500 kb) eQTLs separately. Given the number of transcripts that were near T2D/GT SNPs and were expressed in muscle (n = 97) and the nearly 1 million SNPs tested, we used p < 5 × 10⁻¹⁰ (based on Bonferroni adjustment) to search for trans-acting eQTLs. We detected several such trans eQTLs for three transcripts, namely MAPK8IP1 (MIM 604641) (e.g., rs2696490, p = 3.5 × 10⁻¹⁷), C11orf9 (MIM 608329) (e.g., rs2278210, p = 5.4 × 10⁻¹²), and GTF3C2 (MIM 604883) (e.g., rs7733988, p = 1.12 × 10⁻¹⁰). Of note, rs2696490 was a trans eQTL for MAPK8IP1 in both adipose and muscle. Under the same criteria in muscle to define a cis eQTL (based on the actual number of cis tests, p < 10−6), no cis eQTLs were detected for transcripts near T2D/GT SNPs. These results in muscle are summarized in Table S3.
In general, transcripts near T2D/GT SNPs were not under cis eQTL control in either adipose or muscle. Interestingly, we identified several more that were under trans eQTL regulation (by using a stringent Bonferroni threshold).
Insulin Sensitivity and Transcripts near T2D and Glucose-Trait-Associated SNPs
A recent analysis argued that eQTLs near a SNP associated with T2D or glucose homeostasis are not necessarily functionally related to disease.12 Because our sample was drawn from individuals matched on body mass index and discordant for insulin sensitivity (SI), we asked whether each transcript near T2D/GT SNPs was also differentially expressed in insulin-sensitive versus insulin-resistant individuals and whether such differentially expressed transcripts were controlled by eQTLs (Figure 1A). We used an FDR31 approach for multiple testing and defined a transcript as “differentially expressed between insulin-sensitive and insulin-resistant individuals” or as “associated with insulin sensitivity” if the transcript satisfied FDR < 0.05.
Near the T2D/GT SNP rs10010131 in WFS1 (MIM 606201), adipose transcript PPP2R2C, a trans target for the eQTL rs3765618 (p = 4.78 × 10⁻¹⁰), was increased with insulin resistance (1.36-fold change). Among the transcripts near T2D/GT SNPs, no cis-associated transcripts in adipose were associated with insulin sensitivity. In muscle, among the transcripts near T2D/GT SNPs, no target transcripts (either cis- or trans- associated with an eQTL) were found to be associated with insulin sensitivity.
At a loose threshold (p < 1 × 10⁻⁸) for a candidate regulatory SNP’s association with transcript levels for transcripts near the T2D/GT SNPs, we found that no additional adipose transcript and only one muscle transcript, FADS1 (MIM 606148) (trans associated with rs17004857, p = 5.5 × 10⁻⁹), differed between insulin-sensitive and insulin-resistant individuals. Furthermore, transcript levels (for transcripts near T2D/GT SNPs) associated with candidate cis-regulatory SNPs (at a less stringent threshold, p < 10−4) for transcripts including SUPT7L, JAZF1 (MIM 606246), SYN2, KRTCAP3, and NOSTRIN (MIM 607496) did not differ between insulin-sensitive and insulin-resistant subjects, despite suggestions that SYN2 and JAZF1 are the transcripts accounting for SNP associations with T2D.
More generally, transcripts (in either adipose or muscle) near T2D/GT SNPs were not enriched for transcripts associated with insulin sensitivity (Fisher’s exact test, p > 0.05).
Taken together, these data suggest that cis eQTLs for transcripts near T2D/GT SNPs are relatively unusual (indeed, several more transcripts near T2D/GT SNPs were found to be associated with trans-acting eQTLs) and largely tissue specific and that even in adipose and muscle the transcripts are not strongly associated with insulin sensitivity.
T2D- and Glucose-Trait-Associated SNPs as cis and trans eQTLs for Transcripts Associated with Insulin Sensitivity
Given the small number of cis eQTLs identified for transcripts near the 68 T2D and glucose-homeostasis-associated regions according to the 500 kb criteria, we asked whether T2D/GT SNPs were acting either more distally on the same chromosome or to control transcripts on other chromosomes (Figure 1B).
For each of the T2D/GT SNPs, we tested for association between the SNP and transcript levels in adipose and muscle (evaluated separately). After Bonferroni correction based on the 68 T2D/GT SNPs and the 15,507 tested expressed transcripts in adipose (p < 4.7 × 10⁻⁸), we observed that replicated T2D SNP rs13081389 was a cis eQTL (p = 3.8 × 10⁻⁸) for SYN2. In muscle, given the 13,024 expressed transcripts tested, no T2D/GT SNPs met genome-wide significance after a stringent Bonferroni correction (p < 5.6 × 10⁻⁸). However, we observed a significant enrichment for low p values among the trans associations, suggesting that the corresponding SNPs are master regulators of gene expression.
We then used p < 10−3 to filter the results of association testing between the T2D/GT SNPs and transcripts in muscle and adipose (evaluated separately). We used this loose threshold to identify a comprehensive list of transcripts that, although only nominally associated with established T2D/GT SNPs, were significantly differentially expressed, at a stringent threshold (FDR < 0.05), between insulin-sensitive and insulin-resistant individuals. Furthermore, we sought to determine whether transcripts nominally associated with T2D/GT SNPs were more likely to be differentially expressed (FDR < 0.05) between insulin-sensitive and insulin-resistant individuals than transcripts associated (at the same nominal level of association p < 10−3) with a random set of allele-frequency-matched SNPs. Finally, we sought to test the hypothesis that transcripts associated with T2D/GT SNPs, in trans versus in cis, were differentially expressed between insulin-sensitive and insulin-resistant individuals. We tested other p value thresholds for SNP-transcript association (p < 0.01, 0.05, and 0.10) and found that at the threshold p < 10−3 (but not at less-stringent p value thresholds), the T2D/GT SNPs were more significantly associated than expected with transcripts differentially expressed between insulin-sensitive and insulin-resistant individuals.
We considered transcripts associated with T2D/GT SNPs in muscle. We identified a single cis eQTL rs1635852, a proxy (r2 = 0.965) for the T2D-associated SNP rs864745, that was intronic in JAZF1 and associated with the expression of the gene (p = 1.08 × 10⁻⁵). However, JAZF1 was not significantly associated (p > 0.05) with insulin sensitivity. Notably, this same SNP was associated with several transcripts in trans, including PRPF19 (MIM 608330) (p = 2.4 × 10⁻⁵), a gene involved in transcriptional regulation in the development of the endocrine pancreas.32 Such widespread effects on transcription may be mediated through the actions of JAZF1, reported to be a transcriptional repressor. Transcript levels of MRPS6 (MIM 611973) and CHMP1A (MIM 164010) (both of which were trans associated with the same T2D SNP rs7034200, p = 8.03 × 10⁻⁵ and p = 3.71 × 10⁻⁵, respectively) differed significantly between insulin-sensitive and insulin-resistant individuals. Table S4 provides the full list of muscle transcripts that were associated with established T2D/GT SNPs and were differentially expressed between insulin-sensitive and insulin-resistant individuals.
For transcripts associated with T2D/GT SNPs in adipose, the results were similar. The SNP rs13081389 was significantly (Bonferroni) associated (p = 3.8 × 10⁻⁸) with SYN2 transcript levels 66 kb away; however, SYN2 was not associated with insulin sensitivity. Similarly, SNP rs4712523 was nominally associated (p = 2.45 × 10⁻⁴, in cis) with CDKAL1 (MIM 611259); transcript levels, however, did not differ between insulin-sensitive and insulin-resistant individuals. No additional cis-associated transcripts were found. In contrast, we found 20 transcripts that were trans associated with T2D/GT SNPs and significantly associated with insulin sensitivity. Table S5 contains the full list of adipose transcripts that were associated with replicated T2D/GT SNPs and were differentially expressed between insulin-sensitive and insulin-resistant individuals.
Taken together, these initial findings raised the hypothesis that replicated T2D/GT SNPs as putative eQTLs functioned in trans to alter the expression of transcripts that differed between insulin-sensitive and insulin-resistant individuals. Because these findings appeared to hold when we considered transcripts associated with T2D/GT SNPs at various thresholds (p < 10−3 and p < 10−4)—although, as expected given our sample size, using a more stringent definition reduced their absolute numbers—we sought to assess the significance of this overlap between transcripts associated with established T2D/GT SNPs and transcripts differentially expressed between insulin-sensitive and insulin-resistant individuals.
Tissue-Specific Enrichment of eQTLs for Transcripts Associated with Insulin Sensitivity among T2D- and Glucose-Homeostasis-Associated SNPs
It is possible that the observed number of transcripts that were (nominally) trans associated with T2D/GT SNPs and significantly associated with insulin sensitivity could simply reflect the large numbers of tests at this level; many of these are expected to have false-positive findings. Thus, we devised a simulation procedure to evaluate this possibility. We asked whether established T2D/GT SNPs showed more associations as putative trans-acting eQTLs with transcripts differentially expressed between insulin-sensitive and insulin-resistant individuals than expected by chance (Figure 1C). Using 1,000 sets of randomly generated SNPs whose MAF and location with respect to genes matched those of the T2D/GT SNPs (see Methods), we found that established T2D/GT SNPs were significantly more likely to be trans associated with differentially expressed transcripts than frequency-matched SNPs in adipose (enrichment p = 0.048). In contrast, no such enrichment was found for cis-associated transcripts (whether associated with insulin sensitivity or not). Consistent with this adipose finding, in muscle, we saw that two established T2D/GT SNPs, rs2881654 and rs7041847, were trans associated with differentially expressed transcripts (GGT6 [MIM 612341] and HDAC10 [MIM 608544] were associated with the first SNP and MRPS6 and CHMP1A were associated with the second), whereas no cis-acting eQTLs were identified among the T2D/GT SNPs for differentially expressed transcripts; however, the small number of SNPs trans associated with differentially expressed transcripts in muscle for both the empirically generated null sets and the set of replicated T2D/GT SNPs precludes enrichment analyses.
Because we identified cis eQTLs for only a small minority of transcripts near T2D/GT SNPs in adipose and muscle, we proceeded to test whether each of the T2D/GT SNPs was associated with target transcripts in a more extended cis region up to 4 Mb. At the threshold p < 0.001 for SNP association with gene expression, we observed no enrichment when we used the extended definition of cis (enrichment p = 0.366 and p = 0.160 in adipose and muscle, respectively). A similar analysis in transformed lymphocytes showed no eQTL24 enrichment (enrichment p = 0.502).
T2D and Glucose-Trait-Associated SNPs: Distal and Tissue-Specific Effects
These data suggested that GWAS SNPs have broad-reaching and tissue-specific effects that often extend beyond and may not generally include local transcripts. In adipose, 20 transcripts associated with established T2D/GT SNPs were found to be differentially expressed between insulin-resistant and insulin-sensitive individuals. In muscle, five such transcripts were identified. All were trans associations with replicated T2D/GT SNPs. No transcripts associated with both T2D/GT SNPs and insulin sensitivity were shared in adipose and muscle, supporting tissue specificity in the transcriptional effects of disease-associated SNPs. Furthermore, although no T2D/GT SNP was a cis-acting eQTL for differentially expressed transcripts in both adipose and muscle, a T2D/GT SNP (rs2881654) was associated with distal and differentially expressed transcripts in adipose (PHF20L1, C13orf1, CRTAP [MIM 605497], and REEP3 [MIM 609348]) and muscle (HDAC10 and GGT6), supporting the broad-reaching and tissue specific effects of disease-associated SNPs.
Cis and trans eQTLs in Additional Tissues
One possible explanation for our findings was the possibility that nearly all associations described to date alter expression in an inaccessible tissue in a tissue-specific manner. To confirm the lack of cis eQTLs near T2D- and glucose-homeostasis-associated SNPs, we examined liver for transcripts associated with T2D/GT SNPs.16 From the 68 T2D/GT SNPs and the nearly 20,000 transcripts tested, we identified a significant trans eQTL rs10787315 for INPP4B (MIM 607494) (p = 1.9 × 10⁻⁸). However, no transcript was found to be cis associated with a T2D/GT SNP even at the loose threshold p < 10−3. Hence, extended cis analysis in liver confirmed the muscle and adipose findings that although eQTLs are found among disease-associated SNPs, they are most often not close to their target transcripts.
To gain further insight into the regulatory role of the T2D/GT SNPs, we examined the recently published open chromatin map in pancreatic islets33 for overlap with the susceptibility variants. In particular, we sought to identify islet-selective open chromatin sites with islet-specific effects on target transcripts. This open chromatin map identified 340 genes with islet-selective open chromatin in the TSS or gene body. Only four transcripts near T2D/GT SNPs (namely, these transcripts are SLC30A8 [MIM 611145], ABCC8 [MIM 600509], FAM148A [MIM 610343], and G6PC2 [MIM 608058]) overlap this list; this number is no more than what is expected by chance (p = 0.38, Fisher’s exact test).
We then analyzed the most detailed transcriptome map of pancreatic β-cells to date34 from studies of human pancreatic islet samples and microarray analyses of purified rat beta cells, alpha cells, and INS-1 cells. This map identified 940 genes specific to pancreatic islets, of which 324 are likely to be primarily expressed in β-cells.34 Interestingly, only 11 of the 183 transcripts near T2D/GT SNPs overlap this list, and this number is no more than what is expected by chance (p = 0.24, Fisher’s exact test).
Taken together, these findings from studies of pancreatic islets support the paucity of cis eQTLs among T2D/GT SNPs observed in other diabetes-relevant tissues.
T2D- and Glucose-Homeostasis-Trait-Associated SNPs Converge on Trans Genes that Are Associated with Insulin Sensitivity
We sought to test the hypothesis that multiple replicated T2D/GT SNPs, as putative trans eQTLs, converged on the same downstream transcripts that were significantly associated with insulin sensitivity (FDR < 0.05). We found rs4607103 (on chromosome 3) and rs7754840 (on chromosome 6) were both trans associated with GPAM, a gene that is involved in triacylglycerol and phospholipid synthesis and that was significantly associated with insulin sensitivity in adipose in our data set. In adipose, the SNPs rs1552224 (on chromosome 11) and rs1801282 (on chromosome 3) were both trans associated with PHF20L1, which was a transcript differentially expressed between insulin-sensitive and insulin-resistant individuals. We found the SNPs rs13081389 (on chromosome 3) and rs243021 (on chromosome 2) implicated the insulin-sensitivity-associated adipose transcript TTC7B.35
The Observed eQTL Enrichment to Top GWAS Signals Is Generalizable in Independent T2D GWASs
Because the number of well-replicated T2D and glucose-homeostasis-associated SNPs evaluated above represented a limited set, we asked more generally whether SNPs that were ranked at the top for association with T2D but that were not necessarily replicated were also enriched for eQTLs from adipose and muscle. Using the Wellcome Trust Case Control study,29 we tested whether the SNPs ranked at the top for association with T2D (n = 1,000) showed an excess for trans eQTLs and, separately, for cis eQTLs. As in the case of T2D/GT SNPs, neither trans eQTLs nor cis eQTLs in transformed lymphocytes were highly enriched (enrichment p > 0.05) among the top associations with T2D. In contrast, trans associations with transcripts (as putative eQTLs) were enriched among the top associations in both adipose and muscle in comparison to expectations. Consistent with our earlier findings on the 68 T2D/GT SNPs, cis eQTLs showed no enrichment among the top associations. Figure 2 shows, for each tissue, quantile-quantile (Q-Q) plots that demonstrate, relative to expectation, an excess of trans-regulatory variation and a paucity of cis eQTLs among the top associations with T2D. Similarly, Figure S1 shows, for each tissue, the Q-Q plots for the distributions of p values for the trans and cis associations with transcripts differentially expressed between insulin-sensitive and insulin-resistant individuals for the top SNP associations with T2D.
Figure 2.
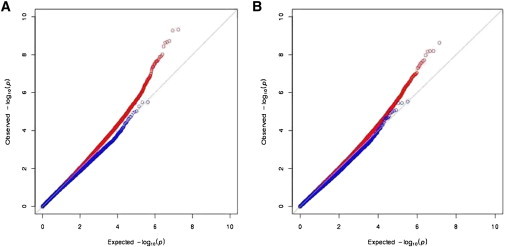
Top T2D SNPs Are Enriched for trans Regulatory Variation
For each tissue, quantile-quantile (Q-Q) plots show, relative to expectation, an excess of trans-regulatory variation and a paucity of cis eQTLs among the top associations with T2D in the Wellcome Trust Case Control study. Adipose is shown on the left; muscle is shown on the right. Red (blue) indicates the distribution of p values for all trans (cis, respectively) associations with transcript levels for the top associations with T2D. The x axis is the expected –log10(p value), and the y axis is the observed –log10(p value).
An analysis of a GWAS of T2D in Mexican Americans30 from Starr County, TX gave similar results. Among the top associations (p < 10−3), we observed a significant enrichment for trans associations with transcript levels in adipose and muscle (enrichment p < 0.001 in each tissue).
Thus, we demonstrate (1) that unlike lymphocytes, adipose and muscle can be used to identify likely functional variants among the top GWAS associations; (2) that our sample was adequate to show, over a range of p values, eQTL enrichment that distinguished T2D susceptibility variants from a random set of MAF-matched SNPs; and (3) that only a minority of SNPs with replicated associations with T2D and glucose-homeostasis traits act in cis in the diabetes-relevant tissues examined here (adipose, muscle, and liver) and that the number of cis eQTLs is nearly exactly what is expected, whereas the number of associations in trans is highly significantly increased relative to the null expectation.
Discussion
Few variants with replicated associations with T2D, fasting or postchallenge glucose levels, or insulin levels are coding or are known to be in strong linkage disequilibrium with coding SNPs. This observation would suggest that most SNPs act to alter gene expression and/or splicing rather than to modify gene products. Most published associations of sequence variants with T2D and glucose-homeostasis traits have identified transcripts in the general proximity of the associated variant as likely to be responsible, although for many of the regions tested in the current study, multiple transcripts are in close proximity to the most strongly associated SNP. With few exceptions, functional data implicating specific transcripts are lacking. Even for the widely expressed gene TCF7L2 near the variant most strongly associated with T2D, rs7903146, the functional consequences have been elusive until recently.33
Several studies have recently shown the value of eQTL mapping in surrogate tissues as a means of enhancing discovery and defining the function of SNPs identified in GWAS findings11,12,17. Similar results have been obtained in tissues of physiological relevance.36 Another recently published study37 showed that eQTLs in metabolically relevant tissues were enriched for T2D associations. However, the converse, that well-replicated SNPs associated with T2D or glucose homeostasis traits are enriched for eQTLs or mark regions with eQTLs, has never been comprehensively evaluated.
We investigated this question by using several approaches. First, we asked whether transcripts near these SNPs were indeed controlled by any cis eQTL, given the likelihood that the disease-associated SNP is not the functional SNP and that stronger associations might exist between other SNPs and nearby transcripts. Second, we tested the confirmed T2D and glucose-homeostasis-associated SNPs for a direct effect on gene expression locally or distally, particularly on transcripts differentially expressed between insulin-sensitive and insulin-resistant individuals. Third, to generalize our findings we extended our analysis to the top signals from two independent large-scale GWAS, evaluated separately. Whereas the set of well-replicated SNPs for T2D and glucose homeostasis traits tested the functional significance of our current understanding of T2D susceptibility associations, the extended analysis of top T2D GWAS SNPs explored additional potential loci and suggested a means to prioritize these loci using functional data. In both analyses, the level and significance of the enrichment were tissue-specific, with highly significant enrichment in adipose and muscle, but not in lymphocytes.
Our study highlights the unanticipated importance of T2D susceptibility loci as trans-acting regulators that often act on multiple distal transcripts. Surprisingly, neither the well-replicated T2D- and glucose-homeostasis-associated loci nor the top 1,000 T2D-associated SNPs showed a significant enrichment of cis-acting regulation of target transcripts in any of the four tissues examined: adipose, muscle, lymphocytes, or liver. Although islet tissue was not directly available for study, islet-specific open chromatin regions33 mark potential regions with cis-acting regulatory variants. We found that the number of genes that have islet-selective open chromatin in the TSS or gene body and overlap the regions near T2D/GT SNPs is not greater than expected by chance, thus indirectly supporting our hypothesis that most T2D and glucose-homeostasis susceptibility loci mediate their effects in a broad array of diabetes-relevant tissues through the regulation of distal transcripts.
Our study extends previous studies on the use of functional genomic data to enrich information provided in GWASs. Perry et al.38 sought to use gene-set enrichment to identify pathways enriched in T2D-associated SNPs, but they failed to identify any single pathways enriched for replicated SNPs. They did not directly test these SNPs for function. Parikh et al.39 examined expression profiling in public data sets from pancreas, adipose tissue, liver, and skeletal muscle from T2D and control tissues taken from a variety of relatively small studies of humans, rats, and mice. They selected 1,170 SNPs associated with T2D at p < 0.05. This corresponded to 243 genes, of which they reported that 115 were differentially expressed between diabetic and healthy tissues in any sample. Consistent with our observation on the absence of cis control of transcripts near replicated T2D-associated SNPs, only 5/115 differentially expressed genes had nearby T2D-associated SNPs. Zhong et al.36 recently used eQTLs in metabolically relevant tissues along with gene-set enrichment to search for nonreplicated SNPs that both control gene expression and cluster in pathways. Although their approach was to use function and association to identify important genetically controlled pathways, among their positive controls were 18 genes near replicated T2D GWAS SNPs. Their finding showed that cis eQTLs controlled transcripts NOTCH2 (MIM 600275), ADAMTS9 (MIM 605421), JAZF1, TSPAN8 (MIM 600769), PPARG (MIM 601487), and CDKAL1, and thus partially overlaps with the findings from our transcript-based analysis. Differences might reflect sample ascertainment, sample size, and tissues chosen for analysis. Interestingly, a second recent study from these investigators37 focused on cis-acting variants for transcripts in a B6xBTBR mouse cross and human genome-wide gene-expression cohorts. Of the 159 expression traits in the adipose “causal” subnetwork, 117 gave rise to an eQTL in a distinct region of chromosome 9, but only eight of these adipose transcripts were associated with a cis eQTL. These findings in a subnetwork selected from mouse crosses support our findings in human samples for transcripts near GWAS SNPs: Transcripts associated with glucose homeostasis are with some exceptions not under local control.
It is certainly possible that all of the results we have observed in muscle, adipose, and liver tissue are downstream of functional effects of these SNPs on nearby transcripts in pancreatic β-cells. Similarly, the fact that more of the transcripts implicated through trans associations with T2D/GT SNPs were differentially expressed in muscle and/or adipose could relate to the possibility that insulin sensitivity is a consequence of these downstream effects of SNPs that act in cis on nearby transcripts in β-cells. We would argue, however, that the biological insights related to the gene transcripts that have been implicated in these studies are no less important even if that were to be true. Transcripts that are implicated through multiple of the T2D/GT SNPs within and/or across tissues and that are also differentially expressed in insulin-sensitive versus insulin-resistant subjects are of great biological interest whether they are directly implicated in trans fashion in muscle and adipose tissues or are implicated through downstream effects of other transcripts targeted in cis by T2D/GT SNPs in β-cells. These findings illustrate well the value of using -omics tools to uncover biology relevant to complex phenotypes such as those involving T2D and glucose homeostasis; given how much we have to learn about how genetic risk factors actually alter risk for T2D, that value is hardly diminished if the effects are somewhat downstream of primary effects that we have not yet appreciated.
Although, as noted above, we recognize that the effects we observe may not be the primary way that T2D/GT SNPs alter risk of T2D, our results nevertheless suggest that we be cautious about making assumptions regarding the functional role of SNPs identified in GWASs as cis regulators of expression, and they raise the possibility that, at least for T2D and glucose homeostasis, many well-replicated SNPs may act, by unclear mechanisms, distally on the same chromosome or on different chromosomes. These findings have obvious implications for the design of follow-up studies for GWASs, which to date have largely focused on sequencing of local regions. Clearly, transcripts predicted by multiple independent associated SNPs are strong candidates for inclusion in such sequencing studies. These studies also raise the question of whether patterns of cis or trans transcript regulation are a key feature of the architecture of complex traits. Studies similar to these in other tissues, in larger samples, and for other diseases will be critical to answering this question and may be useful for understanding the genetic architecture of complex disease.
Acknowledgments
This work was supported by National Institutes of Health grants DK039311 (S.C.E. and S.K.D.), DK80327 (P.A.K.), DK71349 (P.A.K.), U01 HL084715 (N.J.C.), P60 DK20595 (N.J.C.), U01 DK085501 (N.J.C.), U01 GM61393 (N.J.C.), R01 MH090937 (N.J.C.); VA merit grant (N.R.); a generous grant from the Sturgis Foundation to the University of Arkansas for Medical Sciences (UAMS); and the Research Service of the Department of Veterans Affairs. The project was supported in part by award number 1UL1RR029884 to UAMS from the National Center for Research Resources. We thank the dedicated staff of the Clinical Research Center at UAMS for support of the clinical studies and assistance with data management. We also acknowledge technical assistance from Neeraj K. Sharma and Kurt A. Langberg for the extraction, quality control, and management of DNA and RNA samples used in this study.
Supplemental Data
Web Resources
The URLs for data presented herein are as follows:
SCAN, http://www.scandb.org
Online Mendelian Inheritance in Man (OMIM), http://www.omim.org
Accession Numbers
The Gene Expression Omnibus accession numbers for the gene expression data in this paper are the previously reported GSE7761 (LCL) and GSE26106 (liver) and the previously unreported GSE40234 (adipose and muscle).
References
- 1.Prokopenko I., Langenberg C., Florez J.C., Saxena R., Soranzo N., Thorleifsson G., Loos R.J., Manning A.K., Jackson A.U., Aulchenko Y. Variants in MTNR1B influence fasting glucose levels. Nat. Genet. 2009;41:77–81. doi: 10.1038/ng.290. [DOI] [PMC free article] [PubMed] [Google Scholar]
- 2.Dupuis J., Langenberg C., Prokopenko I., Saxena R., Soranzo N., Jackson A.U., Wheeler E., Glazer N.L., Bouatia-Naji N., Gloyn A.L., DIAGRAM Consortium. GIANT Consortium. Global BPgen Consortium. Anders Hamsten on behalf of Procardis Consortium. MAGIC investigators New genetic loci implicated in fasting glucose homeostasis and their impact on type 2 diabetes risk. Nat. Genet. 2010;42:105–116. doi: 10.1038/ng.520. [DOI] [PMC free article] [PubMed] [Google Scholar]
- 3.Saxena R., Hivert M.F., Langenberg C., Tanaka T., Pankow J.S., Vollenweider P., Lyssenko V., Bouatia-Naji N., Dupuis J., Jackson A.U., GIANT consortium. MAGIC investigators Genetic variation in GIPR influences the glucose and insulin responses to an oral glucose challenge. Nat. Genet. 2010;42:142–148. doi: 10.1038/ng.521. [DOI] [PMC free article] [PubMed] [Google Scholar]
- 4.De Silva N.M., Frayling T.M. Novel biological insights emerging from genetic studies of type 2 diabetes and related metabolic traits. Curr. Opin. Lipidol. 2010;21:44–50. doi: 10.1097/MOL.0b013e328334fdb6. [DOI] [PubMed] [Google Scholar]
- 5.Staiger H., Machicao F., Fritsche A., Häring H.U. Pathomechanisms of type 2 diabetes genes. Endocr. Rev. 2009;30:557–585. doi: 10.1210/er.2009-0017. [DOI] [PubMed] [Google Scholar]
- 6.Wu Y., Li H., Loos R.J., Yu Z., Ye X., Chen L., Pan A., Hu F.B., Lin X. Common variants in CDKAL1, CDKN2A/B, IGF2BP2, SLC30A8, and HHEX/IDE genes are associated with type 2 diabetes and impaired fasting glucose in a Chinese Han population. Diabetes. 2008;57:2834–2842. doi: 10.2337/db08-0047. [DOI] [PMC free article] [PubMed] [Google Scholar]
- 7.Florez J.C. Newly identified loci highlight beta cell dysfunction as a key cause of type 2 diabetes: where are the insulin resistance genes? Diabetologia. 2008;51:1100–1110. doi: 10.1007/s00125-008-1025-9. [DOI] [PubMed] [Google Scholar]
- 8.Schadt E.E., Molony C., Chudin E., Hao K., Yang X., Lum P.Y., Kasarskis A., Zhang B., Wang S., Suver C. Mapping the genetic architecture of gene expression in human liver. PLoS Biol. 2008;6:e107. doi: 10.1371/journal.pbio.0060107. [DOI] [PMC free article] [PubMed] [Google Scholar]
- 9.Emilsson V., Thorleifsson G., Zhang B., Leonardson A.S., Zink F., Zhu J., Carlson S., Helgason A., Walters G.B., Gunnarsdottir S. Genetics of gene expression and its effect on disease. Nature. 2008;452:423–428. doi: 10.1038/nature06758. [DOI] [PubMed] [Google Scholar]
- 10.Dubois P.C., Trynka G., Franke L., Hunt K.A., Romanos J., Curtotti A., Zhernakova A., Heap G.A., Adány R., Aromaa A. Multiple common variants for celiac disease influencing immune gene expression. Nat. Genet. 2010;42:295–302. doi: 10.1038/ng.543. [DOI] [PMC free article] [PubMed] [Google Scholar]
- 11.Nicolae D.L., Gamazon E., Zhang W., Duan S., Dolan M.E., Cox N.J. Trait-associated SNPs are more likely to be eQTLs: annotation to enhance discovery from GWAS. PLoS Genet. 2010;6:e1000888. doi: 10.1371/journal.pgen.1000888. [DOI] [PMC free article] [PubMed] [Google Scholar]
- 12.Nica A.C., Montgomery S.B., Dimas A.S., Stranger B.E., Beazley C., Barroso I., Dermitzakis E.T. Candidate causal regulatory effects by integration of expression QTLs with complex trait genetic associations. PLoS Genet. 2010;6:e1000895. doi: 10.1371/journal.pgen.1000895. [DOI] [PMC free article] [PubMed] [Google Scholar]
- 13.Zeggini E., Scott L.J., Saxena R., Voight B.F., Marchini J.L., Hu T., de Bakker P.I., Abecasis G.R., Almgren P., Andersen G., Wellcome Trust Case Control Consortium Meta-analysis of genome-wide association data and large-scale replication identifies additional susceptibility loci for type 2 diabetes. Nat. Genet. 2008;40:638–645. doi: 10.1038/ng.120. [DOI] [PMC free article] [PubMed] [Google Scholar]
- 14.Elbein S.C., Kern P.A., Rasouli N., Yao-Borengasser A., Sharma N.K., Das S.K. Global gene expression profiles of subcutaneous adipose and muscle from glucose-tolerant, insulin-sensitive, and insulin-resistant individuals matched for BMI. Diabetes. 2011;60:1019–1029. doi: 10.2337/db10-1270. [DOI] [PMC free article] [PubMed] [Google Scholar]
- 15.Tusher V.G., Tibshirani R., Chu G. Significance analysis of microarrays applied to the ionizing radiation response. Proc. Natl. Acad. Sci. USA. 2001;98:5116–5121. doi: 10.1073/pnas.091062498. [DOI] [PMC free article] [PubMed] [Google Scholar]
- 16.Innocenti F., Cooper G.M., Stanaway I.B., Gamazon E.R., Smith J.D., Mirkov S., Ramirez J., Liu W., Lin Y.S., Moloney C. Identification, replication, and functional fine-mapping of expression quantitative trait loci in primary human liver tissue. PLoS Genet. 2011;7:e1002078. doi: 10.1371/journal.pgen.1002078. [DOI] [PMC free article] [PubMed] [Google Scholar]
- 17.Gamazon E.R., Huang R.S., Cox N.J., Dolan M.E. Chemotherapeutic drug susceptibility associated SNPs are enriched in expression quantitative trait loci. Proc. Natl. Acad. Sci. USA. 2010;107:9287–9292. doi: 10.1073/pnas.1001827107. [DOI] [PMC free article] [PubMed] [Google Scholar]
- 18.Sherry S.T., Ward M.H., Kholodov M., Baker J., Phan L., Smigielski E.M., Sirotkin K. dbSNP: the NCBI database of genetic variation. Nucleic Acids Res. 2001;29:308–311. doi: 10.1093/nar/29.1.308. [DOI] [PMC free article] [PubMed] [Google Scholar]
- 19.Price A.L., Patterson N.J., Plenge R.M., Weinblatt M.E., Shadick N.A., Reich D. Principal components analysis corrects for stratification in genome-wide association studies. Nat. Genet. 2006;38:904–909. doi: 10.1038/ng1847. [DOI] [PubMed] [Google Scholar]
- 20.Bouatia-Naji N., Bonnefond A., Cavalcanti-Proença C., Sparsø T., Holmkvist J., Marchand M., Delplanque J., Lobbens S., Rocheleau G., Durand E. A variant near MTNR1B is associated with increased fasting plasma glucose levels and type 2 diabetes risk. Nat. Genet. 2009;41:89–94. doi: 10.1038/ng.277. [DOI] [PubMed] [Google Scholar]
- 21.Lyssenko V., Nagorny C.L., Erdos M.R., Wierup N., Jonsson A., Spégel P., Bugliani M., Saxena R., Fex M., Pulizzi N. Common variant in MTNR1B associated with increased risk of type 2 diabetes and impaired early insulin secretion. Nat. Genet. 2009;41:82–88. doi: 10.1038/ng.288. [DOI] [PMC free article] [PubMed] [Google Scholar]
- 22.Chambers J.C., Zhang W., Zabaneh D., Sehmi J., Jain P., McCarthy M.I., Froguel P., Ruokonen A., Balding D., Jarvelin M.R. Common genetic variation near melatonin receptor MTNR1B contributes to raised plasma glucose and increased risk of type 2 diabetes among Indian Asians and European Caucasians. Diabetes. 2009;58:2703–2708. doi: 10.2337/db08-1805. [DOI] [PMC free article] [PubMed] [Google Scholar]
- 23.Rung J., Cauchi S., Albrechtsen A., Shen L., Rocheleau G., Cavalcanti-Proença C., Bacot F., Balkau B., Belisle A., Borch-Johnsen K. Genetic variant near IRS1 is associated with type 2 diabetes, insulin resistance and hyperinsulinemia. Nat. Genet. 2009;41:1110–1115. doi: 10.1038/ng.443. [DOI] [PubMed] [Google Scholar]
- 24.Gamazon E.R., Zhang W., Konkashbaev A., Duan S., Kistner E.O., Nicolae D.L., Dolan M.E., Cox N.J. SCAN: SNP and copy number annotation. Bioinformatics. 2010;26:259–262. doi: 10.1093/bioinformatics/btp644. [DOI] [PMC free article] [PubMed] [Google Scholar]
- 25.Li Y., Willer C.J., Ding J., Scheet P., Abecasis G.R. MaCH: using sequence and genotype data to estimate haplotypes and unobserved genotypes. Genet. Epidemiol. 2010;34:816–834. doi: 10.1002/gepi.20533. [DOI] [PMC free article] [PubMed] [Google Scholar]
- 26.Veyrieras J.B., Kudaravalli S., Kim S.Y., Dermitzakis E.T., Gilad Y., Stephens M., Pritchard J.K. High-resolution mapping of expression-QTLs yields insight into human gene regulation. PLoS Genet. 2008;4:e1000214. doi: 10.1371/journal.pgen.1000214. [DOI] [PMC free article] [PubMed] [Google Scholar]
- 27.Stegle O., Parts L., Piipari M., Winn J., Durbin R. Using probabilistic estimation of expression residuals (PEER) to obtain increased power and interpretability of gene expression analyses. Nat. Protoc. 2012;7:500–507. doi: 10.1038/nprot.2011.457. [DOI] [PMC free article] [PubMed] [Google Scholar]
- 28.Purcell S., Neale B., Todd-Brown K., Thomas L., Ferreira M.A., Bender D., Maller J., Sklar P., de Bakker P.I., Daly M.J., Sham P.C. PLINK: a tool set for whole-genome association and population-based linkage analyses. Am. J. Hum. Genet. 2007;81:559–575. doi: 10.1086/519795. [DOI] [PMC free article] [PubMed] [Google Scholar]
- 29.Wellcome Trust Case Control Consortium Genome-wide association study of 14,000 cases of seven common diseases and 3,000 shared controls. Nature. 2007;447:661–678. doi: 10.1038/nature05911. [DOI] [PMC free article] [PubMed] [Google Scholar]
- 30.Below J.E., Gamazon E.R., Morrison J.V., Konkashbaev A., Pluzhnikov A., McKeigue P.M., Parra E.J., Elbein S.C., Hallman D.M., Nicolae D.L. Genome-wide association and meta-analysis in populations from Starr County, Texas, and Mexico City identify type 2 diabetes susceptibility loci and enrichment for expression quantitative trait loci in top signals. Diabetologia. 2011;54:2047–2055. doi: 10.1007/s00125-011-2188-3. [DOI] [PMC free article] [PubMed] [Google Scholar]
- 31.Storey J.D., Tibshirani R. Statistical significance for genomewide studies. Proc. Natl. Acad. Sci. USA. 2003;100:9440–9445. doi: 10.1073/pnas.1530509100. [DOI] [PMC free article] [PubMed] [Google Scholar]
- 32.White P., May C.L., Lamounier R.N., Brestelli J.E., Kaestner K.H. Defining pancreatic endocrine precursors and their descendants. Diabetes. 2008;57:654–668. doi: 10.2337/db07-1362. [DOI] [PubMed] [Google Scholar]
- 33.Gaulton K.J., Nammo T., Pasquali L., Simon J.M., Giresi P.G., Fogarty M.P., Panhuis T.M., Mieczkowski P., Secchi A., Bosco D. A map of open chromatin in human pancreatic islets. Nat. Genet. 2010;42:255–259. doi: 10.1038/ng.530. [DOI] [PMC free article] [PubMed] [Google Scholar]
- 34.Kutlu B., Burdick D., Baxter D., Rasschaert J., Flamez D., Eizirik D.L., Welsh N., Goodman N., Hood L. Detailed transcriptome atlas of the pancreatic beta cell. BMC Med. Genomics. 2009;2:3. doi: 10.1186/1755-8794-2-3. [DOI] [PMC free article] [PubMed] [Google Scholar]
- 35.Salonen J.T., Uimari P., Aalto J.M., Pirskanen M., Kaikkonen J., Todorova B., Hyppönen J., Korhonen V.P., Asikainen J., Devine C. Type 2 diabetes whole-genome association study in four populations: the DiaGen consortium. Am. J. Hum. Genet. 2007;81:338–345. doi: 10.1086/520599. [DOI] [PMC free article] [PubMed] [Google Scholar]
- 36.Zhong H., Yang X., Kaplan L.M., Molony C., Schadt E.E. Integrating pathway analysis and genetics of gene expression for genome-wide association studies. Am. J. Hum. Genet. 2010;86:581–591. doi: 10.1016/j.ajhg.2010.02.020. [DOI] [PMC free article] [PubMed] [Google Scholar]
- 37.Zhong H., Beaulaurier J., Lum P.Y., Molony C., Yang X., Macneil D.J., Weingarth D.T., Zhang B., Greenawalt D., Dobrin R. Liver and adipose expression associated SNPs are enriched for association to type 2 diabetes. PLoS Genet. 2010;6:e1000932. doi: 10.1371/journal.pgen.1000932. [DOI] [PMC free article] [PubMed] [Google Scholar]
- 38.Perry J.R., McCarthy M.I., Hattersley A.T., Zeggini E., Weedon M.N., Frayling T.M., Wellcome Trust Case Control Consortium Interrogating type 2 diabetes genome-wide association data using a biological pathway-based approach. Diabetes. 2009;58:1463–1467. doi: 10.2337/db08-1378. [DOI] [PMC free article] [PubMed] [Google Scholar]
- 39.Parikh H., Lyssenko V., Groop L.C. Prioritizing genes for follow-up from genome wide association studies using information on gene expression in tissues relevant for type 2 diabetes mellitus. BMC Med. Genomics. 2009;2:72. doi: 10.1186/1755-8794-2-72. [DOI] [PMC free article] [PubMed] [Google Scholar]
Associated Data
This section collects any data citations, data availability statements, or supplementary materials included in this article.